evaluation of soil-reinforcement interaction by large...
TRANSCRIPT
TRANSPORTATION RESEARCH RECORD 1188
Evaluation of Soil-Reinforcement Interaction by Large-Scale Pull-Out Tests
C. BoNczKrnw1cz, B. R. CHRISTOPHER, AND D. K. ATMATZIDIS
Pull-out tests were conducted to evaluate soil-reinforcement interaction for various types of geotextiles and geogrids under varying normal load and soil conditions. All tests were performed using a 4.4 ft x 2.3 ft x 1.5 ft pull-out box and consistent test procedures. Iterative strain measurements were made using wire extensometers mounted along the length of the material to evaluate in-soil strain response and stress transfer. In all, 10 different reinforcement materials were evaluated, including slit-film and coarse woven geotextiles, needle-punched and heat-bonded nonwoven geotextiles, and two types of geogrid. In addition, comparative results were obtained for metal and fiber strip reinforcements. Pull-out resistance was reported as a function of applied normal load. Soil-reinforcement resistance coefficients were found by several methods and are presented as shear stress versus normal stress plots. Load transfer behavior is discussed in terms of observed stress-strain behavior.
Soil reinforcement with geosynthetics has been practiced for about two decades, and substantial research has been conducted to evaluate the interaction between soils and geosynthetic reinforcement in order to determine resistance of the material to sliding. Until now it has been difficult to compare various methods of evaluating sliding resistance because of inconsistencies among test methods, equipment, and interpretive methods. To alleviate this situation, large-scale pull-out tests were performed as part of an extensive laboratory and field investigation of reinforced soil behavior.
The study, sponsored by the FHW A, included reinforcement materials representing all types currently available. The portion of the results concerning geosynthetics and strip reinforcements is presented here.
Using a uniform pull-out test procedure, pull-out resistance and coefficient of resistance were found for 10 types of reinforcement. The materials included geotextiles, geogrids, and strip-type reinforcements. A series of tests was performed at varying normal stresses using gravel, sand, silt, and clay as the test medium.
Results are presented as plots of maximum pull-out resistance versus test normal stress. A soil-reinforcement resistance angle in sand was also determined for each type of reinforcement. Iterative strain information obtained
C. Bonczkiewicz, Northwestern University, Evanston , Ill. and STS Consultants Ltd., 111 Phingsten Road, Northbrook, Ill. B. R. Christopher, STS Consultants Ltd ., 111 Phingsten Road, Northbrook, Ill. D. K. Atmatzidis, Deportment of Civil Engineering, University of Patras, Patras, Greece.
during testing was used to examine different methods of evaluating this parameter. Examples of plots of maximum pull-out force versus embedment length and maximum shear stress versus normal stress are presented. Finally, an attempt to define the in-soil stress-strain response, along with the stress distribution in reinforcements during the pull-out test, is discussed.
BACKGROUND
Pull-out testing generally consists of measuring the force necessary to pull a specimen out of a soil mass. This force expressed per unit width of reinforcing material is commonly referred to as pull-out resistance. Pull-out stress is the force expressed per area of material.
Some researchers have concentrated on developing a method of obtaining a soil-reinforcement resistance coefficient (8), which could be used in the shear strength relation
T = n tan 8 (1)
where Tis shear (or pull-out) stress and n is normal stress . If the load distribution on the test material is unknown,
the pull-out force is often assumed to be evenly distributed over the total area of reinforcement. The total area coefficient (o) then is the slope of a maximum pull-out stress versus normal stress plot. Often this coefficient is approximated to be equal to 2
/3 <j>,0 ;1 (1) . Solomone et al. (2) presented another methodology for
obtaining a pull-out coefficient by finding an interaction parameter designated K, where K, was the slope of the relationship between a pull-out force and the mobilized embedded length of reinforcement. K, was related to a soil/reinforcement resistance angle 8 by
K,/2b = N tan o
where
b = reinforcement width, N = normal pressure, and K, = interaction parameter.
(2)
The stress distribution in extensible reinforcements during a pull-out test has been studied by several investigators who obtained deformation measurements along the length
2
TABLE 1 PULL-OUT TEST PROGRAM
Reinforcement Type Gravel Sand
Geotextiles Coarse woven Smooth woven 1,2,5 Needled nonwoven Heat-bonded nonwoven
Geo grids Extruded 1 x 1 Extruded 1 x 4 2,4,8 Welded 3 x 3 Welded 1.5 x 4 2,4,8
Strips Fiber Metal
5,10,15 1,2,5 1,5 4,2,5
3,4,6 2,4,8 3,4,6 2,4,8
5,15,37 5,15,37
N OTE: Values are normal stress used for test (psi) .
Silt Clay
2,5 5 5,15 5
15 5,15
5,15
of pull-out specimen . Most [3 - and R. D . H ltz , Laboratory tudie of R inforced Earth U ing a W vcn Pia. tic Material (unpubli hed technical report), October l 73] concluded !hat tre is maximum near the application point and decreases with some function to zero at or before the end of th pull-out sample.
One complication in determining the distribution of stresses is the apparent increase in stress-strain modulus of geo ynthetics with c nfinement. Loads up to twice the unc nfined strength values for nonwoven geotextile · were reported (J, 6, 7). Increased modulus values for woven geotextiles have also been found (8).
Because the analysis methods presented have been used on data from a variety of pull-out test procedures, comparison of the finding are limited. This study attempted to e mploy the latest equipment studies (9, 10) in the de ign of the pull-out box and the m dificalion of basic test procedures . The procedures used are described, and, because
TRANSPORT A Tf()N RESEARCH RECORD 1188
they were consistent throughout the test program, results can be compared.
EXPERIMENT AL INVESTIGATION
Throughout this test program, test conditions varied only with normal stress, soil type, and reinforcement type. A description of procedures and reinforcement conditions tested follows.
Test Program
The test program was developed to test a wide range of reinforcement materials under a wide range of test conditions. Most of the research was conducted with sandtype soil as the standard; some tests were performed in soils with larger and smaller grain sizes for comparison. Tests using a number of normal loads were performed with the same sample-soil combination to develop a relationship between maximum pull-out force and normal stress. The test program is given in Table 1.
Materials
Reinforcements
The reinforcing materials in this program included geotextiles, polymer grids, and two types of strips. Select physical characteristics are summarized in Table 2. All are considered extensible materials with the exception of the metal strips. The samples were oriented in their machine or warp direction for pull-out.
TABLE 2 PROPERTIES OF REINFORCEMENT MATERIALS
Tensile Strength"
Peak Strength (lb/in.)
Reinforcement Machine Cross Type Dir. Dir.
Geo textiles Coarse woven 569 459 Smooth woven 211 212 Needled nonwoven 108 104 Heat-bonded nonwoven 61 76
Geo grids Extruded 1 x 1 106 175 Extruded 1 x 4 424 57 Welded 3 x 3 271 170 Welded 1.5 x 4 553 225
Strips Fiber 3,300' Metal 7,200'
N OTE: Dash indicates not available or not applicable . "Tested according to ASTM D-4595. bTested according to ASTM D-1777.
Elongation at Max . Load (%)
Machine Cross Dir. Dir.
20 13 26 16 94 49 60 69
12 16 8 11 7
'From Geotechnical Fabrics Report (1986) or other manufacturers' literature
Thicknessb (in.)
0.06 0.03 0.11 0.024
0.04-0.1 0.06-0.2 0.01-0.08 0.01-0.08
0.14 0.2-0.3
Opening Size (in.)
0.023' 0.012' 0.005-0.007' 0.003'
1 x 1.5 0.9 x 4.4 3 x 3 1.5 x 4
Bonczkiewicz et al. 3
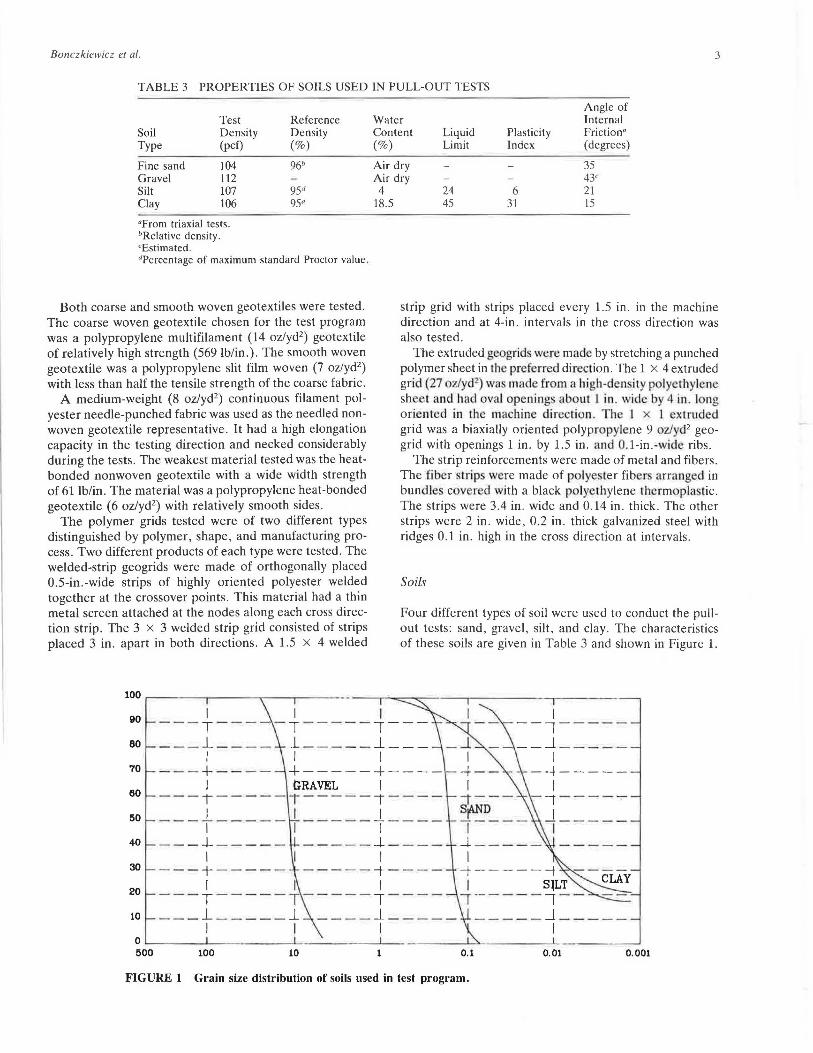
TABLE 3 PROPERTIES OF SOILS USED IN PULL-OUT TESTS
Test Reference Soil Density Density Type (pcf) (%)
Fine sand 104 96b Gravel 112 Silt 107 95d Clay 106 95d
"From triaxial tests. bRelative density . <Estimated. "Percentage of maximum standard Proctor value .
Both coarse and smooth woven geotextiles were tested. The coarse woven geotextile chosen for the test program was a polypropylene multifilament (14 oz/yd2
) geotextile of relatively high strength (569 lb/in.). The smooth woven geotextile was a polypropylene slit film woven (7 oz/yd2
)
with less than half the tensile strength of the coarse fabric. A medium-weight (8 oz/yd2
) continuous filament polyester needle-punched fabric was used as the needled nonwoven geotextile representative. It had a high elongation capacity in the testing direction and necked considerably during the tests. The weakest material tested was the heatbonded nonwoven geotextile with a wide width strength of 61 lb/in. The material was a polypropylene heat-bonded geotextile (6 oz/yd2
) with relatively smooth sides. The polymer grids tested were of two different types
distinguished by polymer, shape, and manufacturing process. Two different products of each type were tested. The welded-strip geogrids were made of orthogonally placed 0.5-in.-wide strips of highly oriented polyester welded together at the crossover points. This material had a thin metal screen attached at the nodes along each cross direction strip. The 3 x 3 welded strip grid consisted of strips placed 3 in. apart in both directions. A 1.5 x 4 welded
Water Angle of Internal Friction" (degrees)
Content Liquid Plasticity (%) Limit Index
Air dry 35 43• 21 15
Air dry 4
18.5 24 6 45 31
strip grid with strips placed every 1.5 in . in the machine direction and at 4-in. intervals in the cross direction was also tested.
The extruded geogrids were made by stretching a punched polymer sheet in the preferred dir ction. The 1 x 4 extruded grid (27 oz/yd2) was made from a high-d n ity p ly thylene sheet and had oval openings ab ul 1 in. wide by 4 in . long ori nted in the machine direction . The I x l ex truded grid was a biaxially oriented polypropylene 9 oz/yd2 geogrid with openings 1 in. by 1.5 in. and .1-in.-wicle ribs.
The strip reinforcements were made of metal and fibers . The fiber strip were made of polye ter fib rs arranged in bundles covered with a black polyethylene 1hermopla ·tic. The strips were 3.4 in . wide and 0.14 in . thick . The other strips were 2 in. wide, 0.2 in . thick galvanized steel with ridges 0.1 in . high in the cross direction at intervals .
Soils
Four different types of soil were used to conduct the pullout tests: sand, gravel, silt, and clay. The characteristics of these soils are given in Table 3 and shown in Figure 1.
90 I I _ _ _ T ___ - T-----,--- --,-----80 - - - ~ -- -- i _ _ __ _ i___ -- --~ -----
' I I I I 70 --- +---- +-----+----- ~ -- -~-----
' GRAVEL I I I ---~-----~--- - - ~- -- - ~ --- -,-----
' I I SjAND I - --1-----,-----,---- , ---- ,-----60
50
40 ---+---- - ----- ~-- -- ~ -----' I I 30 __ _ T __ ___ ----- ~ - -- - ~-----~
I I I I S~LT - - - T - - - - -T- - - - - 1 - - - - l' -- - - - - 1--20
10 - - - ~ -----i __ __ i ___ _ _ -----~---- -! I I I
0 ~----'------~-----"--- -----'-~----'---------' 500 100 10 0.1 0.01 0.001
FIGURE 1 Grain size distribution of soils used in test program.

4
1. 48" 53"
CROSS SECT ION VIEW
FIGURE 2 Cross section of pull-out box.
Most of the tests were conducted with the soil identified as sand-a poorly graded Fontainebleu sand.
The gravel consisted of subrounded particles ranging in size from 0.75 in. to 0.2 in. with almost no sand or smallersized particles. The silt was slightly cohesive with a relatively high angle of internal friction (35 degrees). A lowplasticity silty clay was used as the fourth type of soil.
Equipment
The methodology for determining pull-out resistance was based on measurement of horizontal forces used in pullout of reinforcement materials embedded in aggregate in a large pull-out box.
The pull-out box (Figure 2), which was designed and built by STS Consultants Ltd., consisted of two 18-in. channel sections for sides , a bottom plate, a removable back wall, and a horizontally split door. Inside dimensions were
3" 11" II" II"
TRANSPORTATION RESEARCH RECORD 1188
1 53 x 27 x 18 in. (length x width x depth). A horizontal metal sleeve 6 in . long was located over the full width of the box in an attempt to decrease the horizontal stress near the door face during pull-out .
Pull-out was performed by a hydraulic cylinder mounted horizontally 40 in. in front of the door of the pull-out box. The cylinder was 0.5 in. above the bottom half of the door to allow a level pull of reinforcement placed on a 6.5-in . layer of aggregate. The ram was attached to the reinforcement sample and was retracted to provide the force for the test. Pull-out force was measured by a load cell attached between the reinforcement and the hydraulic ram.
The normal loads for the pull-out tests were supplied by inflating an air bag fitted in the pull-out box to act as a diaphragm. The bag was placed between a 0.2-in.-thick flexible metal plate, which rested on the aggregate, and the 0.55-in.-thick metal pull-out box cover plate. Two 3-in . H-sections were bolted across the width of the top of the box to provide a reaction for the cover plate. Constant
6"
-SECTION- -SECTION- -SECTION- -S
N ill II
27"
S.0 .JL
53"
FIGURE 3 Plan view and typical gauge placements.
Bonczkiewicz et al.
Q) u c: 0 +' Cf)
'(ij Q) L..
400
JOC
200
/ / *
/ /
/
* ---·· /-- coarS.!O!
5
,*--·,-· _ ....... smooth
E ' * 100 I ~needled ::::J E ·-x 0
~_.-
~· ~--------lheatbonded --(!""" ..........
E 0 ......... ~~~----'-~~~~~~~~~~~~~~~~~~----'-~~~~~
0 5 10 15
normal stress (lb/in2)
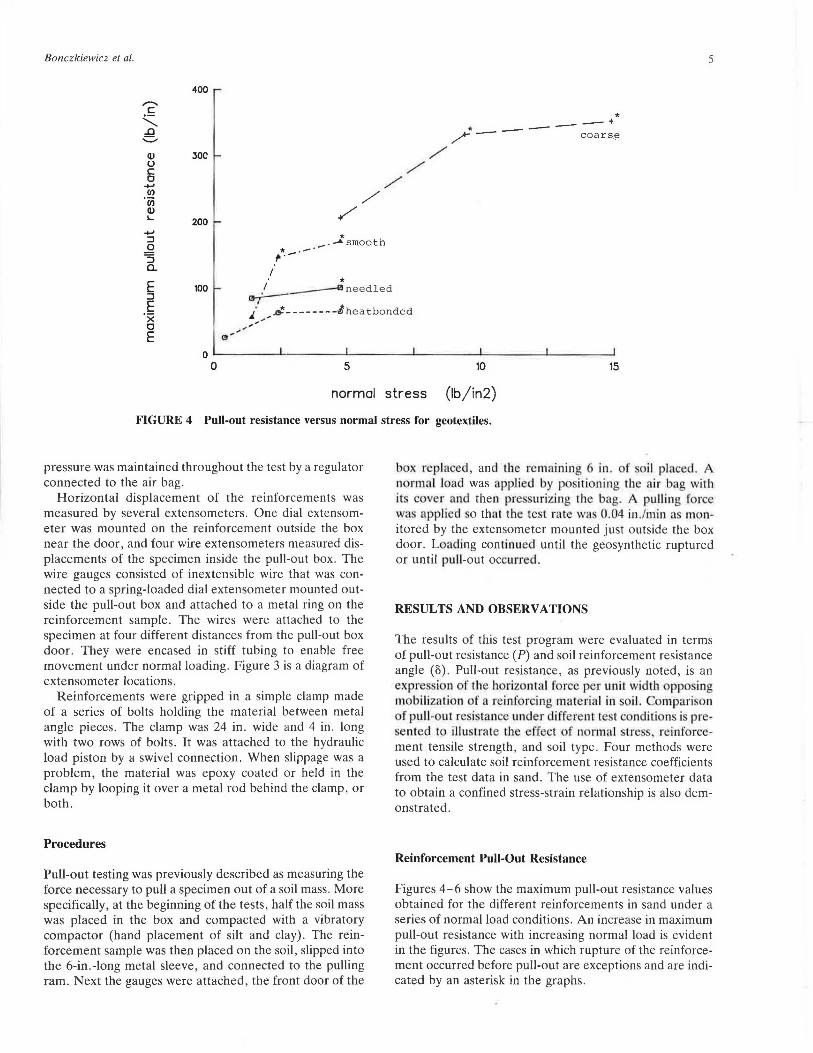
FIGURE 4 Pull-out resistance versus normal stress for geotextiles.
pressure was maintained throughout the test by a regulator connected to the air bag.
Horizontal displacement of the reinforcements was measured by several extensometers. One dial extensometer was mounted on the reinforcement outside the box near the door, and four wire extensometers measured displacements of the specimen inside the pull-out box . The wire gauges consisted of inextensible wire that was connected to a spring-loaded dial extensometer mounted outside the pull-out box and attached to a metal ring on the reinforcement sample. The wires were attached to the specimen at four different distances from the pull-out box door. They were encased in stiff tubing to enable free movement under normal loading . Figure 3 is a diagram of extensometer locations.
Reinforcements were gripped in a simple clamp made of a series of bolts holding the material between metal angle pieces. The clamp was 24 in. wide and 4 in. long with two rows of bolts. It was attached to the hydraulic load piston by a swivel connection. When slippage was a problem, the material was epoxy coated or held in the clamp by looping it over a metal rod behind the clamp, or both.
Procedures
Pull-out testing was previously described as measuring the force necessary to pull a specimen out of a soil mass. More specifically, at the beginning of the tests, half the soil mass was placed in the box and compacted with a vibratory compactor (hand placement of silt and clay). The reinforcement sample was then placed on the soil, slipped into the 6-in .-long metal sleeve, and connected to the pulling ram. Next the gauges were attached, the front door of the
box replaced, and the remaining 6 in . of oil plac d. A normal load was applied by po itioning the air bag with it cover and then pre ' urizing the bag. A pulling fo rce was app lied o that the test rate was 0.04 in ./min a monitored by the extensometer mounted just outside the box door. Loading continued until the geosynthetic ruptured or until pull-out occurred.
RESULTS AND OBSERVATIONS
The results of this test program were evaluated in terms of pull-out resistance (P) and soil reinforcement resistance angle (o). Pull-out resistance, as previously noted, is an expre i n of the horizontal force per unit width pposing mobilizati n of a reinforcing material in oil. Comparison of pull-out resi tance under cliff rent te ·1 c ndit.ions i presented to illu trnte the effect of normal tres . reinforcement tensile strength, and soil type. Four methods were used to calculate soil reinforcement resistance coefficients from the test data in sand. The use of extensometer data to obtain a confined stress-strain relationship is also demonstrated.
Reinforcement Pull-Out Resistance
Figures 4-6 show the maximum pull-out resistance values obtained for the different reinforcements in sand under a series of normal load conditions. An increase in maximum pull-out resistance with increasing normal load is evident in the figures. The cases in which rupture of the reinforcement occurred before pull-out are exceptions and are indicated by an asterisk in the graphs.
6 TRANSPORTATION RESEARCH RECORD 1188
400 ,,........ c:
" ..0 .::=-QJ u
~ extruded lx4
/ / welded 1. Sx4
/ JOO -
c: 0
+J CJ)
'iii QJ I...
/ / ,,, ,t!l*·we lded 3x3
I /~" , 200 +J ::J 0
~,/ C!I
::J 0.
E ::J
* * -·---.:.-.-·..£extruded lxl 100
E ·x 0 E
0 ,__~~~_..~~~~-'-~~~~_._~~~~..._~~~--'~~~~-'
0.00 2.50 5.00 7.50 10.00 12.50 15.00
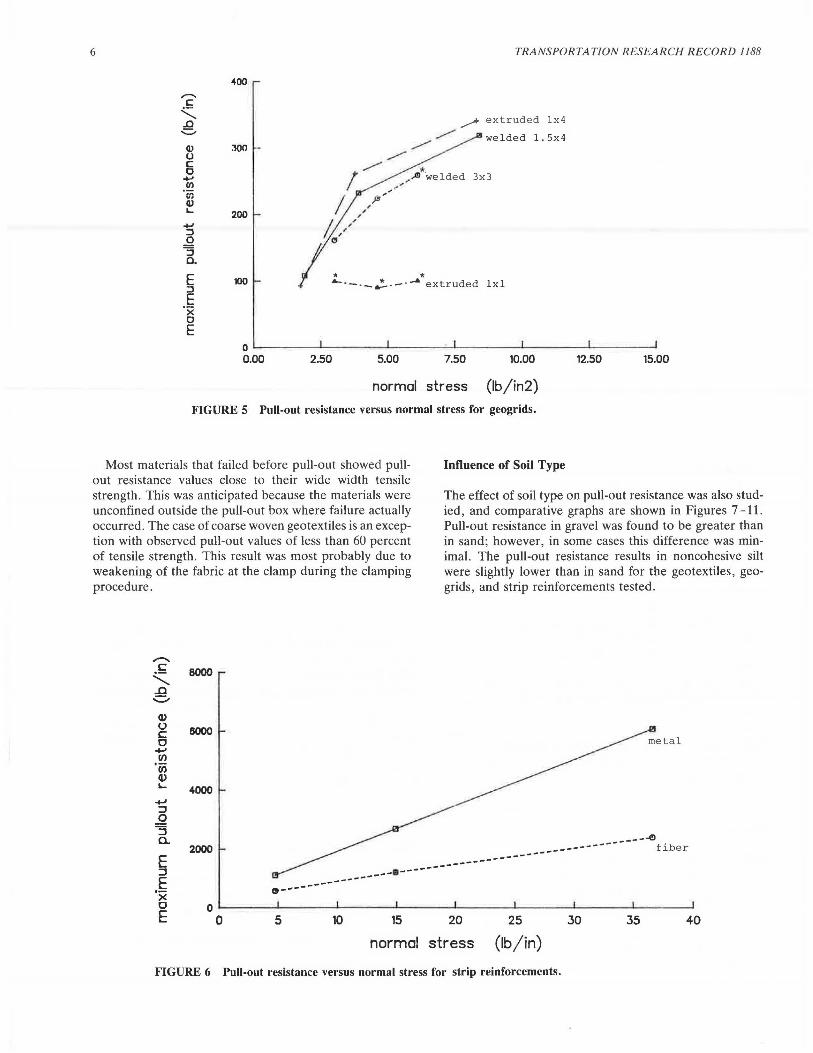
normal stress (lb/in2) FIGURE 5 Pull-out resistance versus normal stress for geogrids.
Most materials that failed before pull-out showed pullout resistance values close to their wide width tensile strength. This was anticipated because the materials were unconfined outside the pull-out box where failure actually occurred. The case of coarse woven geotextiles is an exception with observed pull-out values of less than 60 percent of tensile strength. This result was most probably due to weakening of the fabric at the clamp during the clamping procedure.
Influence of Soil Type
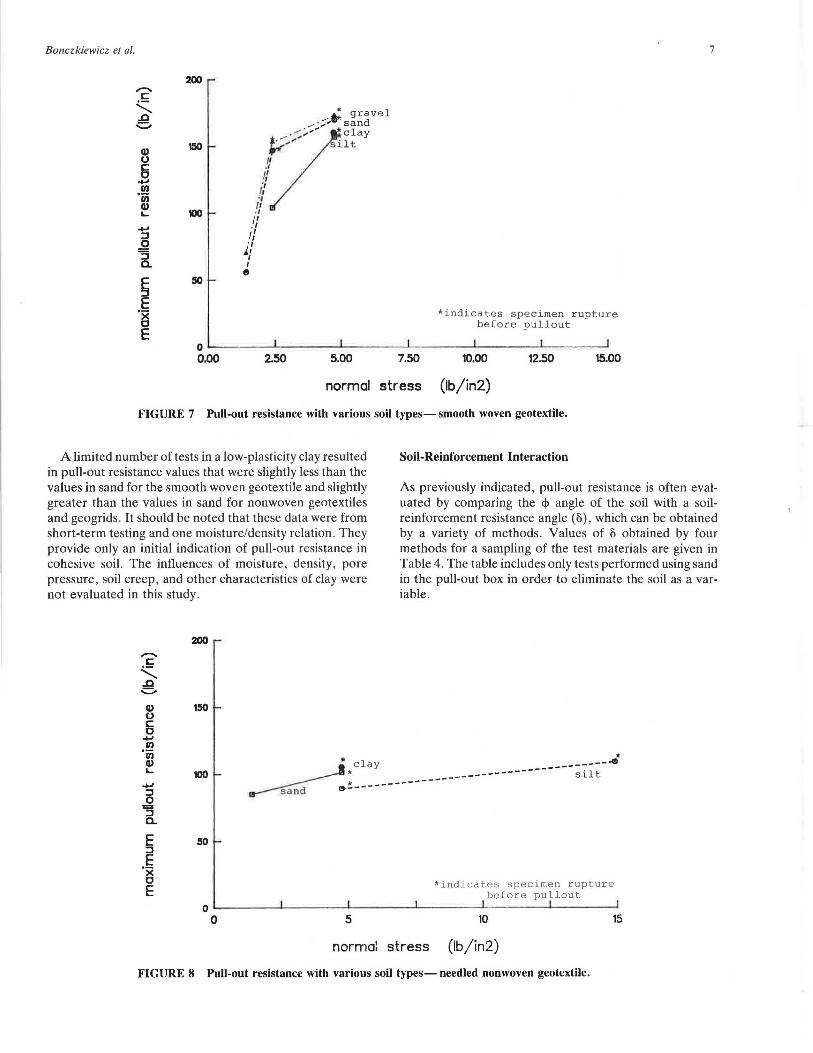
The effect of soil type on pull-out resistance was also studied, and comparative graphs are shown in Figures 7-11. Pull-out resistance in gravel was found to be greater than in sand; however, in some cases this difference was minimal. The pull-out resistance results in noncohesive silt were slightly lower than in sand for the geotextiles, geogrids, and strip reinforcements tested.
Q) 0 c: c
+-' rn ·u; Q) I...
+-' ::::J .Q
::::J a.
E ::::J E ·x c E
8000
6000
4000
2000
______ -C!)
------- fiber ---------------·-----------------------19---
0 ,__~~~..._~~~~~~~~~~~_..~~~~,__~~~_._~~~_,__~~~_.
0 5 10 15 20 25 30 35 40
normal stress (lb/in)
FIGURE 6 Pull-out resistance versus normal stress for strip reinforcements.
Bonczkiewicz et al.
Q) 0
a +J UJ .ii.i Q) L..
200
50
,; gravel
•·· ,.., 11t ,, ·' I' ·! /
.---;,-;'~ ~~f~~
,, ., /1 ,, ,,
,I
if ., J,.1
I I
e
*indicates specimen rupture before pullout
o--~~~--'~~~~~~~~~~~~~~~~~~~~~~~~
o.oo 2.50 5.00 7.50 10.00 12.50 15.00
normal stress (lb/in2)
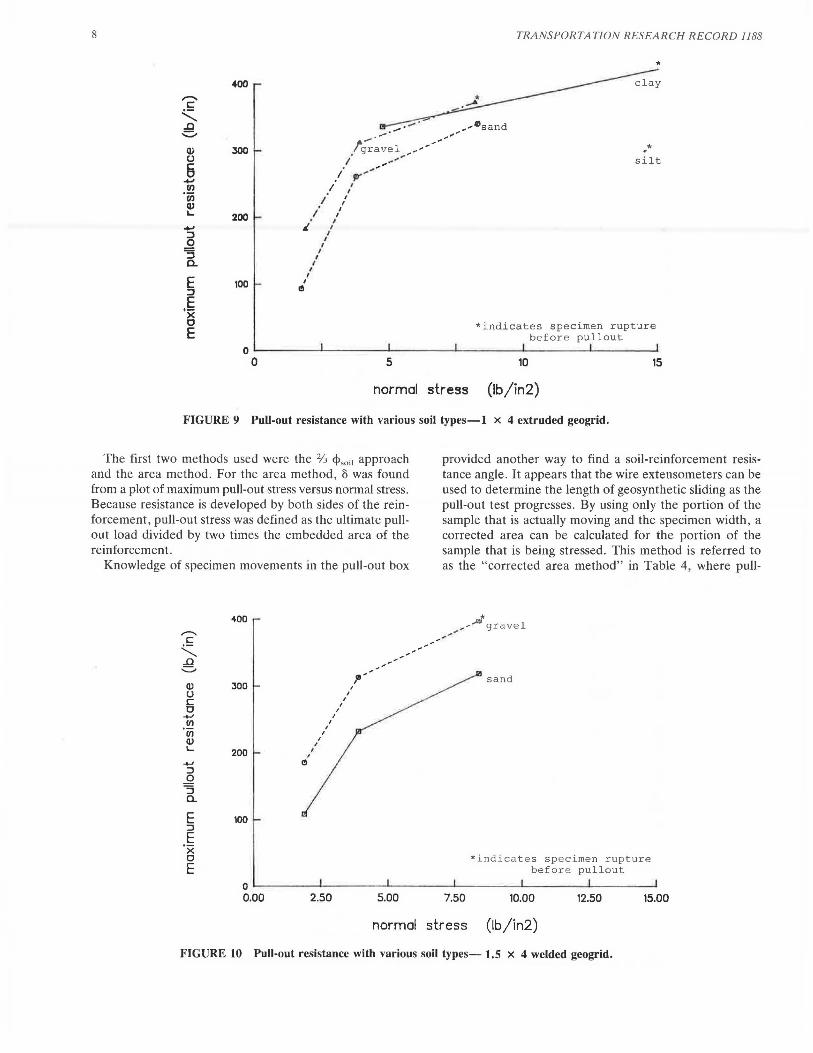
FIGURE 7 Pull-out resistance with various soil types- smooth woven geotextile.
Soil-Reinforcement Interaction
7
A limited number of tests in a low-plasticity clay resulted in pull-out resistance values that were slightly less than the values in sand for the smooth woven geotextile and slightly greater than the values in sand for nonwoven geotextiles and geogrids. It should be noted that these data were from short-term testing and one moisture/density relation. They provide only an initial indication of pull-out resistance in cohesive soil. The influences of moisture, density, pore pressure, soil creep, and other characteristics of clay were not evaluated in this study.
As previously indicated, pull-out resistance is often evaluated by comparing the cj> angle of the soil with a soilreinforcement resistance angle (8), which can be obtained by a variety of methods. Values of o obtained by four methods for a sampling of the test materials are given in Table 4. The table includes only tests performed using sand in the pull-out box in order to eliminate the soil as a variable.
Q) 0
6 +J UJ
'(i.j Q) L..
-+J :::i 0 :::i a.
E :::i E ·x 0 E
200
150
* * c lay -----------
4
* ------------ silt * _____ ... ______ _ &---
*indicates specimen rupture before pullout
0 '--~~~___.~~~~-->-~~~~-'-~~~~~~~~~~~~~~
0 5 10 15
normal stress (lb/in2)
FIGURE 8 Pull-out resistance with various soil types- needled nonwoven geotextile.
8
..., :J 0 = :J a.
E :J
.~ x 0 E
400
300
200
100
• I
I
TRANSPORTA TION RESEARCH RECORD 1188
*
•* s ilt
*indicate s s pecimen rupture bef ore pu l lout
0 ~-~~~~~~~-~~~~-~~~~~~~-~~~~~~---'
0 5 10 15
normal stress (lb/in2)
FIGURE 9 Pull-out resistance with various soil types-I x 4 extruded geogrid.
The first two methods used were the 2/ J <Psoir approach and the area method. For the area method, o was found from a plot of maximum pull-out stress versus normal stress. Because resistance is developed by both sides of the reinforcement, pull-out stress was defined as the ultimate pullout load divided by two times the embedded area of the reinforcement.
Knowledge of specimen movements in the pull-out box
(IJ u c: 0 _..., Ul
'(ij (IJ L
E :J
E ·x 0 E
400
300
200
100
I , e
I I
I I
I
I
I I
I
I ' 111''
'
provided another way to find a soil-reinforcement resistance angle. It appears that the wire extensometers can be used to determine the length of geosynthetic sliding as the pull-out test progresses. By using only the portion of the sample that is actually moving and the specimen width, a corrected area can be calculated for the portion of the sample that is being stressed. This method is referred to as the "corrected area method" in Table 4, where pull-
sand
*indicates specimen rupture be fore pullout
0 ....__---~'--~---'----~~'--~~~~'-----~'--~~~---'
0.00 2.50 5.00 7.50 10.00 12.50 15.00
normal stress (lb/in2)
FIGURE 10 Pull-out resistance with various soil types- 1.5 x 4 welded geogrid.
Bonczkiewicz et al.
Q) u c a
-+-' Cf)
·u; Q) \...
E ::J
E ·x
4000
JOOO
2000
1000 " _____ _ ---------I!-
..(9- -----0 silt
--- --- ------------- --
__ 0
------~and
*indicate s specimen rupture before pu ll o u t
9
a E
0 L-~~~-'-~~~~'--~~~-'-~~~~'--~~~ ........ ~~~~'--~~~~~~~~
0 5 10 15 20 30 35 40
normal stress
25
(lb/in2)
FIGURE 11 Pull-out resistance with various soil types- fiber strip reinforcement.
out stress is obtained from
Pull-out stress = ad to mobiliz reinforcement sectio.n
orrected area of ection x 2 (3)
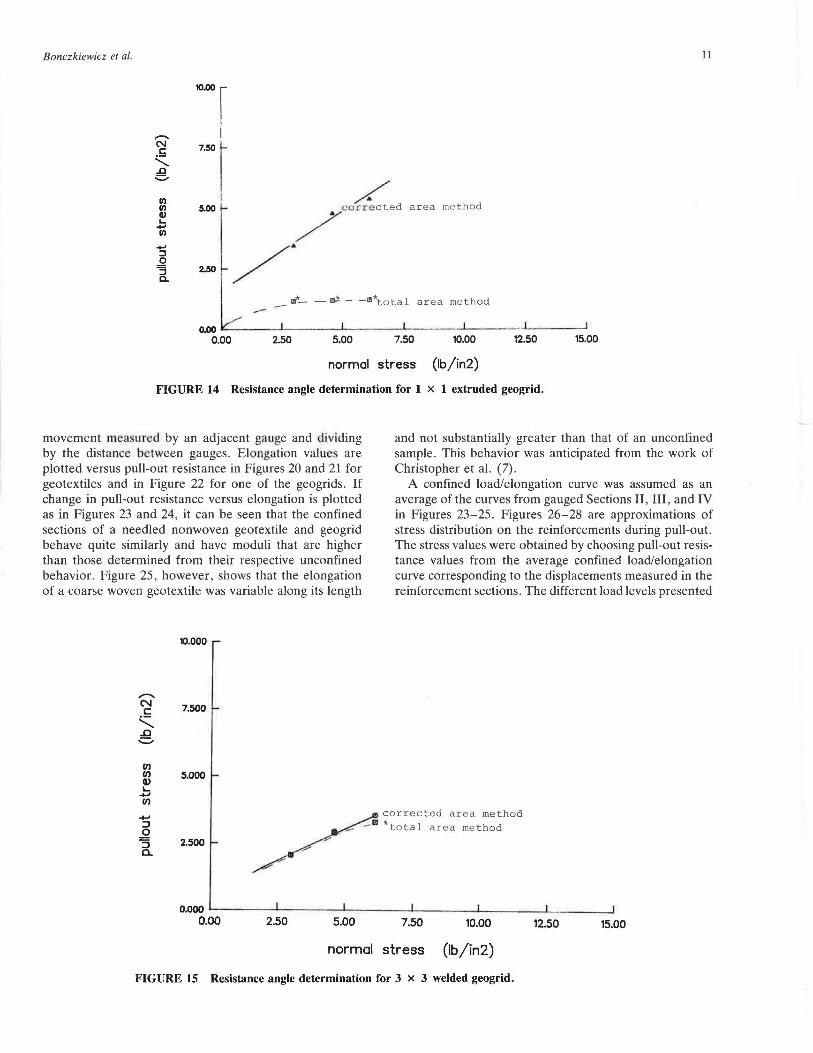
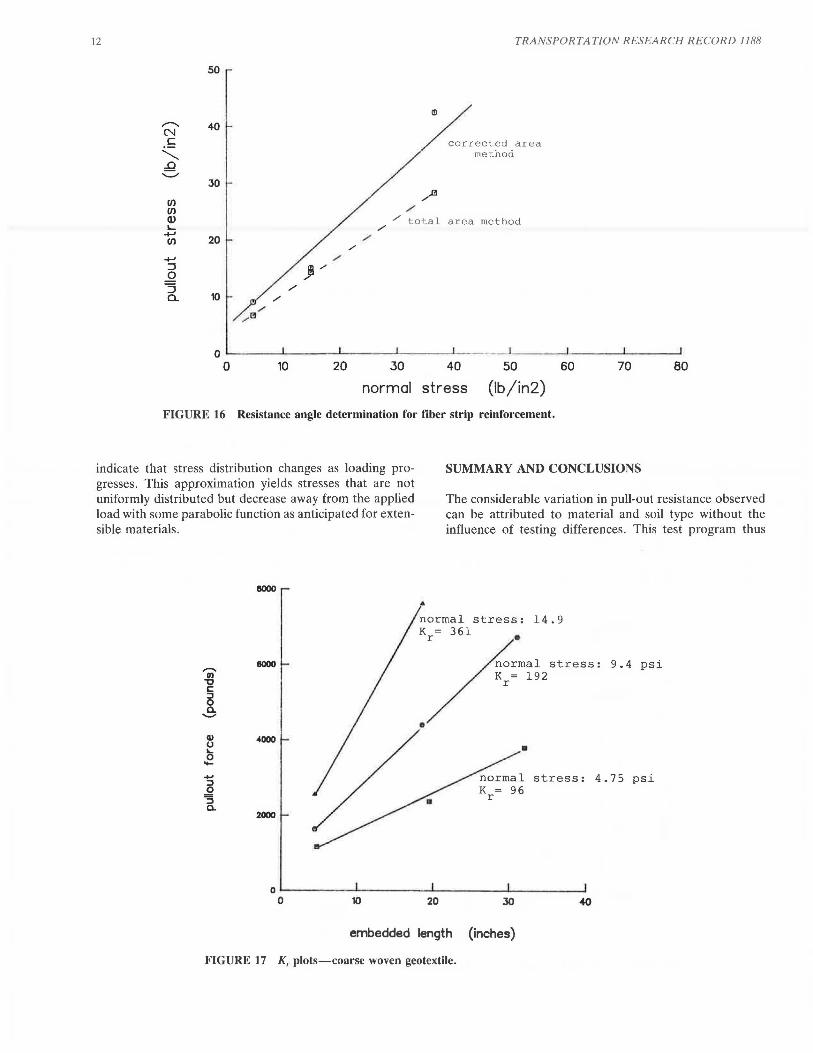
The pull-out stress versus normal stress relation was then used to determine a o angle. The values presented in Table 4 were found by using the wire gauge readings from Section II of Figure 3. For most extensible materials, o values determined by using this method were found to be greater than those determined previously with the area method, as shown in plots of shear stress versus normal stress (Figures 12-16) . A best fit line using the corrected area results implied a pseudo-cohesion intercept for the geogrid mate-
rials. This may be due to the bearing resistance provided by the cross members of these materials.
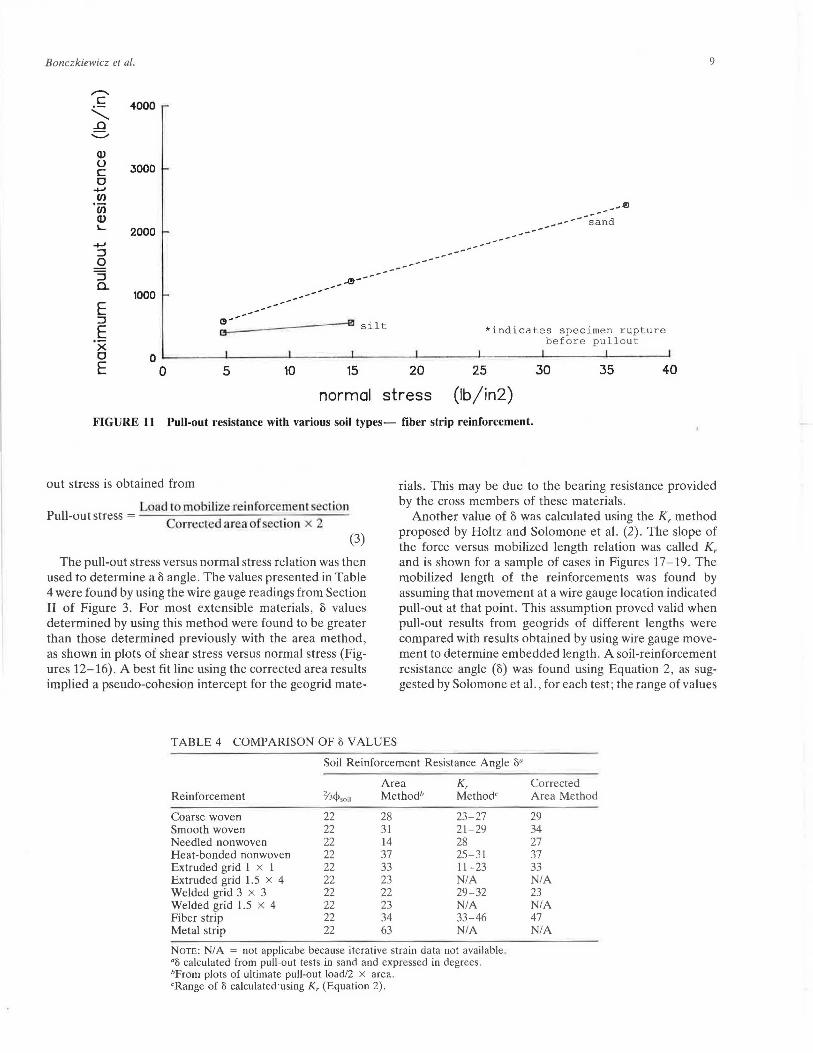
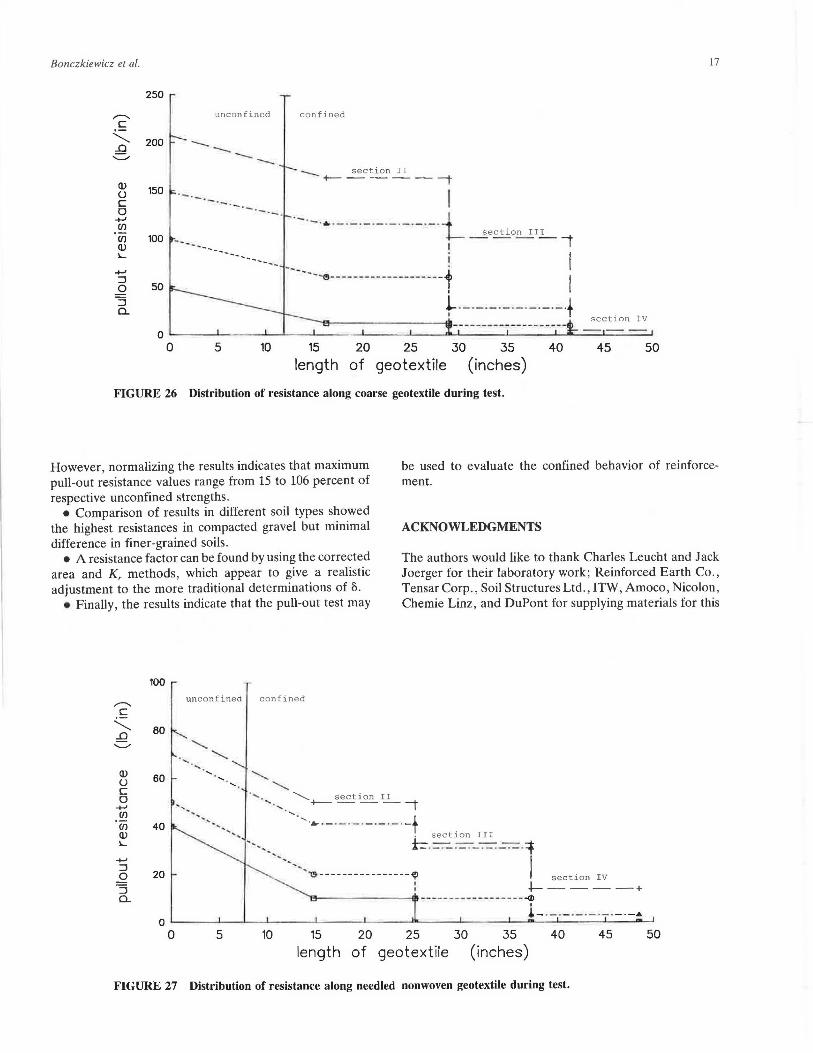
Another value of o was calculated using the K, method proposed by Holtz and Solomone et al. (2). The slope of the force versus mobilized length relation was called K, and is shown for a sample of cases in Figures 17-19. The mobilized length of the reinforcements was found by assuming that movement at a wire gauge location indicated pull-out at that point. This assumption proved valid when pull-out results from geogrids of different lengths were compared with results obtained by using wire gauge movement to determine embedded length. A soil-reinforcement resistance angle (o) was found using Equation 2, as suggested by Solomone et al. , for each test; the range of values
TABLE 4 COMPARISON OF 3 VALUES
Soil Reinforcement Resistance Angle 3"
Area K, Reinforcement 2
/3<t>soil Methodh Method'
Coarse woven 22 28 23-27 Smooth woven 22 31 21-29 Needled nonwoven 22 14 28 Heat-bonded nonwoven 22 37 25-31 Extruded grid 1 x 1 22 33 11-23 Extruded grid 1.5 x 4 22 23 NIA Welded grid 3 x 3 22 22 29-32 Welded grid 1.5 x 4 22 23 NIA Fiber strip 22 34 33-46 Metal strip 22 63 NIA
NOTE: N/A = not applicabe because iterative strain data not available. "15 calculated from pull-out tests in sand and expressed in degrees. hFrom plots of ultimate pull-out load/2 x area . cRange of 15 calculated·using K, (Equation 2) .
Corrected Area Method
29 34 27 37 33 NIA 23 NIA 47 NIA

10
UI UI Q)
b UI
TRANSPORTATION RESEARCH RECORD 1188
10.00
7.50
5.00
2.50
/ corrected area method
./ cl< -jt-- - -1!1 total area method
0.00 ------------------------------~ 0.00 2.50 5.00 7.50 10.00 12.50 15.00
normal stress (lb/in2)
FIGURE 12 Resistance angle determination for smooth woven geotextile.
is reported for each reinforcement in Table 4. These calculations assume no cohesion-type intercept.
The data in Table 4 indicate that it is possible to obtain a wide range of values for o depending on the method used. Comparisons of the corrected area and the Kr determination methods were limited because of the small number of extensometers on the specimens, which resulted in rough approximations for the corrected area and sliding areas. Inaccuracies in these coarse measurements may have affected the K, relation, which was not in all cases found to be linear as expected by Holtz. One limitation of the total area method was lack of valid data as the result of
10.00
,,-.... N 7.50 c
'--_Q .;::::/
C/l
test specimen failure. Also, many research results indicate that, in extensible materials, the total area is not uniformly stressed in the pull-out test as is assumed in the calculations.
Stress-Strain Behavior
Wire extensometers attached to the specimen allowed determination of stress on separate sections of reinforcement during the pull-out test. Strain was found by subtracting the movement measured at one location from the
corrected area method
C/l 5.00 (l) ..... +' C/l
+' :::J
_Q :; 2.50 /-~ -------r
* - - - -(?I
total area method
0..
0.00 "'-___ _.__ ________ _.__ ________ ~ ---~
0 2 5 7 10 12 15
normal stress (lb /in2)
FIGURE 13 Resistance angle determination for coarse woven geotextile.
Bonczkiewicz et al.
I/) I/)
cu .... ...., I/)
7.50
5.00
11
/ ~corrected area method
/ . _I!!- - ~ - -l!l*total area method -
nOOL-----L-----'-----'-----_,__ ___ _._ ___ __. 0.00 2.50 5.00 7.50 10.00 12.50 15.00
normal stress (lb/in2)
FIGURE 14 Resistance angle determination for I x 1 extruded geogrid.
movement measured by an adjacent gauge and dividing by the distance between gauges. Elongation values are plotted versus pull-out resistance in Figures 20 and 21 for geotextiles and in Figure 22 for one of the geogrids. If change in pull-out resistance versus elongation is plotted as in Figures 23 and 24, it can be seen that the confined sections of a needled nonwoven geotextile and geogrid behave quite similarly and have moduli that are higher than those determined from their respective unconfined behavior. Figure 25, however, shows that the elongation of a coarse woven geotextile was variable along its length
10.000
Ul ~ 5.000 "...., Cl)
and not substantially greater than that of an unconfined sample. This behavior was anticipated from the work of Christopher et al. (7).
A confined load/elongation curve was assumed as an average of the curves from gauged Sections II, III, and IV in Figures 23-25. Figures 26-28 are approximations of stress distribution on the reinforcements during pull-out. The stress values were obtained by choosing pull-out resistance values from the average confined load/elongation curve corresponding to the displacements measured in the reinforcement sections. The different load levels presented
2.500
~ /
corrected area method *total area method
,,,,..
"""
o.ooo ____ __.. ____ _._ ____ -l-___ _ J__ ___ __,L_ _ __ _J
0.00 2.50 5.00 7.50 10.00 12.50 15.00
normal stress (lb/in2)
FIGURE 15 Resistance angle determination for 3 x 3 welded geogrid.
12 TRANSPORTATION RESEARCH RECORD 1188
50
(!)
,........._ 40
N .~ corrected area "--. method ..0 ....._,
30
Ul ,...a
Ul / Q) ./ total area method I... ./
-+-' 20 / Ul /
-+-' / ::J J/ 0 ::J ./ a. 10
~/ /
0 ~~~~~~~~~~~~~~~~~~~~~~~~~-~~~~~~~
0 10 20 30 40
normal stress
50
(lb/in2) 60 70
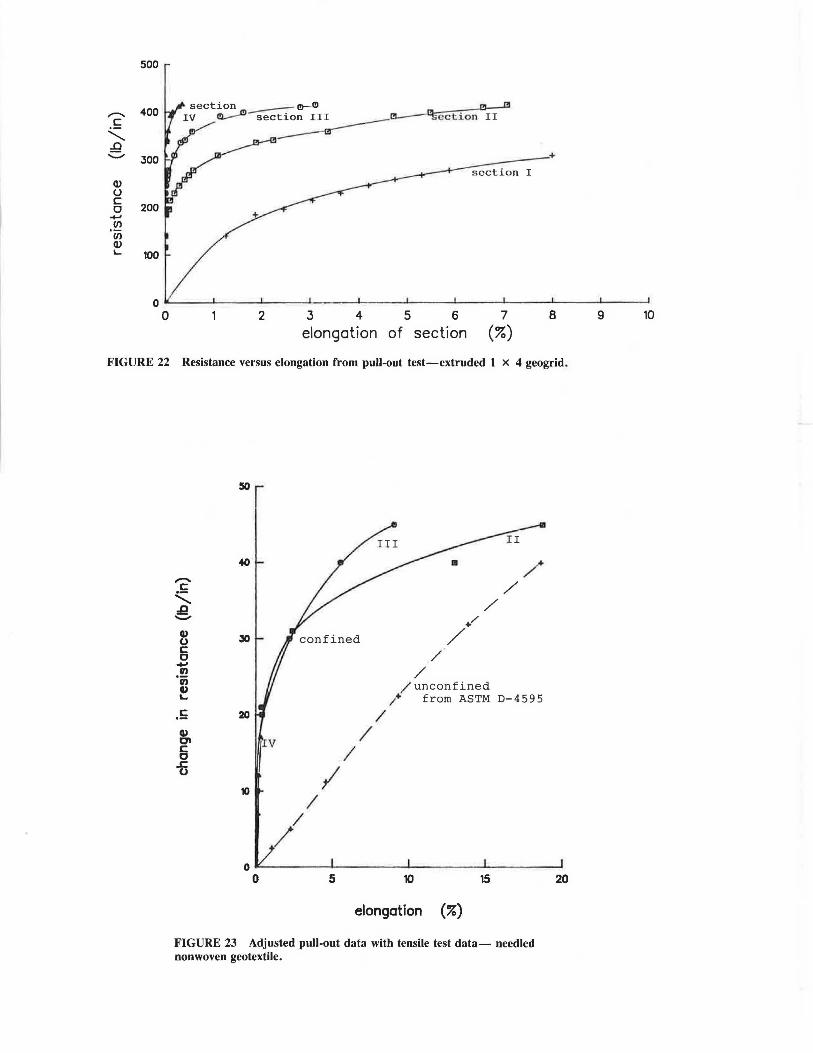
FIGURE 16 Resistance angle determination for fiber strip reinforcement.
SUMMARY AND CONCLUSIONS
80
indicate that stress distribution changes as loading progresses. This approximation yields stresses that are not uniformly distributed but decrease away from the applied load with some parabolic function as anticipated for extensible materials.
The considerable variation in pull-out resistance observed can be attributed to material and soil type without the influence of testing differences. This test program thus
llOOO
• 14.9
......... 8000 9.4 psi 0)
1J c ::I 0 a. -Cll -4000 0 • L. 0 -...., stress: 4.75 psi ::I 0 = ::I a.
2000
o~~~~~~~~~~~~~~~~-1--~~~~-'
0 10 20 30
embedded length (inches)
FIGURE 17 K, plots-coarse woven geotextile.

Bonczkiewicz et al. 13
8000
IOOCI normal stress: 6.1 psi ""'"' K = 285 llJ "'C r § 0 a. .........
CP 4000 u 4.6 psi
~ 0 -.... :::J stress: 3 psi 0
"5 a. 2000
o,__~~~~ ....... ~~~~~~-~~~~~~~~~~ 0 10 20 30 40
embedded length (inches)
FIGURE 18 K, plots-3 x 3 geogrid.
allowed pull-out resistance values for many types of reinforcement, soil media, and methods of analysis to be compared.
A formal discussion of some of the findings awaits further study and perhaps more testing. Nevertheless, several observations are apparent from the results presented .
llOOO
'Oi' -0 § 0 a. • ......,
• Uniform test procedures for all types of reinforcement facilitate comparisons, and standard procedures should be developed.
• Maximum pull-out resistance values varied from 26 to 352 lb/in. It is understood that much of this variability is due to the wide range of strengths of the materials tested .
stress: 36 psi
stress: 14.9 psi
stress : 4.75 psi
oL......~~~~-l-~~~~~'--~~~~-'-~~~~--'
0 10 20 30
embedded length (inches)
FIGURE 19 K, plots-fiber strip reinforcement.

250
.. __. section 200 section / III
IV /
"' ~ section II
section I
2 4 6 8
elongation of section (3 strain)
FIGURE 20 Resistance versus elongation from pull-out test-coarse woven geotextile.
llO
section I~_.----"'section III
// II
tO
5 10 15 20
elongation of section (")
FIGURE 21 Resistance versus elongation from pull-out test-needled nonwoven geotextile.
500
r--. 400 .£ ........... .0 .;::::,
JOO
Q) u c:
200 0 -en . iii Q) I... 100
0 0 2 3 4 5 6 7 8 9 10
elongation of section (%) FIGURE 22 Resistance versus elongation from pull-out test-extruded I x 4 geogrid.
40 / .......... / c
' / .e ........ / Cl> 30 / 0 c / 0 - / en ·a;
/unconfined Cl> L. / from ASTM D-4595 .5 20 /
Cl> / Cl c I 0 .s:.
I 0
10 I
/ 0
0 5 10 15 20
elongation (%)
FIGURE 23 Adjusted pull-out data with tensile test data- needled nonwoven geotextile. -

300
Ill
250
~ ~confined
........,. c '-.0 200 c.
Q) 0 c 0
.+J en ·a; Cl> ....
,£;
Q) OI c 0 .c. 0
150
IOO
50
.0 _,_.,,,/
~nfined / f-;;~-;;·ASTM D-4595
"l /
0 ~~~~ ........ ~~~~--~~~---~~~~--~~~---~~~---' 0.00 1.00 2.00 3.00 4.00 5.00 6.00
elongation (3)
FIGURE 24 Adjusted pull-out data with tensile test data- extruded 1 x 4 geogrid.
2:50
........,. 200 ,£; "-.. .0 I .;:::::..
(I) \SO 0 c 0
.+J en
'(jj Cl> ....
,£; 100
Q) OI c 0 .c 0 so D-4595
a 10
elongation (3)
FIGURE 25 Adjusted pull-out data with tensile test data- coarse woven geotextile.
Bonczkiewicz et al.
Q) 0 c 0 ...., (/)
Cl) Q) L
...., ::::I 0 :::J a.
250
unconfined confined
200 ---- --- sect i on II +-------t 150 ·-. -·-·- . -·- ·---100 ------
·- ·-· •·-·-·-·-·-·- ·- ·- ·j section III +-- - --1 ---------50
----- ! I --e--------------------t I
~ - - · -·- ·-· - · -·- · -·+ -------------41 section IV
0 ._ __ _._ _ _ __._ ..._ _ _._ __ __. ___ ..._~_,,._.. ___ .1-__ __._ ........ _-_--::cc-_-_-=:::~
0 5 10 15 20 25 30
length of geotextile 35
(inches) 40 45 50
FIGURE 26 Distribution of resistance along coarse geotextile during test.
17
However, normalizing the results indicates that maximum pull-out resistance values range from 15 to 106 percent of respective unconfined strengths.
be used to evaluate the confined behavior of reinforcement.
• Comparison of results in different soil types showed the highest resistances in compacted gravel but minimal difference in finer-grained soils.
ACKNOWLEDGMENTS
• A resistance factor can be found by using the corrected area and Kr methods, which appear to give a realistic adjustment to the more traditional determinations of f> .
• Finally, the results indicate that the pull-out test may
The authors would like to thank Charles Leucht and Jack Joerger for their laboratory work; Reinforced Earth Co., Tensar Corp., Soil Structures Ltd., ITW, Amoco, Nicol on, Chemie Linz, and DuPont for supplying materials for this
100 unconfined confined
80
Q) 60 0
c 0 ...., --(/) --• Cii 40 -----Q) --L
...., ::::I 0 20
·-..... .........._ section II ..... ....... +-----4" ..... ...... ..... __ ____ ____ ____ + . section III J.._---- -t ·-·-·-·- ·- ·- ·-·-· ·
I --
...................... '"G - -------- - ------~ section IV
"3 -i------+ a. "'R---- ----------------------- -<I>
i-·- ·-·-·-·-·-·-· 0 '------'---'---''-----'-----'---------'-----'--"'--'----'------~
0 5 10 15 20 25 30 35 40 45 50
length of geotextile (inches)
FIGURE 27 Distribution of resistance along needled nonwoven geotextile during test.

18 TRANSPORTATION RESEARCH RECORD 1188
500
400 ·- unconfined confined
JOO
·-. -·-·- ........ _. -·-... __ -. Q) u c 0
------ ·-...
....... en rn Q) L.
....... J 0 J 0..
---------------------200
100
------·- section II "6.-·-·-·-·-·-·-1
---·--e---------------G> : I
: I section IV : d>----- - - - -· - -1 !!>---------------- -~ I
I I I I I I
0 '--~~---L~~~-'-~~~..J-~~~'--~~--'~~~-'-~~ ........ ..J-~~~'--~--'L..1~~~~_...!..
0 5 10 15 20 25 30
(inches) 35 40 45
length of geogrid
FIGURE 28 Distribution of resistance along 1 x 4 geogrid during test.
study; and, especially, the Federal Highway Administration for their support.
REFERENCES
1. J. R. Steward, Williamson, and J. Mohney. Guidelines for Use of Fabrics in Construction and Maintenance of Low-Volume Roads. USDA Forest Service, Portland, Oreg., 1977.
2. W. G . Solomone, E . Boutrup , R. D. Holtz, W. D. Kovacs, and C. D. Sulton. Fabric Reinforcement Designed Against Pull-Out. The Use of Geotextiles for Soil Improvement, ASCE, Portland, Oreg., 1980, pp . 80-177.
3. D. Leshchinsky and D. A . Field. In-Soil Load Elongation, Tensile Strength and Interface of Nonwoven Geotextiles . Proc., Geosynthetic '87 Conference, New Orleans, La., April 1987, pp. 238-249.
4. W. H. Tzong and S. Cheng-Kuang. Soil-Geotextile Interaction Mechanism in Pull-Out Test. Proc., Geosynthetic '87 Conference, New Orleans, La., April 1987, pp . 250-259.
5. M. Al-Hussaini and E. B. Perry. Field Experiment of Reinforced F.arth Wall. Symposium on Earth Reinforcement , Pittsburgh, Pa., April 1978, pp. 127-156.
6. A. McGown, K. Z. Andrews, and M. H. Kabir. Load-Extension Testing of Geotextiles Confined in Soil. Proc., Second International Conference on Geotextiles , Las Vegas, Nev .. 1982, pp. 793-798.
7. B. R. Christopher, R. D. Holtz, and W. D. Bell. New Tests for Determining the In-Soil Stress-Strain Properties of Geotextiles. Third International Conference on Geotextiles , Vienna , Austria, 1986, pp. 683-688.
8. A. El-Fermaoui and E . Nowatzski. Effect of Confining Pressure on Performance of Geotextiles in Soils. Proc., Geosynthetic '87 Conference, New Orleans, La., April 1987, pp. 799-804.
9. R. Johnston. Pull-Out Testing of Tensar Geogrids. Master's thesis. University of California-Davis, June 1985.
IO. T . S. Ing Id . Lab rat ry Pull- ut Testing of Grid Reinforcement in and. Georech11ical Testing Joumal , Vol. 6. , No. 3, Sept. 1983, pp. 112-119.
Publication of this paper sponsored by Committee on Soil and Rock Properties.