evaluation of mechanical properties of a new warm-mix ... · evaluation of mechanical properties of...
TRANSCRIPT

Athens Journal of Technology & Engineering X Y
1
Evaluation of Mechanical Properties of a New
Warm-Mix Asphalt using Sylvaroad Additive
By Dai Xuan Lu
Mofreh Saleh‡
Warm mix asphalts (WMA) have been gradually becoming more popular in the
roading industry owing to their benefits compared to traditional hot mix asphalts
(HMA), such as lower energy consumption and lesser emissions. In this paper, the
authors investigated the performance of two WMA mixtures, using Evotherm and
Sylvaroad, and compared them with HMA. The experimental investigation
includes moisture susceptibility, fatigue cracking, rutting resistance, and a semi-
circular bending test. The results showed that HMA displayed the highest
resistance to rutting, followed by the Evotherm mixture. The sylvaroad mixture
showed the highest resistance to fatigue failure. However, only Evotherm mixture
in this study passed the moisture susceptibility test, with a tensile strength ratio
(TSR) of 91%. Both HMA and Sylvaroad mixtures showed considerable stripping,
with the most severe case belonged to Sylvaroad mixture. HMA showed the best in
fracture resistance and a semi-circular bending test yielded tensile strength
results in a similar trend with the indirect tensile strength method.
Keywords: Evotherm, Hot mix asphalt, Semi-circular, Sylvaroad, Warm mix
asphalt.
Introduction
Warm mix asphalts (WMA) are emerging technologies, which has become an
interesting and important topic among researchers and practitioners. The WMA
technologies are promising in bringing numerous benefits to the society.
Especially, in the period when global warming and climate change become
worldwide issues, the use of WMA becomes a priority. The main aim of WMA
technologies is to reduce producing temperatures while still keeping a comparable
to or better performance than HMA.
WMA technologies can be classified into three categories, including a
foaming process, using organic additives, and using chemical additives (Zhang,
2010; Leng et al., 2013). Foaming technologies are mainly to introduce a small
amount of water, by injecting it directly into a hot binder or into a mixing
chamber (Larsen, 2001). At elevated temperatures, water evaporates and the steam
is trapped in the binder, making the binder’s volume significantly increase and
reduce the viscosity of the binder, improving greatly the workability of mixtures
University of Transport in HCMC, Vietnam. ‡ Associate Professor, University of Canterbury, New Zealand.
Vol. X, No. Y Lu et al.: Evaluation of Mechanical Properties…
2
and aggregate coating. Organic additives are products from wax, which are solid
at ambient temperatures and generally start to melt at around 100°C (Zaumanis,
2010). During mixing and compacting at higher temperatures than the melting
point, the organic additives reduce the viscosity of binder in the asphalt mixture
(Capitão et al., 2012). When the asphalt mixture cools, the wax uniformly
distributes and stiffens the binder (Rubio et al., 2012), which increases the
resistance against permanent deformation. Chemical additives are normally a
combination of anti-striping agents, emulsification agents and surfactants to
improve coating, adhesion and the compatibility of the mixture. Normally,
chemical additives are added directly to the binder before mixing (Rubio et al.,
2012). Besides benefits that WMA can bring such as saving fuel, reducing gases
during production, opening the paving window, it is believed that WMA will last
longer than HMA (D'Angelo et al., 2008). There have been many studies
conducted in laboratories (Lee, Amirkhanian et al. 2009, Hill, Behnia et al. 2012,
Topal, Sengoz et al. 2014) to investigate the performance of WMA, the use of
WMA was also reported to be successful in practice worldwide (Tutu and
Tuffour, 2016).
In 2013, the Arizona Chemical Company released a rejuvenator product
called SylvaroadTM
RP1000. This product is made from crude tall oil and crude
sulphate turpentine, pine chemicals produced by the pulp and paper industry
(Smith, 2015). The product was developed to increase the ability of adding higher
RAP proportion into HMA while still maintaining good performance of asphalt
mixtures (Arizona-Chemical, 2013). So far, there have been limited published
research articles about this new product although its information can be found on
unpublished media such as the company’s website. It can be understood that the
purpose of using this additive is to rejuvenate RAP in the HMA. The question
here is whether this rejuvenator can work in WMA. This research will investigate
whether Sylvaroad can work in WMA. For this purpose, the study was carried out
to evaluate the performance of WMA using the rejuvenator Sylvaroad. The
performance of WMA with Sylvaroad was compared with HMA and one another
chosen WMA. Tests were done on moisture resistance, fatigue cracking, rutting
and a semi-circular bending test. The semi-circular bending test was chosen to
further study the cracking resistance properties of asphalt mixtures.
Materials and Mixture Designs
Materials
To prepare specimens for testing, one type of bitumen with penetration grade
80/100, two types of chemical additives, Evotherm 3G and Sylvaroad were used.
Aggregates and bitumen were secured from a local contractor in Christchurch,
New Zealand. Evotherm and Sylvaroad are used to enhance coating and
workability of mixtures at lower production temperatures than HMA. Both of the
two additives are in liquid form. In this research, both Evotherm and Sylvaroad
were directly added to the heated binder before mixing. The addition percentages
Athens Journal of Technology & Engineering X Y
3
of Evotherm and Sylvaroad were 0.5% and 2% by the mass of the total binder,
respectively. The dosages of the additives were chosen based on the
recommendations of additive manufacturers.
Mixture Designs
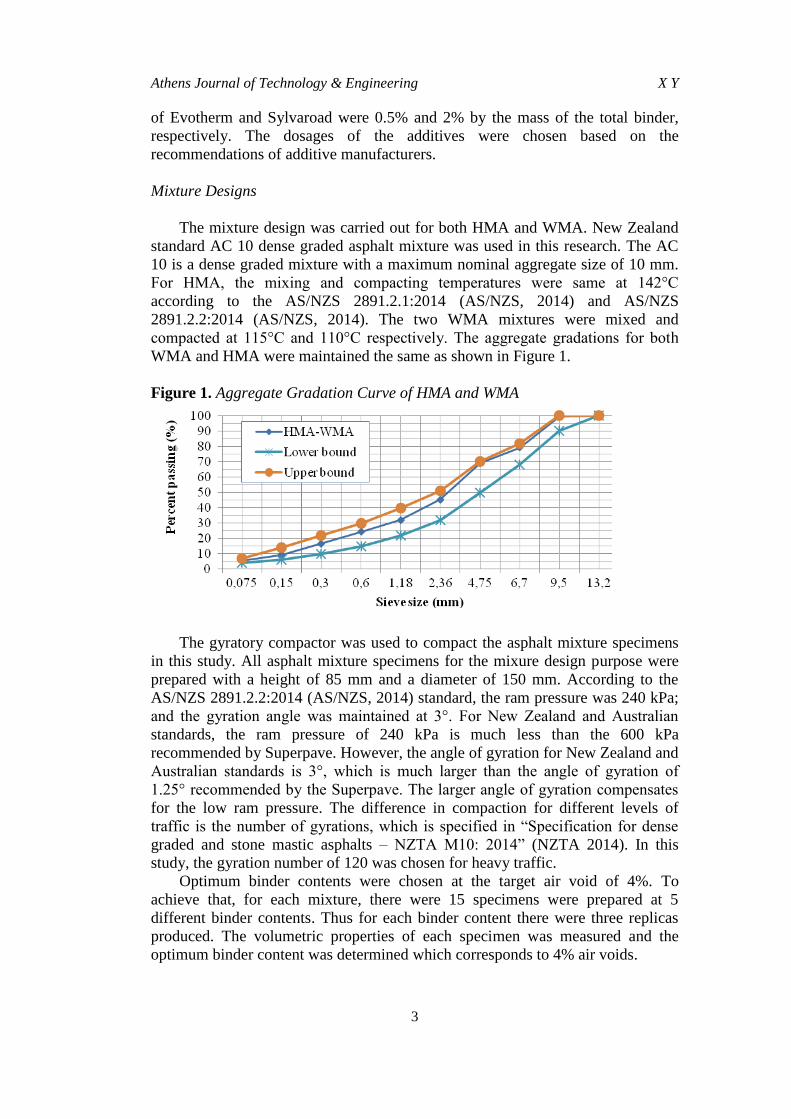
The mixture design was carried out for both HMA and WMA. New Zealand
standard AC 10 dense graded asphalt mixture was used in this research. The AC
10 is a dense graded mixture with a maximum nominal aggregate size of 10 mm.
For HMA, the mixing and compacting temperatures were same at 142°C
according to the AS/NZS 2891.2.1:2014 (AS/NZS, 2014) and AS/NZS
2891.2.2:2014 (AS/NZS, 2014). The two WMA mixtures were mixed and
compacted at 115°C and 110°C respectively. The aggregate gradations for both
WMA and HMA were maintained the same as shown in Figure 1.
Figure 1. Aggregate Gradation Curve of HMA and WMA
The gyratory compactor was used to compact the asphalt mixture specimens
in this study. All asphalt mixture specimens for the mixure design purpose were
prepared with a height of 85 mm and a diameter of 150 mm. According to the
AS/NZS 2891.2.2:2014 (AS/NZS, 2014) standard, the ram pressure was 240 kPa;
and the gyration angle was maintained at 3°. For New Zealand and Australian
standards, the ram pressure of 240 kPa is much less than the 600 kPa
recommended by Superpave. However, the angle of gyration for New Zealand and
Australian standards is 3°, which is much larger than the angle of gyration of
1.25° recommended by the Superpave. The larger angle of gyration compensates
for the low ram pressure. The difference in compaction for different levels of
traffic is the number of gyrations, which is specified in “Specification for dense
graded and stone mastic asphalts – NZTA M10: 2014” (NZTA 2014). In this
study, the gyration number of 120 was chosen for heavy traffic.
Optimum binder contents were chosen at the target air void of 4%. To
achieve that, for each mixture, there were 15 specimens were prepared at 5
different binder contents. Thus for each binder content there were three replicas
produced. The volumetric properties of each specimen was measured and the
optimum binder content was determined which corresponds to 4% air voids.
Vol. X, No. Y Lu et al.: Evaluation of Mechanical Properties…
4
In the case of WMA, optimum binder contents were firstly designed for
mixtures with Evotherm. As this study primarily concentrate on the effect of
additives on the mechanical performance of WMA rather than the compatibility,
the optimum binder contents for Evotherm mixture was adopted for mixture with
Sylvaroad. The optimum binder contents of HMA and WMA were 5.1% and
4.8% by mixture mass, respectively.
Experiments
This part demonstrates the experimental tests in this study, including moisture
resistance test, fatigue cracking, rutting resistance test, and a semi-circular
bending test. For each type of test, the methodology, result, and discussion are
presented.
Moisture Resistance Test
The moisture resistance test was carried out according to the AG:PT/T232
(AG:PT/T232 2007) to investigate the moisture susceptibility of the mixes.
Cylindrical specimens were produced with a diameter of 150 mm and a height of
85 mm. All the test specimens had the air voids in a range of 8.0 1.0%. The test
results were evaluated based on the tensile strength ratio (TSR) of each asphalt
mixture. The TSR is the ratio of the average indirect tensile strength (ITS) of
specimens in wet condition to the average ITS of specimens in dry condition. To
determine the TSR values, six specimens were produced for each asphalt mixture,
3 specimens for the dry subset and other 3 specimens for the wet subset. These
specimens were subjected to ITS test. For dry specimens, they were conditioned
in a temperature control chamber at 25°C for 2 hours before testing. For wet
specimens, firstly they were saturated in a vacuum at 50°C to achieve 55-80%
saturation degree. After that, they were conditioned in water at 60°C for 24 hours.
Finally, the specimens were conditioned in water at 25°C for 2 hours before
testing. TSR values of 80% or greater are recommended for the moisture
resistance of asphalt mixtures.
Fatigue Cracking Test
The four-point bending beam test was utilized to investigate the fatigue
resistance of the asphalt mixtures. Specimens dimension and test setup were
prepared according to the AG:PT/T233 “Fatigue life of compacted bituminous
mixes subject to repeated flexural bending”(AG:PT/T233 2006). Compacted slabs
with a dimension of 305 x 405 x 75 mm were cut into beams, which were 50 mm
high, 65 mm wide and 405 mm long. The air void target for test specimens was
7 0.5%. There were 3 specimens produced and tested for each asphalt mixture.
Constant displacement mode with sinusoidal load wave form with frequency 10
Hz, and maximum strain amplitude of 400 micro-strains were applied to all
specimens. The specimens were maintained in a temperature-control chamber for

Athens Journal of Technology & Engineering X Y
5
2 hours before testing. Fatigue life was determined as the number of cycles at
which the stiffness of the asphalt mixture degrades to 50% of the initial flexural
stiffness.
Rutting Test
In this study, rutting resistance evaluation was carried out by using the wheel-
tracking test apparatus. The test was conducted according to the AG:PT/T231
“Deformation resistance of asphalt mixtures by the wheel tracking test”
(AG:PT/T231, 2006). Slab specimens were prepared with dimensions of 305 x
305 x 50 mm. During the test, the slab was restrained at two ends of the travel
direction of the wheel, while the slab was free to move laterally. At least two
replicates are required for the test by the standard. The air voids are required to be
in a range of 5 1%. To carry out the test, the specimens were conditioned in a
temperature-control chamber for 7 hours to make sure that the slabs reached a
constant temperature of 60°C. After conditioning, the test was started at the same
temperature. During the test, the rut depth and the corresponding number of cycle
were recorded. The test terminated when the rut depth reached 15 mm or the
number of cycle reached 100,000 whichever occurred first. For the rutting test in
this study, there were 2 specimens produced and tested for HMA and WMA-
Sylvaroad, and 3 specimens were tested in the case of WMA-Evotherm.
Semi-circular Bending Test
In this research, the semi-circular bending (SCB) test was conducted to
evaluate the cracking resistance of asphalt mixtures under a monotonic loading.
There are two phases in a cracking failure: crack initiation and crack propagation
(Huang et al., 2013). Because cracking failures greatly affect the ride quality and
long-term performance of the pavement, therefore, in-depth understanding of the
cracking mechanism is vital for the pavement design (Lancaster et al., 2013).
Among tests used to investigate cracking resistance of the asphalt mixture, the
SCB test has been developed and widely used. The test was originally developed
for determining the fracture resistance in rock mechanics (Huang et al., 2013), and
has been successfully used to analyse the fracture properties of asphalt mixtures
(Molenaar et al., 2002). The SCB test is gradually gaining more attention from
researchers and engineers due to its simplicity, repeatability and consistency in
investigating cracking characteristics of asphalt mixtures (Saha and Biligiri,
2015).
To prepare samples for this test, cylindrical specimens with a height of 177
mm and a diameter of 150 mm were produced. These specimens were cored and
trimmed into cylindrical specimens with 100 mm in diameter and 30 ± 1 mm in
height. Cylindrical specimens with a height of 30 mm were cut into two halves
and notched to create specimens for the semi-circular tests. Four notch dimensions
were investigated in this study: 5, 10, 15 and 20 mm with a gap thickness of 2
mm. Specimens for the semi-circular test have an air void target of 5 1%.
Before testing, specimens were conditioned in a temperature-control chamber for
Vol. X, No. Y Lu et al.: Evaluation of Mechanical Properties…
6
2 hours to reach an equilibrium temperature of 25°C. After that, they were
subjected to a monotonic load with the rate chosen at 1 mm/min. The span
between to the two steel supports was 80 mm, approximately 0.8d, in which d is
the diameter of the specimen. Three replicates were prepared for each asphalt
mixture at each notch depth. In total, 36 samples were created for the SCB test.
Results and Analysis
Moisture Resistance Test
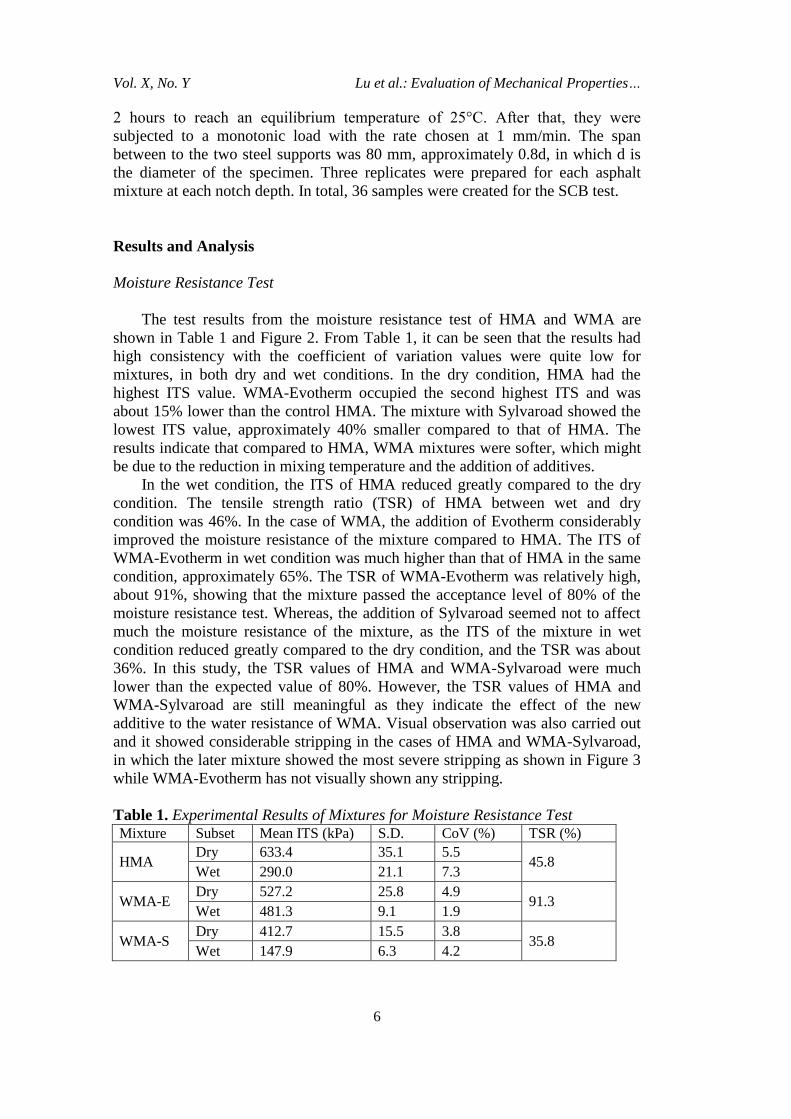
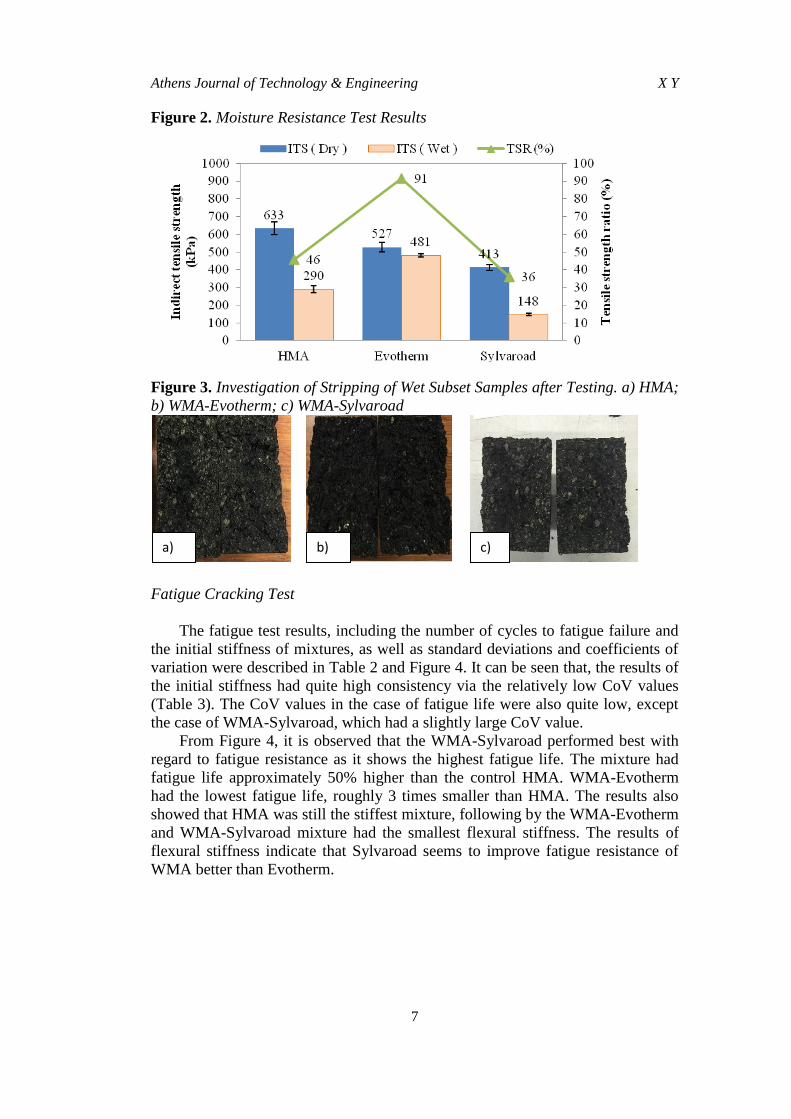
The test results from the moisture resistance test of HMA and WMA are
shown in Table 1 and Figure 2. From Table 1, it can be seen that the results had
high consistency with the coefficient of variation values were quite low for
mixtures, in both dry and wet conditions. In the dry condition, HMA had the
highest ITS value. WMA-Evotherm occupied the second highest ITS and was
about 15% lower than the control HMA. The mixture with Sylvaroad showed the
lowest ITS value, approximately 40% smaller compared to that of HMA. The
results indicate that compared to HMA, WMA mixtures were softer, which might
be due to the reduction in mixing temperature and the addition of additives.
In the wet condition, the ITS of HMA reduced greatly compared to the dry
condition. The tensile strength ratio (TSR) of HMA between wet and dry
condition was 46%. In the case of WMA, the addition of Evotherm considerably
improved the moisture resistance of the mixture compared to HMA. The ITS of
WMA-Evotherm in wet condition was much higher than that of HMA in the same
condition, approximately 65%. The TSR of WMA-Evotherm was relatively high,
about 91%, showing that the mixture passed the acceptance level of 80% of the
moisture resistance test. Whereas, the addition of Sylvaroad seemed not to affect
much the moisture resistance of the mixture, as the ITS of the mixture in wet
condition reduced greatly compared to the dry condition, and the TSR was about
36%. In this study, the TSR values of HMA and WMA-Sylvaroad were much
lower than the expected value of 80%. However, the TSR values of HMA and
WMA-Sylvaroad are still meaningful as they indicate the effect of the new
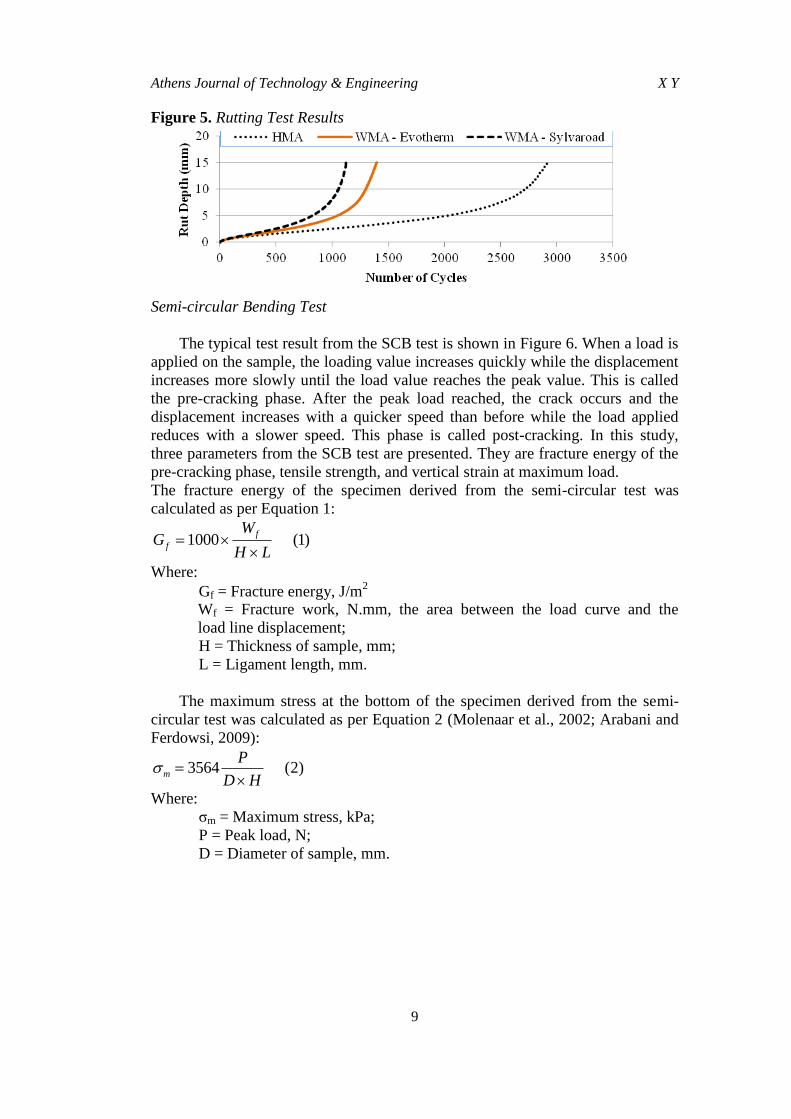
additive to the water resistance of WMA. Visual observation was also carried out
and it showed considerable stripping in the cases of HMA and WMA-Sylvaroad,
in which the later mixture showed the most severe stripping as shown in Figure 3
while WMA-Evotherm has not visually shown any stripping.
Table 1. Experimental Results of Mixtures for Moisture Resistance Test Mixture Subset Mean ITS (kPa) S.D. CoV (%) TSR (%)
HMA Dry 633.4 35.1 5.5
45.8 Wet 290.0 21.1 7.3
WMA-E Dry 527.2 25.8 4.9
91.3 Wet 481.3 9.1 1.9
WMA-S Dry 412.7 15.5 3.8
35.8 Wet 147.9 6.3 4.2
Athens Journal of Technology & Engineering X Y
7
Figure 2. Moisture Resistance Test Results
Figure 3. Investigation of Stripping of Wet Subset Samples after Testing. a) HMA;
b) WMA-Evotherm; c) WMA-Sylvaroad
Fatigue Cracking Test
The fatigue test results, including the number of cycles to fatigue failure and
the initial stiffness of mixtures, as well as standard deviations and coefficients of
variation were described in Table 2 and Figure 4. It can be seen that, the results of
the initial stiffness had quite high consistency via the relatively low CoV values
(Table 3). The CoV values in the case of fatigue life were also quite low, except
the case of WMA-Sylvaroad, which had a slightly large CoV value.
From Figure 4, it is observed that the WMA-Sylvaroad performed best with
regard to fatigue resistance as it shows the highest fatigue life. The mixture had
fatigue life approximately 50% higher than the control HMA. WMA-Evotherm
had the lowest fatigue life, roughly 3 times smaller than HMA. The results also
showed that HMA was still the stiffest mixture, following by the WMA-Evotherm
and WMA-Sylvaroad mixture had the smallest flexural stiffness. The results of
flexural stiffness indicate that Sylvaroad seems to improve fatigue resistance of
WMA better than Evotherm.
a) b) c)

Vol. X, No. Y Lu et al.: Evaluation of Mechanical Properties…
8
Table 2. Experimental Results of All Mixtures for Fatigue and Rutting Tests
Mixture
Initial stiffness (MPa) Fatigue life (cycle) Rutting (cycle)
Mean S.D. CoV
(%) Mean S.D.
CoV
(%) Mean S.D.
CoV
(%)
HMA 3282 123.9 3.8 580013 46494 8 2922 696 24
WMA-
E 3107 136.7 4.4 205107 26118 12.7 1401 395 28
WMA-
S 2527 34.8 1.4 881920 310552 35.2 1126 195 17
Figure 4. Fatigue Test Results
Rutting Test
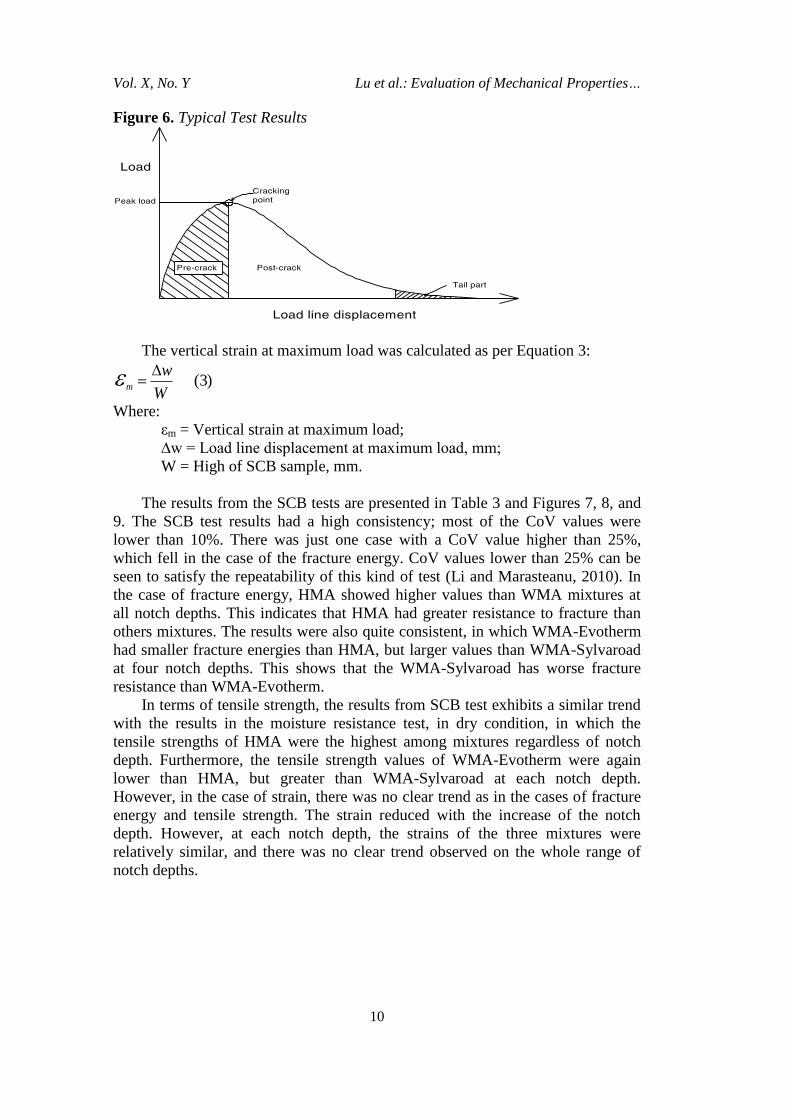
The results from the wheel tracking test are exhibited in Table 2 and Figure 5.
Results from Table 2 show that the three mixtures had quite similar values of
CoV, and a little bit high (from 17 to 28%) compared to other tests. From Figure 5
it can be seen that the HMA performed the best among the asphalt mixtures. The
number of cycles to reach the maximum rut depth of HMA was as twice as that of
WMA-Evotherm. It was again the mixture with Sylvaroad showed to be the
softest mixture, as the mixture performed the worse in the rutting test. The results
may cause a concern about the rutting resistance of WMA mixtures compared to
HMA. The results also indicate that the binder in WMA was softer than HMA due
to the lower producing temperatures and due to the addition of additives. It is
believed that the used additives might have not only helped mixing at lower
temperatures than HMA, but also made the binder in compacted asphalt mixtures
softer. The argument for that is if the additives had not softened the mixtures, the
rutting resistance of WMA with Sylvaroad and Evotherm would have been similar
regardless of different additive types and dosages, as they were produced by using
the same mixture design.
Athens Journal of Technology & Engineering X Y
9
Figure 5. Rutting Test Results
Semi-circular Bending Test
The typical test result from the SCB test is shown in Figure 6. When a load is
applied on the sample, the loading value increases quickly while the displacement
increases more slowly until the load value reaches the peak value. This is called
the pre-cracking phase. After the peak load reached, the crack occurs and the
displacement increases with a quicker speed than before while the load applied
reduces with a slower speed. This phase is called post-cracking. In this study,
three parameters from the SCB test are presented. They are fracture energy of the
pre-cracking phase, tensile strength, and vertical strain at maximum load.
The fracture energy of the specimen derived from the semi-circular test was
calculated as per Equation 1:
1000 (1)
f
f
WG
H L
Where:
Gf = Fracture energy, J/m2
Wf = Fracture work, N.mm, the area between the load curve and the
load line displacement;
H = Thickness of sample, mm;
L = Ligament length, mm.
The maximum stress at the bottom of the specimen derived from the semi-
circular test was calculated as per Equation 2 (Molenaar et al., 2002; Arabani and
Ferdowsi, 2009):
3564 (2)
m
P
D H
Where:
σm = Maximum stress, kPa;
P = Peak load, N;
D = Diameter of sample, mm.
Vol. X, No. Y Lu et al.: Evaluation of Mechanical Properties…
10
Figure 6. Typical Test Results
The vertical strain at maximum load was calculated as per Equation 3:
(3)
m
w
W
Where:
εm = Vertical strain at maximum load;
∆w = Load line displacement at maximum load, mm;
W = High of SCB sample, mm.
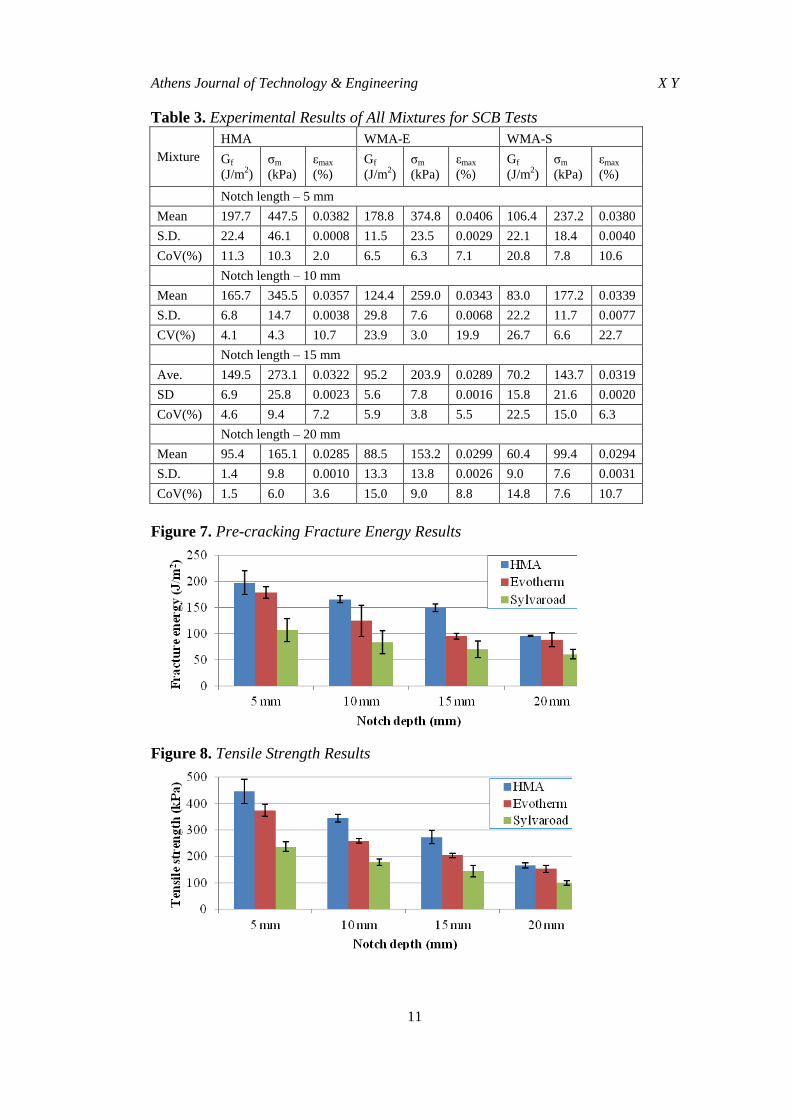
The results from the SCB tests are presented in Table 3 and Figures 7, 8, and
9. The SCB test results had a high consistency; most of the CoV values were
lower than 10%. There was just one case with a CoV value higher than 25%,
which fell in the case of the fracture energy. CoV values lower than 25% can be
seen to satisfy the repeatability of this kind of test (Li and Marasteanu, 2010). In
the case of fracture energy, HMA showed higher values than WMA mixtures at
all notch depths. This indicates that HMA had greater resistance to fracture than
others mixtures. The results were also quite consistent, in which WMA-Evotherm
had smaller fracture energies than HMA, but larger values than WMA-Sylvaroad
at four notch depths. This shows that the WMA-Sylvaroad has worse fracture
resistance than WMA-Evotherm.
In terms of tensile strength, the results from SCB test exhibits a similar trend
with the results in the moisture resistance test, in dry condition, in which the
tensile strengths of HMA were the highest among mixtures regardless of notch
depth. Furthermore, the tensile strength values of WMA-Evotherm were again
lower than HMA, but greater than WMA-Sylvaroad at each notch depth.
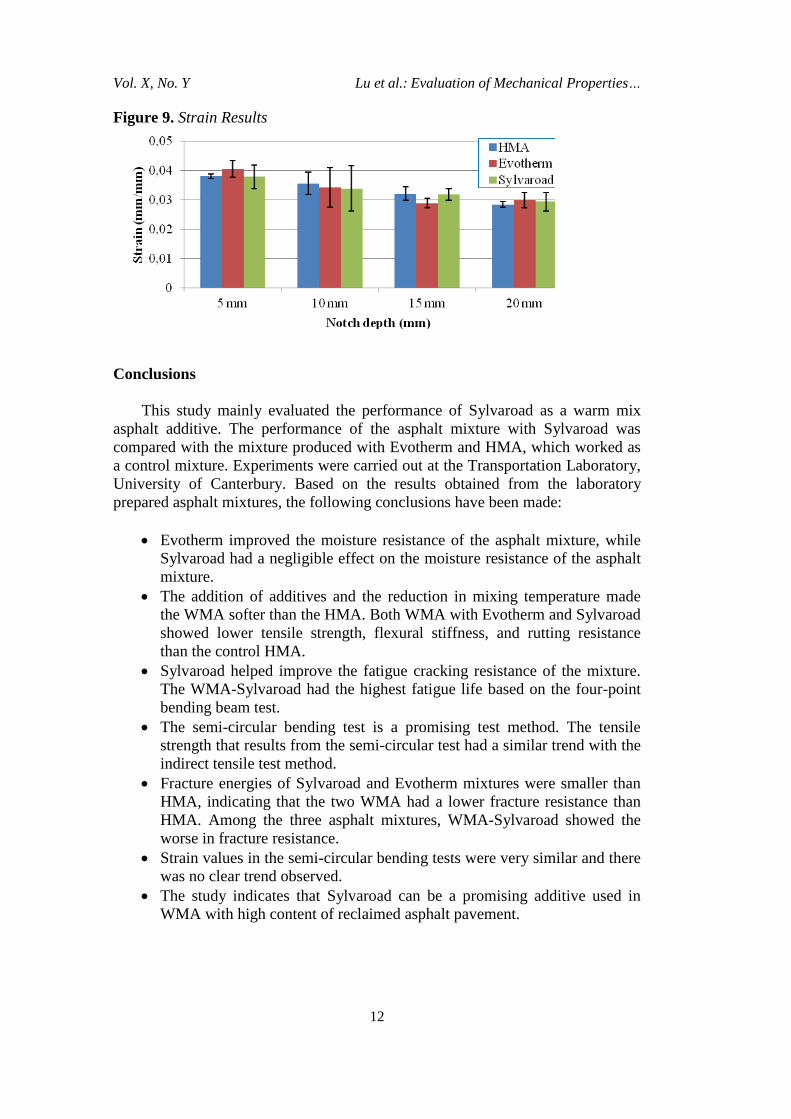
However, in the case of strain, there was no clear trend as in the cases of fracture
energy and tensile strength. The strain reduced with the increase of the notch
depth. However, at each notch depth, the strains of the three mixtures were
relatively similar, and there was no clear trend observed on the whole range of
notch depths.
Athens Journal of Technology & Engineering X Y
11
Table 3. Experimental Results of All Mixtures for SCB Tests
Mixture
HMA WMA-E WMA-S
Gf
(J/m2)
σm
(kPa)
εmax
(%)
Gf
(J/m2)
σm
(kPa)
εmax
(%)
Gf
(J/m2)
σm
(kPa)
εmax
(%)
Notch length – 5 mm
Mean 197.7 447.5 0.0382 178.8 374.8 0.0406 106.4 237.2 0.0380
S.D. 22.4 46.1 0.0008 11.5 23.5 0.0029 22.1 18.4 0.0040
CoV(%) 11.3 10.3 2.0 6.5 6.3 7.1 20.8 7.8 10.6
Notch length – 10 mm
Mean 165.7 345.5 0.0357 124.4 259.0 0.0343 83.0 177.2 0.0339
S.D. 6.8 14.7 0.0038 29.8 7.6 0.0068 22.2 11.7 0.0077
CV(%) 4.1 4.3 10.7 23.9 3.0 19.9 26.7 6.6 22.7
Notch length – 15 mm
Ave. 149.5 273.1 0.0322 95.2 203.9 0.0289 70.2 143.7 0.0319
SD 6.9 25.8 0.0023 5.6 7.8 0.0016 15.8 21.6 0.0020
CoV(%) 4.6 9.4 7.2 5.9 3.8 5.5 22.5 15.0 6.3
Notch length – 20 mm
Mean 95.4 165.1 0.0285 88.5 153.2 0.0299 60.4 99.4 0.0294
S.D. 1.4 9.8 0.0010 13.3 13.8 0.0026 9.0 7.6 0.0031
CoV(%) 1.5 6.0 3.6 15.0 9.0 8.8 14.8 7.6 10.7
Figure 7. Pre-cracking Fracture Energy Results
Figure 8. Tensile Strength Results
Vol. X, No. Y Lu et al.: Evaluation of Mechanical Properties…
12
Figure 9. Strain Results
Conclusions
This study mainly evaluated the performance of Sylvaroad as a warm mix
asphalt additive. The performance of the asphalt mixture with Sylvaroad was
compared with the mixture produced with Evotherm and HMA, which worked as
a control mixture. Experiments were carried out at the Transportation Laboratory,
University of Canterbury. Based on the results obtained from the laboratory
prepared asphalt mixtures, the following conclusions have been made:
Evotherm improved the moisture resistance of the asphalt mixture, while
Sylvaroad had a negligible effect on the moisture resistance of the asphalt
mixture.
The addition of additives and the reduction in mixing temperature made
the WMA softer than the HMA. Both WMA with Evotherm and Sylvaroad
showed lower tensile strength, flexural stiffness, and rutting resistance
than the control HMA.
Sylvaroad helped improve the fatigue cracking resistance of the mixture.
The WMA-Sylvaroad had the highest fatigue life based on the four-point
bending beam test.
The semi-circular bending test is a promising test method. The tensile
strength that results from the semi-circular test had a similar trend with the
indirect tensile test method.
Fracture energies of Sylvaroad and Evotherm mixtures were smaller than
HMA, indicating that the two WMA had a lower fracture resistance than
HMA. Among the three asphalt mixtures, WMA-Sylvaroad showed the
worse in fracture resistance.
Strain values in the semi-circular bending tests were very similar and there
was no clear trend observed.
The study indicates that Sylvaroad can be a promising additive used in
WMA with high content of reclaimed asphalt pavement.

Athens Journal of Technology & Engineering X Y
13
Acknowledgments
The authors gratefully acknowledge the staff from Fulton Hogan for their
help during this research. The authors also gratefully acknowledge Damien Hond
and Arizona Chemical for additives donation. The authors thank John Kooloos,
the technician of the Transportation lab, University of Canterbury for his kind
help during this study. The authors thank the Civil and Natural Resources
Engineering department for financial sponsor, giving the authors a valuable
chance to present this study at the conference.
References
AG:PT/T231 (2006). "Deformation resistance of asphalt mixtures by the wheel tracking
test." Austroads Manual of Test Methods.
AG:PT/T233 (2006). "Fatigue life of compacted bituminous mixes subject to repeated
flexural bending." Austroads Manual of Test Methods.
AG:PT/T232 (2007). "Stripping potential of asphalt – Tensile strength ratio." Austroads
Manual of Test Methods.
Arabani, M. and B. Ferdowsi (2009). "Evaluating the semi-circular bending test for HMA
mixtures." International Journal of Engineering A: Basics 22(1): 47-58.
Arizona-Chemical (2013). "SYLVAROAD™ RP1000 Performance Additive [Brochure]."
AS/NZS (2014). Standard 2891.2.1:2014, Methods of sampling and testing asphalt. Part
1: Sample preparation - Mixing, quatering and conditioning of asphalt in the
laboratory, Australian/New Zealand Standard.
AS/NZS (2014). Standard 2891.2.2:2014, Methods of sampling and testing asphalt. Part
2: Sample preparation - Compaction of asphalt test specimens using a gyratory
compactor, Australian/New Zealand Standard.
Capitão, S., L. Picado-Santos and F. Martinho (2012). "Pavement engineering materials:
Review on the use of warm-mix asphalt." Construction and Building Materials 36:
1016-1024.
D'Angelo, J. A., E. E. Harm, J. C. Bartoszek, G. L. Baumgardner, M. R. Corrigan, J. E.
Cowsert, T. P. Harman, M. Jamshidi, H. W. Jones and D. E. Newcomb (2008).
Warm-mix asphalt: European practice. Report No. FHWA-PL-08-007. Available
from http://international.fhwa.dot.gov/pubs/pl08007/.
Hill, B., B. Behnia, S. Hakimzadeh, W. Buttlar and H. Reis (2012). "Evaluation of low-
temperature cracking performance of warm-mix asphalt mixtures." Transportation
Research Record: Journal of the Transportation Research Board (2294): 81-88.
Huang, B., X. Shu and G. Zuo (2013). "Using notched semi circular bending fatigue test
to characterize fracture resistance of asphalt mixtures." Engineering Fracture
Mechanics 109: 78-88.
Lancaster, I., H. Khalid and I. Kougioumtzoglou (2013). "Extended FEM modelling of
crack propagation using the semi-circular bending test." Construction and Building
Materials 48: 270-277.
Larsen, O. (2001). "Warm Asphalt Mix with Foam–WAM Foam." IRF 2001 Partie B:
Thèmes Techniques: 00469.
Lee, S.-J., S. N. Amirkhanian, N.-W. Park and K. W. Kim (2009). "Characterization of
warm mix asphalt binders containing artificially long-term aged binders."
Construction and Building Materials 23(6): 2371-2379.

Vol. X, No. Y Lu et al.: Evaluation of Mechanical Properties…
14
Leng, Z., A. Gamez and I. L. Al-Qadi (2013). "Mechanical property characterization of
warm-mix asphalt prepared with chemical additives." Journal of Materials in Civil
Engineering 26(2): 304-311.
Li, X.-J. and M. Marasteanu (2010). "Using semi circular bending test to evaluate low
temperature fracture resistance for asphalt concrete." Experimental mechanics 50(7):
867-876.
Molenaar, A., A. Scarpas, X. Liu and S. Erkens (2002). "Semi-circular bending test;
simple but useful?" Journal of the Association of Asphalt Paving Technologists 71.
NZTA, N. Z. T. A. (2014). "SP/SM10:140905 Specification for Dense Graded and Stone
Mastic Asphalts. Available at http://bit.ly/2f3htX1"
Rubio, M. C., G. Martínez, L. Baena and F. Moreno (2012). "Warm mix asphalt: an
overview." Journal of Cleaner Production 24: 76-84.
Saha, G. and K. P. Biligiri (2015). "Fracture damage evaluation of asphalt mixtures using
Semi-Circular Bending test based on fracture energy approach." Engineering
Fracture Mechanics 142: 154-169.
Smith, K. (2015). "A rejuvenator derived from pine trees and natural asphalt." World
Highways, October 2015. http://bit.ly/2fUSgeU.
Topal, A., B. Sengoz, B. V. Kok, M. Yilmaz, P. Aghazadeh Dokandari, J. Oner and D.
Kaya (2014). "Evaluation of mixture characteristics of warm mix asphalt involving
natural and synthetic zeolite additives." Construction and Building Materials 57: 38-
44.
Tutu, K. A. and Y. A. Tuffour (2016). "Warm-Mix Asphalt and Pavement Sustainability:
A Review." Open Journal of Civil Engineering 6(02): 84.
Zaumanis, M. (2010). Warm mix asphalt investigation Master thesis, Riga Technical
University. Denmark.
Zhang, J. (2010). "Effects of warm-mix asphalt additives on asphalt mixture
characteristics and pavement performance." M.Sc. thesis. University of Nebraska -
Lincoln. Paper 12.(http://digitalcommons.unl.edu/civilengdiss/12).