evaluation of mechanical losses and … · evaluation of mechanical losses and analysis of the...
TRANSCRIPT

01A3029
EVALUATION OF MECHANICAL LOSSES AND ANALYSIS OF THEINFLUENCE OF EGR AND TURBOCHARGER CONTROL ONHEAT RELEASE RATE IN AN AUTOMOTIVE DIESEL ENGINE
G. Zamboni - Dipartimento di Macchine, Sistemi Energetici e Trasporti (DIMSET) - University of Genova - Italy
Abstract
A wide experimental programme was developed on the engine test bench of the Dipartimento di Macchine,Sistemi Energetici e Trasporti of the University of Genova, in order to analyse the influence of turbochargerand exhaust gas recirculation control on combustion characteristics of an automotive turbocharged DI Dieselengine and to develop correlation for the evaluation of heat release rate and mechanical losses. Indicatedpressure diagrams were measured in different engine part and full load operating conditions, for differentsettings of turbine waste-gate and EGR valves opening degrees, and heat release rate evaluation allowed tooutline the influence of these control variables.
Experimental heat release rates were then used for the development of a single zone combustioncorrelation, whose coefficients are expressed as functions of engine operating parameters such as enginespeed, gas-fuel ratio and ignition delay, while in-cylinder pressure diagrams allowed to evaluate indicatedmean effective pressure values, mechanical losses and efficiency; mechanical losses were then linked tomean piston speed and in-cylinder maximum pressure in a simple correlation for their calculation.
In the paper the analysis of the influence of turbocharger and EGR control on combustion is focused,while correlation are proposed, comparing calculated values of heat release, in-cylinder pressure andmechanical losses to experimental data.
Introduction
Notwithstanding internal combustion engine (ICE) technology is well established, further developments are stillpossible both in spark ignition and Diesel engines, taking into account that different technical solutions (electricand hybrid propulsion, fuel cell, etc.) seem not to be able to substitute ICE in its supremacy in automotiveapplications, at least for the next ten years [1, 2, 3, 4, 5]. On the other hand, in order to comply with the newlimits of European legislation on pollutants emissions (EURO IV phase, in force in 2005) and with therequirements related to fuel consumption and CO2 emissions reduction [6], updated configurations are beingdeveloped, with interesting breakthrough technologies, such as gasoline direct injection (DI) and electronicallycontrolled Diesel fuel injection system (FIS) [1, 2].
In automotive field, DI Diesel engines are a widespread alternative, due to their low fuel consumptionand to the improvement in torque, driveability and acoustic comfort allowed by FIS based on the common railtechnology [7, 8]; specific solutions are also required, combining intake and exhaust components usually fitted,such as turbochargers and exhaust gas recirculation (EGR) system, with new devices for emissions control,i.e. deNOx catalysts and particulate filters. These elements will need integrated control strategies in order toachieve proper operating conditions and to fulfil different goals, in terms of performance, fuel consumption andemissions, taking also into account the interactions with other engine components, like FIS, and thecharacteristics of the regulating system, such as waste-gate (WG) valves or variable geometry (VG) devicesusually fitted on automotive turbocharger turbines.
The development of new engine configurations with the relevant control strategies requires wideexperimental and theoretical studies: a research on this subject is being developed at the Dipartimento diMacchine, Sistemi Energetici e Trasporti (DIMSET) of the University of Genova since many years [9, 10, 11,12], with reference to different automotive turbocharged DI Diesel engines, equipped with mechanically orelectronically controlled FIS, fitted with VG or WG turbochargers turbine and EGR system. Experimentalactivity is developed on a test facility which allows to evaluate operating parameters of both the engine and theturbocharger [9, 10], while theoretical investigations are focused on the development of a simulation model ofthe engine-turbocharger matching, suitable for control applications [11, 12].

In the paper, the main results of a wide experimental programme aimed at the analysis of the influenceof turbocharger and EGR control on combustion characteristics of a DI Diesel engine and at the developmentof correlation for the evaluation of heat release rate and mechanical losses are presented and discussed.Indicated pressure diagrams were measured in different engine operating conditions, with particular referenceto ECE15+EUDC driving cycle, for different settings of WG and EGR valves opening degrees, and heatrelease rate evaluation allows to point out the influence of these control variables.
Experimental heat release rates were also used for the development of a single zone combustioncorrelation, whose coefficients are expressed as functions of engine operating parameters (i.e., engine speed,gas-fuel ratio and ignition delay), while in-cylinder pressure diagrams allowed to evaluate indicated meaneffective pressure values and, through comparison to brake mean effective pressure levels, mechanical lossesand efficiency; mechanical losses were then linked to mean piston speed and in-cylinder maximum pressure ina simple correlation for their calculation.
In the paper the analysis of the influence of turbocharger and EGR control on combustion is focused,while correlation are proposed, comparing calculated values of heat release, in-cylinder pressure andmechanical losses to experimental data.
1.Experimental set-up and operating conditions
The experimental activity was developed on an automotive DI Diesel engine, with a displacement of about 1.9litre, fitted with a mechanical distributor injection pump, an exhaust turbocharger with a waste-gated turbine,an intercooler and an uncooled EGR system. Measurements were performed through a dedicated test bench[10], equipped with an eddy current dynamometer, exhaust gas analysers for carbon monoxide and dioxide,unburnt hydrocarbons and nitrogen oxides, a variable sample smoke meter, an automatic data acquisition andprocessing system and two independent pneumatic circuits for turbocharger and EGR system control, whichallow to set waste-gate valve opening degree (A, equal to the ratio between the displacement of the relevantdriving rod and its total displacement) and EGR rate (fEGR, defined as the mass flow of recirculated gas dividedby the total mass flow), which is evaluated as the ratio between intake and exhaust carbon dioxideconcentrations [13].
For in-cylinder pressure diagrams and crank angle measurements, a cooled piezoelectric pressuretransducer, connected to an amplifier, and a photoelectric incremental encoder were fitted on the engine: theirsignals were sampled by a digital storage oscilloscope, managed by a personal computer, which stored andprocessed experimental values. Data processing, performed through software developed at DIMSET inFortran or in Matlab environment, allowed to evaluate absolute pressure levels setting a proper referencevalue [14] and to filter pressure signals through a numerical procedure based on moving means centred onthree values [15], in order to eliminate noise due to the pressure waves in the measurement duct between thesensor and the combustion chamber.
In each operating condition, the main engine operating parameters (i.e., engine rotational speed, braketorque and power, air and fuel mass flow rates, volumetric concentrations of exhaust pollutants, smoke, EGRrate, WG opening degree, etc.) were measured together with the in-cylinder pressure diagrams.
The experimental activity was developed in two step: in a first phase, measurements were performed inorder to study engine mechanical losses and to define an empirical correlation to calculate friction meaneffective pressure (fmep) as a function of mean piston speed (um) and in-cylinder maximum pressure (pMAX);therefore pressure diagrams were measured considering different levels of engine speed (n = 1500 ÷ 4000rev/min, with a step of 500 rev/min) and load, starting from a brake mean effective pressure (bmep) of 0.2 MPaup to its maximum level. Several engine operating conditions with bmep lower than 0.2 MPa were alsoconsidered; in this step, WG and EGR valves were kept closed.
The second step was focused on the analysis of the combustion process, with particular reference tothe influence of EGR and turbocharger control on in-cylinder pressure and rate of heat release, and on thedefinition of a combustion correlation for the evaluation of heat release as a function of the main engineoperating parameters. Selected experimental operating conditions referred to this phase are shown in fig.1,expressed through the relevant bmep and n values: a greater importance was given to engine on-vehicle useand to EGR system activation, thus preferring points at part load and low-medium engine speed. Exhaust gasrecirculation technique is not generally applied to the whole engine operating field, because the reduction ofinlet air mass flow rate (Ma) and air-fuel ratio (AFR) increases smoke; this effect is more significant at highengine speed and load, therefore when these parameters grow, EGR is reduced and then excluded, also inorder to avoid any influence on engine maximum performance [9].
With reference to the considered engine, EGR operating field is very close to that defined through theECE15 + EUDC driving cycle [9], for which fifteen equivalent engine steady-state points were calculated in a

previous phase of DIMSET research activity, takingaccount of a specific car [10]; transient cycle modeswere considered in terms of average engine speedand bmep values. Part load experimental points weretherefore selected between those of the ECE15 +EUDC driving cycle, or setting one of the engineregulating parameters to a constant level (bmep = 0.2and 0.4 MPa, n = 2000 rev/min): in these operatingconditions, pressure diagrams were measuredconsidering four different EGR rate (including fEGR =0), imposing a smoke limit of 5 FSN (Filter SmokeNumber, ranging from 0 to 10) to set maximum EGRrate.
In order to deepen the influence ofturbocharger control on combustion, measurementswere performed also for three WG opening degrees(A = 0, 15 per cent and 45 per cent) in several points.
Finally other experimental conditions were selected outside EGR operating field, at constant engine speed (n =2000 and 3000 rev/min) and at maximum load (fig.1).
2.Upgrade of a correlation for mechanical losses evaluation in Diesel engine
The evaluation of engine mechanical losses is a typical application of in-cylinder pressure diagramsmeasurements; generally, they are expressed in terms of friction mean effective pressure (fmep):
fmep = imep – bmep (1)
where indicated mean effective pressure (imep) is given by the ratio between indicated work (i.e., the areaenclosed by the pressure trace on (p, V) plane, where V is the instantaneous cylinder volume) and cylinderdisplacement, while bmep is measured through a dynamometer. Pumping losses (due to the fact that exhaustpressure was always higher than inlet pressure for the considered engine) were included in imep calculation:therefore fmep represents the 'true engine friction' [16], that is friction due to crankshaft, piston, camshaft, etc.and engine driven accessories.
The experimental work described in point 1 allowed to compute fmep levels for a wide range of engineoperating conditions and to define a simple correlation for their evaluation, suitable for the DIMSET engine-turbocharger simulation model, which requires short calculation time [11, 12].The selected correlation is commonly applied to Diesel engine [17, 18] and allows to estimate fmep as a linearfunction of mean piston speed um and cylinder maximum pressure pMAX, superimposing the effects of speedand load:
fmep = a + b · um + c · pMAX (2)
where fmep and pMAX are expressed in [MPa] and um in [m/s]; the static term “a” represents accessories losses[17]. The updated coefficients (a = 0.0153, b = 0.0176 e c = 0.0159) were evaluated on the basis ofexperimental data through a simple least-squares linear regression, obtaining a correlation coefficient R2 =0.93.
To compare different formulae of correlation (2) [17, 18], the relevant coefficients are reported in table1, together with the main characteristics of the engines and the operating conditions used by the Authors fortheir definition. Engines and considered experimental ranges of speed and load (i.e., mean piston speed andmaximum cylinder pressure) are quite different: as a consequence calculated parameters show significantdifferences, especially with reference to static term “a” and to the value of coefficient “b” proposed byWinterbone and Tennant [17]; the pressure coefficient is always positive, therefore an increase in peakpressure results in higher friction losses.
To complete this analysis, fmep levels evaluated with three formulae of eq.2 are compared in fig.2 withreference to experimental values, considering increasing bmep at constant speed (n = 2000 rev/min, fig.2a)and increasing engine speed at constant load (bmep = 0.4 MPa, fig.2b). Chen and Flynn 2nd correlation (whichwas previously used in the simulation code [11]) allows to estimate friction losses with acceptable shifts, evenif calculated values are generally higher than the measured ones, while levels obtained with Winterbone and
0.0
0.2
0.4
0.6
0.8
1.0
1.2
1.4
1.6
1000 1500 2000 2500 3000 3500 4000 4500Engine speed [rev/min]
Bra
ke m
ean
eff
ecti
ve p
ress
ure
[M
Pa]
Full load - no EGR
Part load - no EGR
Part load with EGR
Fig.1 – Experimental operating conditions forcombustion correlation development

Tennant correlation are significantly lower; it may be concluded that simplified correlation must be suited to thespecific engine, because extrapolation of data between different engines may lead to unreliable results.
a = 0.0138 b = 0.0164 c = 0.005Chen & Flynn1st correlation[17]
§ Diesel single cylinder§ nMAX = 3200 rev/min§ Maximum imep = 1.8 MPa§ pMAX = 20 MPa
§ Separately driven accessories
a = 0.1172 b = 0.0164 c = 0.010Chen & Flynn2nd correlation[17]
§ As in 1st correlation § Engine driven accessories
a = 0.0061 b = 0.0098 c = 0.0155
Winterbone& Tennant[17]
§ Diesel DI, turbocharged§ 6 cylinder; Vt = 8.2 dm3
§ ρ = 15.4 : 1§ B = 118 mm; S = 125 mm§ Maximum brake power = 190
kW @ 2400 rev/min§ Maximum bmep = 1.3 MPa @
1800 rev/min
§ Measurements on onecylinder for n = 1200 and1800 rev/min and differentengine load
§ pMAX = 4 ÷ 13 MPa§ um = 5.0 ÷ 7.5 m/s
a = 0.0153 b = 0.0176 c = 0.0159
DIMSET
§ Diesel DI, turbocharged§ 4 cylinder; Vt = 1.929 dm3
§ ρ = 19.8 : 1§ B = 82.6 mm; S = 90 mm§ Maximum brake power = 58.6
kW @ 4000 rev/min§ Maximum bmep = 1.4 MPa @
2000 rev/min
§ Measurements on onecylinder for n = 1500 ÷ 4000rev/min (step of 500 rev/min)and different engine load
§ pMAX = 6.5 ÷ 17 MPa§ um = 4.5 ÷ 12.0 m/s
Table 1 – Comparison of different formulae of correlation fmep = a + b · um + c · pMAX
Fig.2 – Comparison of experimental and calculated values of friction mean effective pressure
3.Influence of EGR and turbocharger control on heat release rate
Turbochargers and exhaust gas recirculation systems are usually fitted to automotive Diesel engines in orderto improve specific power and torque and to reduce NOx emissions, respectively: their influence on engineperformance and emissions are quite known [19, 20, 21], even if some aspects have to be further investigatedand their potential is not fully exploited, since the application of electronics offers new possibilities of improvingtheir control, also in an integrated way [10, 12], and the related effects on engine.
As it is well known, EGR leads to the substitution of part of inlet oxygen with carbon dioxide and water(in vapour form): combustion process is then modified, due to an increased thermal capacity of the charge,
0.18
0.22
0.26
0.30
0.34
0.38
0.42
0.0 0.2 0.4 0.6 0.8 1.0 1.2 1.4 1.6Brake mean effective pressure [MPa]
Fri
ctio
n m
ean
eff
ecti
ve p
ress
ure
[M
Pa]
Experimental
Chen and Flynn 2nd corr.
Winterbone and Tennant
DIMSET
n = 2000 rev/min
(a)
0.18
0.22
0.26
0.30
0.34
0.38
0.42
0.46
1000 1500 2000 2500 3000 3500 4000 4500
Engine speed [rev/min]
Fric
tion
mea
n ef
fect
ive
pres
sure
[MP
a]
Experimental
Chen and Flynn 2nd corr.
Winterbone and Tennant
DIMSET
bmep = 0.4 MPa
(b)

Fig.3 – Influence of turbocharger and EGR control on engine operating parameters (operatingcondition: n = 1550 rev/min, bmep = 0.2 MPa)
0.84
0.88
0.92
0.96
1.00
0 5 10 15 20 25 30EGR rate [%]
Pre
ssur
e / P
ress
ure
for
(A =
0, f
EG
R =
0)A = 0
A = 15%
A = 45%
(a)
Engine intake pressure pA
1.0
1.1
1.2
1.3
0 5 10 15 20 25 30EGR rate [%]
Tem
pera
ture
/ Te
mpe
ratu
refo
r (A
= 0
, fE
GR =
0)
A = 0
A = 15%
A = 45%
(b)Engine intake temperature T A
0.84
0.88
0.92
0.96
1.00
0 5 10 15 20 25 30EGR rate [%]
Pre
ssur
e / P
ress
ure
for
(A =
0, f
EG
R =
0)
A = 0
A = 15%
A = 45%
(c)
Turbine inlet pressure p 3
1.0
1.1
1.2
1.3
0 5 10 15 20 25 30EGR rate [%]
Tem
pera
ture
/ Te
mpe
ratu
refo
r (A
= 0
, fE
GR =
0)
A = 0
A = 15%
A = 45%
(d)Turbine inlet temperature T 3
0.84
0.88
0.92
0.96
1.00
0 5 10 15 20 25 30EGR rate [%]
Pre
ssur
e / P
ress
ure
for
(A =
0, f
EG
R =
0)
A = 0
A = 45%
A = 15%
(e)
In-cylinder maximum pressure p MAX
0.2
0.4
0.6
0.8
1.0
0 5 10 15 20 25 30EGR rate [%]
Tu
rbo
char
ger
sp
eed
/ T
urb
och
arg
er
spee
d fo
r (A
= 0
, fE
GR =
0)
(f)A = 0
A = 15%
A = 45%
Turbocharger rotational speed nTC
0.5
0.6
0.7
0.8
0.9
1.0
0 5 10 15 20 25 30EGR rate [%]
Air
mas
s flo
w r
ate
/ Air
mas
s flo
w
rate
for
(A =
0, f
EG
R = 0
)
(g)
A = 0 A = 45%
A = 15%
Intake air mass flow rate M a
0.4
0.5
0.6
0.7
0.8
0.9
1.0
0 5 10 15 20 25 30EGR rate [%]
Air
-fu
el r
atio
/ A
ir-f
uel
rat
iofo
r (A
= 0
, fE
GR =
0)
(h)
A = 0
A = 45%
A = 15%
Air-fuel ratio AFR
0.5
0.6
0.7
0.8
0.9
1.0
0 5 10 15 20 25 30EGR rate [%]
Tota
l mas
s flo
w r
ate
/ Tot
al m
ass
flo
w r
ate
for
(A =
0, f
EG
R = 0
) (i)A = 0
A = 15%
A = 45%
Engine total mass flow rate Mt
0.4
0.5
0.6
0.7
0.8
0.9
1.0
0 5 10 15 20 25 30EGR rate [%]
Gas
-fu
el r
atio
/ G
as-f
uel
rat
iofo
r (A
= 0
, fE
GR =
0)
(l)
A = 45%
A = 0
A = 15%
Gas-fuel ratio GFR

which results in a flame temperature reduction (thermal effect), and to the dilution of the inlet charge with adecrease in oxygen concentration (dilution effect) [22, 23]; though other phenomena are involved (chemicaleffects, changes in inlet charge temperature and in flame structure [22, 23]), thermal and dilution effect areconsidered the most significant to explain EGR influence on pollutants emissions variations, reducing NOx andincreasing particulate, HC and CO [22, 23, 24, 25].
Air-fuel and gas-fuel ratios (AFR and GFR) are useful to describe in-cylinder charge composition and todefine relative proportion of air, fuel and recirculated gas [20]; with reference to a single engine cycle, GFR isgiven by the ratio between the total mass of gas in the cylinder (mt) and the injected fuel mass (mf) and can beevaluated through [20]:
GFR = AFR ⋅ [1 + fb / (1 - fb)] (3)
where burned gas fraction (fb) is calculated with:
fb = fEGR ⋅ (1 - fr) + fr (4)
Residual gas fraction (fr) can be estimated on the basis of thermodynamics conditions at engine inletand exhaust and it is generally a few percent in Diesel engines [20].
In order to explain the influence of EGR and turbocharger control on pressure diagrams and heatrelease, it can be useful to analyse the behaviour of engine and turbocharger parameters measured duringexperimental activity, represented in fig.3 considering a part load operating condition (n = 1550 rev/min, bmep= 0.2 MPa), as a function of EGR rate and for three different WG settings (A = 0, 15 per cent and 45 per cent);measured data are expressed in terms of relative change, referred to the value obtained for EGR rate = 0 andA = 0 (i.e., WG fully closed).
From fig.3 it is apparent that the matching condition is affected not only by WG opening but also byEGR increasing, which have quite similar effect on the different parameters; generally, the most significantvariations are obtained when A changes from 0 to 15 per cent, even if air mass flow rate Ma, air-fuel ratio AFRand inlet temperature TA are much affected by EGR control. It has to remark that there is not a linearrelationship between A and relative changes in parameters, since the further WG opening from 15 to 45 percent has a very little effect, compared to the first step: this is due to the different sensitivity to the turbineregulating system, which results in a non-linear relationship between control variable A and turbine flow area,as shown in a previous study [10].
As the regulating device opens at constant EGR rate, the higher turbine swallowing capacity results ina reduced turbocharger speed (fig.3f), with decreased levels of both turbine inlet and engine intake (i.e., boost)pressure (p3 and pA, figs.3c and 3a, respectively). Engine air mass flow rate (Ma, fig.3g) is consequently lower:since there was no significant variations in fuel mass flow rate, air-fuel ratio shows the same trend (AFR,fig.3h). A reduction of total engine mass flow rate and gas-fuel ratio (Mt and GFR, figs.3i and 3l, respectively)also occurs; turbine inlet temperature increase (T3, fig.3d) is probably related to AFR decrease. Finally, lowervalues of maximum cylinder pressure (pMAX, fig.3e) can be explained considering that pA reduction causeslower pressure levels during the compression stroke; this trend is not modified by heat release during thepremixed phase and the first part of diffusion phase of combustion, which also influence pMAX, probablybecause the shifts between the different WG settings are small (see fig.5).
Similar considerations can be developed forincreasing EGR rate at constant A level: in this case itis apparent the growth of TA (fig.3b), due to the mixingof inlet air with hot recirculated gas, which, togetherwith AFR decrease, leads T3 (fig.3d) to higher levels;decreasing trends of Mt and GFR show lowergradients with respect to Ma and AFR, because theytake account of EGR mass flow rate, which of courseincreases in these conditions.
Combustion ratio (β, equation 5), is defined asthe ratio between fuel mass burned in the premixedphase of combustion (mp) and the total fuel massburned in a cycle (mf); its values were evaluatedthrough the processing of experimental heat releaserates described in point 4 and are presented in fig.4,with reference to the same operating condition, EGRrates and WG settings of fig.3. Since its definition,
0.08
0.16
0.24
0.32
0 5 10 15 20 25 30EGR rate [%]
Co
mb
ust
ion
rat
io
A = 0
A = 15%
A = 45% n = 1550 rev/min bmep = 0.2 MPa
Fig.4 – Influence of turbocharger and EGRcontrol on combustion ratio β

combustion ratio is strictly related to ignition delay and to the peak value of heat release during the premixedphase of combustion: at fixed engine speed and load, in fact, a longer ignition delay (due for example to areduction in pressure and/or temperature at the start of the fuel injection phase) results in a higher value of β(because more fuel mass enters the cylinder during delay, thus increasing mp) and in a higher peak level ofheat release at the start of combustion.
At constant EGR rate, increasing A results in a decrease of pA, while TA is nearly constant (figs.3a and3b): the higher levels of β shown in fig.4 are therefore probably due to lower pressure during compressionstroke and injection phase, resulting in longer ignition delay. A different trend can be noted if fEGR is increasedat constant A setting: ignition delay is probably shorter, because inlet charge temperature growth due to theuncooled EGR compensates for inlet pressure diminishing [20, 23], thus resulting in a reduced premixedphase of combustion and lower levels of β.
These considerations are confirmed by heat release rates, presented in figs. 5 and 6, always referredto the same operating condition (n = 1550 rev/min and bmep = 0.2 MPa): in order to point out the influence of
0.00
0.02
0.04
0.06
0.08
0.10
355 360 365 370 375 380 385 390 395Crank angle [deg]
Hea
t re
leas
e [d
eg-1]
A = 0
A = 15%
A = 45%
n = 1550 rev/min bmep = 0.2 MPa EGR rate = 0
a)
0.00
0.02
0.04
0.06
0.08
0.10
355 360 365 370 375 380 385 390 395Crank angle [deg]
Hea
t re
leas
e [d
eg-1]
A = 0
A = 15%
A = 45%
n = 1550 rev/min bmep = 0.2 MPa EGR rate = 15%
b)
0.00
0.02
0.04
0.06
0.08
0.10
355 360 365 370 375 380 385 390 395Crank angle [deg]
Hea
t re
leas
e [d
eg-1]
A = 0
A = 15%
A = 45%
c) n = 1550 rev/min bmep = 0.2 MPa EGR rate = 30%
Fig.5 – Influence of turbocharger control onheat release for constant EGR rate
Fig.6 – Influence of EGR control on heat releasefor constant waste-gate opening degree
0.00
0.02
0.04
0.06
0.08
0.10
355 360 365 370 375 380 385 390 395Crank angle [deg]
Hea
t re
leas
e [d
eg-1]
EGR rate = 0
EGR rate = 15%
EGR rate = 30%
n = 1550 rev/min bmep = 0.2 MPa A = 0
a)
0.00
0.02
0.04
0.06
0.08
0.10
355 360 365 370 375 380 385 390 395Crank angle [deg]
Hea
t re
leas
e [d
eg-1]
EGR rate = 0
EGR rate = 15%
EGR rate = 30%
b) n = 1550 rev/min bmep = 0.2 MPa A = 15%
0.00
0.02
0.04
0.06
0.08
0.10
355 360 365 370 375 380 385 390 395Crank angle [deg]
Hea
t re
leas
e [d
eg-1]
EGR rate = 0
EGR rate = 15%
EGR rate = 30%
c) n = 1550 rev/min bmep = 0.2 MPa A = 45%

the control variables, the same data are shown at constant fEGR for the three considered WG settings (fig.5)and for fixed A levels with EGR rate as parameter (fig.6). As it might be expected after discussing figs.3 and 4,maximum heat release in premixed phase of combustion grows as WG opens (that is, for higher A levels,fig.5), while it reduces when EGR rate grows: the highest value is obtained for A = 45 per cent and no EGR,the lowest for EGR rate = 30 per cent and A = 0.
Combustion duration is longer for lower A settings and higher EGR rates: in the first case the smallerfuel mass burned during premixed phase requires a longer diffusion phase to complete the combustion, whileEGR activation probably leads to a change in the flame structure (flame length, number of ignition sites andtheir spatial distribution, etc. [22]) which results in a reduced velocity of oxidation processes.
Fig.7 – Influence of EGR control on in-cylinder pressure and heat release for three engine speed at constantload
It may be concluded that both turbocharger and EGR control strongly affect engine behaviour andcombustion phenomena, while showing an interesting potential to improve engine performance and emissions[10, 12]; anyway, in order to develop a combustion correlation (point 4), in a first step it seemed moresignificant to take account of EGR influence only, since its effects on combustion process are complex [20, 21,22, 23, 24, 25]: the wider part of the experimental activity was therefore dedicated to in-cylinder pressure
2
4
6
8
10
350 360 370 380 390 400Crank angle [deg]
Cyl
ind
er p
ress
ure
[M
Pa]
EGR rate = 0EGR rate = 5%EGR rate = 15%EGR rate = 27%
a)
n = 1800 rev/min bmep = 0.4 MPa
0.00
0.02
0.04
0.06
0.08
0.10
0.12
350 360 370 380 390 400Crank angle [deg]
Hea
t re
leas
e [d
eg-1]
EGR rate = 0EGR rate = 5%EGR rate = 15%
EGR rate = 27%
b) n = 1800 rev/min bmep = 0.4 MPa
2
4
6
8
10
350 360 370 380 390 400Crank angle [deg]
Cyl
ind
er p
ress
ure
[M
Pa]
EGR rate = 0EGR rate = 5%EGR rate = 15%EGR rate = 27%
c)
n = 2250 rev/min bmep = 0.4 MPa
0.00
0.02
0.04
0.06
0.08
0.10
0.12
350 360 370 380 390 400Crank angle [deg]
Hea
t re
leas
e [d
eg-1]
EGR rate = 0
EGR rate = 5%EGR rate = 15%
EGR rate = 27%
d) n = 2250 rev/min bmep = 0.4 MPa
2
4
6
8
10
350 360 370 380 390 400Crank angle [deg]
Cyl
ind
er p
ress
ure
[M
Pa]
EGR rate = 0EGR rate = 5%EGR rate = 15%EGR rate = 27%
e)
n = 2500 rev/min bmep = 0.4 MPa
0.00
0.02
0.04
0.06
0.08
0.10
0.12
350 360 370 380 390 400Crank angle [deg]
Hea
t re
leas
e [d
eg-1]
EGR rate = 0EGR rate = 5%EGR rate = 15%
EGR rate = 27%
f) n = 2500 rev/min bmep = 0.4 MPa
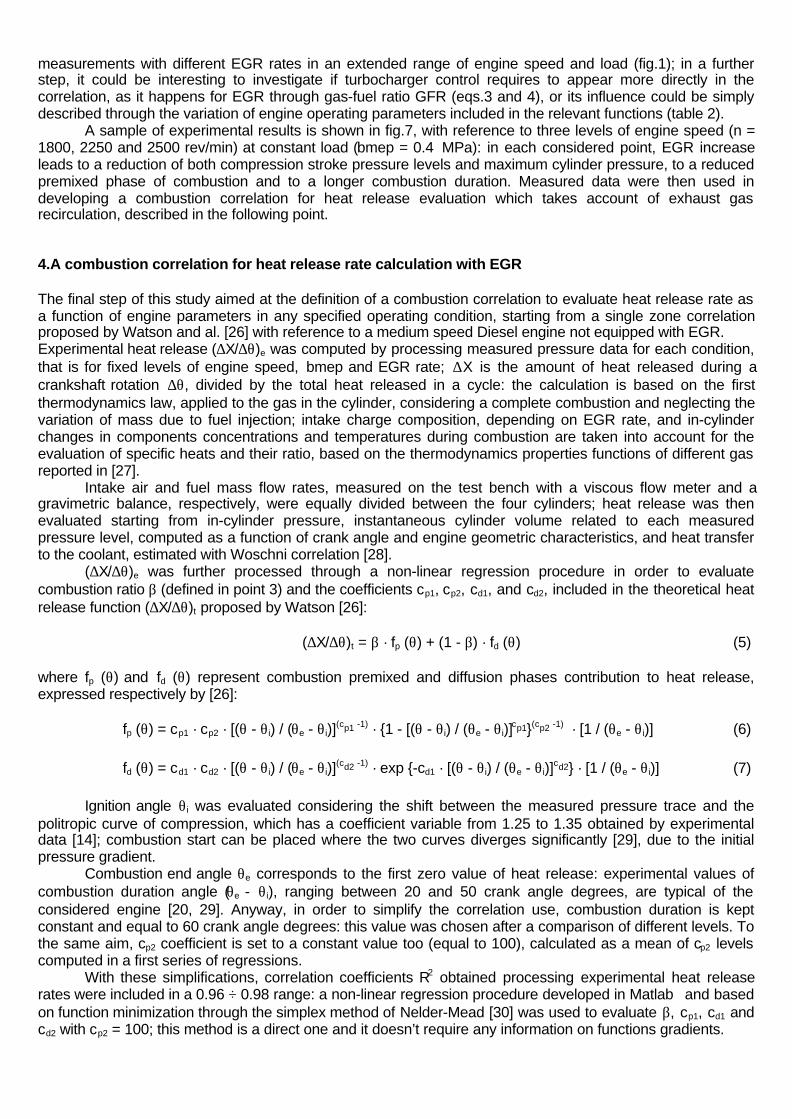
measurements with different EGR rates in an extended range of engine speed and load (fig.1); in a furtherstep, it could be interesting to investigate if turbocharger control requires to appear more directly in thecorrelation, as it happens for EGR through gas-fuel ratio GFR (eqs.3 and 4), or its influence could be simplydescribed through the variation of engine operating parameters included in the relevant functions (table 2).
A sample of experimental results is shown in fig.7, with reference to three levels of engine speed (n =1800, 2250 and 2500 rev/min) at constant load (bmep = 0.4 MPa): in each considered point, EGR increaseleads to a reduction of both compression stroke pressure levels and maximum cylinder pressure, to a reducedpremixed phase of combustion and to a longer combustion duration. Measured data were then used indeveloping a combustion correlation for heat release evaluation which takes account of exhaust gasrecirculation, described in the following point.
4.A combustion correlation for heat release rate calculation with EGR
The final step of this study aimed at the definition of a combustion correlation to evaluate heat release rate asa function of engine parameters in any specified operating condition, starting from a single zone correlationproposed by Watson and al. [26] with reference to a medium speed Diesel engine not equipped with EGR.Experimental heat release (∆X/∆θ)e was computed by processing measured pressure data for each condition,that is for fixed levels of engine speed, bmep and EGR rate; ∆X is the amount of heat released during acrankshaft rotation ∆θ, divided by the total heat released in a cycle: the calculation is based on the firstthermodynamics law, applied to the gas in the cylinder, considering a complete combustion and neglecting thevariation of mass due to fuel injection; intake charge composition, depending on EGR rate, and in-cylinderchanges in components concentrations and temperatures during combustion are taken into account for theevaluation of specific heats and their ratio, based on the thermodynamics properties functions of different gasreported in [27].
Intake air and fuel mass flow rates, measured on the test bench with a viscous flow meter and agravimetric balance, respectively, were equally divided between the four cylinders; heat release was thenevaluated starting from in-cylinder pressure, instantaneous cylinder volume related to each measuredpressure level, computed as a function of crank angle and engine geometric characteristics, and heat transferto the coolant, estimated with Woschni correlation [28].
(∆X/∆θ)e was further processed through a non-linear regression procedure in order to evaluatecombustion ratio β (defined in point 3) and the coefficients cp1, cp2, cd1, and cd2, included in the theoretical heatrelease function (∆X/∆θ)t proposed by Watson [26]:
(∆X/∆θ)t = β · fp (θ) + (1 - β) · fd (θ) (5)
where fp (θ) and fd (θ) represent combustion premixed and diffusion phases contribution to heat release,expressed respectively by [26]:
fp (θ) = cp1 · cp2 · [(θ - θi) / (θe - θi)](cp1 -1) · {1 - [(θ - θi) / (θe - θi)]
cp1}(cp2 -1) · [1 / (θe - θi)] (6)
fd (θ) = cd1 · cd2 · [(θ - θi) / (θe - θi)](cd2 -1) · exp {-cd1 · [(θ - θi) / (θe - θi)]
cd2} · [1 / (θe - θi)] (7)
Ignition angle θi was evaluated considering the shift between the measured pressure trace and thepolitropic curve of compression, which has a coefficient variable from 1.25 to 1.35 obtained by experimentaldata [14]; combustion start can be placed where the two curves diverges significantly [29], due to the initialpressure gradient.
Combustion end angle θe corresponds to the first zero value of heat release: experimental values ofcombustion duration angle (θe - θi), ranging between 20 and 50 crank angle degrees, are typical of theconsidered engine [20, 29]. Anyway, in order to simplify the correlation use, combustion duration is keptconstant and equal to 60 crank angle degrees: this value was chosen after a comparison of different levels. Tothe same aim, cp2 coefficient is set to a constant value too (equal to 100), calculated as a mean of cp2 levelscomputed in a first series of regressions.
With these simplifications, correlation coefficients R2 obtained processing experimental heat releaserates were included in a 0.96 ÷ 0.98 range: a non-linear regression procedure developed in Matlab and basedon function minimization through the simplex method of Nelder-Mead [30] was used to evaluate β, cp1, cd1 andcd2 with cp2 = 100; this method is a direct one and it doesn’t require any information on functions gradients.

In the following phase the independent variables of the correlation were selected: many engineparameters were considered (engine speed, air-fuel ratio, gas-fuel ratio, ignition delay, air mass flow rate,bmep, inlet temperature and pressure, ignition pressure) expressing their relationship with β, cp1, cd1 and cd2
through different analytical function (exponential, power, etc.); the same non-linear regression procedurebased on Nelder-Mead simplex method was used in this step. It must be noted that in this experimental workignition delay was not measured, but it was calculated on the basis of engine injection timing: its values weretherefore roughly estimated, because the real injector behaviour was not taken into account.
Since the correlation would be applied in the engine-turbocharger simulation model, the choice of theindependent variables (engine speed n, gas-fuel ratio GFR and ignition delay τid) takes account not only of thebest data fitting but also of their availability in the simulation code: the relevant functions are reported in table2, together with R2 values.
Functions R2
β = 0.47 · exp [-1.44 · n 0.505 / (τid 0.587 · GFR 1.406)] 0.856
cp1 = 0.577 + 1.042 · n 0.044 · β 0.176 / (GFR 0.119 · τid 0.170) 0.761
cp2 = 100 -cd1 = 13.86 · n 0.022 · β 0.607 · GFR 0.143 / τid
0.193 0.847cd2 = 0.015 · exp [3.217 · n 0.039 · cd1
0.074 / (τid 0.014 · GFR 0.029)] 0.934
Table 2 – Heat release rate correlation
The correlation appears to be more complex than Watson one [26]: this is probably due to EGR, sinceit seems quite difficult to describe its influence on combustion by a mathematical point of view. Anyway it ispossible to evaluate theoretical heat release rate for any considered engine operating condition and, byapplying first thermodynamics law, to estimate cylinder pressure during combustion.
Fig.8 – Comparison between experimental and calculated values of in-cylinder pressure and heat release(operating condition: n = 2430 rev/min, bmep = 0.47 MPa)
-4
0
4
8
12
355 365 375 385 395 405
Crank angle [deg]
Cyl
ind
er p
ress
ure
[M
Pa]
0.00
0.04
0.08
0.12
0.16
Hea
t re
leas
e [d
eg-1]
Experimental
Calculated
EGR rate = 0
(a)
-4
0
4
8
12
355 365 375 385 395 405
Crank angle [deg]
Cyi
lind
er p
ress
ure
[M
Pa]
0.00
0.04
0.08
0.12
0.16
Hea
t re
leas
e [d
eg-1]
Experimental
Calculated
EGR rate = 2.5 %
(b)
-4
0
4
8
12
355 365 375 385 395 405
Crank angle [deg]
Cyl
ind
er p
ress
ure
[M
Pa]
0.00
0.04
0.08
0.12
0.16
Hea
t re
leas
e [d
eg-1]
Experimental
Calculated
EGR rate = 11.3 %
(c)
-4
0
4
8
12
355 365 375 385 395 405
Crank angle [deg]
Cyi
lind
er p
ress
ure
[M
Pa]
0.00
0.04
0.08
0.12
0.16
Hea
t re
leas
e [d
eg-1]
Experimental
Calculated
EGR rate = 24.1 %
(d)

A comparison between experimental and calculated values of heat release and pressure was thenperformed: results for one part load operating point (n = 2430 rev/min, bmep = 0.47 MPa) are shown in fig.8,with reference to the considered EGR rates; estimated values are in good agreement with measured ones,and the correlation seems to be able to reproduce some of the characteristics due to EGR activation, such asthe reduction of peak pressure and of maximum heat release in the premixed phase when fEGR increases. Thehigher shift between experimental and calculated heat release is evident in fig.8d (EGR rate = 24.1 per cent),during the premixed phase and in the first part of the diffusion phase: as a consequence maximum pressureshows the higher difference, being measured pMAX equal to 8.91 MPa, while calculated pMAX is 8.53 MPa, witha 4.3 per cent error.
This is generally true for each considered operating condition: shift between experimental andcalculated values are more significant for the highest EGR rates; a wider range of fEGR in the experimentalactivity could help to improve this aspect of the correlation behaviour.
Notwithstanding measurements were performed on a DI Diesel engine fitted with a mechanicaldistributor pump and with some limitations in the experimental apparatus, the proposed correlation seems tobe quite interesting, because its development allows to deepen some phenomena involved in combustionprocesses and to define a procedure which can be applied, with proper enhancements, to different engines, inorder to evaluate theoretical heat release rate, also in presence of exhaust gas recirculation.
Conclusions
Automotive turbocharged DI Diesel engine are a widespread choice in European market and a further growthof their diffusion is expected in a few years [2]: typical layout are quite complex by now, and simulation modelsare useful tools in order to study the different aspects involved in their working conditions and to developupdated configurations; particular interest is devoted to control applications models, since components suchas fuel injection, turbocharging and EGR systems require proper regulating strategies in order to fulfil thedifferent objectives (performance, fuel consumption and emissions), to exploit their potential and to managethe reciprocal interactions. Since required calculation time is short and a wide range of operating conditionsare to be simulated (including different turbine VG or WG settings, EGR rates, etc.), it is essential to describeinvolved process in a simple but reliable way.
The work described in this paper goes in this direction: with reference to an automotive turbochargedDI Diesel engine, fitted with a mechanical distributor injection pump, an exhaust waste-gated turbocharger, anintercooler and an uncooled EGR system, it was aimed at the development of two correlation, the first toevaluate mechanical losses, in terms of friction mean effective pressure, as a function of maximum cylinderpressure and mean piston speed, the second to calculate heat release rate as a function of engine speed,gas-fuel ratio and ignition delay. These correlation are based on in-cylinder pressure diagrams measurements,developed during a wide experimental activity performed on the engine test bench of the Dipartimento diMacchine, Sistemi Energetici e Trasporti (DIMSET) of the University of Genova.
Moreover, the study allowed to deepen the influence of turbocharger and EGR control on engineoperating parameters and on combustion process, which is extensively described in the paper: trend ofseveral quantities (intake and exhaust pressures and temperatures, maximum cylinder pressure, turbochargerrotational speed, intake air and in-cylinder total mass flow rates together with the related air-fuel and gas-fuelratios) are presented with reference to different WG opening degrees and EGR rates: the analysis of theirbehaviour permit to justify the observed changes in heat release rate, obtained by processing measuredpressure diagrams.
The proposed procedure will be improved and applied to a DI Diesel engine recently installed onDIMSET test bench, which is equipped with an electronically controlled common rail FIS and with an opencontrol system: in-cylinder pressure diagrams will give interesting information on engine control, whoseinvestigation will be extended to other control variables such as fuel injection parameters (i.e., injectionsnumber, timing and rate).
Nomenclature
Notationbmep brake mean effective pressure M mass flow ratef function, mass fraction P powerfmep friction mean effective pressure S strokeimep indicated mean effective pressure T temperature [K]

m mass V instantaneous cylinder volumen engine speed, rotational speed VG variable geometryp pressure WG waste-gateu piston speed X heat releaseA waste-gate valve opening degree β combustion ratioAFR air-fuel ratio θ crank angleB bore ρ volumetric compression ratioEGR exhaust gas recirculation τ timeFSN Filter Smoke Number ∆ variationGFR gas-fuel ratio
Subscript3 turbine inlet p premixeda air r residualb burned t total, theoreticald delay, diffusion A engine intakee end, experimental EGR exhaust gas recirculationf fuel MAX maximumi ignition TC turbochargerm mean
References
[1] Capobianco M., Improvement of Automotive Diesel Engine for the 21st Century Challenge, InternationalConference on Advances in Vehicle Control and Safety, AVCS’98, Amiens, 1998.
[2] Rinolfi R., Piccone A., Future Engine Technologies, 4th International Conference “Internal CombustionEngines: Experiments and Modeling”, ICE 99, Capri-Napoli, 1999.
[3] Ibagian P., Surveying the Future, Fisita Global Automotive Network, Issue 2, June 1999.[4] Bursa M., Decision Time for CARB as Evs Reach End of the Road, ISATA Magazine, April 2000.[5] Ponticel P., Fueling the Fuel Cell, Automotive Engineering International, March 2000.[6] Boggio F., Cavallino F., Saroglia G. P., Fuel Consumption and Emission Reduction Entering the XXI
Century, 6th International Conference Florence ATA 1999, The New Role of Experimentation in theModern Automotive Product Development Process, 1999.
[7] Rinolfi R., Imarisio R., Buratti R., The Potentials of a New Common Rail Diesel Fuel Injection System forthe Next Generation of DI Diesel Engines, 16th International Wien Motor Symposium, VDI-Verlag Reihe12, no.239, 1995.
[8] Stumpp G., Ricco M., Common Rail - An Attractive Fuel Injection System for Passenger Car DI DieselEngines, SAE Paper 960870, 1996.
[9] Capobianco M., Gambarotta A., Zamboni G., Experimental Characterisation of Turbocharging and EGRSystems in an Automotive Diesel Engine, 3rd International Seminar on Application of Powertrain and FuelTechnologies to Meet Emissions Standards for the 21st Century, paper C517/027/96, Institution ofMechanical Engineers, London, 1996.
[10] Capobianco M., Gambarotta A., Zamboni, G., Controlling Turbocharging and EGR System To ImproveExhaust Aftertreatment Conditions in an Automotive Diesel Engine, 6th International Conference onTurbocharging and Air Management Systems, paper C554/004/98, Institution of Mechanical Engineers,London, 1998.
[11] Capobianco M., Gambarotta A., A Theoretical Simulation Model of a Direct Injection Diesel Engine forControl Applications, Proceedings of the 6th IEEE Mediterranean Conference on Theory and Practice ofControl and Systems, Alghero, 1998.
[12] Capobianco M., Gambarotta. A., Silvestri P., Zamboni G., Turbocharger and EGR Control Strategies in anAutomotive DI Diesel Engine, 2nd International Conference on “Control and Diagnostics in AutomotiveApplications”, CDAUTO98, Genova, 1998.
[13] Zamboni G., EGR Influence on NOx and Smoke Emissions in an Automotive Diesel Engine, InternationalConference on Advances in Vehicle Control and Safety, AVCS '98, Amiens, 1998.
[14] Randolph A. L., Methods of Processing Cylinder-Pressure Transducer Signals to Maximize DataAccuracy, SAE Paper 900170, 1990.
[15] Otnes R. K., Enochson L., Applied Time Series Analysis, Vol. 1, Basic Techniques, John Wiley and Sons,New York, 1978.

[16] Gish R. E., McCullough J. D., Retzloff J. B., Mueller H. T., Determination of True Engine Friction, SAETransactions, vol.66, pages 649 ÷ 667, 1958.
[17] Winterbone D.E., Tennant D.W.H., The Variation of Friction and Combustion Rates During Diesel EngineTransients, SAE paper no.810339, 1981.
[18] Horlock J. H., Winterbone D.E., The Thermodynamics and Gas Dynamics of Internal CombustionEngines, Clarendon Press, Oxford, 1986.
[19] Watson N., Janota M. S., Turbocharging the Internal Combustion Engine, MacMillan Press Ltd., London,1982.
[20] Heywood J. B., Internal Combustion Engine Fundamentals, Mc Graw-Hill, New York, 1988.[21] Herzog P., Burgler L., Winklhofer E., Zelenka P., Cartellieri W. P., NOx Reduction Strategies for DI Diesel
Engines, SAE paper 920470, 1992.[22] Plee S. L., Ahmad T., Myers J. P., Flame Temperature Correlation for the Effects of Exhaust Gas
Recirculation on Diesel Particulate and NOx Emissions, SAE paper 811195, 1981.[23] Ladommatos N., Abdelhalim S. M., Zhao H., The Effects of Carbon Dioxide in EGR on Diesel Engine
Emissions, 3rd International Seminar on Application of Powertrain and Fuel Technologies to MeetEmissions Standards for the 21st Century, paper C517/028/96, Institution of Mechanical Engineers,London, 1996.
[24] Arcoumanis C., Nagwaney A., Hentschel W., Ropke S., Effect of EGR on Spray Development,Combustion and Emissions in a 1.9 l Direct-Injection Diesel Engine, SAE paper 952356, 1995.
[25] Shiozaki T., Nakajima H., Kudo Y., Miyashita A., Aoyagi Y., The Analysis of Combustion Flame underEGR Conditions in a DI Diesel Engine, SAE paper 960323, 1996.
[26] Watson N., Pilley A. D., Marzouk M., A Combustion Correlation for Diesel Engine Simulation, SAE paper800029, 1980.
[27] Benson R. S., Whitehouse N. D., Internal Combustion Engines, Pergamon Press, Londra, 1979.[28] Woschni G., A Universally Applicable Equation for the Instantaneous Heat Transfer Coefficient in the
Internal Combustion Engine, SAE paper 670931, 1967.[29] Plint M., Martyr A., Engine Testing: Theory and Practice, Butterworth-Heinemann, Oxford, 1996.[30] Nelder J. A., Mead R., A Simplex Method for Function Minimization, Computer Journal, Vol.7, pages 308-
313, 1996.