evaluating transit quality of service for transit oriented ... · deepti muley, dr. jonathan...
TRANSCRIPT

Evaluating transit Quality of Service for Transit Oriented Development (TOD)
30th Australasian Transport Research Forum Page 1
Evaluating transit Quality of Service for Transit O riented Development (TOD) Deepti Muley, Dr. Jonathan Bunker, Prof. Luis Ferreira Queensland University of Technology, Brisbane, QLD, Australia
1 Introduction
Transit Oriented Development (TOD) is widely considered to be an effective form of sustainable development. TOD can be defined as moderate to higher – density development, located within an easy walk of a major transit stop, generally with a mix of residential, employment and shopping opportunities designed for pedestrians, without necessarily excluding the car. TOD can be new construction or redevelopment of one or more buildings whose design and orientation facilitate transit (public transport) use (Parker et al., 2002). To obtain transport efficiency TOD should be facilitated by high quality frequent transit service and give preference to walking and cycling. It is argued by many authors that this reduces vehicle kilometres travelled (VKT) leading to reduced congestion and pollution. Apart from the transport aspect, TOD is said to provide affordable housing, and nearby shopping facilities and places of work. Mixed land use is said to enhance economic opportunities in the vicinity of the TOD. TODs also feature liveable environments including parks, open spaces and other recreational facilities. The South East Queensland Regional Plan includes TODs as a means of sustaining the high growth rate of 55,000 new residents per year expected in the coming 20 years (2.7 million in 2006 to 3.6 million in 2026; Queensland Government, 2006). According to a Queensland Government forecast, the vehicle kilometres travelled (VKT) will increase by 1.9% per annum against an estimated population growth of only 1.7% per annum from 2001 through to 2026 (Queensland Transport, 2005). This paper deals with evaluation of TODs with particular respect to the transit quality of service (QoS). Two principal sets of QoS indicators are provided in a framework in the US Transportation Research Board’s Transit Capacity and Quality of Service Manual (TCQSM) (TRB, 2003). These sets fall within availability, and comfort and convenience. This paper deals with the availability indicators. Kelvin Grove Urban Village (KGUV) in Brisbane, Australia is used as a case study mixed use development. KGUV was tested for its suitability as a case study TOD by evaluating its transit Availability indicators of QoS. Further the details of case study area are given in section 3.
2 Previous Studies of TOD
Most of the studies on TOD transport matters found in the literature were sourced from the United States. TOD has generally been characterised by mix of land use, high density, walkable design and reduced need use of personalised mode of transport due to concentrated places of interest and good transit availability. As a combined effect of these, the travel characteristics of people living in a TOD will differ from those of conventional development. Many studies have addressed the effect of these characteristics on the travel of people living with a TOD. Some studies have shown that urban densities, traditional neighbourhood schemes and land use mix have a substantial impact on car ownership and use, while others have shown a marginal impact (Badoe and Miller, 2000).

Evaluating transit Quality of Service for Transit Oriented Development (TOD)
30th Australasian Transport Research Forum Page 2
Dock and Swenson (2003) modelled the effect of change in land use on travel demand by using existing regional travel demand models with three improvements, concluding that the TOD scenario represents a more efficient pattern of trip making. It was discussed, however, that TOD should be modelled separately considering its characteristics and its development pattern rather than using the existing regional models. Lund et al. (2004) studied the travel characteristics of people living in TODs with that of the characteristics before development. The study was based on the data collection and comparison with previous records. Transit mode share is an important parameter for the success of TOD. Hendricks (2005) argued that if there is poor transit service, the land use qualities will never influence a shift of mode share to transit. Some people will live and work in a TOD, but some people may not like to live near places of their work so they may travel for work. Many studies have observed that with TOD the mode shares of non – work trips have significantly shifted towards walking, cycling and transit (Cervero and Radisch, 1996; Rajamani et al., 2003). Zhang (2005) found that, when the accessibility was changed, the travel time and trip frequency also changed for non work travel in a TOD. Meanwhile, Messenger and Edwing (1996) found that for work trips, the bus mode share by place of work was related to the cost of parking, transit access to downtown and overall density. Chatman (2003) concluded that workplace density is directly associated with reduced personal commercial vehicle miles travelled (VMT) regardless of mode choice. Schlossberg and Brown (2004) developed 12 geographic information system (GIS) based measures to visualise and quantify pedestrian environments at various TOD sites; these measures were useful for planning a TOD. TOD is the stated outcome of various land use policies for reducing the need of travel and use of personalised mode of transport. However, none of the studies has detailed the method for calculation of travel demand and level of containment of trips within TOD. And limited attention has been paid to the effect of transit accessibility on the performance of TOD in a travel demand sense.
3 Aim of this study
Past literature lacks an appropriate methodology to properly model travel demand of a TOD, which is proposed as the overall aim of this research project. The travel demand model based on four step planning method helps to determine the travel demand and assess the travel characteristics of people living in a TOD based on vehicle kilometres travelled (VKT), mode shares, walkability indices, travel speeds, trip lengths and level of containment of trips within a TOD. The combined effect of all the characteristics of TOD on travel characteristics will be studied rather than using one at a time and will be compared with traditional Australian urban development. To achieve this overall aim, a case study TOD which has good transit service is essential for research on inhabitants’ travel behaviour. As stated earlier, a candidate case study mixed use development, the Kelvin Grove Urban Village (KGUV), has been selected. The aim of this paper is then to evaluate the QoS of transit for this mixed use development, using the accessibility indicators from the framework provided in the TCQSM (TRB, 2003), in order to better appreciate whether it has the appropriate transit availability to support its function as a true TOD. The comfort and convenience indicators will be examined in future research. This will then validate, or otherwise, the perception that KGUV is a worthwhile TOD to study in terms of travel demand.

Evaluating transit Quality of Service for Transit Oriented Development (TOD)
30th Australasian Transport Research Forum Page 3
In future research, once the future travel demand study has been completed, the contribution of QoS towards the success of a TOD as measured using the various indicators of the TCQSM QoS framework can be confirmed and reconsidered as necessary.
4 Understanding KGUV as a TOD
Kelvin Grove Urban Village (KGUV) is a 16.57 Ha sustainable and mixed use development situated in the inner Brisbane suburb of Kelvin Grove approximately 2km northwest of central business district (CBD). It has been developed as a joint venture between the Queensland Department of Housing and Queensland university of Technology (QUT) based on ecological sustainable development (ESD) principles. It is surrounded by Spring Hill, Herston, Red Hill, Newmarket and Wilston. The mixed use development consists of educational, residential, commercial, recreational and administrative functions. Young, single students and workers are expected to comprise the majority of the population. KGUV is an educational based mixed use development comprised of four distinct precincts; the village centre, QUT Kelvin Grove campus extension, QUT’s Institute of Health and Biomedical Innovation (IHBI), and QUT’s Creative Industries Precinct. The building height varies between 4 and 7 stories. The details of mixed uses are as shown in Table 1.
Table 1 Details of mixed land uses in Kelvin Grove Urban Village
Type of land use
Size Details
Residential 35,668sqm Includes affordable accommodation, managed accommodation for seniors, student accommodation, investor apartments, townhouses (900 residential units including 200 affordable housing units)
Educational 14,770sqm QUT campus extension, Student accommodation for 455 students on Victoria park road
Retail Not Available
Village Centre, Street level shops, catering for extended hour demand
Commercial 3,878sqm
Creative industries precinct, Institute of Health and Biomedical Innovation, health services and standard commercial office facilities & tenancies with opportunity to implement innovative structures
Lifestyle 6897sqm La Boite Theatre, Victoria Park golf course, Network of parks
Mixed 11,995sqm 26,014sqm
Mixed use area for residential, commercial and retail places Mixed use area for educational and commercial places
Figure 1 shows KGUV and its proximate transit stops (development has occurred on the site since the photograph was taken). The development is well connected to arterial roads and has grid pattern internal street network. KGUV has three transit corridors to cater for residents and visitors:
• The Inner Northern Busway is located on the eastern flank of the QUT campus. • Kelvin Grove Road is located on the western flank of KGUV. Many of its services
leave the Busway at Normanby immediately to the south. • The QUT intercampus shuttle service operates along Musk Avenue within QUT KG
campus/KGUV and runs express to QUT Gardens Point (City) campus 3.5km to the south.

Evaluating transit Quality of Service for Transit Oriented Development (TOD)
30th Australasian Transport Research Forum Page 4
Table 2 identifies the stops and describes the bus routes observing them.
Fig. 1 Kelvin Grove Urban Village with transit stop s
There are six main types of services operating on these corridors;
• Buz (routes 333, 345), which are very high frequency buses with limited stops (10 minutes – 15 minutes, long hours).
• Express buses (routes 330, 340, 357, 359, 376), which are high frequency buses with limited stops (10 minutes – 15 minutes).
• City precincts (route 344), which stop at limited stops and run only at peak time. • Rocket buses (route 351), which stop only at few specific stops and run only at peak
time. • All-stops buses (routes 361, 364), which stop at all bus stops on that route across the
day. • Links (route 393, 680), which are linked to other modes of transport such as train and
/ or ferry at transfer stations. • Special purpose QUT intercampus shuttle service (routes 391, 392) targeted to QUT
students and staff members.
Vision Statement: A diverse city fringe community, linking learning with enterprise, creative industry with community….creating a new part of Brisbane that offers unique living solutions. (Integrated master plan, 2004 )

Evaluating transit Quality of Service for Transit Oriented Development (TOD)
30th Australasian Transport Research Forum Page 5
Table 2 Buses Observing Transit Stops in Study Area
Stop Location Routes
Destination
ST1 QUT Kelvin Grove Busway station
330e, 333b, 340e, 376e, 392e, 393l, 680l
Inbound to city and outbound to northern
suburbs ST2 Victoria Park road 361a, 364a
Local bus stop
ST3 Musk Avenue ST4 Near IHBI 391e
QUT intercampus shuttle service
ST5 Kelvin Grove road at Blamey Street
Inbound to city
ST7 Kelvin Grove road at Prospect Terrace
344cp, 345b, 351r, 357e, 359e, 390a
Outbound to northern
suburbs ST6 Kelvin Grove road at
School street 390a, 364a Local bus stop
ST8 Normanby Busway station 330e, 333b, 340e, 344cp, 345b,
351r, 357e, 359e, 376e, 390a, 393l
Inbound to city and outbound to northern
suburbs Note: The suffix to the bus numbers indicates type of bus service Generally TOD developments are planned around a major transit node. As the distance from the node increases the density often decreases. However, KGUV does not have a major transit node at its centre; rather, transit services are available along the corridors mentioned above. Although the three main bus corridors suggest good public transport coverage, the QoS needs to be assessed further. The analysis for the availability criteria of the QoS framework for KGUV is presented in the following section.
5 Evaluation using Quality of Service (QoS) Framewo rk
5.1 Analytical background
The quality of service (QoS) was analysed by using the framework described in the Transit Capacity and Quality of Service Manual (TRB, 2003). A QoS framework is a tool for assessing effectiveness or usefulness of transit systems. The QoS for a transit facility is the measure of performance of the system within a particular area from the passenger’s point of view. The performance measures used for evaluating the QoS can be qualitative or quantitative in nature. The QoS framework given in the TCQSM (TRB, 2003) is shown in Table 3. The analysis for QoS for a transit facility is based on the type of service provided for the transit system; either fixed-route service or demand-responsive service. The QoS framework is divided into “Availability” and “Comfort and Convenience” measures. A primary measure of QoS is assigned to each of these attributes, at three levels of scale; for individual transit stops, for route segments / corridors, and for the whole system. The QoS is determined by calculating the level of service (LOS) separately for each parameter. The LOS is graded between A to F scale with “A” being best and “F” being the worst scenario. Various performance measures used are listed in Table 3.

Evaluating transit Quality of Service for Transit Oriented Development (TOD)
30th Australasian Transport Research Forum Page 6
Table 3 Quality of service framework: Fixed – Route (TRB, 2003, Exhibit 3–1)
Service Measures
Stop Corridor (Route Segment)
System
Availability Frequency
Hours of service Service coverage
Comfort and convenience
Passenger Load
Reliability Transit – Auto Travel time
5.1.1 Analysis for Availability
“Availability” estimates how accessible the service is to the passengers, whenever required, without considerable waiting time and walking distance. For transit stops, availability is measured by service frequency of the transit service. The service frequency is calculated by considering various destinations from a particular transit stop. Several routes serving the same destination and available from a particular transit stop can be combined for analysis. According to the TCQSM (TRB, 2003), buses serving the same destination and arriving at a stop within three minutes of each other are counted as one bus for calculation of service frequency. Bus services to different destinations from a particular transit stop should not be combined for calculation of service frequency. The LOS is determined using values of average headway or average frequency. For route segments or corridors, availability is measured by service span (hours of service) for a transit service between two locations during the entire day. This is to check whether service is provided whenever it is needed. Service span is calculated by route rather than by trip. When the service is provided at least once in an hour then an extra hour is added to the calculated service span. This additional one hour takes into account the last hour of the service provided. For the system, availability is measured by the service covered area, which is the percentage of the inhabited area within walking distance of a transit stop. This analysis can be done in two ways; either using a Geographical Information System (GIS) or a manual method. The GIS method involves drawing circular buffers of 400m (for a bus stop) and 800m (for a premium node such as a busway or railway station) around the transit stop or station. These buffers of 400m and 800m represent the normal walking distance for the passengers using the transit service; corresponding to 5 minutes and 10 minutes walk respectively. In the manual method, the actual transit service radius is calculated by using a street connectivity factor, grade factor, population factor and a pedestrian crossing factor. A physical (actual) map is observed for determination of values of these factors. Alternatively, actual walk buffers may be determined. All three measures are useful for evaluating the availability of transit service to the potential passengers within a case study area such as KGUV. Evaluation using these measures has been performed in order to better appreciate whether the KGUV mixed use development has the appropriate transit availability to support its function as a true TOD.
5.1.2 Analysis for comfort and convenience
“Comfort and convenience” is the standard or quality of service provided; including comfort onboard, reliability for the service, and comparative journey time (TRB, 2003).

Evaluating transit Quality of Service for Transit Oriented Development (TOD)
30th Australasian Transport Research Forum Page 7
For transit stops, comfort and convenience is measured by passenger loads onboard, determined by calculating the load factor and / or standing passenger area during the study period/s. These require knowledge of the characteristics of the buses observing the stop and the number of passengers onboard. For route segments or corridors, comfort and convenience is measured by reliability; either on-time performance, or headway adherence. On time performance measures the percentage of buses maintaining their time within 5 minutes of schedule along the route. Buses arriving early are not counted as on time. Headway adherence is used to determine the reliability of transit services operating at headways of ten minutes or less, and is based on the coefficient of variation of headways. For the system, comfort and convenience is measured by the travel time difference between a door to door trip made by car and the same trip made by using transit. For car, the travel time includes in vehicle time, parking time, walking time from parking to destination and for transit, the travel time includes the time taken by the user to reach bus stop, waiting time, time on the bus, walking time to the destination and the transfer time if applicable. For a system a basket of trips may be used during a given day or across a number of days. All three measures are useful for evaluating the comfort and convenience of transit service to the potential passengers within a case study area such as KGUV. Evaluation using these measures is more data intensive than the availability measures, and is to be performed in future research as part of this project.
5.2 Analysis of Transit Availability for KGUV
A TOD is a compact area with increased population density and employment opportunities and some people may live and work in the TOD, however others will live there and work offsite, while others still will live off site and visit the TOD for work, shopping, education or recreational purpose. This is expected to be the case for KGUV. A readily available transit system will enhance transit mode share for trips between the site and off site locations. So the analysis for determining QoS for a development should consider it both as an important destination and origin for trips. Thus, all analyses have been performed for both directions. As discussed earlier, KGUV has three fixed route transit corridors; the analysis has been done separately for each corridor. The buses passing through the transit stop but not having stop at that transit stop were not considered in the analysis. Analyses have been performed for four distinct time periods corresponding to the following ticket validity periods set by the transit planning and delivery agency, TransLink:
• morning peak between 7am and 9am, • off – peak day time between 9am and 3pm, • evening peak between 3pm and 7pm and • off – peak evening time between 7pm and 10pm.
The extended peak hour for evening peak is considered to be four hours rather than normal two hours. Services operating during the early morning before 7am and late evening after 10pm were not considered in the analysis. The schedules for weekend days, public holidays and NightLink services (operating only on Friday and Saturday nights) have not been included.

Evaluating transit Quality of Service for Transit Oriented Development (TOD)
30th Australasian Transport Research Forum Page 8
The local bus stop at School Street on Kelvin Grove Road was not considered separately in the analysis because all the buses stopping here stop again at the bus stop at Blamey Street on Kelvin Grove Road. The bus stop at Victoria Park Road was also not considered separately for the same reason. This stop serves only route 364 operating from Herston to City in evening and on weekends. No direct bus route was found to and from the north-east side of KGUV so no destination was considered in that direction.
Fig. 2 Regional map showing various offsite attract ions considered in analysis
5.2.1 Availability – Transit Stops: Frequency
Table 4 defines the fixed route service frequency LOS ranges according to the TCQSM (TRB, 2003).
Table 4 Fixed – Route service frequency LOS (TRB, 2 003, Exhibit 3 – 12)
LOS Avg. Headway (min) veh / h Comments A < 10 > 6 Passengers do not need schedule B 10 – 14 5 – 6 Frequent service, passengers consult schedules C 15 – 20 3 – 4 Maximum desirable time to wait if bus / train missed D 21 – 30 2 Service unattractive to choice riders E 31 – 60 1 Service available during the hour F > 60 < 1 Service unattractive to all riders
For those living at KGUV various destinations were analysed. The popular destinations for residents such as Brisbane City and Cultural Centre (both to the south of the study area),
Evaluating transit Quality of Service for Transit Oriented Development (TOD)
30th Australasian Transport Research Forum Page 9
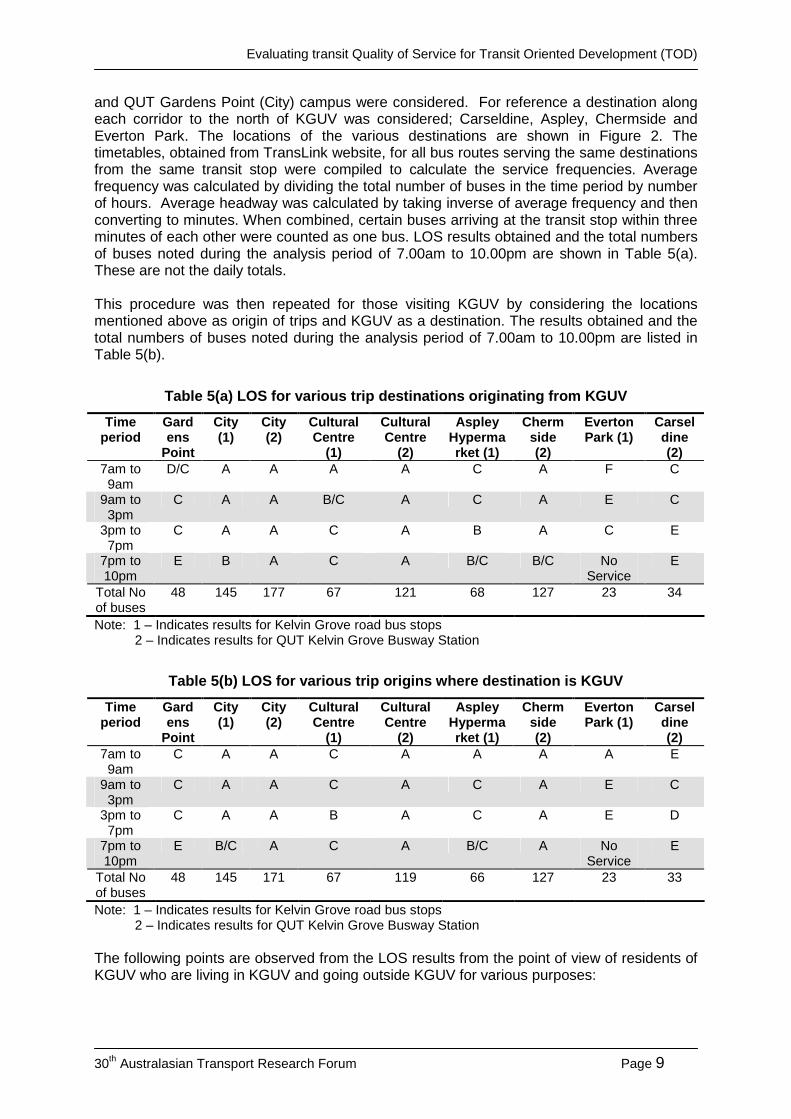
and QUT Gardens Point (City) campus were considered. For reference a destination along each corridor to the north of KGUV was considered; Carseldine, Aspley, Chermside and Everton Park. The locations of the various destinations are shown in Figure 2. The timetables, obtained from TransLink website, for all bus routes serving the same destinations from the same transit stop were compiled to calculate the service frequencies. Average frequency was calculated by dividing the total number of buses in the time period by number of hours. Average headway was calculated by taking inverse of average frequency and then converting to minutes. When combined, certain buses arriving at the transit stop within three minutes of each other were counted as one bus. LOS results obtained and the total numbers of buses noted during the analysis period of 7.00am to 10.00pm are shown in Table 5(a). These are not the daily totals. This procedure was then repeated for those visiting KGUV by considering the locations mentioned above as origin of trips and KGUV as a destination. The results obtained and the total numbers of buses noted during the analysis period of 7.00am to 10.00pm are listed in Table 5(b).
Table 5(a) LOS for various trip destinations origin ating from KGUV
Time period
Gardens
Point
City (1)
City (2)
Cultural Centre
(1)
Cultural Centre
(2)
Aspley Hypermarket (1)
Chermside (2)
Everton Park (1)
Carseldine (2)
7am to 9am
D/C A A A A C A F C
9am to 3pm
C A A B/C A C A E C
3pm to 7pm
C A A C A B A C E
7pm to 10pm
E B A C A B/C B/C No Service
E
Total No of buses
48 145 177 67 121 68 127 23 34
Note: 1 – Indicates results for Kelvin Grove road bus stops 2 – Indicates results for QUT Kelvin Grove Busway Station
Table 5(b) LOS for various trip origins where desti nation is KGUV
Time period
Gardens
Point
City (1)
City (2)
Cultural Centre
(1)
Cultural Centre
(2)
Aspley Hypermarket (1)
Chermside (2)
Everton Park (1)
Carseldine (2)
7am to 9am
C A A C A A A A E
9am to 3pm
C A A C A C A E C
3pm to 7pm
C A A B A C A E D
7pm to 10pm
E B/C A C A B/C A No Service
E
Total No of buses
48 145 171 67 119 66 127 23 33
Note: 1 – Indicates results for Kelvin Grove road bus stops 2 – Indicates results for QUT Kelvin Grove Busway Station The following points are observed from the LOS results from the point of view of residents of KGUV who are living in KGUV and going outside KGUV for various purposes:

Evaluating transit Quality of Service for Transit Oriented Development (TOD)
30th Australasian Transport Research Forum Page 10
• Transit is a very good option for KGUV residents commuting to the City and Cultural centre (and connecting to/from other transit services at these locations) and Chermside.
• Transit seems to be a fair to poor option for KGUV residents commuting to outlying suburbs in the morning and home in the evening except for Chermside where it is very good.
• Transit remains a poor option at night for KGUV residents except to / from the City, Cultural Centre, and Chermside where it is good.
The following points are observed from the LOS results from the point of view of visitors to KGUV for various different purposes:
• Transit is a very good option for visitors from the City and Cultural Centre (and those connecting to/from other transit services at these locations).
• Transit is a good option for visitors from Aspley Hypermarket in the peak periods and fair in the off peak period.
• Transit is a fair to good option for visitors from Everton Park in the peak periods and poor in the off peak period.
• Transit is a very good option for visitors from / to Chermside throughout the day. • Transit is a poor option for visitors from Carseldine except during the outbound
morning peak period and daytime off peak period when it is fair. • Transit is a poor option for the visitors going back to the outlying suburbs at night
except Aspley Hypermarket and Chermside. • Transit offers a fair option for students and staff members using QUT intercampus
shuttle service during the day but a poor option in the evening.
5.2.2 Availability – Route Segments / Corridors: Hours of service
Table 6 defines the fixed route hours of service LOS ranges according to the TCQSM (TRB, 2003).
Table 6 Fixed – Route Hours of service LOS (TRB, 20 03, Exhibit 3 – 13)
LOS Hours of Service Comments A 19 – 24 Night or “owl” service provided B 17 – 18 Late evening service provided C 14 – 16 Early evening service provided D 12 – 13 Daytime service provided E 4 – 11 Peak hour service only or limited midday service F 0 – 3 Very limited or no service
For calculation of hours of service with respect to route segments the same destinations were considered as above. The hours of service were calculated for a round trip; originating from a bus stop and terminating at the same bus stop. For example, if we consider Kelvin Grove Road as origin and City as destination, then the round trip from Kelvin Grove Road – City – Kelvin Grove Road was considered. The hours of service were calculated by subtracting the time of last service departing from City to Kelvin Grove Road from the time of departure of first service from Kelvin Grove Road. Although suggested by the TCQSM (TRB, 2003), an extra hour has not been added to calculate the hours of service because it was considered to give an overall optimistic picture of this LOS measure. The results for hours of service for various round trips with the numbers of bus routes are listed in Table 7. The following points are observed from the LOS results for hours of service for the round trip undertaken by residents of KGUV:
• Transit is a good option for KGUV residents commuting to City and Cultural centre throughout day (and night and commuting to / from other services at these locations).

Evaluating transit Quality of Service for Transit Oriented Development (TOD)
30th Australasian Transport Research Forum Page 11
• Transit is a good to fair option for KGUV residents commuting to outlying suburbs, except for Everton Park with limited evening service.
• Transit is a limited option for KGUV students and staff members commuting to GP campus with service limited to the daytime and early evening.
The following points are observed from the LOS results for hours of service for the round trip undertaken by visitors to KGUV:
• Transit is a good option for visitors coming to KGUV from the City and Cultural Centre across the day (and night and commuting to / from other services at these locations).
• Transit is a fair to good option for visitors coming to KGUV from outlying suburbs throughout the day except from Everton Park with no late evening service provided.
• Transit is a limited option for students and staff members visiting to KGUV with service limited to the daytime and early evening.
Table 7 LOS for different corridors with bus route numbers
Route Segment (Round Trip) Bus routes LOS QUT Kelvin Grove Campus – QUT Gardens Point Campus – QUT Kelvin Grove Campus
D
QUT Gardens Point Campus – QUT Kelvin Grove Campus – QUT Gardens Point Campus
391 C
Kelvin Grove Road – City – Kelvin Grove Road B City – Kelvin Grove Road – City
344, 345, 351, 357, 359, 390 B
QUT Kelvin Grove Busway station – City – QUT Kelvin Grove Busway station
A
City – QUT Kelvin Grove Busway station – City
330, 333, 340, 376, 393, 680
B Kelvin Grove Road – Cultural Centre – Kelvin Grove Road B Cultural Centre – Kelvin Grove Road – Cultural Centre
345 C
QUT Kelvin Grove Busway station – Cultural Centre – QUT Kelvin Grove Busway station
A
Cultural Centre – QUT Kelvin Grove Busway station – Cultural Centre
330, 333, 340 B
Kelvin Grove Road – Aspley Hypermarket – Kelvin Grove Road C Aspley Hypermarket – Kelvin Grove Road – Aspley Hypermarket
345 B
QUT Kelvin Grove Busway station – Chermside – QUT Kelvin Grove Busway station
B
Chermside – QUT Kelvin Grove Busway station – Chermside 330, 333, 340, 680
A Kelvin Grove Road – Everton park – Kelvin Grove Road E Everton park - Kelvin Grove Road - Everton park
351, 357, 359 E
QUT Kelvin Grove Busway station – Carseldine – QUT Kelvin Grove Busway station
C
Carseldine – QUT Kelvin Grove Busway station – Carseldine 340, 392
B
5.2.3 Availability – System: Service Coverage
Table 8 defines the fixed route service coverage LOS ranges according to the TCQSM (TRB, 2003).
Table 8 Fixed – Route service coverage LOS (TRB, 20 03, Exhibit 3 – 14)
LOS % TSA Covered Comments A 90.0 – 100.0% Virtually all major origins & destinations served B 80.0 – 89.9% Most major origins & destinations served C 70.0 – 79.9% About ¾ of higher – density areas served D 60.0 – 69.9% About two – thirds of higher – density areas served E 50.0 – 50.9% At least ½ of the higher – density areas served F < 50% Less than ½ of higher – density areas served

Evaluating transit Quality of Service for Transit Oriented Development (TOD)
30th Australasian Transport Research Forum Page 12
Transit supportive area (TSA) is the portion of the area being analysed having a household density of at least 7.5 units per gross hectare or an employment density of at least ten jobs per gross hectare. All 16.57 Ha area of KGUV is TSA. Availability was calculated using the GIS MapInfo Professional 8.5. The availability for system was analysed for the following distinct service coverage areas:
• for bus stops on Kelvin Grove Road (separately for stops in both directions) and Normanby busway station,
• the QUT Kelvin Grove busway station, and • the area covered by the QUT intercampus shuttle service (Figure1).
The image of KGUV was obtained from the Google Earth. A GPS survey was carried out to determine the exact latitude and longitude of bus stops (accurate position of bus stops) at KGUV and data for four distinct points at each end was collected for the image registration in MapInfo 8.5. A GPS, Garmin 76S was used for data collection. The data for inbound and outbound bus stops was noted separately. Buffers were drawn around the bus stops with specific radius. The radius of the buffers was calculated using equation (1) (TRB, 2003).
pxpopgsc ffffrr 0= …………………………………………….. (1)
where r0 is the ideal transit stop service radius; which is 400m for a bus stop and 800m for a busway station or rail station. The value of the street connectivity factor (fsc) was universally equal to 1.0 due to the grid street layout. The population factor (fpop) was universally 1.0 as most of the residents are young singles and 75 % of them are ages under 45 (The Hornery Institute and Hassell, 2004). The pedestrian crossing factor (fpx) was universally equal to 1.0 as all pedestrian crossing delays were less than 30s. . The grade factor was calculated by taking the average grade for various walking distances placed at extreme ends of KGUV to the related bus stops. Then after image registration and establishing exact location of bus stops, the circular buffers of the radius obtained by calculation were drawn for all cases by considering the respective bus stops. The buffers for the bus stops are shown in the Figure 3 to Figure 6. Table 9 lists the radius of buffer, percentage of TSA covered and LOS for system availability.
Table 9 LOS for different bus stops
Transit service Buffer Radius (m)
% TSA on KGUV covered
LOS
QUT intercampus shuttle service 400 100 A QUT Kelvin Grove Busway station 760 100 A Kelvin Grove Road Stop at Blamey Street and Normanby Busway station
400 & 760 96.4 A
Kelvin Grove Road Stop at Prospect Terrace and Normanby Busway station
400 & 760 95.3 A
The following points are observed from the LOS results of service coverage area from the point of view of both residents of, and visitors to, KGUV:
• QUT Kelvin Grove Busway Station provides excellent coverage to the whole study area, considering that it provides a premium service that people are prepared to walk further to access, as reflected by the 760m radial catchment. This caters for passengers to / from the northern and northeast suburbs including Chermside and Carseldine, the City and Cultural Centre.
• The two QUT 391 intercampus shuttle service bus stops located on Musk Avenue provide excellent coverage to the study area, which is to be expected given that they are on the main street spine of KGUV. These cater for passengers to / from QUT’s Gardens Point (City) campus.

Evaluating transit Quality of Service for Transit Oriented Development (TOD)
30th Australasian Transport Research Forum Page 13
• The bus stops on Kelvin Grove Road inbound and outbound to the City and Normanby Busway station provide excellent coverage to the study area. These cater for passengers to / from the northern and northwest suburbs including Aspley and Everton Park, the City and Cultural Centre.
Fig. 3 Buffers for bus stops for QUT Route 391 inte rcampus shuttle service (ST3&ST4)
Fig. 4 Buffer for QUT Kelvin Grove Busway Station ( ST1)

Evaluating transit Quality of Service for Transit Oriented Development (TOD)
30th Australasian Transport Research Forum Page 14
Fig. 5 Buffers for bus stop at Kelvin Grove Road at Blamey Street, ST5 and Normanby Busway Station, ST8 (inbound to City)
Fig. 6 Buffers for bus stop at Kelvin Grove Road at Prospect Terrace, ST7 and Normanby Busway Station, ST8 (outbound from City)

Evaluating transit Quality of Service for Transit Oriented Development (TOD)
30th Australasian Transport Research Forum Page 15
6 Conclusion and future work
Past literature lacks an appropriate methodology to properly model travel demand of a TOD. A travel demand model for a TOD is to be developed as a future stage of this research. The combined effect of all the characteristics of TOD on travel characteristics will be studied rather than using one at a time and will be compared with traditional Australian urban development. A case study TOD which has good transit service is essential for research on inhabitants’ travel behaviour. A candidate case study mixed use development, the Kelvin Grove Urban Village (KGUV), has been selected. This paper has evaluated the QoS of transit for this mixed use development, using the accessibility indicators from the framework provided in the TCQSM (TRB, 2003), in order to better appreciate whether it has the appropriate transit availability to support its function as a true TOD. The comfort and convenience indicators will be examined in future research. This will then validate, or otherwise, the perception that KGUV is a worthwhile TOD to study in terms of travel demand. The following results were obtained from the transit QoS availability analysis for KGUV: • Transit availability to the City and Cultural Centre (central business districts to the south
of KGUV) is very good in terms of frequency and hours of service for KGUV residents and visitors.
• Transit is a fair option for students and staff members using QUT intercampus shuttle service in terms frequency in both directions however hours of services are limited to the daytime and early evening only.
• Transit remains a good to fair option for KGUV residents travelling to certain outlying suburbs in terms of frequency and hours of service,
• Transit is a good option for visitors coming from certain outlying suburbs but for others it offers fair to poor transit availability and hours of service.
• All the bus stops, both busway stations offer very good transit service coverage for KGUV residents and visitors.
The overall observation of results shows that KGUV has good transit availability and therefore as a TOD represents a worthy case study. The QoS determination for transit availability was straight forward as a desktop study however comfort and convenience analysis needs a substantial field data base. This aspect is proposed for future research in this project. A strategic four step planning model will be developed and calibrated for assessing the travel demand and to study the travel characteristics of people living in KGUV. The differences between the conventional development and a transit oriented development; like effect of accessibility, availability on travel demand will be examined using a calibrated four step model. In future research, once the future travel demand study has been completed, the contribution of QoS towards the success of a TOD as measured using the various indicators of the TCQSM QoS framework can be confirmed and reconsidered as necessary.
References
Badoe, D A and Miller, E J (2000) Transportation – land – use interaction: empirical findings in North America, and their implications for modelling Transportation Research Part D 5(4) 235 – 263

Evaluating transit Quality of Service for Transit Oriented Development (TOD)
30th Australasian Transport Research Forum Page 16
Cervero, R and Radisch, C (1996) Travel choices in pedestrian versus automobile oriented neighbourhoods Transport Policy 3(3) 127 – 141 Chatman, D G (2003) How density and mixed uses at the workplace affect personal commercial travel and commute mode choice Transportation Research Record 1831 193 – 201 Dock, F C and Swenson, C J (2003) Transit-oriented urban design impacts on suburban land use and transportation planning Transportation Research Record 1831 184 – 192 Gray, M and Bunker, J (2005) Kelvin Grove Urban Village: The use of GIS in active transport planning In Dia Hussein and Bunker J. M. Eds. Proceedings 27th Conference of Australian Institutes of Transport Research Brisbane Hendricks, S. J. (2005) Impacts of transit oriented development on public transportation ridership, Final Report by National Center for Transit Research Center for Urban Transportation Research University of South Florida Report Number BD549-05 Kittelson & Associates, Inc, KFH Group, Inc, Parsons Brinckerhoff Quade & Douglass, Inc and Hunter – Zaworski, K (2003) TCRP Report 100 Transit Capacity and Quality of Service Manual 2nd Edition Transportation Research Board Washington D. C. Lund, H M, Cervero, R, Willson, R W (2004) Travel characteristics of transit-oriented development in California Final Report Funded by Caltrans Transportation Grant – “Statewide Planning Studies” – FTA section 5313 (b) Messenger, T and Ewing, R (1996) Transit – oriented development in the Sun Belt Transportation Research Record 1552 145 – 153 Parker, T, McKeever, M, Arrington, GB and Smith – Heimer, J (2002) Statewide transit – oriented development study – Factors for success in California Final report by Business Transportation and Housing Agency California department of transportation Queensland Government (2006) Queensland Government population projections to 2051: Queensland and Statistical Divisions 2nd edition 2006 Queensland Transport (2005) Smart travel choices for South East Queensland: A Transport Green paper. Rajamani, J, Bhat, C R, Handy, S, Knaap, G, Song, Y (2003) Assessing impact of urban form measures on nonwork trip mode choice after controlling for demographic and level-of-service effects Transportation Research Record 1831 158 – 165 Schlossberg, M and Brown, N (2004) Comparing transit – oriented development sites by walkability indicators Transportation Research Record 1887 34 – 42 The Hornery Institute and Hassell (2004) Kelvin Grove Urban Village, Integrated master plan Zhang, M (2005) Exploring the relationship between urban form and nonwork travel through time use analysis Landscape and Urban Planning 73 244 – 261 www.kgurbanvillage.com.au www.translink.com.au