evaluating the impact of order picking strategies on …
TRANSCRIPT

Acta lActa lActa lActa logisticaogisticaogisticaogistica ---- International Scientific Journal about LogisticsInternational Scientific Journal about LogisticsInternational Scientific Journal about LogisticsInternational Scientific Journal about Logistics
Volume: 6 2019 Issue: 4 Pages: 103-114 ISSN 1339-5629
EVALUATING THE IMPACT OF ORDER PICKING STRATEGIES ON THE ORDER FULFILMENT TIME: A
SIMULATION STUDY
Mercedes Urzúa; Abraham Mendoza; Akbal O. González
~ 103 ~
Copyright © Acta Logistica, www.actalogistica.eu
doi:10.22306/al.v6i4.129 Received: 18 July 2019 Accepted: 15 Aug. 2019
EVALUATING THE IMPACT OF ORDER PICKING STRATEGIES O N THE ORDER FULFILMENT TIME: A SIMULATION STUDY
Mercedes Urzúa
Universidad Panamericana, Faculty of Engineering, Aguascalientes, Aguascalientes 20290, Mexico, [email protected] (corresponding author)
Abraham Mendoza Universidad Panamericana, Faculty of Engineering, Zapopan, Jalisco 45010, Mexico, [email protected]
Akbal O. González Ghost Technologies, Aguascalientes, Mexico, [email protected]
Keywords: customer service level, discrete event simulation, order fulfilment, picking policies Abstract: A Distribution Centre (DC) is considered a critical node in providing optimal customer service levels in a supply chain network. Therefore, improving order fulfilment time at DCs becomes critical to achieve world-class operations. One of the key processes involved in order fulfilment is that of picking, the activity that consumes most time when fulfilling an order. This article presents the analysis of an actual system that stores products in a random fashion and releases orders following FIFO rules. A simulation model is built, and two scenarios analysed. The first one (baseline) reflects the current DC operation. The second scenario (projected) includes the implementation of three picking strategies aimed at improving system performance: slotting, wave picking, and expedite picking (balancing picker’s workload). The following KPIs are used to compare both scenarios: order fulfilment lead-time, picks per man-hour, average picking time per order, average time to pack an order. Simulation results show that the systematic implementation of the proposed strategies achieves substantial improvements, not only in the order fulfilment time (54% reduction), but also in the number of orders completed in less than 8 hours, the number of orders picked per man hour and a reduction of pickers idle time. 1 Introduction
A DC is considered one of the most important nodes in a supply chain network [1], given that its performance has an important impact on the company’s profit. A DC is the place where products are received, handled, stored, packaged, and then shipped to satisfy customer orders [2]. To provide a competitive service level at a DC, an order received must be fulfilled in time and quantity; this is often referred to as on-time in-full (OTIF) deliveries [3]. In trying to achieve world-class operations, companies must assess the service level of their DCs through a benchmark with similar industries. A benchmark enables the definition of useful and relevant performance measures based on good practices achieved by best-in-class companies [3]. An example of a benchmark reference is the Warehousing and Fulfilment Process Benchmark & Best Practices Guide [4], which is periodically published by the Warehousing Education and Research Council (WERC). Using this type of information, companies can then make the necessary adjustments and improvements to their processes.
One of the main performance measures in DC operations is the order fulfilment lead-time, defined as the amount of time elapsed between the order is received and shipped from the facility. Since customer orders can be very different from one another, in terms of, for instance, the order mix (high and low volume items), the order lines (number of different items) and the order size (total number of units) [4], it is then important to evaluate the profile of the orders received by a DC in pursuance of defining the
best strategies to provide world-class service. For the fulfilment of an order, a series of activities are
performed: picking, packing, and order consolidation. Order picking is a vital and demanding part of the process as it accounts for about 50-75% of the total operating cost for a typical warehouse [5] and utilizes up to 60% of labour force [6]. Additionally, picking comprises one or more of the following processes: batching, routing and sequencing, and sorting. Batching serves as the criteria in which orders are grouped, according to similarities and location, and released for their fulfilment; routing and sequencing determine the optimal sequence in which each Stock Keeping Unit (SKU) is picked; and sorting consists of consolidating orders that are withdrawn together in the same pick wave [7].
The batching process, in particular, requires the planning of the rhythm at which orders are released as well as the determination of the best combination of orders. A common strategy is called `wave picking. A wave is a batch of orders that are handled together, optimizing the distance travelled by the staff assigned to the picking process and bringing efficiency into the order fulfilment cycle time [8]. Wave picking also benefits from balancing the work between the different processes during the order fulfilment process. Accurately batched and released, waves could reduce cycle time by more than 13%, compared to not following any strategy, e.g., orders released as soon as they are received [9].
One of the aspects affecting the batching process is the location of products to be retrieved. Typically, 80% of the

Acta lActa lActa lActa logisticaogisticaogisticaogistica ---- International Scientific Journal about LogisticsInternational Scientific Journal about LogisticsInternational Scientific Journal about LogisticsInternational Scientific Journal about Logistics
Volume: 6 2019 Issue: 4 Pages: 103-114 ISSN 1339-5629
EVALUATING THE IMPACT OF ORDER PICKING STRATEGIES ON THE ORDER FULFILMENT TIME: A
SIMULATION STUDY
Mercedes Urzúa; Abraham Mendoza; Akbal O. González
~ 104 ~
Copyright © Acta Logistica, www.actalogistica.eu
orders received at a DC represent up to 20% of the stock-keeping units (SKUs). Focusing on the top 20% products makes a significant difference when planning a DC warehouse layout. The purpose should be to make SKUs reachable and accessible to the zone where orders are consolidated [4]. This layout strategy, for instance, is called slotting, in which the storage location is determined based on parameters such as the number of hits or times a product is requested [10]. Slotting also considers placing items in the Golden Zone, the ergonomically optimum location (e.g., shelves between .5 meters to 1.5 meters from floor) [11]. Even though storage of the products takes longer under this policy, selection of products during order fulfilment is simpler and total lead-time is reduced by optimizing the routing and sequence of the picking process, which has a direct impact on the traveling distance of workers [12].
Picking can also benefit from automated operations. For example, automated storage and retrieval systems (AS/RS). An AS/RS is a system used for the storage and retrieval of products. Its usage may bring several advantages over non-automated systems: reduction of required work force, lead-time and errors during an order fulfilment [13]. The degree of automation of an AS/RS varies from semi-manual devices to computer-controlled robots fully integrated with other warehouse components such as conveyors, automated guided vehicles (AGVs), and warehouse management systems (WMS). Sometimes, despite of the benefits, some companies stick to manual order picking due to variability in SKU shapes and sizes, variability of demand, high seasonality of products, or simply due to the large investment required for such systems.
When evaluating picking strategies, the use of simulation software is valuable. A simulation mimics real-life systems and its process includes “such activities as defining, designing, and constructing a model or representation; defining the experiments to be conducted; collecting and analysing data to drive the model; and analysing and interpreting the results obtained from the experiments” [14]. Therefore, simulation is a valuable tool to assess the efficiency when implementing a new project in a real-life system. [15].
The purpose of this article is to describe a Flexsim simulation model [16] based on the actual DC operations of a Hardware & Tools manufacturer and supplier. This model was used to test the effect of three picking strategies: slotting, wave picking, and expedite picking (balancing picker’s workload). Currently, the company does not perform slotting (products are stored in a random fashion, with no other strategy than size and weight), its orders are released following FIFO rules (no wave strategy), and picking operators are assigned to one or more aisles and they are not allowed to pick items from other aisles even if they are idle (causing an uneven workload distribution).
This article is organized as follows. Section 2 presents a review of related literature. Section 3 describes the DC
operation and simulation model specifications. Section 4 presents the experimental design, KPIs and proposed simulation scenarios. Results are discussed in Section 5. Conclusions and further research ideas are presented in Section 6.
2 Literature Review
Order picking is a topic that has been extensively studied in research over the last decades. The primary focus has been mostly on comparing the effectiveness of different picking policies. Picking policies determine which SKUs are placed on a pick list for later retrieval from storage locations. Storage location assignment, batching and routing are the core operating policies that are considered when assessing picking systems at warehouses [17]. Strict-order picking is a common policy that consists in touring through the warehouse to pick all SKUs for a single order [18]. The advantage of that policy is that it maintains order integrity and simplifies sorting. Combining several orders into batches is another policy that has been extensively studied throughout the years [19-21].
Petersen and Aese [18] performed a Monte Carlo simulation to assess the impact of the three core picking policies, comparing the current operation of a firm (baseline) between 27 combinations of picking policies. They concluded that batching orders is the policy that brings about the largest reduction in picking time, but assuming that orders did not need a later sorting process. While class-based storage also reduced the picking time, complex routing can cause confusion and affect the performance of the entire system.
Dekker et al. [22] studied a Tools Wholesaler with the purpose of improving order picking through the use of storage and routing policies. With the help of a simulation model they evaluated 18 combinations of storage and routing policies, obtaining reductions of up to 28.9% of pickers’ travel distance and 4% in picking time.
Manzini et al. [23] proposed travel distance as the KPI to assess a picker-to-part picking system using simulation. Through plenty of industrial data, they concluded that routing policy is the factor that contributes the most to the improvement of the system performance. Class-based storage also helped to reduce the picking cycle time.
Dukic and Oluic [24] used simulation to explore the three core operating picking policies (batching, storage, and routing) using a basic layout of a conventional warehouse. They achieved considerable decrease in travel distance when combining batching and volume-based storage. Additionally, integrating routing as part of the picking policy did not have an important impact on performance.
Chackelson et al. [25] presented a research-based case of a warehouse with delivery times ranging from 24 to 48 hours. Using simulation software, they analysed the interaction between different batching, storage, and routing policies. They found that using a class-based storage

Acta lActa lActa lActa logisticaogisticaogisticaogistica ---- International Scientific Journal about LogisticsInternational Scientific Journal about LogisticsInternational Scientific Journal about LogisticsInternational Scientific Journal about Logistics
Volume: 6 2019 Issue: 4 Pages: 103-114 ISSN 1339-5629
EVALUATING THE IMPACT OF ORDER PICKING STRATEGIES ON THE ORDER FULFILMENT TIME: A
SIMULATION STUDY
Mercedes Urzúa; Abraham Mendoza; Akbal O. González
~ 105 ~
Copyright © Acta Logistica, www.actalogistica.eu
policy, return routing method and releasing orders by batches (pick by article), improved the total picking time.
In terms of order lead time, Pedrielli et al. [26] developed an algorithm to generate a picking list (wave picking). They also established a zone picking strategy, where orders were broken in items located at the same storage zone and assigned to a picker (balancing workload). Finally, items were sorted at end of the picking process to the matching order. Using discrete event simulation and picking cycle time per item as the main KPI, the algorithm and strategies were evaluated, showing important improvements in the system performance.
Lead-time optimization and picking work load were the subject of study for Wasusri and Theerawongsathon [27], where the performance of a real basic DC layout was analysed contrasting different picking policies. The results showed a decrease in picking time through batch and zone picking and a better staff utilization. Policies like routing and storage were not studied in this paper.
Using a genetic algorithm integrated in a cloud-based system, Leung et al. [28] consolidated orders and generated operating guidelines based on storage location, weight and volume of items. Through the provision of picking lists to perform batch picking, the order processing time (lead-time) and traveling distance were reduced significantly. No other DC policies aside from batch picking were studied.
The common aspects of the cited research are: they study basic DC layouts, except for Chackelson et al. [25]; they only considered picking time as part of order fulfilment time, except for Pedrielli et al. [26] and Leung et al. [28], excluding other processes such as packing, sorting, and consolidation. For that reason, we study a system with a complex layout (a semi-automated DC that includes picking zones with different configurations) where picking, packing, sorting and consolidation processes times are considered as part of the order’s fulfilment time. 3 System description and simulation model
The simulation model analysed in this research has been built based on the DC operations of a Hardware &
Tools manufacturer and supplier. Nowadays, the fast growth of e-commerce companies like Amazon has become a threat to the economic stability of this kind of companies. Despite its efforts to improve speed of response through implementation of an AS/RS system, performance is not yet competitive. For that reason, the company under study is looking for strategies to improve its order fulfilment process (picking, packing, and consolidation) in order to achieve world-class standards. In particular, the DC needs to expedite the order fulfilment process, using only current resources (operators and infrastructure). As stated in the Warehousing and Fulfilment Process Benchmark & Best Practices Guide [4]: “in pursuance to achieve a best-in-class customer service level, the average time from order placement to shipment must be less than or equal to 8 hours” 3.1 DC Operation
The DC receives orders from different customers that range from transnational retailers, such as Wal-Mart, to final individual customers. The order mix, size, and lines vary considerably, complicating the order fulfilment. Based on historical data, Table 1 shows the number of lines per order and their probability of occurrence.
Table 1 Order lines and their probability of occurrence ORDER LINES PROBABILITY
P(X) 1-2 .13 3-5 .12 6-10 .17 11-20 .19 21-50 .29
51 OR MORE .1
The DC works 24/7. The average number of orders received per day is 400, which translates into approximately 9,500 order lines to be picked daily. Once an order is received, it is released following FIFO rule. Figure 1 shows the order fulfilment process:
Figure 1 Order Fulfilment Process
The order fulfilment process takes place within 7 defined zones (see Figure 2):

Acta lActa lActa lActa logisticaogisticaogisticaogistica ---- International Scientific Journal about LogisticsInternational Scientific Journal about LogisticsInternational Scientific Journal about LogisticsInternational Scientific Journal about Logistics
Volume: 6 2019 Issue: 4 Pages: 103-114 ISSN 1339-5629
EVALUATING THE IMPACT OF ORDER PICKING STRATEGIES ON THE ORDER FULFILMENT TIME: A
SIMULATION STUDY
Mercedes Urzúa; Abraham Mendoza; Akbal O. González
~ 106 ~
Copyright © Acta Logistica, www.actalogistica.eu
Figure 2 DC layout and defined zones
• Picking o Zone 1 (Z1): Storage of medium and large items
(objects with a volume greater than 90,000 cm3, such as hydraulic jacks and high-pressure compressors).
o Zone 2 (Z2): Storage of small items (objects with a volume between 24,000 cm3 and 90,000 cm3, such as drilling machines and tool boxes).
o Zone 3 (Z3): AS / RS (objects with a volume below 24,000 cm3, such as dies and screwdrivers).
• Packing o Zone 4 (Z4): Packing 1, for orders with 1 or 2 order
lines and items picked from AS/RS and small items
picking zones. o Zone 5 (Z5): Packing 2, for medium items. o Zone 6 (Z6): Packing 3, for orders with 3 or more
order lines and items picked from AS/RS and small items picking zones.
• Sorting & consolidation o Zone 7 (Z7): 11 different docks are located at the
south area of the DC; different items of the same order are consolidated for later shipment.
Items flow between packing zones (Z4, Z5 and Z6) and
order consolidation & loading (Z7) using a conveyor and a sortation system (see Figure 3).
Figure 3 Conveyor and sortation system
3.2 Simulation Model: Specifications Input information for simulation model was retrieved
from 6,758 real orders (154,325 picks) fulfilled at the DC from 16th to 31st of March 2018. Flexsim’s Expert Fit module was used to statically analyse data; Chi-square test was performed to assess the goodness of fit of the obtained statistical distributions.
3.2.1 Operators
A total of 46 operators (Table 2) are involved in the fulfilment process. Dispatcher objects and process flow tools are used in the simulation model to control the sequence of the operators’ tasks.

Acta lActa lActa lActa logisticaogisticaogisticaogistica ---- International Scientific Journal about LogisticsInternational Scientific Journal about LogisticsInternational Scientific Journal about LogisticsInternational Scientific Journal about Logistics
Volume: 6 2019 Issue: 4 Pages: 103-114 ISSN 1339-5629
EVALUATING THE IMPACT OF ORDER PICKING STRATEGIES ON THE ORDER FULFILMENT TIME: A
SIMULATION STUDY
Mercedes Urzúa; Abraham Mendoza; Akbal O. González
~ 107 ~
Copyright © Acta Logistica, www.actalogistica.eu
Table 2 Flexsim Operators (Resources) Configuration
OPERATION ZONE NO. OF
RESOURCES LOAD TIME (SECONDS)
UNLOAD TIME
(SECONDS)
TRAVEL VELOCITY
EMPTY (M/S)
TRAVEL VELOCITY
LOADED (M/S)
PICKING Medium and large items 5 N(14.8,4.9,0) 3 2 2
PICKING Small items 15 N(15.55,4.41,0) N(4,.98,0) 1 1
PICKING AS/RS 2 0 0 2 2
PACKING Packing 1 4 1 1 2 2
PACKING Packing 2 2 0 0 2 2
PACKING Packing 3 7 0 0 2 2 ORDER
CONSOLIDATION & LOADING DOCKS
Consolidation 11 0 0 2 2
Notes: 1. Loading operation, performed by freight carriers, is out of scope of this simulation. 2. Picker operators use buckets to retrieve small products and dollies for large and medium items. 3. N(mean, standard deviation, stream)≈Normal distribution.
3.2.2 Picking zones The picking of items takes place amongst three
different zones, each one with particular features: • Storage of medium and large items (Z1):
o 40 rack objects of different dimensions are used to emulate the storage of medium and large items. These items do not stream through the conveyor and sortation system.
o Picking process time is composed of the time the picker uses to load, transport and unload a requested item.
o Once a picker completes an instruction, picked items are sent, using dollies, to Packing 2 (Z5) (medium items) or to order consolidation & loading zone (Z7) (large items).
• Storage of small items (Z2):
o This zone is a multi-storey warehouse (see Figure 4) with a very low percentage of automation.
o Each story has 6 rack objects and 6 queues (staging zones) where picking process is simulated.
o Picking time follows a uniform distribution with a lower limit of 7.81 seconds and an upper limit of 13.33 seconds.
o Picking process, of an order line, is started when there is an available picker operator.
o Once a picker completes an instruction, picked items are sent in buckets, through conveyors, to Packing 1 (Z4) or Packing 3 (Z6).
Figure 4 Flexsim representation of the multi-storey warehouse

Acta lActa lActa lActa logisticaogisticaogisticaogistica ---- International Scientific Journal about LogisticsInternational Scientific Journal about LogisticsInternational Scientific Journal about LogisticsInternational Scientific Journal about Logistics
Volume: 6 2019 Issue: 4 Pages: 103-114 ISSN 1339-5629
EVALUATING THE IMPACT OF ORDER PICKING STRATEGIES ON THE ORDER FULFILMENT TIME: A
SIMULATION STUDY
Mercedes Urzúa; Abraham Mendoza; Akbal O. González
~ 108 ~
Copyright © Acta Logistica, www.actalogistica.eu
• AS/RS (Z3): With the objective of a more realistic emulation of the
AS/RS, several other Flexsim’s objects were used to build system (see Figure 5):
o 4 racks, with an available aisle between each pair of racks. Each rack has 2000 positions for storage.
o Each aisle has an elevator that stores/retrieves bins. The elevator transports bins through the different rack’s bays and levels. This elevator was simulated using 20 Basic Task Executer objects and illustrated with spheres.
o At ground level (Figure 5), 2 picking stations are located, each of them was simulated using 6 processors, a queue and an operator.
o The picking process time follows a discrete uniform distribution with a lower limit of 3 seconds and an upper limit of 10 seconds. A conveyor is used to transport items between racks and the picking stations (velocity = 0.17 m/s).
Figure 5 Flexsim representation of the AS/RS
3.2.3 Packing zones
Picked items are transported to 3 different packing zones, depending on the characteristics of the order and the size of the items. Following is a description of each packing zone: • Packing 1 (Z4):
At this location items belonging to orders with 1 or 2 lines, picked from the AS/RS (Z3) or small items storage zone (Z2), are packed. Several Flexsim objects were used to simulate the zone:
o 2 input conveyors for items coming from the AS/RS (Z3) or the small items storage zone (Z2).
o 2 queues, where items wait until a packing operator is available.
o 2 separators, to separate items from picking buckets. Items are packed, and buckets are released to picking zones.
o 2 racks, to put together items of a same order that arrive in different buckets. The racks emulate a pick to light system.
o 2 combiners, to pack items in boxes. The process time follows a normal distribution with a mean of 34.6 seconds and a standard deviation of 6.69 seconds.
o 2 output conveyors that transport the packed items to the sortation system.
• Packing 2 (Z5):
Medium items are packed at this location. Several Flexsim objects with specific tasks were used to simulate this zone:
o 1 queue, where items waits until a packing operator is available.
o 2 processors, which pack items following a normal distribution with a mean of 50 seconds and a standard deviation of 10.9 seconds.
o 2 output conveyors that transport the packed items to the sortation system.
• Packing 3 (Z6):
At this location items belonging to orders with 3 or more order lines, picked from the AS/RS (Z3) or small items storage zone (Z2), are packed. Several Flexsim objects were used to simulate the zone:
o 2 input conveyors for items coming from the AS/RS (Z3) or the small items storage zone (Z2).
o 1 queue, where items wait until a packing operator is available.
o 7 processors, which pack items following a normal distribution with a mean of 35 seconds and a standard deviation of 7.8 seconds. A setup of 35 seconds is performed at each processor, every fifth item.
o 2 output conveyors that transport the packed items to the sortation system.
3.2.4 Conveyor and Sortation System
When an order is fulfilled through batch picking, items need to be sorted and then consolidated in a determined area. This sortation can be performed with the assistance of an automated system of conveyors [3]. Additional to the conveyors, control mechanisms and software are integrated to transport and assort items through the facility. The DC’s conveyor and sortation system were emulated using the following configuration: o The velocity of the conveyor and sortation system is
0.37 m/s. o The following areas are inputs to the conveyor and
sortation system: Small items storage zone (Z2), AS/RS (Z3) and all packing zones (Z4, Z5 and Z6).
Acta lActa lActa lActa logisticaogisticaogisticaogistica ---- International Scientific Journal about LogisticsInternational Scientific Journal about LogisticsInternational Scientific Journal about LogisticsInternational Scientific Journal about Logistics
Volume: 6 2019 Issue: 4 Pages: 103-114 ISSN 1339-5629
EVALUATING THE IMPACT OF ORDER PICKING STRATEGIES ON THE ORDER FULFILMENT TIME: A
SIMULATION STUDY
Mercedes Urzúa; Abraham Mendoza; Akbal O. González
~ 109 ~
Copyright © Acta Logistica, www.actalogistica.eu
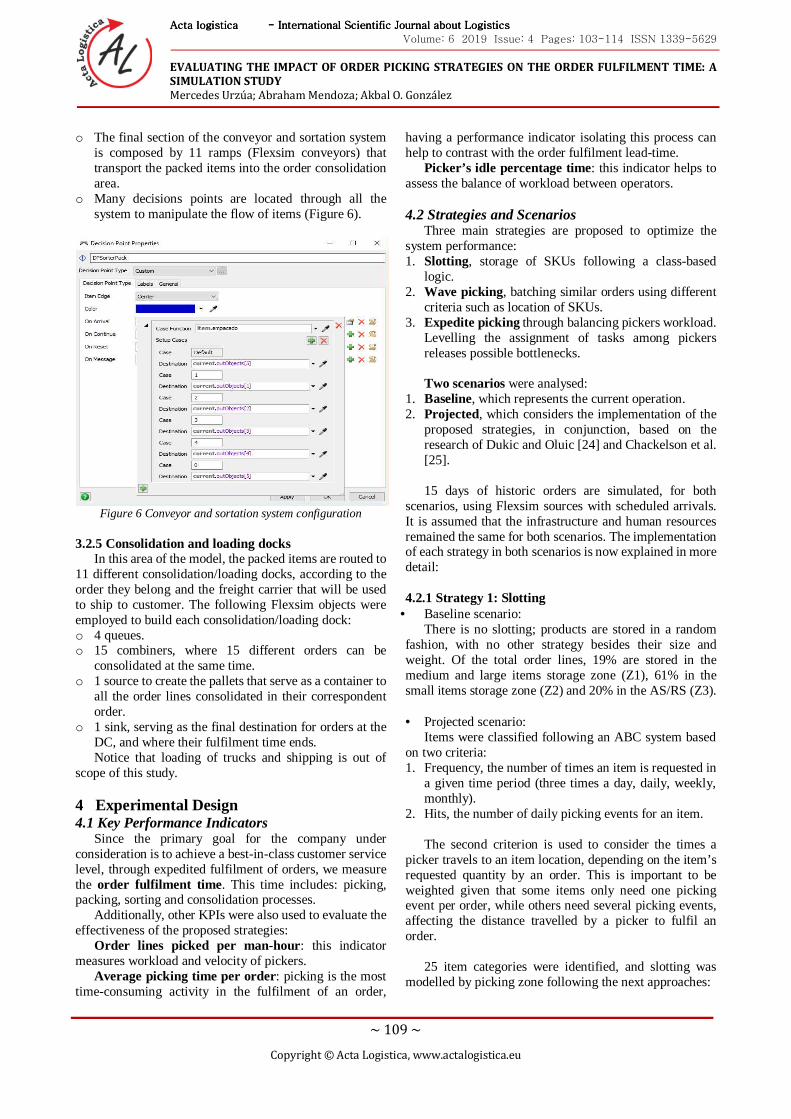
o The final section of the conveyor and sortation system is composed by 11 ramps (Flexsim conveyors) that transport the packed items into the order consolidation area.
o Many decisions points are located through all the system to manipulate the flow of items (Figure 6).
Figure 6 Conveyor and sortation system configuration
3.2.5 Consolidation and loading docks
In this area of the model, the packed items are routed to 11 different consolidation/loading docks, according to the order they belong and the freight carrier that will be used to ship to customer. The following Flexsim objects were employed to build each consolidation/loading dock: o 4 queues. o 15 combiners, where 15 different orders can be
consolidated at the same time. o 1 source to create the pallets that serve as a container to
all the order lines consolidated in their correspondent order.
o 1 sink, serving as the final destination for orders at the DC, and where their fulfilment time ends. Notice that loading of trucks and shipping is out of
scope of this study.
4 Experimental Design 4.1 Key Performance Indicators
Since the primary goal for the company under consideration is to achieve a best-in-class customer service level, through expedited fulfilment of orders, we measure the order fulfilment time . This time includes: picking, packing, sorting and consolidation processes.
Additionally, other KPIs were also used to evaluate the effectiveness of the proposed strategies:
Order lines picked per man-hour: this indicator measures workload and velocity of pickers.
Average picking time per order: picking is the most time-consuming activity in the fulfilment of an order,
having a performance indicator isolating this process can help to contrast with the order fulfilment lead-time.
Picker’s idle percentage time: this indicator helps to assess the balance of workload between operators. 4.2 Strategies and Scenarios
Three main strategies are proposed to optimize the system performance: 1. Slotting, storage of SKUs following a class-based
logic. 2. Wave picking, batching similar orders using different
criteria such as location of SKUs. 3. Expedite picking through balancing pickers workload.
Levelling the assignment of tasks among pickers releases possible bottlenecks. Two scenarios were analysed:
1. Baseline, which represents the current operation. 2. Projected, which considers the implementation of the
proposed strategies, in conjunction, based on the research of Dukic and Oluic [24] and Chackelson et al. [25]. 15 days of historic orders are simulated, for both
scenarios, using Flexsim sources with scheduled arrivals. It is assumed that the infrastructure and human resources remained the same for both scenarios. The implementation of each strategy in both scenarios is now explained in more detail: 4.2.1 Strategy 1: Slotting
• Baseline scenario: There is no slotting; products are stored in a random
fashion, with no other strategy besides their size and weight. Of the total order lines, 19% are stored in the medium and large items storage zone (Z1), 61% in the small items storage zone (Z2) and 20% in the AS/RS (Z3).
• Projected scenario:
Items were classified following an ABC system based on two criteria: 1. Frequency, the number of times an item is requested in
a given time period (three times a day, daily, weekly, monthly).
2. Hits, the number of daily picking events for an item.
The second criterion is used to consider the times a picker travels to an item location, depending on the item’s requested quantity by an order. This is important to be weighted given that some items only need one picking event per order, while others need several picking events, affecting the distance travelled by a picker to fulfil an order.
25 item categories were identified, and slotting was
modelled by picking zone following the next approaches:

Acta lActa lActa lActa logisticaogisticaogisticaogistica ---- International Scientific Journal about LogisticsInternational Scientific Journal about LogisticsInternational Scientific Journal about LogisticsInternational Scientific Journal about Logistics
Volume: 6 2019 Issue: 4 Pages: 103-114 ISSN 1339-5629
EVALUATING THE IMPACT OF ORDER PICKING STRATEGIES ON THE ORDER FULFILMENT TIME: A
SIMULATION STUDY
Mercedes Urzúa; Abraham Mendoza; Akbal O. González
~ 110 ~
Copyright © Acta Logistica, www.actalogistica.eu
• Medium and large items storage zone (Z1): items with a higher hierarchy are placed in the “Golden Zone” and at locations near packing. These items are also distributed through parallel racks to avoid pickers traffic.
• Small items storage zone (Z2): items with a higher hierarchy are placed in the “Golden Zone”, at the north side of the picking zone in order to facilitate the replenishment of inventory.
• AS/RS (Z3) was considered out of scope of the slotting strategy.
4.2.2 Strategy 2: Wave picking • Baseline scenario: Orders are batched in groups of 150, following only FIFO
rules. • Projected scenario:
Orders are batched and released for fulfilment using the following criteria:
- Order size (number of order lines). Orders with only 1 or 2 lines are given priority.
- Order line aisle location. Pickers are given order lines placed in a same aisle with the objective of minimizing travelled distance.
- Order line weight. Buckets are used in Z2 to transport picked items. Ranking order lines based on weight contributes to less buckets flowing along the DC.
- Order line ABC category. Orders with items with higher frequency/hits are given priority during picking operation.
With the purpose of avoiding saturation of the conveyor/sortation system, waves are made up of maximum 250 orders. 4.2.3 Strategy 3: Balancing picker’s workload • Baseline scenario:
Operators are assigned to fixed aisles in all zones; if they are idle, they cannot pick items from other aisles. A study of utilization of different picking operators in the current system discovered that pickers in the medium and large items storage zone (Z1) have unequal workloads.
• Projected scenario:
Pickers in the medium and large items storage zone (Z1) are not assigned to fixed aisle(s), they can pick from any aisle in order to expedite picking.
5 Results Table 4 shows order fulfilment time per order. Notice
that there is a reduction of 55% in the average order fulfilment time per order by implementing the proposed strategies. Yet, the maximum time achieved by the projected scenario is equivalent to 12.56 hours (754.1 min). This time is still far above the best in class expected time (8 hours), however if we segment the number of orders completed by time ranges (see Table 5), we observe that while only 35.8% of Baseline Scenario orders (149 of 416) are completed in 8 hours or less, 93.9% of the orders (391 of 416) are fulfilled in 8 hours or less in the projected scenario, contributing mostly to a best-in-class customer service level.
Table 4 Order fulfilment time (min) per order BASELINE SCENARIO PROJECTED SCENARIO
MINIMUM 1.1 1.55 MAXIMUM 1224.31 754.1 AVERAGE 503.74 225.09
Table 5 Number of orders completed in given time ranges
BASELINE SCENARIO PROJECTED SCENARIO
ORDER LINES PER ORDER 0-8 hrs. 8-16 hrs. 16-24 hrs. Total 0-8 hrs. 8-16 hrs. Total
1-2 57 6 0 63 63 0 63
3-5 30 20 1 51 50 1 51
6-10 30 46 1 77 76 1 77
11-20 21 60 3 84 83 1 84
21-50 9 77 10 96 90 6 96
50 OR MORE 2 34 9 45 29 16 45
TOTAL ORDERS 149 243 24 416 391 25 416

Acta lActa lActa lActa logisticaogisticaogisticaogistica ---- International Scientific Journal about LogisticsInternational Scientific Journal about LogisticsInternational Scientific Journal about LogisticsInternational Scientific Journal about Logistics
Volume: 6 2019 Issue: 4 Pages: 103-114 ISSN 1339-5629
EVALUATING THE IMPACT OF ORDER PICKING STRATEGIES ON THE ORDER FULFILMENT TIME: A
SIMULATION STUDY
Mercedes Urzúa; Abraham Mendoza; Akbal O. González
~ 111 ~
Copyright © Acta Logistica, www.actalogistica.eu
The studied DC has automated equipment that accelerates the fulfilment of orders, but the process also relies on 46 operators. The proposed strategies benefited the manual tasks making the workforce more productive. Table 6 shows the order lines picked per man-hour for
both scenarios. Notice that there is an improvement of 69.25% (on average) in the pickers productivity, in accordance with the reduction of the time needed to fulfil one order.
Table 6 Order lines picked per man-hour BASELINE SCENARIO
PROJECTED SCENARIO
MEDIUM & LARGE ITEMS PICKER 1 16.81 49.75 MEDIUM & LARGE ITEMS PICKER 2 16.23 49.56 MEDIUM & LARGE ITEMS PICKER 3 29.96 33.71 MEDIUM & LARGE ITEMS PICKER 4 30.03 33.46
SMALL ITEMS PICKER 1 22.07 38.27 SMALL ITEMS PICKER 2 21.63 37.88 SMALL ITEMS PICKER 3 21.65 38.18 SMALL ITEMS PICKER 4 21.11 36.90 SMALL ITEMS PICKER 5 20.39 37.51 SMALL ITEMS PICKER 6 22.04 35.93 SMALL ITEMS PICKER 7 22.05 36.12 SMALL ITEMS PICKER 8 22.02 35.83 SMALL ITEMS PICKER 9 22.23 35.59 SMALL ITEMS PICKER 10 22.10 35.88 SMALL ITEMS PICKER 11 23.85 38.29 SMALL ITEMS PICKER 12 23.96 38.44 SMALL ITEMS PICKER 13 24.05 38.31 SMALL ITEMS PICKER 14 23.86 37.75 SMALL ITEMS PICKER 15 23.94 38.18
AS/RS PICKER 1 31.94 55.83 AS/RS PICKER 2 29.65 50.77
AVERAGE 23.41 39.62
As stated before, the most demanding activity in the order fulfilment process is the picking time per order. Table 7 shows a comparison of the picking time per order for both scenarios.
Table 7 Picking time (min) per order BASELINE SCENARIO
PROJECTED SCENARIO
MINIMUM 0.16 0 MAXIMUM 1209 733.52 AVERAGE 491 205.5
The proposed picking strategies help to achieve a
reduction of 58% on average picking time. As well if the average picking time is compared with the total time to fulfil an order (Table 4), we can see that during the 91.29%
(205.5/ 225.09) of the time it takes to fulfil an order, picking process is being executed, which supports that this is the most time-consuming activity in the fulfilment process.
Levelling labour workload for pickers in the medium and large item picking zone (Z1) has an important effect on the percentage of pickers idle time (see Table 8). In the baseline scenario, the idle percentage time between pickers varies by 49% (20% vs. 69%); whereas in the projected scenario, it only varies 1% (3% vs. 4%). Also, it is clear that the idle percentage with respect to other activities in both scenarios is considerably different, being much lower in the projected scenario. This is because more orders are fulfilled throughout the day, increasing the workload for all pickers.

Acta lActa lActa lActa logisticaogisticaogisticaogistica ---- International Scientific Journal about LogisticsInternational Scientific Journal about LogisticsInternational Scientific Journal about LogisticsInternational Scientific Journal about Logistics
Volume: 6 2019 Issue: 4 Pages: 103-114 ISSN 1339-5629
EVALUATING THE IMPACT OF ORDER PICKING STRATEGIES ON THE ORDER FULFILMENT TIME: A
SIMULATION STUDY
Mercedes Urzúa; Abraham Mendoza; Akbal O. González
~ 112 ~
Copyright © Acta Logistica, www.actalogistica.eu
Table 8 Operators’ utilization BASELINE SCENARIO PROJECTED SCENARIO
OPERATORS T
rave
l em
pty
Tra
vel l
oade
d
Loa
ding
Unl
oadi
ng
Idle
Tra
vel e
mpt
y
Tra
vel l
oade
d
Loa
ding
Unl
oadi
ng
Idle
PICKER 1 9% 21% 5% 1% 65% 3% 42% 48% 4% 3% PICKER 2 7% 19% 5% 0% 69% 3% 42% 48% 4% 3% PICKER 3 5% 40% 30% 2% 23% 5% 56% 32% 3% 4% PICKER 4 5% 41% 32% 2% 20% 5% 56% 33% 3% 4%
From the results above and as measured by the defined
KPIs, we observe that by implementing the proposed picking strategies the company achieved a better performance. The reduction in order fulfilment time provides the company with the opportunity to potentially manage and satisfy an increased number of current customer orders or open new markets to additional customers. In fact, the implementation of the proposed strategies will allow the company under study to take some orders from important customers that had not been taken previously because of the inability to respond in a timely fashion. Moreover, the company knows that to stay alive in their competitive market, they need to continue to implement world-class initiatives, like the proposed in this study.
Likewise, improving the number of order lines picked per man-hour, in particular, translates into greater employee productivity, reducing idle time while increasing resource utilization. This again may bring some extra benefits such as: increase the ability to receive and satisfy more orders, increase company’s profit, which ultimately, could serve to provide more competitive salaries and wages to employees. In general, there are many economic advantages that may result from reducing order fulfilment time: significant reduction in inventory, less variability in the demand, less expedited orders, among others. This eventually becomes a virtuous cycle, by carrying fewer inventories and improving its processes in a continuous basis, companies may be able to reduce fulfilment time further. 6 Conclusions
In this paper the impact of three picking strategies (slotting, wave picking and levelling labour’s workloads) on order fulfilment time is evaluated on an actual Hardware & Tools manufacturer DC via simulation. Two scenarios are evaluated: a baseline scenario, which represents the current operation; and a projected scenario, which considers the implementation of the proposed strategies.
Simulation results show important improvements when implementing the proposed strategies: 55% decrease in average fulfilment time; 70% increase on the number of order lines picked per man-hour; 58% reduction in average picking time; and idle time is also reduced as pickers fulfil
a larger number of orders. Recall that these improvements were achieved by keeping the same infrastructure and human resources. In general, there are many economic advantages that may result from reducing order fulfilment time: significant reduction in inventory, less variability in the demand, less expedited orders, among others.
Although the combination of the three picking strategies achieve important results, only 94% of the orders are completed in less than 8 hours, which is the world-class standard pursued by the company. Further studies are needed to develop strategies that help achieve 100% of orders completed in less than 8 hours. Some potential strategies for future work are the following: Slotting strategy for items stored at AS/RS (Z3), balance workload of all picking zones (Z2 and Z3), (the current study only considered this strategy for the medium & large items storage zone (Z1)) and lastly, analyse and propose different picking strategies when orders of 50 or more order lines are received (this type of order is yet out of the 8 hours standard).
Finally, even though the focus of this research is on measuring response time to costumers, future studies should be conducted to evaluate quality-oriented KPIs, such as fill order rate and customer satisfaction.
References [1] SU, Z., FU, Y., TAN, G., HU, Y.: Application of
Discrete-Event Simulation in Distribution Centre Design Procedure. Framework & Cases Study, International Conference on E-Product E-Service and E-Entertainment, 7-9 Nov, Henan, pp. 1-4, 2010. doi:10.1109/ICEEE.2010.5661571
[2] RUSSELL, R. S., TAYLOR III, B. W.: Operations and Supply Chain Management, 8th edition, New Jersey, Wiley, 2013.
[3] RUSHTON, A., CROUCHER, P., BAKER, P.: The Handbook of Logistics and Distribution Management, London, Kogan Page, 2014.
[4] VITASEK , K., HARRITY , C., O’DONOGHUE , K., SYMMES , S.: Warehousing & Fulfilment Process Benchmark & Best Practices Guide, Supply Chain Visions, 2007.
[5] COYLE, J. J., BARDI, E. J., LANGLEY, C. J.: The Management of Business Logistics: A Supply Chain

Acta lActa lActa lActa logisticaogisticaogisticaogistica ---- International Scientific Journal about LogisticsInternational Scientific Journal about LogisticsInternational Scientific Journal about LogisticsInternational Scientific Journal about Logistics
Volume: 6 2019 Issue: 4 Pages: 103-114 ISSN 1339-5629
EVALUATING THE IMPACT OF ORDER PICKING STRATEGIES ON THE ORDER FULFILMENT TIME: A
SIMULATION STUDY
Mercedes Urzúa; Abraham Mendoza; Akbal O. González
~ 113 ~
Copyright © Acta Logistica, www.actalogistica.eu
Perspective, 7th edition, St. Paul, South-Western College Pub, 2002.
[6] WON, J., OLAFSSON, S.: Joint order batching and order picking in warehouse operations, International Journal of Production Research, Vol. 43, No. 7, pp. 1427-1442, 2005. doi:10.1080/00207540410001733896
[7] GU, J., GOETSCHALCKX, M., MCGINNIS, L. F.: Research on warehouse operation: A comprehensive review, European Journal of Operational Research, Vol. 177, No. 1, pp. 1-21, 2007. doi:10.1016/j.ejor.2006.02.025
[8] LEUNG, K.H., CHOY, K-L. T., TAM, M.M.C., CHENG, S.W.Y., LAM, C.H.Y., LEE, J.C.H., PANG, G.K.H.: Design of a Case-Based Multi-Agent Wave Picking Decision Support System for Handling E-Commerce Shipments’, PICMET 2016 - Portland International Conference on Management of Engineering and Technology: Technology Management For Social Innovation, 4-8 Sept., Honolulu, pp. 2248-2256, 2016.
[9] ÇEVEN E., GUE, K. R.: Optimal Wave Release Times for Order Fulfilment Systems with Deadlines, Transportation Science, Vol. 51, No. 1, pp. 52-66, 2017. doi:10.1287/trsc.2015.0642
[10] FRAZELLE, E. H.: World-class Warehousing and Material Handling, 2nd edition, New York, McGraw Hill Education, 2016.
[11] MULCAHY, D. E., DIELTZ, J.: Order-Fulfilment and Across-the-Dock Concepts, Design, and Operations Handbook, Boca Raton, St. Lucie Press, 2004. doi: 10.1201/9780203998144
[12] JONES, E.C., BATTIESTE, T.: Golden Retrieval, Industrial Engineer, Vol. 36 No. 6, pp. 37-41, 2004.
[13] ROODBERGEN, K. J., VIS, I. F.: A survey of literature on automated storage and retrieval systems, European Journal of Operational Research, Vol. 194 No. 2, pp. 343-362, 2009. doi:10.1016/j.ejor.2008.01.038
[14] BEAVERSTOCK, M., GREENWOOD, A., LAVERY, E., NORDGREN, W.: Applied Simulation Modelling and Analysis using FlexSim. Kindle edition, Orem, FlexSim Software Products, Inc., 2011.
[15] PEKARČÍKOVÁ, M., TREBUŇA, P., MARKOVIČ, J.: Simulation as part of industrial practice, Acta Logistica, Vol. 2, No. 2, pp. 5-8, 2015. doi:10.22306/al.v2i2.36
[16] FlexSim Software Products, Inc., Orem, UT, USA. Available: https://www.flexsim.com/ [15 January 2019], 1993.
[17] MALMBORG, C. J., AL-TASSAN, K.: An integrated performance model for order picking systems with randomized storage, Applied Mathematical Modelling, Vol. 24 No. 2, pp. 95-111, 2000. doi:10.1016/S0307-904X(99)00009-8
[18] PETERSEN, C. G., AASE, G.: A comparison of picking, storage, and routing policies in manual order picking, International Journal of Production Economics, Vol. 92 No. 1, pp. 11-19, 2004. doi:10.1016/j.ijpe.2003.09.006
[19] GIBSON, D. R., SHARP, G. P.: Order batching procedures, European Journal of Operational Research, Vol. 58 No. 1, pp. 57-67, 1992. doi:10.1016/0377-2217(92)90235-2
[20] DE KOSTER, R., VAN DER POORT, E. S., WOLTERS, M.: Efficient order batching methods in warehouse, International Journal of Production Research, Vol. 37, No. 7, pp. 1479-1504, 1999. doi:10.1080/002075499191094
[21] PETERSEN, C. G.: An evaluation of order picking policies for mail order companies, Production and Operations Management, Vol. 9, No. 4, pp. 319-335, 2000. doi:10.1111/j.1937-5956.2000.tb00461.x
[22] DEKKER, R., DE KOSTER, M., ROODBERGEN, K. J., VAN KALLEVEEN, H.: Improving Order-Picking Response Time at Ankor's Warehouse, Interfaces, Vol. 34, No. 4, pp. 303-313, 2004. doi.org/10.1287/inte.1040.0083
[23] MANZINI, R., GAMBERI, M., PERSONA, A., REGATTIERI, A.: Design of a class based storage picker to product order picking system, The International Journal of Advanced Manufacturing Technology, Vol. 32 No. 7/8, pp. 811-821, 2007. doi:10.1007/s00170-005-0377-2
[24] DUKIC, G., OLUIC, C.: Order-picking methods: improving order-picking efficiency, International Journal of Logistics Systems and Management, Vol. 3, No. 4, pp. 451-460. 2007. doi:10.1504/IJLSM.2007.013214
[25] CHACKELSON, C., ERRASTI, A., CIPRÉS, D., LAHOZ, F.: Evaluating Order Picking Performance Trade-offs by Configuring Main Operating Strategies in a Retail Distributor: A Design of Experiments approach, International Journal of Production Research, Vol. 51, No. 20, pp. 6097-6109, 2013. doi:10.1080/00207543.2013.796421
[26] PEDRIELLI, G., CHEW, E. P., LEE, L. H., DURI, A., LI, H.: Hybrid order picking strategies for fashion E-commerce warehouse systems, Proceedings of the 2016 Winter Simulation Conference, 19 Jan., Washington, pp. 2250-2261, 2016. doi:10.1109/WSC.2016.7822266
[27] WASUSRI, T., THEERAWONGSATHON, P.: An Application of Discrete Event Simulation on Order Picking Strategies: A Case Study of Footwear Warehouses, 30th Conference on Modelling and Simulation (ECMS), May 31st - June 3rd, Regensburg, pp. 121-127, 2016. doi:10.7148/2016-0121
[28] LEUNG, K. H., CHOY, K. L., SIU, PAUL K.Y, HO, G. T.S., LAM, H. Y, LEE, CARMAN K.M.: A B2C e-commerce Intelligent System for re-engineering the e-order Fulfilment Process, Expert Systems with

Acta lActa lActa lActa logisticaogisticaogisticaogistica ---- International Scientific Journal about LogisticsInternational Scientific Journal about LogisticsInternational Scientific Journal about LogisticsInternational Scientific Journal about Logistics
Volume: 6 2019 Issue: 4 Pages: 103-114 ISSN 1339-5629
EVALUATING THE IMPACT OF ORDER PICKING STRATEGIES ON THE ORDER FULFILMENT TIME: A
SIMULATION STUDY
Mercedes Urzúa; Abraham Mendoza; Akbal O. González
~ 114 ~
Copyright © Acta Logistica, www.actalogistica.eu
Applications, Vol. 91, pp. 386-401, 2018. doi:10.1016/j.eswa.2017.09.026
Review process Single-blind peer review process.