evaluating mobility management strategies for reducing
TRANSCRIPT

Victoria Transport Policy Institute 1250 Rudlin Street, Victoria, BC, V8V 3R7, CANADA
www.vtpi.org [email protected] Phone & Fax 250-360-1560
“Efficiency - Equity - Clarity”
Evaluating Mobility Management Strategies for Reducing Transportation Emissions in the Fraser River Basin
10 December 2004
By
Todd Litman Victoria Transport Policy Institute
For
Environment Canada
Summary This report evaluates the benefits, costs and feasibility of 24 mobility management (MM) strategies. Each strategy is describe and rated according to various criteria, including energy, emission and congestion reductions, facility cost savings, consumer impacts, safety impacts and implementation requirements. Examples and case studies are discussed. A spreadsheet model is used to evaluate and compare the strategies. The model takes into account the portion of travel that is affected by each strategy, and the time required to achieve various levels of implementation. The analysis indicates that if properly selected and implemented, mobility management programs can offer economic benefits that exceed their costs. These benefits include reduced traffic congestion, road and parking facility cost savings, consumer cost savings, increased traffic safety, support for more efficient land use patterns, energy conservation and reduced pollution emissions. It identifies eleven strategies that appear to offer the most attractive combination of cost-effectiveness and political acceptability. It discusses barriers to their implementation, and describes actions by various levels of government that could help implement appropriate mobility management strategies.

Evaluating Mobility Management Strategies Victoria Transport Policy Institute
Contents Introduction......................................................................................................................... 3 Evaluation Framework........................................................................................................ 8 Potential Mobility Management Strategies....................................................................... 11
Institutional Reforms and Mobility Management Programs ........................................ 11 Employee Trip Reduction Programs............................................................................. 17 School and Campus Transport Management ................................................................ 26 Tourist and Special Event Transport Management Programs ...................................... 31 Freight Transport Management..................................................................................... 35 Aviation Transport Management .................................................................................. 40 Transportation Management Associations.................................................................... 42 Commuter Financial Incentives .................................................................................... 46 Distance-Based Pricing................................................................................................. 50 Distance-Based Emission Fees ..................................................................................... 53 Pay-As-You-Drive Vehicle Insurance .......................................................................... 55 Fuel Tax Increases ........................................................................................................ 58 Road Pricing.................................................................................................................. 61 Parking Management and Parking Pricing ................................................................... 64 Mobility Management Marketing ................................................................................. 68 Transit Improvements and Incentives........................................................................... 72 High Occupant Vehicle (HOV) Priority ....................................................................... 76 Ridesharing ................................................................................................................... 79 Nonmotorized Transport Improvements and Encouragement ...................................... 82 Telework/Flextime........................................................................................................ 85 Land Use Management ................................................................................................. 88 Carsharing and Alternative Vehicle Ownership Options.............................................. 95 Car-Free Planning and Vehicle Restrictions................................................................. 98 Traffic Calming and Roundabouts.............................................................................. 100 Traffic Speed Reductions............................................................................................ 102
Evaluating Mobility Management Strategies.................................................................. 104 Evaluating Mobility Management Programs .................................................................. 109 Conclusions..................................................................................................................... 110 Action Options ................................................................................................................ 111 References....................................................................................................................... 118
1

Evaluating Mobility Management Strategies Victoria Transport Policy Institute
Scope of Work This study evaluates potential Mobility Management (MM) strategies for reducing transportation energy consumption and emissions in the lower Fraser River Basin (i.e., the greater Vancouver region). It involves the following tasks: • Identify and describe potential transport emission reduction strategies.
• Evaluate potential economic, social and environmental benefits provided by each strategy.
• Evaluate likely equity impacts of each strategy, including fairness, and impacts on physically and economically disadvantaged people.
• Evaluate technical, administrative, legal and political obstacles to mobility management implementation.
• Identify examples and case studies of these strategies, particularly those that are transferable to this region.
• Identify strategies that appear to be justified based on their economic benefits (i.e., that have a positive Benefit/Cost ratio based on economic savings to governments, businesses and consumers), which also help achieve environmental objectives (energy conservation, emission reductions and efficient land use).
• Provide conclusions as to which transportation emission reduction strategies are most suitable for implementation, with recommended targets and implementation programs.
2

Evaluating Mobility Management Strategies Victoria Transport Policy Institute
Introduction Mobility management (also called Transportation Demand Management or TDM) is a general term for strategies that result in more efficient travel behavior. There are many different mobility management strategies which have a variety of impacts. They can affect travel timing, route, destination, mode and frequency. They can provide various benefits including reduced traffic congestion, road and parking facility cost savings, consumer cost savings, increased safety, support for more efficient land use patterns, energy conservation and reduced pollution emissions. They operate at various levels (see box). Some involve policy and planning reforms to support mobility management, or new programs to deliver specific services. Some improve travel options. Others provide an incentive to choose more efficient travel patterns. Some reduce the need for physical travel through mobility substitutes or more efficient land use.
Policy and Planning Changes (Examples: planning, funding tax and institutional reforms)
Program
(Examples: commute trip reduction and school transport management programs)
Incentives and Transportation Alternatives (Examples: commuter financial incentives, improved transit services, PAYD insurance, etc.)
Travel Changes
(Examples: reduced driving, increased walking, cycling, ridesharing, transit, telecommuting, etc.)
Mobility management is an increasingly common response to transport problems, particularly in growing urban areas. These areas are experiencing increased traffic and parking congestion, yet it is difficult to expand facility capacity to accommodate more vehicles. In addition, mobility management solutions can support other environmental, economic and social objectives, including reduced energy consumption and pollution emissions, improved transportation options for consumers, and support for regional land use development objectives. However, various obstacles must be overcome if mobility management strategies are to be implemented to the degree economically justified. • Current transport planning practices tend to focus on just a few objectives and so undervalue
strategies can provide multiple benefits.
• Mobility management often expands institutional responsibilities and requires increased cooperation among government agencies, businesses and other organizations.
• Many mobility management strategies are relatively new so there is limited experience with them. It can therefore difficult to predict their effectiveness, benefits and costs.
• The public is ambivalent about many mobility management strategies.
• Some mobility management strategies, particularly those that involve disincentives such as higher user fees, or land use policy changes, face opposition from special interest groups.
3

Evaluating Mobility Management Strategies Victoria Transport Policy Institute
Market Principles, Distortions and Reforms An efficient market reflects certain principles, including consumer choice, cost-based pricing and economic neutrality in public policies. Market distortions violate these principles, resulting in inefficient use of resources which reduces total benefits to society. Current transport and land use markets are distorted in various ways that tend to increase motor vehicle use. Many vehicle costs are fixed or external. Zoning codes in many communities create dispersed, automobile-dependent land use patterns. Some tax polices tend to favor motor vehicle expenditures over other consumer expenditures. Although individually such distortions may appear modest and justified, their cumulative effects are significant, resulting in significantly more vehicle ownership and use than is economically optimal. Various transportation and land use market reforms can correct these distortions. Such reforms are often considered mobility management strategies. To the degree that mobility management strategies reflect market principles they tend to increase efficiency and net benefits to society. The Vancouver region currently has various mobility management plans and programs: • The Transport 2021 plan, GVRD Livable Region strategic plan, the Greater Vancouver and
Vancouver and Fraser Valley Air Quality Management Plan, the Province’s Going Places plan, the Medium-Range Transportation Plan for Greater Vancouver and the TransLink Strategic Transportation Plan 2000-2005 all contain mobility management components.
• Transportation management is included in the 2010 Winter Olympics plan, including development of the RAV rail transit line to the Vancouver Airport, and support for alternative modes for travel to Whistler during the event.
• Numerous transit service improvements are planned or being implemented by TransLink, BC Transit, and related organizations.
• Pedestrian and cycling improvements are being implemented by local and regional agencies.
• BEST (Better Environmentally Sustainable Transportation) and other non-profit organizations are implementing various mobility management programs.
• Transportation Management Associations have been established in some commercial centers.
• The Jack Bell Foundation supports vanpool and carpool development.
• A long-term sustainability plan for the Vancouver region, developed by CitiesPlus and various partners, includes numerous mobility management strategies.
• Private and public organizations are helping to develop Intelligent Transportation System (ITS) technologies, some of which support mobility management, such as transit improvements, road pricing and more convenient user information.
• The federal Climate Change Plan released December 2002 includes a commitment to “Increase use of urban transit, alternative approaches to passenger transportation and sustainable urban planning” and “More efficient goods transport, including intermodal”.
• Mayor Campbell’s December, 2002 inaugural address included the following statement: “In the coming year we will develop and put forward for consideration a Cool Vancouver strategy…By investing in energy conservation and other initiatives, we should be able to reduce greenhouse gases, generate jobs, save tax dollars and improve public health.”
4

Evaluating Mobility Management Strategies Victoria Transport Policy Institute
Although these plans and programs indicate progress, few have been fully implemented. There are many reasons for this. Some strategies, such as new road and parking user fees face political opposition. Others, such as making employee transit subsidies federal income tax exempt, implementing pay-as-you-drive vehicle insurance, and parking management programs, require cooperation from other levels of government. Some, such as major investments in transit capacity, require additional funding that has not been forthcoming. As a result, mobility management strategies can be viewed in two different ways. They can be considered a set of strategies that have been tried and failed, or they can be considered a set of strategies that have yet to be tried, but could make a major contribution toward addressing regional transport problems if given a chance. It would be a mistake to underestimate the obstacles facing mobility management, including organizational resistance, public skepticism, political opposition and significant implementation costs. On the other hand, it would be a mistake to exaggerate these obstacles and dismiss mobility management. Other reforms that initially seemed difficult have proven successful, including seat-belt promotion, recycling, tobacco use reduction, and various industry restructuring. These indicate that, given suitable information, incentives and encouragement, consumers can accept and eventually embrace changes that affect their behavior. The potential benefits of mobility management strategies are large. When all factors are considered, mobility management strategies are often the most cost effective way to improve transportation, and many consumers benefit directly.
5

Evaluating Mobility Management Strategies Victoria Transport Policy Institute
Evaluating Mobility Management Strategies and Programs Some special factors must be considered when evaluating mobility management strategies and comparing them with alternatives.
Resource Consumption Impacts Versus Economic Transfers Some impacts affect resource costs (total travel time, road space, fuel, clean air, etc.). Other impacts represent economic transfers, resources are transferred from one group to another, representing costs to some and benefits to others. For example, road and parking pricing represents a cost to motorists and a revenue stream to those who collect the fees. Their resource costs include the equipment, administration and time costs of collecting the fees, and any savings that result if such pricing results in more efficient use of road and parking facilities. It is important to avoid treating economic transfers as net costs and benefits when evaluating pricing strategies.
Clean Vehicles Versus Mobility Management There are two general ways of reducing vehicle pollution emissions: 1) use vehicles that are more fuel efficient and less polluting per vehicle-kilometer, and 2) reduce total vehicle-kilometers traveled. Various technologies, programs and incentives can significantly reduce per kilometer emission rates for many pollutants, but the most cost effective of these strategies have already been implemented. Also, clean vehicle programs tend to be slow to implement, depending, in part, on turnover in the vehicle fleet, which averages less than 10% per year. Comparisons of the benefits of clean vehicle and mobility management strategies depends on how they are evaluated. Cleaner vehicles tend to provide two benefits to society (reduced pollution emissions and fuel cost savings), but some tend to exacerbate other transportation problems. For example, as vehicles become more fuel efficient their operating costs per vehicle-kilometer decline, leading to more vehicle travel, which tends to increase traffic congestion, road and parking facility costs and accidents. On the other hand, mobility management strategies reduce energy consumption and pollution emissions, and also reduce other transportation problems. As a result, a narrow analysis that only considers air pollution impacts will tend to favor clean vehicle strategies, while a more comprehensive analysis that also considers other transportation planning objectives tends to give more support for mobility management solutions.
Evaluating Cumulative Impacts The most effective TDM programs usually include a combination of positive incentives (sometimes called “carrots” or “sweeteners”) and negative incentives (called “sticks” or “levelers”). When implemented together they tend to have synergetic impacts (their total impacts are greater than the sum of their individual impacts), so it is important to evaluate a TDM program as a package, rather than each strategy individually. For example, parking pricing and a rideshare program might each reduce commute trips by just 5% if implemented alone, but if implemented together they may reduce 20%, because they provide a combination of positive and negative incentives.
6

Evaluating Mobility Management Strategies Victoria Transport Policy Institute
It is important to avoid double-counting when evaluating programs that include multiple mobility management strategies. For example, commute trip reduction programs often include marketing campaigns, parking cash out and guaranteed ride home services. It would be wrong to count the effects of the commute trip reduction program and these individual strategies. Similarly, per capita vehicle travel tends to be 20-30% lower in new urbanist communities, in part because they have better walking conditions. It would double count to add the travel reduction effects of new urbanism and pedestrian improvements. Special care is needed when calculating the cumulative impacts of several strategies. Total impacts are multiplicative not additive, because each additional strategy applies to a smaller base. For example, if one strategy (e.g., parking pricing) reduces automobile trips by 20%, and a second strategy (e.g., improved transit service) reduces driving by an additional 15%, their combined effect is calculated 80% x 85% = 68%, a 32-point reduction, rather than adding 20% + 15% = 35%. This occurs because the 15% reduction applies to a base that is already reduced 20%. If a third strategy (e.g., an aggressive marketing program) reduces demand by another 10%, the total reduction provided by the three strategies together is 38.8% (calculated as 100% - [80% x 85% x 90%] = 100% - 61.2% = 38.8%), not 45% (20% + 15% + 10%).
7

Evaluating Mobility Management Strategies Victoria Transport Policy Institute
Evaluation Framework Each mobility management strategy is evaluated according to the factors described below.
Description This is a description and general discussion of the strategy.
Obstacles This describes barriers that may need to be overcome for a strategy to be implemented.
Current Status in the Vancouver and Fraser Valley Region This describes current plans and programs to implement a strategy within the region.
Potential Emission Reductions A spreadsheet (available at www.vtpi.org/mm_eval.xls) is used to evaluate potential mobility management strategies, taking into account the following factors:
Sector This refers to the type of transportation affected and its portion of total transport energy use. Table 1 lists these categories and the values used for their analysis.
Table 1 Transport Sectors
Sector Name Sector Energy Use Annual Growth Total 100% 1.5% Freight/Commercial 15% 2.0% Road Vehicles 85% 1.5% Commuting 18% 1.5% Commuters to Major Commercial Centers 5% 1.5% Urban Commuting 10% 1.5% Travel to Schools & Campuses 3% 1.5% Local Street Travel 4% 1.0% Personal trips Under 5 Kilometres 5% 1.5% Tourist Travel 5% 2.0% Air Travel 2% 2.5% Personal Vehicle Travel 80% 1.5% Non-commute Personal Travel 66% 1.5% This table summarizes the assumptions used in this analysis..
Impact This refers to the vehicle-travel, energy consumption and emission reduction per participant (per capita or per-vehicle) that each strategy provides. Take-Up This refers to the portion of a strategy’s sector in which it is implemented at a particular time. For example, commute trip reduction programs may currently apply to 10% of commuters, and a proposed program would increase this to 20% in five years, 40% in ten years, 50% in fifteen years, and 60% in twenty years.
8

Evaluating Mobility Management Strategies Victoria Transport Policy Institute
Congestion Reductions This refers to how much a strategy reduces urban-peak vehicle traffic demand, and therefore reduces traffic congestion, avoids roadway capacity expansions or accommodates additional vehicle travel that could otherwise not occur.
Road and Parking Cost Savings This refers to how much a strategy reduces total vehicle travel and therefore reduces road maintenance and parking facility costs.
Traffic Safety This refers to the impacts that a strategy has on per capita crashes and fatalities.
Land Use Impacts (“Smart Growth”) This refers to whether a strategy supports regional land use objectives such as greenspace preservation, infill development and multi-modal accessibility.
Consumer Costs This refers to how a strategy affects consumer transportation costs, including vehicle expenses, transit fares and residential parking costs.
Transportation Options This refers to how a strategy affects the variety and quality of transportation options, particularly for non-drivers.
Equity Impacts Two types of equity impacts are considered:
Horizontal Equity This means that people are treated equally. It generally means that people should, “get what they pay for and pay for what they get,” and that subsidies and external costs should be minimized unless specifically justified, for example, to support vertical equity objectives. Vertical Equity This refers to impact on disadvantaged people. It generally means that costs should not be regressive with respect to income, and that people who are transportation disadvantaged should have adequate basic access and mobility.
Technical and Administrative Requirements This refers to the costs and institutional requirements for implementing this strategy, including those to public and private organizations.
Public/Political Acceptability This refers to expected public and political issues related to implementing this strategy.
9

Evaluating Mobility Management Strategies Victoria Transport Policy Institute
Implementation This describes how this strategy is typically implemented. The factors described above are summarized in a table, such as the one below. Table 2 Summary Table - Example
Sector RatingImpact (per participant)
Take-Up (portion of sector participating)
Congestion Reduction Road and Parking Cost Savings
Traffic Safety Land Use Impacts (“Smart Growth”)
Consumer Costs Transportation Options
Equity Impacts Technical and Administrative
Requirements
Public/Political Acceptability Implementation
Rating from 3 (very beneficial) to –3 (very harmful). A 0 indicates no impact or mixed impacts.
Basis for Estimates of “Impacts” and “Take-Up” This section discusses how estimates of “impacts” (percent reductions in energy consumption, emissions and mileage within a sector), and “take-up” (the degree to which a particular strategy could be implemented), under optimistic but reasonable conditions, that is, assuming that there is a high degree of support for their implementation. An attempt was made to develop these estimates with a group of experts, but this proved too complex given available resources (see the attached report on the April 2003 workshop), so the estimates in this report reflect the author’s judgment, intended for preliminary analysis. Future analysis should use additional research and stakeholder inputs for these factors.
Conclusions This summarizes the potential of a particular strategy for achieving regional transportation improvement objectives.
Action Options This describes potential actions by Environment Canada to help implement this strategy.
10

Evaluating Mobility Management Strategies Victoria Transport Policy Institute
Potential Mobility Management Strategies This section describes various mobility management strategies that can potentially reduce vehicle energy consumption and emissions. More detailed information on each strategy is available in the “Online TDM Encyclopedia” (www.vtpi.org/tdm), and other references listed in this report.
Institutional Reforms and Mobility Management Programs Institutional reforms are policy and planning changes that support mobility management, such as “least cost” planning practices that allow mobility management programs to compete equally with capacity expansion projects for resources. A mobility management program is an institutional framework within an organization such as a transportation agency, campus administration or private business that implements mobility strategies. Such a program has stated goals, objectives, a budget, staff, and a clear relationship with stakeholders.
Obstacles Institutional reforms often face a variety of obstacles because they involve changing existing practices and relationships. Mobility management programs require staffing and funding. They may face competition and opposition from other transport programs.
Current Status in the Vancouver and Fraser Valley Region Various government agencies, private organizations and businesses have implemented reforms to better support mobility management. TransLink itself reflects mobility management objectives (i.e., the organization plans for all modes together and implements mobility management programs). On the other hand, many organizations that make decisions affecting regional travel patterns still have policies and planning practices that underprice vehicle travel, and favor private automobiles over alternative modes. For example, funding for parking facilities is generally not transferable to mobility management programs, even if they can avoid the need to increase parking capacity. There are a number of mobility management programs in the Vancouver region, including programs in TransLink, BEST, the city of Vancouver, the University of British Columbia, the Cambie Corridor area, and some employers.
11

Evaluating Mobility Management Strategies Victoria Transport Policy Institute
Case Studies and Examples TravelSmart Program: Kamloops, British Columbia (www.city.kamloops.bc.ca/transportation/plans/travelsmart.html) The TravelSmart program in Kamloops, British Columbia, promotes changes in travel behaviour and encourages sustainable community development in order to minimize demands on the municipal transportation system. Kamloops’ population, which is expected to increase from 85,000 to 120,000 by 2020, is placing increased demands on the city’s transportation system and causing growing concern about quality of life amongst residents. Launched in January 1997, TravelSmart includes these ongoing initiatives: Land use integration: Recognizing the strong links between transportation and land use, the city’s official plan was revised to minimize the demand for car travel by influencing growth patterns. The plan now favours a compact form of development, situating accommodation close to employment and community services, and increasing density of the central area. Less expensive road structure alternatives: To avoid expensive improvements to road networks, the city has slowed or halted development in some areas and identified underutilized arterial corridors for access to the downtown core. Rather than building bypasses over the busy highway that runs through town, the city encourages residents to use alternatives to the highway. Improved public transit: A comprehensive travel plan was developed to improve the level of service and provide alternatives to the single occupant vehicle. Some improvements include increased frequency of service to outlying communities and the use of smaller buses that feed into the main system. Promoting bicycle use: The Kamloops Bicycle Plan identifies $6 million worth of additional cycle routes and initiatives for businesses to provide “end of trip” facilities to cyclists, such as showers and bike racks. Promotional programs: Transport alternatives, such as carpooling, biking and walking, are promoted through workshops and seminars in workplaces; the “Safe Routes to School” program in schools; “Go Green” billboards on commuter streets; and door-to-door neighborhood education by city staff. The plan recognizes the need for an ongoing awareness campaign and community involvement to sustain TravelSmart. Total project planning costs $300,000, of which $245,000 was funded by the city and $55,000 by the province. The full program is funded through city’s general revenue, development cost charges, the B.C. Transportation Financing Authority, specific developers and BC Transit. TravelSmart will be updated every five years as one component of “Kamplan”, the city’s growth management strategy. After three years of operation, the program has improved air quality and reduced planned road expenditures by 75%. • Reducing anticipated road expenditures from $120 million to $14 million. • Reducing annual per capita energy consumption from 128 to 125 gigajoules. • Reducing annual per capita carbon dioxide emissions from 7,200 to 7,000 kg.
12

Evaluating Mobility Management Strategies Victoria Transport Policy Institute
Community Transportation Action Program The Ontario Community Transportation Action Program (CTAP) was launched in August 1996 as a joint venture of five ministries: Transportation, Education and Training, Citizenship, Culture and Recreation, Community and Social Services, and Health. CTAP’s mandate was to help communities restructure and coordinate their local transportation services. CTAP supported the development of innovative, local transportation services. In the past, exclusive relationships existed between users and providers of transportation. For example, school boards would typically contract school bus operators to provide transportation; municipalities would provide or contract public transit services; social service agencies would use volunteers and/or agency vans; and health facilities would primarily use ambulances. Improved coordination of transportation resources can result in less duplication, less inefficiency and fewer gaps in service. It also breaks down barriers between client groups, thus providing a wider range of vehicles to meet users’ needs in a more flexible and cost-effective manner. For example, in some communities, rather than sitting idle, school buses are being used between morning and afternoon student runs to transport seniors and persons with disabilities. In a remote northern Ontario community, the Board of Education has contracted with the local Meals on Wheels to transport disabled students to school in its van. This provides an economical solution for the school board and helps to offset the cost of the van for Meals on Wheels. Regional Transportation Operations (www.ite.org/library/reg_trans_ops.htm) Regional Operating Organizations (ROOs) are partnerships among transportation and public safety agencies to provide coordinated transportation operations on a regional basis. These cooperative efforts take different forms depending on the transportation needs, resources, existing policies, and institutional relationships within the region. They:
• Bring together transportation, public safety, and emergency management operators to provide more effective management of incidents, disasters, and emergency evacuations.
• Establish new transport funding sources and regional control of highway and transit assets.
• Reduce construction and incident-related delays, improve planning, and reduce overhead costs by share information systems among agencies.
• Improve cooperation between public agencies and private partners.
• Improve transit services by implementing a common smartcard fare collection systems. UK TDM Policies and Programs The United Kingdom has made major commitments to TDM as a solution to transportation problems. The UK Department of the Environment, Transport and the Regions (www.local-transport.detr.gov.uk/gtp/index.htm) provides information on “Green Transport Plans.” Office of Operations (www.ops.fhwa.dot.gov) Office of Operations is a U.S. Federal Highway Administration department that promotes innovative policies and programs that result in more efficient and cost effective use of roadway systems. It coordinates research, planning and implementation related to mobility management, freight management and intelligent transportation system programs.
13

Evaluating Mobility Management Strategies Victoria Transport Policy Institute
BC Alternative Development Standards (www.marh.gov.bc.ca/GROWTH/NOV1996/alt.html) Kelowna’s Kettle Valley a First Kelowna’s Kettle Valley is the first of three new neighbourhoods to be developed in a community village concept. In the first neighbourhood, 1,028 residential units will be focused around a 50,000 square-foot neighbourhood commercial centre. Build-out will occur over a 20-year period. The project developer and the city have created a neotraditional neighbourhood which encourages pedestrian traffic over cars and focuses activity in a centralized commercial area. “There are a lot of ‘firsts’ for Kelowna with this project,” said Hazel Christy, Kelowna’s Manager of Special Projects. “We have created a new, comprehensive development zone based on the neighbourhood village concept.” Other features include a seniors’ residential and care centre, residential units above mixed use commercial, reduced building setbacks and hillside development. Lantzville Fights Urban Sprawl The Regional District of Nanaimo proposes to use ADS to achieve densified village cores in Lantzville and Cedar Village and to create village centres in the Shaw Hill - Deep Bay area. The goal is to create urban enclaves within rural areas while limiting urban sprawl. “Our basic philosophy is to accommodate growth in denser communities and not waste the land we have,” said Electoral Area Director Bob Jepson. The plan uses what Jepson calls “modern tools” for planning: density bonusing, promoting residential uses above commercial and discouraging large-lot subdivisions in favour of smaller lots. To meet the need for seniors’ housing, the area is proposed to accommodate townhomes and a care facility. Jepson believes public education and involvement are vital to elicit community support and the RDN has held round-table discussions with groups in the area. “We try to educate rather than legislate,” he said. Salmon Arm: Thinking Ahead Salmon Arm, with its population of 16,000, is a growing community that has incorporated many ADS into its goal of achieving compact communities. “Our community had been allowed to develop through the creation of subdivisions literally miles from each other,” said Salmon Arm Mayor Ian Wickett. “It was really a necessity to implement a different planning approach that was more cost-effective.” Council divided Salmon Arm into four development areas and started by densifying the downtown area to maintain a living core to the community. “We still have a downtown that people shop in,” said Mayor Wickett. He added that the development of mixed-use housing in the past few years, including rental housing, has proved to be very popular. Surrey Plans for the Future Surrey’s Clover Valley Station - a partnership development - is a compact-lot neighbourhood of 215 affordable detached homes. The subdivision is pedestrian-friendly with homes situated on lots with narrow frontages and minimal side yards. Car access is from rear lanes. The homes provide an affordable and popular choice for home buyers who prefer fee simple ownership to strata title. Council has approved in principle an additional 335 compact lots at Clover Valley Station. The first phase of Panorama Village, another compact community with average lot sizes of 2,400 square feet, is also underway in Surrey. “In both projects, application of neo-traditional design creates a sense of spaciousness between the small lots, and the clustering of houses has created significant open spaces, preserving valuable views,” said Surrey Mayor Bob Bose.
14

Evaluating Mobility Management Strategies Victoria Transport Policy Institute
Table 3 Mobility Management Program Summary
Sector All trips. Is a foundation for many specific MM strategies. Impact (per participant) Varies. Can be large (i.e., can reduce 10%+ of travel in an
area or organization compared with no reforms or programs).
Take-Up 10%, 20%, 30%, 40%, 50% Congestion Reduction Significant potential benefits. 3
Road and Parking Cost Savings Significant potential benefits. 3 Traffic Safety Significant potential benefits. 2
Land Use Impacts (“Smart Growth”) Significant potential benefits. 2 Consumer Costs Often increases overall consumer travel options and savings. 2
Transportation Options Often increases travel options. 2 Equity Impacts Often increases travel options and consumer savings. 2
Technical and Administrative Requirements
Moderate to large -2
Public/Political Acceptability Likely to be some political and institutional resistance. -3 Implementation Requires various changes to policies and organizations.
Rating from 3 (very beneficial) to –3 (very harmful). A 0 indicates no impact or mixed impacts.
Basis for Estimates of “Impacts” and “Take-Up” This strategy’s impacts are highly variable, depending on the specific type of reforms and programs, and the conditions in which they are implemented. Reductions of 10% or more of affected vehicle travel are common. Many jurisdictions and agencies are implementing some of these reforms and programs, particularly in the largest cities, but they face various obstacles, and some levels of government are slow to respond, so moderate growth is likely. I estimate that currently, 10% of potential reforms and programs have been implemented, and with aggressive effort, take-up could achieve 50% in 20 years.
Conclusions Mobility management programs and institutional reforms provide a foundation for implementing specific mobility management strategies. Regional organizations have implemented some reforms, and some mobility management programs have been established, but there are opportunities for additional reforms and programs.
Action Options
• Develop tools to better evaluate the full economic, social and environmental impacts of transportation policies and projects, including mobility management programs.
• Develop an “Office of Operations” within transportation agencies to provide an organizational home for research, planning and implementation related to mobility management, freight management and related programs.
• Perform a detailed review and consultation to identify appropriate mobility management reforms suitable for implementation by regional and municipal agencies.
• Develop a cooperative program involving federal (Environment Canada, Transport Canada, Natural Resources Canada), provincial and regional agency officials to implement regional mobility management plans.
• Develop federal policies to encourage mobility management programs, such as making federal grants contingent on implementation of local and provincial programs and reforms.
15

Evaluating Mobility Management Strategies Victoria Transport Policy Institute
• Allow federal infrastructure grants to be used for transport program operations, including
mobility management programs, rather than limiting them to capital expenditures.
• Allow mobility management programs to qualify for emission reduction credits.
• Provide incentives for local and regional governments to implement institutional reforms such as least cost planning practices and alternative development standards.
• Sponsor workshops and other professional development to educate decision makers concerning potential transportation policy reforms.
16

Evaluating Mobility Management Strategies Victoria Transport Policy Institute
Employee Trip Reduction Programs Employee Trip Reduction (ETR) (also called Commute Trip Reduction) programs give commuters resources and incentives to use more efficient modes. ETR programs typically include some of the following services and incentives:
• Commuter financial incentives (Parking Cash Out and Transit Allowances). • Rideshare services, ridematching assistance and corporate pool vehicles. • Parking management and parking pricing. • Alternative work scheduling (flextime and compressed work weeks). • Telework and Flextime support. • Marketing and promotion. • Guaranteed ride home services. • Walking and cycling improvements (including bicycle parking). • Worksite location that supports use of alternative modes. • Amenities such as on-site childcare and shops to reduce the need to drive for errands.
They are usually provided by employers through facilities or personnel departments, and may be supported by business associations, local governments or transit agencies. Some jurisdictions require certain employers (typically those with more than 50 or 100 employees at an urban worksite) to implement ETR programs. British Columbia does not have such requirements. ETR programs can provide various benefits to employees (better travel options, financial rewards, etc.) and employers (parking cost savings, improved employee moral, etc.) and so are sometimes implemented voluntarily.
Obstacles ETR programs require cooperation among employers, local officials, labour organizations and employees. To be effective they need adequate resources from employers and management support. Most employers only perceive a small portion of total benefits (particularly if they own adequate parking supply) and so have modest incentive to implement such programs.
Current Status in the Vancouver and Fraser Valley Region There are currently several ETR programs in the Vancouver and Fraser Valley area, described below. Go Green (www.gogreen.com) Go Green is a regional program managed by BEST (www.best.bc.ca) under contract to TransLink and Environment Canada to encourage more sustainable transportation. It includes Go Green Choices, which provides information and services that support employer-based programs to reduce automobile commute trips. BEST also manages the regional Commuter Challenge program, a friendly competition between regional employers to see which can reduce the most transportation air emissions by changing commute modes. This event is part of the national Commuter Challenge initiative.
17

Evaluating Mobility Management Strategies Victoria Transport Policy Institute
Travel Options (www.transitbc.com/traveloptions) BC Transit offers the Travel Options program to encourage and assist employers to implement trip reduction programs. BC Transit has produced a Travel Options Manual (Transport Canada developed a national version of this document, called Commuter Options: The Complete Guide for Canadian Employers, www.tc.gc.ca/commuter), and sponsors Travel Option Coordinator training. The Employer Pass Program provides a 15% discount for annual transit passes purchased through employers. TransLink Employer Services Program (www.translink.bc.ca/Programs_and_Services) TransLink provides various services and products to support the development and implementation of a range of cost-effective commuting options for employers and their employees. This includes Go Green Coordinator training, information displays, employee orientation, personalized transit route planning, a 15% discount to employees who purchase transit passes through payroll deductions, and more intensive and tailored support for the development of commuting options at major employment sites through the On-Board program. GVRD ETR Program (www.toolsofchange.com/English/CaseStudies/default.asp?ID=28) The GVRD has a successful Employee Trip Reduction program for its employees, described below.
Case Studies and Examples GVRD ETR Program (www.toolsofchange.com/English/CaseStudies/default.asp?ID=28) The Greater Vancouver Regional District (GVRD)’s Employee Trip Reduction (ETR) Program was established in 1996 by the agency’s Employee Environmental Awareness Committee. The program was adopted as a corporate initiative supported by all of GVRD’s departments. The program’s initial objective was to increase average vehicle ridership (AVR) from 1.56 to 2.0. To prepare the plan GVRD performed general research on ETR programs and measured existing commute mode split, and surveyed employees concerning travel options. This helped identify barriers and opportunities. For the first year, a full-time coordinator was allocated to the development and implementation of the ETR Program. The coordinator position was reduced to half time after the first year, and the responsibilities split among several employees. A cornerstone of GVRD’s strategy was the phasing out of a 60% employee parking subsidies. Subsidies were phased out over a five-year period starting six months after the program began. The subsidy phase out, as well as administration of savings for other employee benefits, were negotiated as part of a new contract between GVRD management and the employees’ union. To register for the Trip Reduction Program, employees filled out a form indicating their willingness to use resource-efficient commuting alternatives to driving alone, at least one day per week. The one-day-per-week minimum provided participants with great flexibility, and a doable first step that might lead to greater involvement. The program contained six initiatives:
1. Carpool Ride-Matching Program A ride-matching program was implemented to help employees carpool. Employees filled out ride-matching forms which identify the nearest major intersection to home, usual work start and finish times, and their preference for being a driver, passenger, or both. An Employee Transportation Coordinator provided information about the program and processed the forms.
18

Evaluating Mobility Management Strategies Victoria Transport Policy Institute
A two-month trial period was offered during which employees were not required to give up their parking spots, for which there was a waiting list of up to five years. During this time they were reimbursed for their monthly parking payroll deductions. A corporate carpooling fleet was made available - at a charge of 26¢ per kilometer to recover 100% of the cost of insurance, parking, gas and maintenance - to carpool groups that did not have access to a vehicle. Employees were required to sign an agreement to use the cars strictly for commuting purposes. When subsidies for employee parking were phased out, incentives were added to encourage carpooling. Carpools with two riders can claim a 50% reimbursement of parking payroll deductions. Carpools with three or more riders can claim a 100% reimbursement. 2. Vanpool Empty Seat Insurance While all Vancouver commuters have access to a vanpool service operated by the Jack Bell Foundation, vanpools are sometimes forced to disband when a member dropped out, because a replacement could not be immediately found. The GVRD therefore offers Empty Seat Insurance to cover the cost of one empty seat for a period of up to two months per year. The two-month period is considered a reasonable time frame in which to find a replacement. 3. Cycling Safety Workshops and Worksite Facility Upgrades Safety workshops were organized for employees who were prepared to cycle to work but were unsure about the best travel routes, or were concerned about traffic safety. Cycling coaches provided through Better Environmentally Sound Transportation (BEST) (www.best.bc.ca) mapped out individualized routes and accompanied participants on a trial run. Free bicycle maintenance workshops were also provided. Improvements were also made to shower facilities at work sites, and more bicycle racks were installed. One racks was placed at the building’s front entrance, and a cage for up to 50 bicycles was provided in an underground parking lot, replacing some existing car parking spots. 4. Guaranteed Ride Home Service A Guaranteed Ride Home Service was provided free-of-charge to ensure that individuals enrolled in the Employee Trip Reduction Program were not left stranded at the office in cases of emergency, unscheduled overtime, or missed rides. The service was available to program participants, up to a maximum of four times per year, on days when they didn’t drive alone. A department receptionist would either arrange for use of a corporate car, or would call a taxi and issue a voucher. 5. Flextime As long as it did not interfere with a department’s operational requirements, participants could change the times they start and end work by up to one-half hour, to better accommodate commuting via carpooling, public transit, cycling, walking, or jogging. 6. Subsidized Transit Program To encourage use of public transit for local business travel, transit tickets are available free-of-charge from each department. Employees could also purchase monthly transit passes through payroll deduction and receive a 15% discount. To receive the discount, employees were required to sign a contract with BC Transit agreeing to purchase the monthly transit passes for a period of 12 consecutive months. BC Transit representatives held workshops at GVRD work sites. Participants received information about the most direct commuting routes, visually demonstrated using computers. Estimated travel times were also calculated. Each participant then received a personalized printout of the results.
19

Evaluating Mobility Management Strategies Victoria Transport Policy Institute
Electronic mail and posters were used to promote these initiatives. Information about the program could be also obtained by calling a hot-line staffed by an Employee Transportation Coordinator, or by visiting one of three staffed Commuter Information Centers. The centers contained public transit maps and schedules, public transit pass applications, a cycling commuter map, a bulletin board with transportation related information, and up-to-date information on existing carpools. To strengthen the motivation of participants and to encourage non-participating staff to join in, steps were taken to increase visibility. For example, a monthly employee newsletter included photographs of individuals using the promoted commuting practices. Designated carpool parking spots were clearly marked for all to see. Prizes were given for participation in monthly Clean Air Days. Ballot boxes were placed at highly visible locations. The table below shows program results after one year. Table 4 GVRD Employee Commute Data
Before (1996) After (1997) 1998 Target SOV 57% 46% 40% Rideshare 15% 21% 20% Public Transit 19% 22% 30% Cycling 3% 5% 3% Walking/jogging 6% 6% 8% Telecommuting 0% 0% 3% To build on this success, the GVRD developed the Go Green Choices program modeled its ETR program, which offers the following services to other employers:
• Distributing a brochure (It’s Your Business: Commuting Alternatives for your Workplace) to help in selling participation to key decision makers at each workplace.
• Training a designated employee at each workplace as a Go Green Coordinator, to create and manage the trip reduction program at the workplace.
• Providing a Go Green Coordinator’s Kit, including a guide with instructions and checklists.
• Templates for e-mails, memos, and employee transportation surveys.
• A brochure, poster and postcard for use with employees.
• Facilitating a ride-matching service.
• Offering free on-going assistance. The Go Green Choices program was positioned to employers as a service that would improve their workplace and their profit-margins. The following links were made to common employer-related motivators: • Monetary savings through parking management. • Lower demand for office space through telecommuting. • A healthier more productive workforce with reduced absenteeism due to more employees
cycling, running or walking to work. • A competitive advantage resulting from a higher public profile and boosted employee morale.
20

Evaluating Mobility Management Strategies Victoria Transport Policy Institute
Commute Travel Reduction (www.fhio.gc.ca/commuting/commuting.htm) The Canadian Federal House In Order (FHIO) website provides information on several successful Commute Trip Reduction programs, as summarized in the table below. Each description includes information on the program’s tools, background, target audience, program description, main components, communications, resources required, results, lessons learned, resources and transferability. Table 5 Successful Canadian Employee Trip Reduction Programs
Public Transit
Bike/ Walk
Carpool/Vanpool
Business Travel
Telework
Walk & Roll (Go For Green) X X X X AT&T Telework X X Cambie Corridor X X X X X Commuter Challenge X X X X X GVRD Employee Trip Reduction X X X X Episodic Clean Air Days X X X X X Go Green Choices (BEST) X X X X Smart Program X X X X X Share-A-Ride-And-Save X Nortel Networks (www.toolsofchange.com/English/CaseStudies/default.asp?ID=147) When Nortel Networks decided to expand their Carling Avenue campus in a suburban area of Ottawa, one of the municipality’s approval conditions was that the company initiate a Employee Trip Reduction (ETR) program there. In response, Nortel Networks designed GreenCommute and teamed up with municipal and regional government agencies, OC Transpo and the National Capital Commission. Together, these partners initiated a wide-ranging ETR program for the 8,000 people who would ultimately work at the site. The program’s goal was “to enhance and promote alternative commuting practices in an effort to proactively confront environmental issues facing our communities.” Its objectives are to:
1. Increase the portion of non-auto trips from 12% to 15% by 2000, and to 25% by 2005.
2. Increase average auto occupancy from 1.12 to 1.3 persons per car by 2000, and to 1.5 by 2005. In May 1998, the City of Ottawa conducted a benchmark survey on how employees commute to the existing Carling campus. Average auto occupancy was 1.12 persons per car, and only 12% percent used alternative commute modes (e.g., transit, cycling, teleworking, walking, etc). At the same time, Nortel conducted an on-line survey of the 11,500 employees at its Ottawa campus. That survey consisted of about 50 questions on topics such as: home location, distance traveled to work, regular transportation habits, opinions on various alternatives, receptivity to trying alternative commuting methods, potential barriers and motivating factors. According to the survey, 87 percent of employees were interested in trying alternative transportation. In March 1999, a joint promotion with the City and OC Transpo provided employees at the Carling campus with a coupon redeemable for a free transit pass. Approximately 30% (1,300) of people working at the Carling campus took advantage of this offer. Each pass recipient had to fill out a mini-questionnaire on existing commuting habits. According to that survey, 55% of the respondents usually commuted by car, 31 percent rode the bus regularly, 39 percent rode the bus occasionally, 20 percent hardly ever did, and 10 percent said they never rode the bus.
21

Evaluating Mobility Management Strategies Victoria Transport Policy Institute
Prior to developing the formal TDM program, several fundamental elements were integrated into the site’s design to make access by pedestrians, cyclists, and transit users safer and easier. An extensive network of tree-lined pathways and sidewalks throughout the campus made for pleasant and safe walking, and stop signs at on-site intersections gave priority to pedestrians. Nortel Networks also significantly improved the existing cycling routes leading to its Carling site. In addition, the company worked with the City and Transpo to develop a centrally located transit hub where people could wait for buses and obtain information on routes and scheduling. A television screen at the hub displayed bus arrival time information. OC Transpo doubled transit service to the site, increased peak period bus service and provided midday trips to key travel destinations. With these infrastructure elements in place, the stage was set for the initiation of the company’s ETR communications. Nortel hired a full-time transportation management Coordinator in March 1998. Having a Coordinator on-site ensured program consistency and leadership; having a single point of contact facilitated employee and partner participation. Once the program identity and strategy were developed, an initial on-line survey (see Getting Informed) introduced GreenCommute to people working at the Carling Campus (Work Programs that Influence the Home). The survey provided basic information on the GreenCommute program, why it was being introduced, what its goals were, and told people that the program would be developed based on their needs and priorities. Information was requested on existing commuting habits and people were asked their opinion on the various alternative modes. By the time the GreenCommute program was formally launched a year later, on March 22, 1999, people were starting to move into the new buildings and were already taking advantage of the available infrastructure at the site – a key element of the program’s resources. The on-line survey indicated that many commuters have trouble finding compatible carpool partners. Nortel Networks developed its own custom intranet-based ride-matching system, which it launched in December 1998. This self-serve program allowed registered members to search for compatible carpool partners based on a variety of selected criteria. As an incentive to carpool, preferential parking locations (closer to the main building) were provided for carpoolers. One of the three reserved lots was originally reserved for carpoolers with three or more occupants; that was downgraded to two or more. In order to park in these areas, drivers had to obtain a special GreenCommute sticker through the custom developed carpool registration system and place it on their windshield. This windshield sticker later evolved into a hangtag. In March 1999, a formal media event was held to promote Test Ride Transit, a joint promotion with the City of Ottawa, OC Transpo, and Nortel Networks. This introduced the GreenCommute program and inaugurated the new Transit Hub. On that day employees at the Carling campus found kit folders enclosed in a reusable lunch bag waiting on their desks with information on alternative commuting specific to the Carling campus, and a coupon for a free April transit pass. The pass was aimed at enticing those who had never tried or seldom used transit, to ride the bus for one month. An outstanding 29% (1,300 people) of Carling employees took advantage of this pass, and filled out a pre-trial questionnaire to gauge commuting habits. As a result of the promotion, OC Transpo had a 25% increase in transit ridership for the month of April. The Nortel Networks Bicycle Users Group (NORBUG), Citizens for Safe Cycling, and GreenCommute sponsored Cycling Promotion Week. This event included demonstrations on safe cycling and different bicycle designs, and resulted in a 50% increase in NORBUG’s Carling membership.
22

Evaluating Mobility Management Strategies Victoria Transport Policy Institute
The Commuter Challenge is a national event aimed at promoting “green” commuting. Although Nortel Networks had participated in previous years, there had been no centralized corporate promotion and participation had been negligible. In 1999 and 2000 participation increased significantly. In 1999, Nortel Networks accounted for a phenomenal 29% of the entire National Capital Region’s participants and in 2000, 20% more Carling employees signed up compared to the previous year. In all three years, Nortel came first in its class. The What Moves You - Transportation Fair 2000 - held in May, 2000 was a daylong on-site event attended by 45% of employees at the Carling site. With the participation of all their partners and companies like Ford Motor Company, Health Canada, Environment Canada, Natural Resources Canada, the event was designed to encourage commuting alternatives and included demonstrations and information on alternative transportation. GreenCommute offered people working at Nortel Networks a dynamic intranet Web site with information and support on alternative commuting methods. The site was updated regularly with alerts and articles to keep employees current on events, and remind them of upcoming activities. The GreenCommute program was also promoted by emails. Prizes were occasionally offered to encourage participation. The GreenCommute Awareness Survey of 2000 found that almost all (96%) of staff had heard of GreenCommute, and 73% had tried at least one mode of alternative transportation during the past year. 90% of respondents thought the GreenCommute program provided a meaningful benefit, 79% said that it made it easier to get to work without a car, and 70% thought that the program caused them to think more about the impacts of commuting on the environment, health and the community. Traffic counts showed that 15% of the 5,200 employees were using non-auto commute modes in 2000, a 3-point increase from 12% in 1998. Pioneer Pacific Property Management (www.bctransit.com/traveloptions) Pioneer Pacific Property Management’s Station Tower, located at a SkyTrain station in Surrey (a suburb of Vancouver, British Columbia) is home to more than 700 employees of 30 different organizations. By working together, Station Tower has created an extremely effective program. Nearly 50% of Station Tower’s employees use transportation alternatives. Known as TravelChoices, the program was commissioned by Intrawest Corporation, the developer of the complex. Each organization in the building has a TravelChoices representative who provides time to administer the program. The trip reduction program enabled Intrawest to reduce the number of parking spaces required by 50 spots. At about $11,000 per spot, that meant $500,000 in savings. Business Travel Reduction (www.fhio.gc.ca/commuting/business_travel.htm) The Canadian Federal House In Order (FHIO) website also provides information on ways to reduce business travel environmental impacts, including mode shifting (shifting travel from air to road, rail or bus), mobility substitutes (such as teleconferencing), and choosing accessible locations for meetings (to accommodate alternative modes). Washington State Commute Trip Reduction Law Program (www.ga.wa.gov/CTR) Washington State’s 1991 Commute Trip Reduction Law (CTR) is designed to reduce traffic congestion, air pollution and fuel consumption. To achieve these goals, employers are asked to develop CTR programs that encourage employees to consider using alternative commute modes such as buses, vanpools, carpools, biking, walking, teleworking, or working a flexible work schedule such as the compressed workweek. The law affects public and private employers in urbanized counties with 100 or more full-time employees at a worksite who begin their workday between 6 and 9 a.m. on at least two weekdays for at least 12 continuous months. State agencies are encouraged to implement CTR programs at all of their worksites statewide, not just at worksites affected by the law.
23

Evaluating Mobility Management Strategies Victoria Transport Policy Institute
Oregon Business Energy Tax Credit Program (www.energy.state.or.us/bus/tax/taxcdt.htm) The Oregon Office of Energy offers the Business Energy Tax Credit to businesses that invest in energy conservation, recycling, renewable energy, and less-polluting fuels. Projects that reduce employee commuting or work-related travel may qualify for a tax credit. Projects must reduce work-related travel by 25% to be eligible. To date, more than 5,500 credits have been awarded. The credit is 35% of the eligible project costs - the incremental cost of the system or equipment beyond standard practice. The credit is applied five years: 10% in the first and second years and 5% each year thereafter. Credits for projects of $20,000 or less may be taken in one year. Commuter Challenge Program (www.CommuterChallenge.org) Commuter Challenge is a non-profit organization in the Puget Sound region that provides business leaders with ETR expertise and support. It partners with the Economic Development Council of Seattle and King County, and various city and state agencies. Its activities include:
• Employer Recognition. • Work Options. • Workshops/Forums/Committees. • Pacesetter and Website.
Table 6 Employee Trip Reduction Summary
Sector Commute trips (about 18% of vehicle travel) Impact (per participant) 10-30% vehicle travel reductions are typical.
Take-Up (portion of sector participating)
10%, 25%, 40%, 55%, 70%
Congestion Reduction Significant benefits (since it targets urban-peak travel). 3 Road and Parking Cost Savings Significant benefits 3
Traffic Safety Moderate benefits 2 Land Use Impacts (“Smart Growth”) Moderate benefits 2
Consumer Costs Moderate to large benefits, depending on program. Parking pricing imposes consumer costs (an economic transfer).
2
Transportation Options Moderate to large benefits, depending on program. 3 Equity Impacts Moderate to large benefits. Generally improves travel
options for low-income commuters. 3
Technical and Administrative Requirements
Moderate. 2
Public/Political Acceptability There tends to be support for voluntary programs, and resistance from businesses to mandatory programs.
1
Implementation Various. Could include provincial legislation; special provincial, regional or municipal programs; and expanded transit agency responsibilities (with funding).
Basis for Estimates of “Impacts” and “Take-Up” Experience with these programs indicates that they typically reduce vehicle travel by 10-30%. I estimate that currently, about 10% of potential programs have been implemented in the region (weighted by the portion of total regional employees affected), and with aggressive effort, take-up could achieve 70% in 20 years.
24

Evaluating Mobility Management Strategies Victoria Transport Policy Institute
Conclusions ETR programs tend to be particularly effective at reducing congestion and parking problems (since they affect peak-period travel), and can provide consumer benefits. They are most effective if implemented in conjunction with other strategies, such as improved transit and ridesharing services. Appropriate incentives such as matching grants, tax deductions and regulatory requirements increase take-up rates. Although this region has some notable successes, including programs by government agencies, non-profits and individual employers, penetration is still relatively modest.
Action Options
• Help develop a regional ETR agenda that includes a combination of education materials for policy makers, transport professionals, business leaders and employers; predictable funding; flexible parking requirements (so employers can capture financial savings when employees reduce their vehicle trips); and goals, objectives and responsibilities in each geographic area.
• Support federal incentives, such as transit benefits tax exemptions to employees, and tax deductions to employers who implement ETR programs.
• Encourage regional and provincial governments to pass ETR legislation.
• Implement employee trip reduction programs for federal agencies and federally-supported organizations. Develop appropriate training materials for agency planners, personnel departments and facility managers.
• Allow employee trip reduction programs to qualify for emission reduction credits (i.e., as a way to meet federal air quality standards).
25

Evaluating Mobility Management Strategies Victoria Transport Policy Institute
School and Campus Transport Management School Trip Management encourages parents, students and staff to reduce automobile trips and use alternative modes for travel to and from schools. Campus Trip Management programs are coordinated efforts to improve transportation options and reduce trips at colleges, universities and other campus facilities. Such programs can include:
• Transit improvements, shuttle services and fare discounts. • Ridesharing • Parking pricing and management. • Commute Trip Reduction programs for staff. • Traffic calming and car-free planning. • Marketing and promotional campaigns. • Pedestrian and bicycle improvements. • Recreation activity and special event transport management. • Smart growth and new urbanist principles applied to campus developments.
According to the 1992 Greater Vancouver Travel Survey, 18% of morning peak vehicle trips in the region involve travel to schools, and another 5% to post-secondary education. Although these trips tend to be relatively short (7.8 km, about half of the average work trip length), and many are performed in conjunction with a work trip (so the vehicle would be driven part of the route if the school trip were not made), this still indicates that school transport makes a significant contribution to total regional vehicle travel.
Obstacles School and campus transportation management are relatively new concepts and so there is limited experience or institutional supported. Funding is limited, particularly for school transport management programs.
Current Status in the Vancouver and Fraser Valley Region The Way To Go school transport management program (www.waytogo.icbc.bc.ca) is well established in British Columbia, although it has limited funding (there are only four staff for all provincial schools, so the program can provide little direct support to individual schools), and its funding is uncertain (it is funded by annual grants from the BC Autoplan Brokers). BEST sponsors the Off-Ramp program, which encourages use of alternative modes in selected highschools (currently in Victoria and Kelowna). Several provincial colleges and universities have successful campus transport management programs.
26

Evaluating Mobility Management Strategies Victoria Transport Policy Institute
Examples and Case Studies Way To Go (www.waytogo.icbc.bc.ca) The Way to Go! program in British Columbia is a provincial program sponsored by the Insurance Corporation of British Columbia and its brokers, that provides a variety of resources to help schools reduce automobile trips, and create safer pedestrian and bicycling environments around their schools. Way to Go! resources and support are available free to all BC schools. More than 550 schools across the province have requested the Way to Go! Resource Kit. Way To Go Program What It Is Schools, particularly elementary and middle schools, are important places for students and parents to learn about making safe choices when they walk, cycle or drive. Providing school communities with the tools required to develop traffic safety awareness and to increase the opportunities for students to walk, cycle, rideshare or take transit to school, is a positive step toward making the school journey safer, healthier and more environmentally responsible. Did You Know? In B.C., almost half of our children travel to urban and suburban schools in a car. That’s up from less than one in three ten years ago. Most of these trips are less than one kilometer long. This trend often reflects parents’ concerns for their child’s well-being. However, increased driving creates serious safety, environmental and health hazards:
• Dangerous traffic congestion around schools when children are using the streets.
• Unhealthy automobile emissions which contribute to the deterioration of air quality and climate change.
• Automobile dependant children. Positive Solutions Way to Go! offers effective tools to help parents make safer alternative travel arrangements for students going to and from school. Our goal? To enable more children to walk, bike, rideshare or take public transit to school with their families, friends and neighbours. Results To date, more than one-third of all B.C. Elementary and middle schools have requested the Way to Go! resource kit. These schools are well on their way to addressing their school site traffic safety concerns. Students and their families are fitter, and better educated about traffic safety issues. Fewer cars driving to these schools has resulted in a reduction in vehicle emissions and less traffic congestion, creating healthier, safer school sites. The program has led to happier, fitter, safer, confident children with stronger connections to their neighbourhoods, communities and each other. UBC Trek Program (www.trek.ubc.ca) The UBC TREK Program promotes use of alternative travel modes. It supports walking, cycling, ridesharing and transit use, including successful passage of a U-Pass referendum, which provides transit passes to students for a fixed fee incorporated in their registration fees.
27

Evaluating Mobility Management Strategies Victoria Transport Policy Institute
University of Victoria and Camosun College (www.uvic.ca) In 1999 students at the University of Victoria and Camosun College in Victoria voted to establish Upass programs, which provide all students with unlimited public transit (student body cards become transit passes) at a cost of about $15 per month per student. Active and Safe Routes to Schools (www.goforgreen.ca) Greenest City’s Active and Safe Routes to School program is coordinated by Go for Green, a national not-for-profit program with a mandate to promote active transport and environmental restoration, is currently assisting 30 pilot projects across the country. Many schools devote a significant portion of their budgets to student busing. Across Canada busing accounted for 5% of total school board operating expenses, and as much as 12% in rural areas. School transport management can provide a sustainable financial savings as well as other benefits. State Funding For School Traffic Safety (www.wsdot.wa.gov/ta/homepage/hlphp.html) The Washington Transportation Commission approved grant funding packages for five new programs created by the Legislature, including a Traffic Safety Near Schools Program. This program funds capital projects for traffic and pedestrian safety improvements near schools. Eligible projects include sidewalks and walkways, school signing and signals, pedestrian crossings, turn lanes, school bus pullouts, roadway channelization and signalization. Stanford University (www.stanford.edu) Stanford University in Palo Alto, California plans to expand capacity by 25%, adding more than 2.3 million square feet of research and teaching buildings, public facilities and housing without increasing peak period vehicle traffic. By 2000, 1.7 million square feet of new buildings had been developed while automobile commute trips were reduced by 500 per day. To accomplish this the campus transportation management plan includes: • A 1.5 mile transit mall. • Free transit system with timed transfers to regional rail. • Bicycle network. • Staff parking “cash-out”. • Ridesharing program. • Other transportation demand management elements. By using this approach the campus was able to add $500 million in new projects without the environmental review that would normally be required for individual projects. The campus also avoided significant parking and roadway costs. Planners calculate that the University saves nearly $2,000 annually for every commuter shifted out of a car and into another mode. This also reduced regional agency traffic planning costs. Public benefits included decreased congestion and improved safety on surrounding roadways and the regional traffic system, reduced air, noise and water pollution, and improved local transit options. All of Stanford’s transportation services are available to students, employees and the general public. University of Washington (www.washington.edu/upass) The University of Washington in Seattle has an extensive campus transportation management program that includes discounted transit fares ($31 a quarter for students and $42 per quarter for faculty and staff), rideshare matching, vanpools, a Night Ride shuttle, bicycle and pedestrian facility improvements, increased parking fees, and promotional efforts that include merchant discounts.
28

Evaluating Mobility Management Strategies Victoria Transport Policy Institute
Unlimited Access Programs (www.sppsr.ucla.edu/res_ctrs/its/UA) Unlimited Access (also called UPass) programs mean that colleges and university purchase unlimited use of local transit services for students and sometimes staff, at a significant discount compared with regular fares. A valid campus identification card becomes a transit pass. More than fifty colleges and universities throughout North America currently have such a program, providing fare-free transit service to more than 825,000 students and staff.
• University officials reported that Unlimited Access reduces parking demand, increases students’ access to the campus, helps to recruit and retain students, and reduces the cost of attending college.
• Transit agencies reported that Unlimited Access increases ridership, fills empty seats, improves transit service, and reduces the operating cost per rider.
• The universities’ average cost for Unlimited Access was $30 per student per year.
• Student transit ridership increased between 71 percent and 200 percent during the first year of Unlimited Access, and continued to increase 2-10% annually in subsequent years.
Table 7 Campus and School Transport Management Summary
Sector Commute and some non-commute trips to campuses and schools. Impact (per participant) 10-20% vehicle travel reductions are typical.
Take-Up (portion of sector participating)
30%, 40%; 50%; 60%; 70%
Congestion Reduction Moderate benefits (since it targets urban-peak travel). 2 Road and Parking Cost
Savings Moderate benefits 2
Traffic Safety Moderate benefits 2 Land Use Impacts (“Smart
Growth”) Moderate benefits 2
Consumer Costs Moderate to large benefits, depending on program. Parking pricing imposes consumer costs (an economic transfer).
2
Transportation Options Moderate to large benefits, depending on program. 3 Equity Impacts Moderate to large benefits, depending on program. Generally
improves travel options for transportation disadvantaged people. 3
Technical and Administrative Requirements
Small to moderate. -1
Public/Political Acceptability General support. May be resistance to mandatory programs. 2 Implementation Requires ongoing and increased program funding and
coordination with municipal planning activities.
Basis for Estimates of “Impacts” and “Take-Up” Experience with these programs indicates that vehicle travel reductions of 10-20% are typical. The Way-to-Go program has resulted in transportation management programs in a growing number of schools, and most collage and university campuses now have some campus transport management program. I estimate that currently, 30% of potential programs and strategies have been implemented (weighted by total regional students), and with aggressive effort, take-up could achieve 70% in 20 years.
29

Evaluating Mobility Management Strategies Victoria Transport Policy Institute
Conclusions More than a fifth of peak period vehicle trips involve transport to school or a college/university campus. Reducing such trips can make a significant contribution to mobility management objectives, particularly congestion reduction and facility cost savings. School and campus transport management programs have been well received and have proven effective. Their effectiveness varies depending on school geographic and demographic conditions.
Action Options
• Sponsor research on the effectiveness of school transport management programs.
• Consult with stakeholders to identify opportunities to improve school transport management programs.
• Help establish ongoing funding for school transport management programs. This could include provincial, regional or local funding, as part of transportation, school or environmental program budgets.
• Evaluate provincial and regional school policies to identify biases that favor automobile travel over other modes (such as funds available for parking facilities that are not available for mobility management programs, or policies that favor urban fringe school locations).
• Sponsor conferences, workshop and education programs to develop better communication among school administrators, transportation professionals and local public officials concerning ways to implement school transport management programs.
30

Evaluating Mobility Management Strategies Victoria Transport Policy Institute
Tourist and Special Event Transport Management Programs Tourist Transport Management involves improving transportation options for recreational travel and reducing automobile traffic in resort areas. Special Event Transport Management encourages the use of alternative travel modes to occasional events that draw large crowds, such as festivals, games and fairs, or when construction projects or disasters create temporary transportation problems. This type of travel has predictable patterns and needs. Tourist and special event transportation management programs can include a variety of specific strategies to improve transport options, integrate alternative transportation into overall planning, provide disincentives to driving, and promote alternative modes. These can include: • Transit improvements • Shuttle services • Ridesharing programs • Parking management and parking pricing • Cycling and walking improvements • Bicycle parking • Traffic calming and vehicle restrictions. • Marketing to encourage visitors to arrive without a car. • Commute trip reduction programs for staff. • Equipment rentals (bikes, scooters, skies, etc.).
Obstacles Tourist and special event transport management programs require new responsibilities, relationships and organizations. For example, they may require the Ministry of Transportation to work with public and private tourist promotion organizations to create new tourist services and marketing programs.
Current Status in the Vancouver and Fraser Valley Region Although there are various tourist and special transportation options and sustainable tourism programs, there are no coordinated tourist or special event transportation management programs in the region. The city of Whistler is implementing mobility management strategies as part of its strategic transportation plan, but current efforts are modest compared with investments to increase highway and parking capacity in the area. Some large regional events (Celebration of Lights, Molson Indy, Sun Run, etc.) involve transport management activities coordinated with TransLink, municipal governments, associated businesses and other government agencies. Special transport services are being developed for the 2010 Vancouver/Whistler Olympic Bid.
31

Evaluating Mobility Management Strategies Victoria Transport Policy Institute
Examples and Case Studies Toronto’s Green Tourism Association Toronto’s Green Tourism Association was founded in 1995, and aims to develop and cultivate a green tourism industry within the region which is ecologically sound, fosters appreciation of diverse cultural and natural heritage, and strengthens local economies and communities. The Association has over 200 supporters and members including small businesses, corporate concerns, community economic development ventures, government agencies and non-profit groups. It is the only such urban initiative worldwide. The Green Tourism Association’s vision of urban green tourism complements the existing tourism “product” and serves ultimately to reshape and enhance it. The three broad areas which are addressed are marketing green tourism options, business development for green tourism enterprises and greening the tourism sector. The Association has published chapbooks on local ecological restoration projects and businesses engaging in sustainable practices, as well as an outline of representative green tourism options. Current projects include a Green Map for Toronto. This map is a new vehicle to introduce tourists and residents to the many urban green tourism activities and green businesses across Toronto. The Green Tourism Association is also pursuing two other unique initiatives: a “Green Tourism Fun Pack” and infocentre network with discount and incentive programs for tourists; and a green tourism business network to facilitate business development and related job creation. NETS - An Initiative for Sustainable Mobility in Tourism (www.soft-mobility.com) Building on an EU pilot project, “Sustainable Mobility in Tourist Destinations” which took place between January 1996 and July 1997, several European Ministries supported the creation of a Europe-wide Network for Sustainable Mobility in Tourism - NETS. NETS was founded in 1998 by the following groups, working on a more sustainable mobility in the Alps:
• Association for Sustainable Mobility, Austria • G.A.S.T. - Association of Car Free Tourist Destinations • IAKF - Association for Car Free Tourist & Spa Destinations in Bavaria
NETS members/partners are from European countries, among them, Germany and Austria. They are: tourist destinations with sustainable mobility enterprises, travel and mobility service providers, public institutions, ministries, NGOs, and other networks promoting environmentally friendly mobility in tourism. The main purpose of NETS is to be the primary contact for matters relating to “Sustainable Mobility in Tourism” in Europe, for its members, marketing partners, and everyone interested in sustainable, quality tourism. Tourism and transport experts are invited to exchange knowledge and experiences of pilot projects. Sponsors are welcome to support endeavors for developing sustainable tourism. NETS partners develop and promote environmentally sound and sustainable tourism packages of high quality and improve their competitiveness in the tourism market. NETS supports members with the following services and activities: information and “how to” exchanges; lobbying and promotion of environmentally friendly mobility in tourism; development and consultation services; marketing services and PR; organization of workshops and seminars.
32

Evaluating Mobility Management Strategies Victoria Transport Policy Institute
MOST (Mobility Management Strategies) (http://mo.st) MOST is a European partnership to encourage sustainable transportation, with special programs dealing with travel related to tourism, medical services, education and special events. It’s main aim is to develop and evaluate Mobility Management (MM) strategies. It is a combined research and demonstration project. MOST is sponsoring a number of case studies and examples of tourist and special event mobility management, some of which are described below. Sintra, Portugal Sintra, located 30km from Lisbon, is the fourth biggest municipality of Portugal, with 320,000 inhabitants. It is an important historical, cultural and nature site, with various activity centers and parks. UNESCO declared Sintra a World Heritage Site in 1995. Sintra is one of the most important tourist attractions in Portugal with 1-1.5M visitors each year, most of whom stay for less than half a day. Around 11% of the tourist trips are made by bus and 89% by private car. Although the railway terminal is located only 1 km from the old town, few tourists use it when traveling to Lisbon. New mobility management measures include: • Installation of park and ride facilities near bus and train stations. • Setting up of cycling and walking tracks. • Mobility information via Internet. • Establishment of a mobility centre. • Rental bicycles in the city centre. Zug, Switzerland The Canton of Zug is located in central Switzerland. Zug is a small Canton with 100,000 inhabitants, accessed in 30 minutes by car and train from Zurich. It is an important leisure destination, especially on weekends. Although the most important destinations are well connected by public transport and by the regional bike-path network, most visitors arrive by car. This project aims to promote the use of sustainable transport modes in leisure traffic with the implementation of new mobility management services. New services will provide information to visitors on ways to reach this areas by public transport or by bicycle (using the existing Zug Tourism website) and by promoting car-free weekend tourism. Athens Olympics A mobility management program was used to facilitate the efficient movement of the thousands of visitors in Athens, Greece during the 2004 Olympics. For example private car use is restricted and transportation alternatives are provided for inhabitants in certain areas of the city. Leipzig City Center Tram Project The city of Leipzig, Germany is performing a major reconstruction of its tram system that will temporarily block downtown streets and tram service. Special programs will help inhabitants, clients and guests obtain information about this project and maintain mobility during the construction period. Experience so far indicates great interest and need for this information and mobility management services. During the construction period information and mobility services are available at a special bus parked next to the tram depot. Between June and September 2001 about 4,800 people took visited the bus to obtain information. The press has been more positive than with previous construction projects.
33

Evaluating Mobility Management Strategies Victoria Transport Policy Institute
Table 8 Tourist and Special Event Transport Management Summary
Sector Tourist trips, and some commute and freight transport. Impact (per participant) Variable. Perhaps 10-20% vehicle travel reductions are typical.
Take-Up 20%; 30%; 40%; 50%, 60% Congestion Reduction Moderate benefits (in affected areas). 2
Road and Parking Cost Savings
Moderate benefits. 2
Traffic Safety Moderate benefits 2 Land Use Impacts Small to moderate benefits 2
Consumer Costs Moderate to large benefits, depending on program. Parking pricing imposes consumer costs (an economic transfer).
2
Transportation Options Moderate to large benefits, depending on program. 2 Equity Impacts Depends on program. Generally improves travel options for
transportation disadvantaged people. 1
Technical & Administrative Requirements
Small to moderate. -2
Public/Political Acceptability May be resistance from some businesses to mandatory programs. -1 Implementation Program managed by provincial or regional transportation or
tourist promotion agency.
Basis for Estimates of “Impacts” and “Take-Up” These programs’ travel impacts are highly variable, depending on the type of event. Experience with such programs indicates that vehicle travel reductions of 10-20% are typical. I estimate that currently, 20% of potential programs have been implemented (weighted by total participants in such events), and with aggressive effort, take-up could achieve 60% in 20 years. For example, at that time 60% of participants in major events, and 60% of regional tourists, would be provided with information on alternative transportation options and programs designed to accommodate them.
Conclusions Tourist and special event transport management can help achieve various transportation objectives, including congestion reduction, parking reduction and preservation of resort community environmental quality. Some efforts have already been established in the Vancouver region. It could probably provide relatively modest but not insignificant emission reductions.
Action Options
• Sponsor a study of the potential of implementing tourist and special event transport management.
• Help support tourist transport management pilot projects and resource development.
• Sponsor development of a regional tourist transport management program.
• Work with other agencies, such as Transport Canada and Parks Canada, to support tourist transport management programs to achieve other goals, such as wildlife protection.
• Implement visitor transportation management programs at federal parks and for federally-supported events.
34

Evaluating Mobility Management Strategies Victoria Transport Policy Institute
Freight Transport Management Freight and commercial transport represents 5-10% of vehicle mileage and about 15% of transportation energy consumption in the region. Diesel freight vehicles tend to produce high particulate and sulphur emissions, although these are declining as more rigorous emission control standards are implemented. Recent studies indicate that freight transport, particularly marine transport, contributes a major portion of some air pollutants (sulphur dioxide, particulates and nitrogen dioxide) in the region. Some studies estimate that freight energy efficiency can realistically increase by 15-30% over a 10-20 year period using a combination of mobility management and Clean Vehicle strategies (TC, 2004). Strategies described below can increase freight efficiency and reduce pollution. Table 9 Freight Transport Efficiency Improvements
Policy Incentives and Programs Technical Improvements Roadway, fuel and emission pricing and tax policies to encourage more efficient freight transport. Rail and marine transportation infrastructure and services improvements to support modal shifts. Support research and best-practices education programs to promote more efficient freight transport. Vehicle efficiency and emission regulations.
Shift fright to more efficient modes, such as rail and marine transport rather than trucking for longer-distance shipping. Freight vehicle design improvements that increase efficiency and reduce emissions. Fleet management programs that reduce mileage and insure that vehicles are efficiently maintained and operated. Use existing freight capacity more efficiently by increasing load factors. Reduce product volumes and unnecessary packaging, relying on more local products.
This table describes various strategies for improving freight system efficiency. “Policy Incentives and Programs” are implemented by governments and public agencies. “Technical Improvements” are implemented by businesses in response to policy incentives and programs. Some strategies that increase efficiency and reduce shipping costs (such as freight infrastructure improvements) may increase total freight traffic volumes, offsetting a portion of the energy conservation and emissions reduction benefits.
Obstacles Freight transportation management programs require new relationships and organizations. There tends to be a general sense that increased freight transport is beneficial to the economy and desirable. Freight transport subsidies have been a common way for governments to support economic development. Efforts to reduce freight volumes tend to be opposed by affected groups (for example, truckers tend to oppose efforts to shift freight to rail).
Current Status in the Vancouver and Fraser Valley Region There are currently efforts to improve freight traffic flow within the region, but these are intended primarily to reduce shipping costs, not to reduce external impacts such as pollution or congestion.
35

Evaluating Mobility Management Strategies Victoria Transport Policy Institute
Examples and Case Studies Exel: How The Logistics Campus Can Reduce Trips (www.movingtheeconomy.ca) Exel Worldwide is an international provider of logistics services, which has pioneered the ‘campus’ concept - a collection of multiple manufacturers focused on consumer products with similar distribution channels. Such clustering allows freight consolidation. A campus begins with establishing individual accounts among businesses in a geographic area, and expanding as more firms participate. For instance, in the past, if Loblaws requested two truckloads of soup and one truckload of cereal, three trucks would be used. Now, only two trucks are needed because the cereal can sit on top of the soup. This is possible because trucks often travel with less than full loads. The result, made possible by more sophisticated load tracking and analysis methods allow logistics specialists to mix products to increase load factors. Estimates suggest that these strategies can reduce truck traffic by up to 30%. More detailed information is featured in Moving Goods in the New Economy: A Primer For Urban Decision Makers, a joint publication of Moving the Economy (www.city.toronto.on.ca/mte) and the Canadian Urban Institute. Pooled Shipping (www.movingtheeconomy.ca) Rail carloads of grain arriving at the Port of Vancouver are pooled in order to reduce congestion, irrespective of the originating railway and grain company terminal. Railways have created a common terminal railway in some cities. Similarly, inter-city couriers such as Purolator, FedEx, UPS and DHL could operate a common urban delivery system in the Greater Vancouver area in order to reduce vehicle kilometres. City Logistics (www.wupperinst.org) Product differentiation, reduced warehousing and declining shipment size all tend to decrease freight efficiency. Trucks are seldom filled to capacity and receivers have to handle many shipments. Several German companies now offer a service where shipments are consolidated outside the city centre. About 80 German cities have set up “City Logistic” projects whereby shipments are consolidated outside the city limits and better organized within the city. The municipality, chambers of commerce and large haulers set up a trans-shipment facility and a new organization to coordinate deliveries within the city. To be competitive, the quality of service must be high. This type of service benefits municipalities (less spending on roads), citizens (less noise and pollution), railways (attract new inter-city traffic), and shippers (reduce costs). Freight Village Concept (www.freight-village.com) A “freight village” is an area within which activities related to freight transport, logistics and goods distribution are coordinated, including shippers, warehouses, storage areas, public agencies and planners, businesses, etc. To encourage intermodal transport a freight village should be served by multiple modes (road, rail, waterways, air transport). This integrates the functions of freight handling and transfer to maximize efficiency. Freight Coordination (www.4Freight.net) A New Zealand software company, 4Technology, has created a website which matches empty trucks with one-off shipments. The website, at www.4Freight.net, promotes transport efficiency by providing a way both shippers and carriers can match freighting needs with available services. It is aimed particularly at individuals and companies moving irregular large consignments. Carriers will be charged 5 per cent of freight won and carried through use of the service. A service fee will be charged to the shipper/ supplier.
36

Evaluating Mobility Management Strategies Victoria Transport Policy Institute
Energy Efficiency Best Practices Program (www.energy-efficiency.gov.uk/transport) The Energy Efficiency Best Practices Program (EEBPP) is a government-sponsored information and awareness program that aims to stimulate energy savings in industry. A survey of fleet operators indicated that most have taken steps to save fuel, including driver training, aerodynamic styling, and use of alternative fuels, resulting in about 25% fuel savings. It produces and disseminates information on freight fuel efficiency strategies. These include: • Benchmarks that companies can use to measure their performance. • Guidelines that assist organizations to adopt good driving practices. • Case studies that document successes and highlight the energy, environmental and cost-
benefit of these measures. Incorporating Environmental Objectives into Corporate Logistics Firms can include transport efficiency factors in their annual Environmental Reports (Sainsbury, 1998). The German retailer Otto Versand received an EST! Best Practices award for developing a Green Supply Chair Management Program, which incorporates environmental objectives in organizing product shipping (OECD, 2000). The company developed new logistics chains (i.e., contracts with shipping and delivery agents) and analysis methods to determine which shipping option has the least environmental impacts. For example, when possible goods are transported by ship and train rather than truck, or truck rather than air. This reduced costs and increased profits as well as providing environmental benefits. As a result, the company: • Reduced CO2 emissions by more than 40%. • Cut costs by more than 3 Million Euros. • Developed new logistic chains like sea – train. • Developed new partners, like forwarders, agents • Is positioned to benefit from emission trading and other environmental instruments. UK Sustainable Freight Policy (www.dtlr.gov.uk/itwp/susdist/index.html) The Department of Environment, Transportation and Regions published a sustainable distribution strategy to improve freight movement efficiency. The strategy involves establishing best practices standards against key performance indicators, and implementing these throughout the transportation industries. At the local level, the government plans to create ‘quality partnerships for urban distribution’, involving local authorities, the freight industry, the business community, residents and environmental groups, to find ways of rationalizing the pattern of freight delivery. Benchmarking to Improve Freight Efficiency A study of chilled food distribution involved developing Key Performance Indicators (KPIs) such as vehicle utilization, energy intensity per unit of freight moved, and on-time performance. These were used to evaluate the logistical efficiency of 25 participating firms relative to other comparable firms. The results helped identify factors that may reduce efficiency. Although overall averages are publicized, firm-specific results are disclosed privately to protect participants’ privacy. The firms can then use the outcome to decide what level of performance is achievable, and track progress toward their goals through repeated participation in the survey. Freight Sustainability Demonstration Program (www.movingtheeconomy.ca) Transport Canada is working with the freight transportation sector to reduce greenhouse gas emissions. The Freight Sustainability Demonstration Program is a federal grant program to support the demonstration and evaluation of innovative measures to reduce emissions and achieve other environmental benefits in a practical and cost-effective manner.
37

Evaluating Mobility Management Strategies Victoria Transport Policy Institute
Canadian Pacific Railway’s Expressway (www.cpr.ca) Expressway is a short- to medium-haul transportation service offered by the Canadian Pacific Railway that combines the best of truck and rail to help reduce costs and better serve customers’ needs. Developed with input from trucking companies, Expressway allows shippers to move their standard, non-reinforced trailers in high-volume corridors. Expressway services are strategically located — with hubs in Toronto, Montreal and Detroit providing round-the-clock service and an Internet reservation system to book time slots. With this system, local drivers delivering trailers spend no more than 15 minutes at the terminal. While booking, customers also send their bill-of-lading information electronically, providing advance information to hand-held computers in the terminal. These register a record of the reservation, ID number and trailer number. When the driver arrives, the information is confirmed. The driver is given a receipt, and after a final inspection of the trailer, contents are sealed and the driver leaves. Information input in the hand-held units transmits immediately to the main computer and to hand-held units in the destination city for equally fast pick-up. Trains average 50 mph over the 350-mile corridor. Market reaction has been positive. The service currently handles 16,600 trailers annually. An expanded service is projected to take 50,000 trailers a year off the highway. Vancouver Industrial Land (www.movingtheeconomy.ca) In 1993, the City of Vancouver undertook a comprehensive review of the role and function of its industrial land stock. The study’s conclusions recommended preserving remaining stock, and City Council subsequently endorsed a policy of industrial land retention in 1995. Both the City of Vancouver and the Greater Vancouver Regional District have a policy of “planning by proximity”, to minimise transport demand and public service costs through the convenient arrangement of land uses. The City of Vancouver identified significant transportation benefits from maintaining a supply of centrally-located industrial land. Worker densities in Vancouver’s industrial areas are three times higher than those in the suburbs. About two thirds of Vancouver’s resident industrial workers work in a job located in the city and, of these, 24% get to work by transit, while 12% walk or cycle. Of industrial workers in Richmond, a neighbouring suburban municipality south of the city, only 5% take transit and 2% walk or cycle. Better planning increases freight delivery efficiency. For example, some food suppliers make several delivery trips a day to large downtown hotels. Social and economic benefits include a diversity of jobs to meet the needs of a diverse population, and a solid business tax base. Fleet Route Optimization (www.movingtheeconomy.ca) The City of Toronto’s Solid Waste Management Division, in collaboration with its Green Fleets Committee, has launched a route optimization program. Route optimization can also be applied to snow removal, salting, sweeping, street flushing and litter can collection. Since waste generation varies significantly throughout the calendar year, the key is to match the labour force, trucks, and equipment to waste generation, and to expand and contract routes based on changes. To calculate the shortest routes, the City’s system draws on databases and historical information about streets, collection attributes, service days and waste generation variances. By generating tabular information, such as where each collection vehicle should be at different times of the day, the system also improves supervision and management. The City estimates that its garbage and recycling collection vehicles travel approximately 4 million km per year (1.8 km per capita). Route optimization is expected to provide travel reductions of approximately 20%, or 800,000 km per year. Because these vehicles are large, heavy and constantly stopping/starting, fuel savings, emission reductions and reductions in road impacts are relatively large. This is projected to result in approximately $1 million in reduced vehicle costs annually, plus staff time savings.
38

Evaluating Mobility Management Strategies Victoria Transport Policy Institute
Table 10 Freight Transport Management Summary
Sector Freight Impact (per participant) 10-20% reduction possible. Assumes 10% mileage
reduction and 20% energy and emission reductions.
Take-Up (portion of sector participating)
10%, 25%; 40%; 55%; 70%
Congestion Reduction Small benefit. Freight vehicles represent just 5-10% of road traffic, but have relatively large congestion impacts.
1
Road and Parking Cost Savings Small benefit 1 Traffic Safety Small benefit 1
Land Use Impacts (“Smart Growth”) Small benefit 1 Consumer Costs Mixed. 0
Transportation Options Not significant 0 Equity Impacts Not significant 0
Technical and Administrative Requirements
Requires new programs and administrative services. -1
Public/Political Acceptability Mandatory programs and increased fees may face political opposition.
-1
Implementation Could include federal or provincial legislation; new provincial and regional programs; and research and education programs.
Basis for Estimates of “Impacts” and “Take-Up” Experience with such programs indicates that vehicle travel reductions of 10-20% are typical. I estimate that currently, 10% of potential programs have been implemented (weighted by total freight transport energy use), and with aggressive effort, take-up could achieve 70% in 20 years.
Conclusions Freight transport management can make a significant contribution to energy conservation and emissions reductions. There are currently several efforts to reduce freight vehicle emissions and improve freight system efficiency to reduce financial costs and accommodate growth, but there are currently no major efforts to manage freight traffic to reduce emissions. Ship and rail transport tends to be significantly more fuel efficient than truck transport. Impacts on other emissions are smaller because emission standards are stricter for trucks than trains or ships.
Action Options
• Sponsor a study of the potential of implementing freight transport management in this region.
• Work with existing freight transport planners to incorporate sustainability objectives and apply mobility management strategies as much as appropriate.
• Sponsor a process to develop and implement a regional freight management program.
• Make federal infrastructure policies and grants consistent with freight transport management objectives. For example, provide grants for port and rail system improvements, and for industrial development along multi-modal freight corridors.
39

Evaluating Mobility Management Strategies Victoria Transport Policy Institute
Aviation Transport Management Air transport has relatively high emission rates per passenger-kilometre, especially for short distance trips (less than 1,000 km), because emissions are particularly high during take-off and landing. High altitude emissions contribute more to global warming per unit than other types of anthropogenic greenhouse gas emissions. Air travel’s contribution to global warming is predicted to increase from about 3.5% up to 5-15% of total human impacts if current trends continue. Newer aircraft are more fuel efficient and produce less noise and air pollution, and airport authorities are incorporating sustainability objectives in their planning, but their effectiveness is limited, and such gains are offset by growth in traffic volumes. As a result, the total economic, social and environmental costs of air transport are increasing in most regions. Various management strategies can encourage more efficient, less polluting air travel, and shifts to other modes, particularly to rail and bus for medium-distant trips (200-1,000 kilometres). These include:
• Support improvements to alternative modes, such as fast and efficient rail transport on busy corridors to compete with air transport for medium-distance journeys.
• Increase direct airport user fees to provide full cost recovery of airport infrastructure investments, air traffic controls, security services, property rents and taxes.
• Increase aviation fuel taxes.
• Eliminate airport infrastructure property tax exemptions and duty-free shops at airports.
• Replace older aircraft with newer models that are cleaner, quieter and more efficient.
• Improve air traffic management systems to increase operational efficiency.
Obstacles Aviation transport management requires new approaches and relationships. Since air travel connects different regions, aviation transport management requires national or international scale implementation. Aviation is considered prestigious and economically beneficial, which creates resistance to aviation transport management.
Current Status in the Vancouver and Fraser Valley Region There are no air travel mobility management programs it in the region.
Examples and Case Studies Although there are a number of current efforts to mitigate aviation economic and environmental externalities though aircraft design, airport area land use management, regulations on flight times and improved travel options to airports (to reduce employee and traveler vehicle traffic congestion), we are unable to find comprehensive programs that reflect demand management principles.
40

Evaluating Mobility Management Strategies Victoria Transport Policy Institute
Table 11 Aviation Transport Management Summary
Sector Aviation, 10% of transport energy, and a smaller portion of regional emissions.
Impact (per participant) Uncertain. Perhaps 5-15% reductions are possible. Assumes 5% mileage reductions, 15% energy and emission reductions.
Take-Up Uncertain, assume 10%, 20%; 30%; 40%; 50% Congestion Reduction Minimal for road congestion. Major airport congestion reduction
benefits. 1
Road and Parking Cost Savings
Minimal 1
Traffic Safety Uncertain 0 Land Use Impacts Uncertain 0
Consumer Costs May increase air travel costs (economic transfer) -1 Transportation Options Reduces air travel affordability. -2
Equity Impacts Increases horizontal equity, reduces vertical equity. 0 Technical and Administrative
Requirements No significant technical problems. Requires new programs and administrative services.
-1
Public/Political Acceptability Mandatory and pricing incentives may face political opposition. -1 Implementation Various. Could include federal or provincial legislation; new
government programs and investments; special provincial planning; and research and education programs, perhaps through a university or other research organization.
Basis for Estimates of “Impacts” and “Take-Up” There is currently little experience with such programs. Using strategies described in this chapter, energy savings of 10-20% appear possible. I estimate that with aggressive effort by regional and federal governments, take-up could achieve 50% in 20 years, meaning that half of cost-effective strategies and programs have been implemented.
Conclusions Aviation transport management may be an effective way to reduce air pollution impacts, particularly climate change emissions. Most aviation transport management strategies require national or international cooperation. Regional aviation mobility management programs tend to have relatively modest effect, but may still be worthwhile. Such a program would face special obstacles (there are few existing examples or support resources) and would provide special benefits (it would be a model for other programs).
Action Options
• Sponsor a federal study of aviation transport management methods, benefits and costs.
• Investigate “hidden” subsidies and public policy biases that favor air travel over other travel options and consumer expenditures. If such distortions exist, identify ways to correct them.
• Sponsor a process to develop and implement a regional aviation management program.
• Make federal infrastructure policies and grants consistent with aviation transport management objectives. For example, fund transit improvements to airports, and support improved intercity rail service.
41

Evaluating Mobility Management Strategies Victoria Transport Policy Institute
Transportation Management Associations Transportation Management Associations (TMA) provide services to employees, businesses and clients in a district or jurisdiction. These can include: • Marketing and promotion. • Commute trip reduction. • Commuter financial incentives (such as Parking Cash Out and transit vouchers). • Shared parking coordination and brokerage (arranging exchanges and leases among
businesses). • Parking management. • Rideshare matching and vanpool coordination. • Transit improvements and shuttle services. • Pedestrian and bicycle planning. • Freight transport management and coordination among area businesses. • Access management. • Guaranteed Ride Home services. • Flextime encouragement and support. • Telework encouragement and support. TMAs are usually more cost effective than programs managed by individual businesses. TMAs allow small employers to provide Employee Trip Reduction services comparable to those offered by large companies. They avoid problems that may be associated with government-run mobility management programs, since they are controlled by members. TMAs usually require local government support for coordination and seed funding.
Obstacles Many public officials and business managers are unfamiliar with TMAs and the benefits they can provide. In many areas there is inadequate incentive or opportunity for businesses to form a TMA. Businesses may perceive little direct benefit unless they have inadequate parking or other specific transportation problems. There is no regular mechanism for local governments to provide support and funding for TMAs.
Current Status in the Vancouver and Fraser Valley Region There are a few TMAs in the Vancouver and Fraser Valley, primarily in Vancouver commercial centers. These include:
• Cambie Corridor Consortium • Willingdon Transportation Action Group • MetroTown TMA • Post-Secondary Access • Glenlyon Industrial Estate TMA (currently under development)
42

Evaluating Mobility Management Strategies Victoria Transport Policy Institute
Case Studies and Examples Cambie Corridor (www.toolsofchange.com) The Cambie Corridor Consortium (CCC) was the first transportation management association (TMA) established in Canada. The Cambie area, which includes the Cambie Bridge to 33rd Avenue and Main to Granville Street, is Vancouver’s second largest business district, combining business, shopping, and residential areas. The area also includes several hospitals and medical centres. In the early 1990’s, the B.C. Teachers’ Federation and one of the Vancouver Police Stations moved into the area. Traffic and parking congestion have increased in the area. A planned expansion of the hospital would have required increasing the number of parking spaces. Adding parking in such an area typically costs $15,000 to $25,000 per space. In 1994, a baseline survey was conducted of employees in the area. It found that about half of employees drive alone to work, but many employees were willing to consider transit if schedule improvements were made. In 1995 Vancouver General Hospital and other local employers decided to form the Cambie Corridor Consortium to address area transportation problems. From those meetings, a trip reduction expert developed a transportation management plan that was used as the basis for the CCC’s programs and services. The CCC’s aim is to reduce the number of single occupancy vehicles commuting to the Cambie/Broadway area of Vancouver and improve air quality by providing alternative transportation solutions and information. Approximately 25,000 employees are represented through CCC’s 21 members. The CCC hired a part-time transportation management coordinator. Transit kiosks were erected at each member’s work site where employees could easily obtain bus schedules and other information. A shuttle bus service was implemented to transport hospital staff between sites, and today the bus makes approximately 2,100 trips per month carrying 9,000 passengers. The CCC also uses the shuttle bus to transport equipment, supplies, and documents between sites, saving member hospitals approximately $200,000 each year in courier costs. Before the shuttle service was implemented, hospitals were paying parking fees and mileage to employees who drove their cars between sites. These savings paid for the new shuttle service for their employees. Vanpool services were arranged through the Jack Bell Foundation (www.ride-share.com), and are used by approximately 200 employees. Another 500+ staff members carpool. CCC worked with B.C. Transit on an 18-month pilot project that implemented a payroll deduction program that allows employees to purchase their bus pass at a 15% discount. To respond to barriers identified by employees, an emergency ride home program has been implemented. CCC contracts with a local taxi company and employees are given vouchers if they unexpectedly need to leave work or stay late. Employees are allowed up to four rides home per year. Also in response to employee requests, additional shower and change facilities, and secure bike cages were installed at some of the members’ work sites. Environment Canada contributed $60,000, with a provision that CCC’s members contribute an equal amount in in-kind donations. Each new member was given a one-year exemption from any fees, but the CCC was planning to solicit annual dues based on the number of employees from current and future members. Surveys showed that between 1994 and 1998, single occupancy vehicle drivers had declined 1.6%, transit use had increased about 25%, cycling had increased to 5.5% from 4.5%, and walking increased from almost zero to nearly 10%. Of the 1998 survey respondents, 85% said they no longer brought their car to work because the shuttle bus allowed them to travel between sites.
43

Evaluating Mobility Management Strategies Victoria Transport Policy Institute
Black Creek Regional TMA (www.blackcreekcarpool.org) The Black Creek Regional Transportation Management Association (BCRTMA) is a private, nonprofit membership organization located in the Black Creek area north of Toronto, which includes major manufacturing facilities and York University. It was established in 2000 to reduce local traffic congestion, parking costs and pollution emissions. This area has more than 150,000 employees who currently generate over 62,000 automobile commute trips each workday. It is supported by the local chamber of commerce, individual employers, plus local, regional, provincial and federal governments. The BCRTMA actively promotes improved transit service (increased frequency, more routes, better service quality) and cycling facility improvements. It provides the following transportation services:
• Transit promotion. • Rideshare (car and vanpooling) matching and encouragement. • Cycling improvements and encouragement. • Walking improvements and encouragement. • Shuttle services. • Parking management. • Guaranteed ride home. • Website and brochures. • Commuter contests.
Ride-on (www.slonet.org/vv/iprideon/about.html) Ride-On in San Luis Obispo, California is a non-profit transportation organization established in 1993 with a mission to develop and implement creative solutions to transportation and mobility issues that concern employers, businesses, medical providers, visitors services providers, special events coordinators, government agencies and individuals. It owns 35 vans and buses. Table 12 Transportation Management Association Summary
Sector Commute at major commercial and industrial centers. Impact (per participant) 10-30% vehicle travel reductions are common among
affected travelers.
Take-Up (portion of sector participating)
10%, 25%; 40%; 55%; 70%
Congestion Reduction Significant benefits (since it targets urban-peak travel). 3 Road and Parking Cost Savings Significant benefits 3
Traffic Safety Moderate benefits 2 Land Use Impacts (“Smart Growth”) Moderate benefits 2
Consumer Costs Moderate to large benefits, depending on program. Parking pricing imposes consumer costs (an economic transfer).
2
Transportation Options Moderate to large benefits, depending on program. 2 Equity Impacts Moderate to large benefits, depending on program.
Generally improves travel options for low-income commuters.
2
Technical and Administrative Requirements
Small to moderate. 2
Public/Political Acceptability Voluntary organizations with matching government funding are popular. May be resistance to mandatory fees.
1
Implementation Regional and municipal program, often in partnership with chambers of commerce or other business
44

Evaluating Mobility Management Strategies Victoria Transport Policy Institute
organizations.
Basis for Estimates of “Impacts” and “Take-Up” Experience with TMAs indicates that vehicle travel reductions of 10-30% are typical, compared with areas that have no programs. I estimate that currently, 10% of potential programs have been implemented (weighted by total regional employees), and with aggressive effort, take-up could achieve 70% in 20 years.
Conclusions Transportation management associations provide an institutional foundation for various mobility management programs and activities. Some TMAs currently exist in the Vancouver region, but there appear to be many opportunities for expansion.
Action Options
• Promote the development of TMAs through special funding (such as start-up grants) and workshops involving local and regional officials and business representatives.
• Have federal agencies and federally-sponsored programs support the development of TMAs where they are located.
• Encourage provincial, regional and local officials to support or require TMA development, for example, by allowing develops to reduce parking supply in areas with effective TMAs.
45

Evaluating Mobility Management Strategies Victoria Transport Policy Institute
Commuter Financial Incentives Commuter Financial Incentives include several types of incentives that increase economic neutrality and encourage alternative commute modes: • Parking Cash Out means that commuters who are offered subsidized parking are also offered
the cash equivalent if they use alternative travel modes.
• Travel allowances are a financial payment provided to employees instead of parking subsidies. Commuters can use this money to pay for parking or for another travel mode.
• Transit and rideshare benefits are free or discounted transit fares provided to employees.
• Reduced employee parking subsidies means that commuters who drive must pay some or all of their parking costs.
• Company travel policies that reimburse bicycle or transit mileage for business trips when these modes are comparable in speed to driving.
• Tax and other government policies that support such programs. Parking given by employers to employees is taxable as income in Canada, but in practice many (probably most) employees qualify for technical exemptions (because they are not assigned a designated parking space, or the market value of their parking space is not easily determined) that allows them to receive free, untaxed parking. A typical employee would need to earn $1,500 or more in pre-tax income to pay for an urban parking space. No comparable benefit is provided to commuters who use other modes. When commuters are offered more neutral benefits (such as Cash Out or transit benefits) automobile commuting tends to decline by 10-30%. Because participation is optional (commuters who continue to drive are no worse off), it directly benefits employees.
Obstacles There are currently few reasons for employers to offer commuter financial incentives. In Canada, transit benefits are taxable, so few employers offer them (employers can just as well offer higher wages). Many commercial buildings have generous parking supply, so businesses perceive little direct savings from reduced parking demand. A Transport Canada study indicates that making transit benefits income tax exempt is one of the most cost effective climate change emission reduction strategies available in the transportation sector (IBI, 1999). Numerous organizations, including the Canadian Automobile Association (CAA, 2002) endorse this strategy, indicating broad political support.
Current Status in the Vancouver and Fraser Valley Region Surveys indicate that most employees who drive receive free or significantly subsidized parking, and few are offered alternative commuter financial incentives (Urban Systems, 1996). Some commute trip reduction programs include commuter financial incentives and some employers do not provide free or subsidized parking (particularly in major commercial centers such as downtown Vancouver and Metrotown), but these appear to represent just a few percent of total employees.
46

Evaluating Mobility Management Strategies Victoria Transport Policy Institute
Case Studies and Examples Environment Canada Quebec Region (www.fhio.gc.ca/commuting/commuting.htm and http://brouillard.wul.qc.ec.gc.ca/dpe/travelalternatively/dpe_main_en.asp) The Environment Canada (Quebec Region) Sustainable Transportation Program is a two-part pilot program: Travel Alternatively and Business Travel Policy. It encourages employees to use alternative modes (biking, bus, walking, carpooling) when commuting to reduce greenhouse gas emissions. The program is currently being piloted in one office building in Montreal, which houses approximately 600 Environment Canada and Canada Customs & Revenue Agency government employees. The program includes a variety of resources that support use of alternative modes. Almost 80% of employees surveyed reported taking an alternative means of transportation to work, with public transportation (46.6%) and carpooling (19.6%) reported as the most popular modes, and only 22% reported using single occupant vehicle. National Capital Region Transit Pass Pilot Project (www.fhio-ifppe.gc.ca) Effective October 2002, employees of Transport Canada, Environment Canada, Natural Resources Canada and the Treasury Board Secretariat in the National Capital Region will be able to purchase an annual discounted transit pass through payroll deduction. This program is offered in association with OC Transpo in Ottawa and the Société de transport de l’Outaouais in Gatineau. If successful the project will be extended to other government departments in the National Capital Region and across Canada, where the option exists. Transit Voucher Programs (www.commutercheck.com) In 1994, the New York City region’s TransitChek program sold vouchers to 6,000 employers, providing more than $25 million worth of transit benefits (Schwenk, 1995.). The San Francisco Bay Commuter Check sells $6 million worth of vouchers to about 700 employers. This has increased transit use an average of 31% among those who receive vouchers, resulting in an estimated 17 million miles of reduced automobile travel, and $1.6 million in increased transit revenue. Commuter Choice Program (www.commuterchoice.com) Commuter Choice is a U.S. federal program that provides information on employee trip reduction programs and benefits, particularly U.S. income tax policies related to commuter benefits. UK Tax Policy Supports CTR (www.inlandrevenue.gov.uk/cars/green_travel.htm) Since 1999, the following are exempt from UK income tax and employment insurance: • Buses of 9 or more seats used mainly to bring employees to and from work. • Subsidies to public bus (but not rail) services used substantially for commuting. • Bicycles and cycling safety equipment. • Workplace parking for bicycles and motorcycles. • Alternative transport for car sharers to get home in exceptional circumstances, such as
working late, domestic emergencies etc. • A cycling business mileage allowance of up to 12p per mile. US Federal Workforce Transportation Executive Order (www.CommuterChallenge.org) A U.S. Federal policy requires that by October 1, 2000, federal agencies shall implement a transportation fringe benefit program that offers qualified Federal employees the option to exclude from taxable wages and compensation employee commuting costs incurred through the use of mass transportation and vanpools. Federal agencies in the National Capital Region will implement a transit pass fringe benefit program for their qualified Federal employees.
47

Evaluating Mobility Management Strategies Victoria Transport Policy Institute
California Parking Cash Out Experience Shoup (1997) found that Southern California Parking Cash Out programs: • Reduced single-occupancy commuting by an average of 17%. • Reduced carbon dioxide emissions by 807 pounds per employee per year. • Were considered fair and efficient by employers and employees. • Had a benefit/cost ratio exceeding 4.0. • Increased income tax revenue. Alameda County Congestion Management Program (www.accma.ca.gov) The Alameda County (East San Francisco Bay area, including suburban and rural areas) Congestion Management Program enlisted four employers to provide financial incentives to encourage reduced driving. The table below summarizes the results at the four worksites. The program managers conclude that financial incentives alone typically reduce automobile commute trips by 16-20%, and significantly more if combined with other TDM strategies. Table 13 Alameda County Commute Incentive Program
Alameda Albany Oakland Pleasanton Incentive offered $1.50/day $2.50/day $40/mo transit pass $2.00/day Avg. fuel savings and financial benefit. $268/year $381/year $407/year $282/year Eligible Employees 573 130 400 380 Participants before 12 (3%) 7 (5%) 11 (3%) 147 (40%) Participants after 108 (19%) 30 (23%) 93 (23%) 130 (34%) Ernst & Young (www.wageworks.com) Ernst & Young offers a pre-tax commuter transportation and parking benefits to its employees. This is projected to save employees 40% of their commuting and work-related parking costs, and reduce the firm’s payroll expenses. Vice chairman of human resources, James L. Freer explains “When we surveyed a group of employees regarding what benefits they value, a pre-tax commuter program was the most frequent enhancement by far, with 62% of the respondents asking for it.” Table 14 Commuter Financial Incentives Summary
Sector Automobile commuting Impact (per participant) 15% automobile trip reduction per employee offered the benefit.
Take-Up (portion of sector participating)
5%, 15%; 30%; 45%; 60%
Congestion Reduction Significant benefit (focuses on urban-peak travel changes) 3 Road and Parking Cost
Savings Significant benefit (reduces commuter parking demand) 3
Traffic Safety Moderate benefit 2 Land Use Impacts (“Smart
Growth”) Significant benefit (makes transit commuting more attractive) 3
Consumer Costs Significant benefit (participating commuters are better off) 3 Transportation Options Significant benefit 3
Equity Impacts Significant benefit 3 Technical and Administrative
Requirements Small 1
Public/Political Acceptability General public support. Opposition from Revenue Canada. 2 Implementation Federal legislation or administrative changes by Canada
Customs and Revenue Agency. Mobility management program can encourage employers to offer these benefits.
48

Evaluating Mobility Management Strategies Victoria Transport Policy Institute
Basis for Estimates of “Impacts” and “Take-Up” Experience with Commuter Financial Incentives indicates that vehicle travel reductions of 10-20% per employee offered the benefit are typical. Currently, few regional employees are offered financial incentives to shift mode. With aggressive effort (federal tax reform with regard to transit subsidies, plus aggressive promotion by regional and local governments, and TMAs), take-up could achieve 60% in 20 years, weighted as a portion of total regional employees.
Conclusions Commuter financial incentives are an effective mobility management strategy, particularly for reducing urban-peak traffic and parking problems. They are an important component of Employee Trip Reduction programs. Current zoning laws and Canadian tax policies contradict this strategy, since they give employers an incentive to provide free or subsidized parking but no incentive to subsidize other commute modes. Voluntary programs may modestly increase the number of employers offering commuter financial incentives but greater penetration requires local, provincial and federal policy changes.
Action Options
• Change federal tax policy to allow transit benefits and parking cash out provided by employers to employees to be income tax exempt.
• Support Employee Trip Reduction programs (described above) that include commuter financial incentives.
• Change local land use policies to reduce minimum parking requirements for employers that offer commuter financial incentives and support other parking management strategies. This allows businesses to capture savings from reduced automobile commuting.
• Expand commuter financial incentives offered to federal employees.
49

Evaluating Mobility Management Strategies Victoria Transport Policy Institute
Distance-Based Pricing Distance-Based Pricing (also called Pay-As-You-Drive, Mileage-Based and Per-Mile pricing, or Variabilization) means that fixed vehicle charges are changed to mileage-based vehicle charges. Below are examples of distance-based vehicle fees:
Mileage-based Registration Fees This means that vehicle licensing and registration fees are prorated by vehicle mileage, so a $100 annual license fee becomes a 0.5¢ per kilometre charge, and a $500 annual license fee becomes a 2.5¢ per kilometre charge. Assuming annual registration fees average $200, this fee would average 1¢ per kilometre. Mileage-based Vehicle Purchase Taxes Purchase taxes average about $2,000 per vehicle. These could be converted to distance-based taxes, which converts to about 1¢ per kilometre if paid over an average vehicle lifetime, or 3¢ per kilometre if paid over the first four years of a vehicle’s operating life. Mileage-Based Vehicle Lease Fees Although most leases and rentals include mileage fees for “excessive driving,” this is usually set at high level and so only affects a minority of leased vehicle mileage. Analysis of the vehicle resale market indicates that virtually all mileage increases vehicle depreciation, typically by 5-15¢ per additional vehicle kilometre. Lease and rental fees can be restructured to be more distance-based. Assuming that about 30% of vehicle mileage is put on leased vehicles, this would average about 3¢ per mile over the vehicle fleet. Weight-distance Fees Weight-distance Fees are a mileage-based road use charge that increases with vehicle weight. This would range from about 3.5¢ per kilometre for automobiles up to 20¢ per kilometre for heavy trucks. This is a more equitable way to fund roads than fuel taxes because it can more accurately represent the roadway costs imposed by individual vehicles. Pay-As-You-Drive Insurance Insurance is one of the largest costs of owning a car, averaging nearly $1,000 per vehicle-year, or 5¢ per vehicle-kilometer. This strategy is described in more detail in a separate section.
Obstacles Distance-based pricing requires a new institutional framework for collecting fees which is likely to cost several dollars per vehicle-year for a basic system, and more if on-board metering is used. Some people are concerned about privacy issues, particularly if GPS or on-board metering is used to track mileage.
Current Status in the Vancouver and Fraser Valley Region There are currently no plans to implement distance-based pricing in the Vancouver and Fraser Valley region. Annual mileage data is collected during AirCare inspections that most vehicles in the region undergo annually or biannually, which, with some minor modifications could be used for calculating these fees.
50

Evaluating Mobility Management Strategies Victoria Transport Policy Institute
Examples and Case Studies European Distance-Based Truck Fees (www.europa.eu.int/comm/energy_transport/en/lb_en.html) The European Union plans to convert fixed road hauling charges into distance-based fees by 2010. Swiss Heavy Vehicle Fee (www.zoll.admin.ch) Switzerland introduced a Heavy Vehicle Fee (HVF) in January 2001, as a result of a successful public referendum passed in 1998. The HVF charges heavy trucks (over 3.5 tonnes) based on their gross weight, kilometres driven and emissions. The system was carefully planned and has been widely accepted by the freight industry. Billing for most trucks is based on data collected by an electronic on-board data collection unit that records vehicle mileage and route. At the end of each month the data are transmitted to the Swiss Customs Agency either by mail or the Internet. This information is used to generate a bill that is sent to the owner. Total truck volumes actually increased on many cross-Alpine routes when the HVF was implemented because maximum vehicle weights were increased from 28 tonnes to 34-tonnes at the same time (and will be raised to 40-tonnes in 2005, to match European standards). Environmental groups are lobbying to increase HVF rates and improve rail service to reduce total truck traffic. German Government Approves Tolls for Trucks (www.bmvbw.de) In 2001 the German cabinet approved plans to introduce truck tolls beginning in 2003. Vehicles over 12 tons would be required to pay euros 0.14-0.19 ($0.16-0.24 Canadian) per kilometer, with variation depending on exhaust emissions and axles. The intent of the plan is to shift the financing of road use away from the general taxpayer and onto heavy road users. The toll rate was established by computing the costs of the extra wear and tear on roads and maintenance costs incurred by trucks. Revenue from the tolls will be used for further transport investment, including an anti-congestion program. Nature conservation group Nabu applauded the plan but urged the government to consider putting the revenue into something other than road building. Table 15 Distance-Based Fee Summary
Sector Varies, depending on strategy Impact (per participant) Varies. Distance-based registration, sales taxes and lease fees are likely
to average about 5¢/km in total, resulting in a 8-10% mileage reduction among affected vehicles.
Take-Up (portion of sector participating)
Five years: 100%
Congestion Reduction Varies, depending on strategy. Small to large benefits are possible. 2 Road and Parking Cost
Savings Varies, depending on strategy. Small to large benefits are possible. 2
Traffic Safety Varies, depending on strategy. Small to large benefits are possible. 2 Land Use Impacts (“Smart Growth”)
Varies, depending on strategy. Small to large benefits are possible. 2
Consumer Costs Varies, depending on strategy. Small to large benefits are possible. 2 Transportation Options Varies, depending on strategy. Small to large benefits are possible. 2
Equity Impacts Varies, depending on strategy. Small to large benefits are possible. 2 Technical and
Administrative Requirements
Imposes transaction costs to calculate and collect fees. These could be minimized by using existing service businesses.
-1
Public/Political Acceptability
Uncertain. Likely to be supported by some interest groups. 0
Implementation Federal or provincial legislation. Some can be implemented by businesses.
51

Evaluating Mobility Management Strategies Victoria Transport Policy Institute
Basis for Estimates of “Impacts” and “Take-Up” Studies of consumer responses to pricing indicate that a 5¢ per kilometer vehicle fee would reduce vehicle travel by 8-10%. With provincial action, distance-based registration, provincial sales taxes and lease fees could be implemented within 5 years. Distance-based lease fees could be required or encouraged by provincial or regional policies.
Conclusions Converting vehicle registration, sales tax and lease payments into distance-based charges is justified on efficiency and equity grounds. This should face less opposition than introducing new vehicle user fees. These three fees have the potential of reducing vehicle mileage by 5-10%, depending on which fees are used and how they are structured. Distance-based pricing adds transaction costs, although this could be minimized by certifying existing vehicle service centers (AirCare stations, vehicle repair shops and insurance brokers) to perform odometer checks in conjunction with other scheduled vehicle inspection and maintenance activities.
Action Options
• Support research and pilot projects of distance-based fee implementation.
• Change federal tax policies so vehicle sales taxes are prorated by mileage.
• Provide incentives to provincial governments to implement distance-based vehicle registration fees, weight-distance fees and taxes.
• Provide incentives, such as regulations or tax discounts, to private companies that offer distance-based lease fees.
• Allow distance-based pricing to qualify for emission reduction credits.
52

Evaluating Mobility Management Strategies Victoria Transport Policy Institute
Distance-Based Emission Fees Distance-Based Emission Fees are kilometer-based charges that reflect a vehicle’s emission rate. For example, an older, higher-polluting vehicle might pay 5¢, a newer vehicle 1¢, and an Ultra-Low Emission Vehicle just 0.2¢ per kilometre driven. This gives motorists with more polluting vehicles a greater incentive to reduce mileage, and motorists who drive high mileage a greater incentive to choose cleaner vehicles. Fees can reflect when and where driving occurs, with higher charges at times and locations with greater pollution impacts. A more advanced system uses electronic sensors to measure actual tailpipe emissions when a vehicle is driven, giving motorists an incentive to also minimize emissions by keeping engines in good repair and driving smoothly Such fees result in relatively large emission reductions and relatively modest mileage reductions. For example, one study predicts that a fee based on measured tailpipe emissions averaging 1¢ per vehicle-mile (1991 U.S. dollars) would reduce mileage by about 2%, energy consumption by 7%, and air pollution emissions by almost 20%, as indicated in the table below. However, with newer vehicles there may be somewhat less direct relationship between criteria emissions and energy consumption. Table 16 Emission Charges (Harvey and Deakin, 1998, Table B.10)
Region Fee Basis VMT Trips Delay Fuel ROG Revenue Vehicle Model -2.2% -1.9% -3.5% -3.9% -5.4% $384 Bay Area Vehicle Use -1.6% -1.4% -2.5% -6.6% -17.7% $341 Vehicle Model -2.6% -2.3% -4.5% -4.0% -5.7% $116 Sacramento Vehicle Use -2.3% -2.1% -5.0% -7.4% -20.2% $102 Vehicle Model -2.5% -2.2% -3.5% -4.1% -5.5% $211 San Diego Vehicle Use -1.9% -1.7% -3.5% -7.1% -19.5% $186 Vehicle Model -2.5% -2.3% -5.5% -3.9% -5.5% $1,106 South Coast Vehicle Use -2.1% -1.9% -6.0% -7.2% -18.9% $980 Vehicle Model Fee Basis = a per-mile fee based on vehicle model and year. Vehicle Use Fee Basis = a fee based on measured tailpipe emissions of each individual vehicle, using electronic instrumentation. VMT = change in total vehicle mileage. Trips = change in total vehicle trips. Delay = change in congestion delay. Fuel = change in fuel consumption. ROG = a criteria air pollutant. Revenue = annual revenue in millions of 1991 U.S. dollars. See original report for additional notes and data. Table 17 summarizes recommended urban vehicle air pollution cost values developed by the British Columbia Ministry of Transportation.. A fee averaging about 1¢ per kilometre for most automobiles is probably appropriate for internalizing air pollution costs. Table 17 Recommended Shadow Prices (Bein, 1997)
PM2.5 Ozone Total Light Gasoline Vehicle 0.6-1.0¢ 0.1¢ 0.7-1.1¢ Light Diesel Vehicle 2.5-6.3¢ 0.1¢ 2.6-6.4¢ Heavy Gasoline Vehicle 2-4¢ 0.1¢ 2.1-4.1¢ Heavy Diesel Vehicle 9-27¢ 0.1¢ 9.1-27.1¢ This summarizes air pollution cost values for BC urban areas in 1996 cents per vehicle-km.
53

Evaluating Mobility Management Strategies Victoria Transport Policy Institute
Obstacles A basic distance-based emission fee requires a system to monitor annual mileage, estimated to cost $5-10 per vehicle-year, and more for on-board metering. Distance-based emission fees are considered regressive, since lower-income motorists tend to own higher polluting vehicles. No jurisdiction currently charges mileage-based emission fees.
Current Status in the Vancouver and Fraser Valley Region There are currently no plans to implement distance-based emission fees in the region. Annual mileage data is collected during AirCare inspections, which, with some minor modifications could be used for calculating these fees. Table 18 Distance-Based Emission Fee Summary
Sector Road vehicles, including cars and trucks. Impact (per participant) 2% mileage reduction, 4% energy and 15% emission reductions.
Take-Up Five years: 100% Congestion Reduction Minor benefit 1
Road and Parking Cost Savings
Minor benefit 1
Traffic Safety Minor benefit 1 Land Use Impacts Minor benefit 1
Consumer Costs Increases operating costs, particularly for older vehicles (economic transfer)
-1
Transportation Options Reduces automobile travel affordability. -2 Equity Impacts Increases horizontal equity but reduces vertical equity. 0
Technical and Administrative Requirements
Imposes transaction costs to calculate and collect fees. -3
Public/Political Acceptability Likely to be unpopular because it is a new and regressive fee. -3 Implementation Federal or provincial legislation, and a mileage data collection system.
Basis for Estimates of “Impacts” and “Take-Up” Analysis published in other studies indicates that a fee based on measured tailpipe emissions averaging 1¢ per kilometer could reduce mileage 2%, energy use by 7% and criteria emissions by 20%, but with newer, less polluting vehicles, and less efficient technologies (for example, a fee based on the type and age of vehicle), smaller energy and emission reductions are likely. Such a fee could be implemented within five years.
Conclusions Emission fees are theoretically the most economically efficient emission reduction strategy, but provide relatively modest mileage reductions and so provide minimal mileage-related benefits. It adds transaction costs, particularly with more advanced systems for fees that reflect location, time and measured emission rates. Emission fees tend to be regressive because lower-income people tend to own older, high polluting vehicles, but their ultimate equity impacts depend on how revenues are used and program design factors. It would be politically difficult to implement mileage-based emission fees.
Action Options
• Support research and pilot projects of distance-based emission fee implementation.
54

Evaluating Mobility Management Strategies Victoria Transport Policy Institute
Pay-As-You-Drive Vehicle Insurance Pay-As-You-Drive vehicle insurance converts fixed vehicle premiums into variable charges by prorating them by mileage. For example, a motorist who now pays $400 per year for insurance would instead pay about 2¢ per kilometre, and a motorist who pays $1,200 would pay 6¢ per kilometre. Pay-As-You-Drive vehicle insurance is predicted to reduce vehicle travel by approximately 10%. It can be implemented as consumer option (just as consumers are able to choose a telephone or Internet service rate structure). It increases insurance affordability and equity, and helps achieve other transportation objectives including congestion reductions and road safety.
Obstacles PAYD requires new administrative responsibilities to record and account for annual vehicle mileage. It would require new premium rates. Only a few PAYD insurance pricing pilot projects have been implemented. The insurance industry has generally opposed PAYD insurance pricing.
Current Status in the Vancouver and Fraser Valley Region PAYD is not currently available in the Vancouver and Fraser Valley, and there are currently no plans to offer it. Only ICBC could implement PAYD vehicle insurance pricing on a significant scale in this region. Some transportation advocacy groups promote it, but their efforts have so far been limited and unsuccessful.
Examples and Case Studies Norwich-Union PAYD Pilot Project (www.norwich-union.co.uk) Norwich Union is implementing a pilot project to test Pay-As-You-Drive vehicle insurance with about 5,000 participants. The response from customers has been very positive. The project collects real-time vehicle data using a device that measures vehicle usage and sends data to Norwich Union using mobile telephone technology. Participants will be billed monthly. As stated by programme director Robert Ledger, “Customers choosing ‘Pay As You Drive’ insurance will benefit from individual premiums based on how often, when and where they actually used their cars. Motorists would receive a fairer deal as this initiative provides them with the opportunity to really be in the driving seat when it comes to controlling their premiums.” General Motors and On-Star Offers PAYD Rates (www.onstargm.com) Beginning in 2004, General Motors Acceptance Corporation (GMAC) Insurance is offering mileage-based discounts to OnStar subscribers located in certain states. The On-Star system will be used to automatically report vehicle odometer reading at the beginning and end of the policy term to verify vehicle mileage. Under the program, motorists who drive less than specified annual mileage will receive the following insurance premium discounts: 1-2,500 miles 40% discount 2,501-5,000 miles 33% discount 5,001- 7,500 28% discount 7,501-10,000 20% discount 10,001-12,500 11% discount 12,501-15,000 5% discount 15,001-99,999 0% discount
55

Evaluating Mobility Management Strategies Victoria Transport Policy Institute
PAY PER K Coverage (www.nedbank.com/website/content/products/product_overview.asp?productid=331). Nedbank, a major South African insurer, now offers Pay Per K vehicle insurance, which bases premiums on monthly mileage. Pay per K monitors the distance a vehicle is driven each month by means of a NedFleet card that is linked to the vehicle’s comprehensive motor insurance. Monthly premiums will fluctuate depending on the distance traveled in the preceding month, and are debited monthly in arrears. This means motorists only pay for those times when their vehicle is actively on the road and therefore most at risk. Progressive Insurance TripSense (https://tripsense.progressive.com) Drive less, pay less--that’s the simple concept behind TripSense(SM), a first of its kind usage-based auto insurance discount pilot program to be offered to 5,000 drivers in Minnesota beginning August 16 by the Progressive group of insurance companies, the third largest provider of auto insurance in the U.S. Program participants are eligible to receive a discount of up to 25% depending on how much, how fast and when they drive. Customers who register a vehicle in the TripSense pilot program plug a data-logging device into a port in their car. The device, called TripSensor(TM), collects information about the vehicle’s use, including how much, how fast and when they drive. TripSensor also collects information about rapid acceleration and braking that is not currently used to calculate the discount. Progressive is collecting this information to better understand if it is predictive of future accidents. Participants in the TripSense program will receive a 5% discount on the six-month premium for each registered vehicle. In subsequent policy periods, TripSense customers earn a 5% discount if they choose to upload their driving data to Progressive. Customers can also receive up to 20% more in discounts based on how much, how fast and when they drive. Sharing driving data with Progressive is always optional, but necessary to earn a discount in future policy terms. Texas Per-Mile Insurance Legislation (www.capitol.state.tx.us) Texas House Bill 45, passed in 2001, gives insurers permission to offer cents-per-mile pricing for vehicle insurance. Companies may begin offering this price option in January, 2002. It also requires insurance companies to separately track and report the claim losses and premium revenues for mileage-based and time-based premiums. Various organizations are working together on a Cents Per Mile For Car Insurance campaign (www.centspermilenow.org) to promote Pay-As-You-Drive vehicle insurance in Texas as allowed by the legislation. Oregon HB 3871 (www.leg.state.or.us/01reg/measures/hb3800.dir/hb3871.intro.html) Bill 3871 introduced in the 2001 Oregon legislature would provide tax credits to insurers that offer Pay-As-You-Drive pricing. It is endorsed by the National Association of Independent Insurers, regional governments, the Oregon/Idaho chapter of the American Automobile Association, the Oregon Consumer League, The Oregon Environmental Council and other environmental organizations, citizen transportation reform groups and the Interfaith Global Warming Campaign. The Oregon Environmental Council (OEC) is has a program to promote PAYD insurance (www.orcouncil.org/Laws/PAYDFactsheet.PDF).
56

Evaluating Mobility Management Strategies Victoria Transport Policy Institute
Table 19 Pay-As-You-Drive Vehicle Fees Summary
Sector Personal vehicle travel. Impact (per participant) 10% mileage reductions, by participants. If offered as a consumer
option would affect about 25% of total mileage.
Take-Up (portion of sector participating)
Could be available within 5 years. If offered as a consumer option it may take a 10 years to achieve full market penetration.
Congestion Reduction Moderate benefit 2 Road and Parking Cost
Savings Moderate benefit 2
Traffic Safety Moderate to large benefit 3 Land Use Impacts (“Smart
Growth”) Moderate benefit 2
Consumer Costs Moderate to large benefit. Increases automobile affordability. 2 Transportation Options Moderate to large benefit. Increases automobile affordability. 3
Equity Impacts Horizontal and vertical equity. 3 Technical and
Administrative Requirements
Small to moderate. 2
Public/Political Acceptability
Moderate to large popular support for consumer optional PAYD insurance. Resistance from the insurance industry.
2
Implementation This change could be implemented by specific provincial legislation; independency by ICBC, or by allowing private insurers to compete and offer PAYD pricing.
Basis for Estimates of “Impacts” and “Take-Up” Analysis published in other studies indicates that PAYD insurance would reduce mileage about 10% per participating vehicle. If offered as a consumer option it should attract 30-40% of all vehicles (any driven less than about 18,000 kilometers annually), but because they would be lower-annual-mileage vehicles, they would represent only about 25% of all vehicle miles. A mandatory system could affect nearly all personal vehicle travel in the province. Such a system could be implemented within five years.
Conclusions Pay-as-you-drive insurance and registration fees could be an effective mobility management strategy. They could be particularly effective at reducing energy consumption, pollution emissions, crashes and urban sprawl, and are justified on equity grounds. However, federal and regional governments do not have direct influence on these prices.
Action Options
• Sponsor research on PAYD pricing. For example, investigate the potential role of PAYD insurance as an emission-reduction strategy, and help fund pilot projects.
• Support pilot projects to test the costs and effectiveness of PAYD. In particular, encourage the BC government and ICBC to test PAYD pricing.
• Provide incentives for insurance companies to offer PAYD.
• Allow PAYD insurance to qualify for emission reduction credits.
57

Evaluating Mobility Management Strategies Victoria Transport Policy Institute
Fuel Tax Increases Fuel tax increases are an effective way to reduce energy consumption but less effective at reducing other emissions and other mileage-related vehicle costs. Raising fuel price has two effects, in the short run it causes modest vehicle mileage reductions, and over the long term encourages motorists to choose more fuel-efficient vehicles. For example, a 10% price increase typically reduces fuel consumption by about 3% within the first year, and 7% over a five to ten year period (“Transportation Elasticities,” VTPI, 2002). About one-third of long-term energy savings result from reduced driving, and two-thirds from consumers shifting to more fuel-efficient vehicles. Increased fuel efficiency does little to reduce emissions of pollutants other than CO2. Manufactures design vehicles to meet specific standards and so apply more emission reduction strategies in vehicles with larger engines than those with smaller engines. Lighter, aerodynamic vehicles tend to emit less non-tailpipe emissions such as tire particles and road dust, but these effects are difficult to quantify. Most emissions decline in proportional to mileage. For example, a 50¢ per gallon (1991 U.S. dollars) fuel tax increase is predicted to reduce mileage by about 4%, energy consumption by about 9%, and other emissions by 3-4%, as indicated in the table below. Table 20 Fuel Tax Increase (Harvey and Deakin, 1998, Table B.8)
Region Tax Increase VMT Trips Delay Fuel ROG Revenue $0.50 -3.6% -3.4% -8.5% -8.8% 3.5% $1,332 Bay Area $2.00 -11.7% -11.3% -25.5% -30.6% 11.6% $4,053 $0.50 -4.1% -3.9% -7.0% -9.3% 4.0% $414 Sacramento $2.00 -13.2% -12.7% -22.0% -31.8% 13.0% $1,245 $0.50 -3.9% -3.5% -8.0% -9.1% 3.8% $747 San Diego $2.00 -12.5% -12.0% -23.0% -31.1% 12.3% $2,257 $0.50 -4.2% -3.5% -9.5% -9.3% 4.1% $3,724 South Coast $2.00 -13.0% -12.5% -28.5% -31.6% 12.8% $11,235 Tax Increase = additional fuel taxes applied in addition to current taxes. VMT = change in total vehicle mileage. Trips = change in total vehicle trips. Delay = change in congestion delay. Fuel = change in fuel consumption. ROG = a criteria air pollutant. Revenue = annual revenue in millions of 1991 U.S. dollars. See original report for additional notes and data. Since taxes represent about half of total fuel prices in Canada, a 20% tax increase is required to produce a 10% price increase. Such taxes are considered regressive, although their overall equity impacts are affected by factors such as how much lower-income people drive, and ultimately depend on how revenues are used. Revenue-neutral tax shifts (increasing fuel taxes and using the revenue to reduce other taxes considered more economically harmful, such as employment and business taxes) can provide economic development benefits by reducing employment and investment costs, reducing the economic costs of petroleum imports, and by stimulating energy efficiency technological development and implementation.
58

Evaluating Mobility Management Strategies Victoria Transport Policy Institute
Obstacles There tends to be political opposition to fuel price increases, particularly if they are large enough to significantly affect travel behavior. Fuel taxes are higher in Canada than in the US, placing an economic burden on some industries. High fuel taxes give motorists an incentive to purchase fuel in other jurisdictions or illegally. Since British Columbia already has higher fuel prices than neighboring jurisdictions, additional fuel tax increases may increase cross-border fuel purchases. Fuel taxes are considered regressive and unfair to certain groups, such as rural residents.
Current Status in the Vancouver and Fraser Valley Region British Columbia has higher vehicle fuel taxes than its neighbors, and TransLink receives a share of regional fuel tax revenues. There are currently no plans to increase federal or provincial fuel taxes.
Examples and Case Studies New Zealand Plans Carbon Tax to Meet Kyoto Targets WELLINGTON, October 18, 2002 - New Zealand announced plans yesterday for a carbon tax that will push up fuel costs but help the country meet targets under the Kyoto climate change agreement. The tax of up to NZ$25 (CA$18) a tonne of carbon dioxide equivalent will be levied sometime after 2007, and only if the Kyoto protocol comes into force internationally. It would raise retail petrol prices by up to six percent, diesel by 12 percent, and gas and electricity prices by eight to nine percent, government papers showed. Big losers would be coal users, whose costs would jump 19%. “The policies...will enable New Zealand to meets its greenhouse gas emission targets under the Kyoto protocol while protecting the nation’s economic interests,” Energy Minister Pete Hodgson said, after the tax proposal was approved by the cabinet. An as-yet-unknown amount of cash raised by the new tax would be offset by cuts to other taxes, he said. New Zealand produces between 70 million to 90 million tonnes of carbon dioxide a year, ranking it the fourth largest per capita producer after the United States, Australia, and Canada. Ireland Climate Change Strategy Commits to Phased-In Carbon Taxes (www.environ.ie) A national climate change strategy unveiled November 2000 by Irish environment minister Noel Dempsey commits to phased-in revenue-neutral carbon taxation starting in 2002. The carbon taxes would be enacted in concert with participation in EU and international emissions trading. The transport and energy production sectors would probably achieve the largest reductions in emissions from a carbon tax and help the country meet its Kyoto protocol target. Other policies to reduce emissions from the residential, buildings, and agricultural sectors are also included in the plan. Although the group Earth Watch Ireland was pleased with the plan, the Irish Business and Employers Confederation insists that the carbon taxes would damage the economy. Economist Magazine Highlights Benefits of Environmental Tax Reform In cover stories focusing on world dependence on Middle Eastern oil, The Economist (December 15, 2001, pp. 9 and 16) cites environmental tax reform as a route to greater energy security. Its Leaders editorial argues that U.S. gasoline tax is too low. According to the column, a long-term plan to shift taxes from incomes to carbon emissions is needed. This would spur development of new transport technologies that are vital in curbing the demand for oil. In its story “A Dangerous Addiction,” the magazine says the best way to promote the development of alternative fuels and new technologies is through taxation that reflects the energy security risk (as well as dangers to health and the environment) of burning oil. Europe recognizes this, and over the past decade has started to shift the burden of taxation from income to, for example, carbon emissions.
59

Evaluating Mobility Management Strategies Victoria Transport Policy Institute
Double Dividend From Environmental Tax Shift A study by World Bank economist Benoît Bosquet finds that ecological tax reform delivers what is called a “double dividend,” benefits both to the economy and the environment. In “Environmental Tax Reform: Does It Work? A Survey of the Empirical Evidence,” (Ecological Economics Vol. 34, 2000, pp. 19-32). Analysis showed that reductions in carbon emissions would result in improvements of environmental quality as well as marginal gains in employment levels. These impacts depend on country specific factors and on the design of each tax-shifting plan. Table 21 Fuel Tax Increase Summary
Sector All petroleum-based road travel. Impact (per participant) 20% tax increase raises fuel prices by 10%, which reduces vehicle
travel by 3%, fuel consumption by 7%, and emissions by 5%.
Take-Up Could be implemented quickly (within one year). Congestion Reduction Small benefit 1
Road & Parking Cost Savings Small benefit 1 Traffic Safety Small benefit (may be partly offset by reduced vehicle size) 1
Land Use Impacts Small benefit. 1 Consumer Costs Increased motorist cost (economic transfer) -1
Transportation Options Reduces automobile travel affordability. -2 Equity Impacts Increases horizontal equity but reduces vertical equity. 0
Technical and Administrative Requirements
No additional administrative costs, since fuel taxes are already collected.
0
Public/Political Acceptability May be difficult to implement due to general opposition to fuel tax increases.
-2
Implementation Federal or provincial legislation.
Basis for Estimates of “Impacts” and “Take-Up” Analysis published in other studies indicates that a 20% tax increase raises fuel prices by 10%, which reduces vehicle travel by 3%, fuel consumption by 7%, and emissions by 5%. Such a tax increase could be implemented within five years.
Conclusions Fuel tax increases are an effective way to reduce energy consumption, while providing modest reductions in other vehicle emissions and problems such as traffic congestion. However, there tends to be considerable political opposition to fuel tax increases, and fuel prices cannot increase significantly in BC without causing significant cross-border leakage, resulting in loss of tax revenue and jobs, and increased border congestion. As a result, only modest fuel tax increases are appropriate unless other nearby governments also raise their fuel taxes.
Action Options
• Support research on the economic costs and benefits of tax shifting.
• Support an integrated North American policy to increase fuel taxes.
• Allow fuel tax increases to qualify for emission reduction credits.
60

Evaluating Mobility Management Strategies Victoria Transport Policy Institute
Road Pricing Road Pricing means that motorists pay directly for using a particular roadway or driving in a particular area. Economists have long advocated road pricing as an efficient and equitable way to pay roadway costs and encourage more efficient transport, and new electronic pricing systems eliminate the need for vehicles to stop and pay tolls, reducing transaction costs. Specific types of road pricing are described below.
• Toll Roads are a common way to fund highway and bridge improvements. This is considered more equitable and economically efficient than other roadway improvement funding options.
• Congestion Pricing (also called Value Pricing) refers to pricing that is higher during congested periods.
• Cordon (Area) Tolls are fees paid by motorists for driving in a particular area.
• Mileage-Based Road Use Charges such as weight-distance fees and GPS-based pricing. A 1¢ per vehicle-kilometre fee (2002 Canadian dollars) is predicted to reduce total vehicle mileage by about 1.8% (based on Harvey and Deakin, 1997, illustrated in Table 9). Some road pricing proposals only toll congested highways or districts, or new highways, representing a minor portion of total vehicle travel, which limits its energy saving and emission reduction impacts. Road pricing can be particularly effective if implemented in conjunction with improvements to other modes. Table 22 Congestion Pricing (Harvey and Deakin, 1997, Table B.6)
Region Avg. Fee VMT Trips Delay Fuel ROG Revenue Bay Area 13¢ -2.8% -2.7% -27.0% -8.3% -6.9% $2,274 Sacramento 8¢ -1.5% -1.4% -16.5% -4.8% -3.9% $443 San Diego 9¢ -1.7% -1.6% -18.5% -5.4% -4.2% $896 South Coast 19¢ -3.3% -3.1% -32.0% -9.6% -8.1% $7,343 Avg. Fee = average per-mile fee for vehicles travel on congested roads. VMT = change in total vehicle mileage. Trips = change in vehicle trips. Delay = change in congestion delay. Fuel = change in fuel consumption. ROG = an air pollutant. Revenue = annual revenue in millions of 1996 U.S. dollars.
Obstacles There tends to be considerable controversy over road pricing, particularly if implemented on existing roadways. Electronic road pricing requires significant planning and investment, and raises concerns about privacy, fraud and errors.
Current Status in the Vancouver and Fraser Valley Region There are currently no toll roads in the Vancouver and Fraser Valley. Road tolls have been proposed in provincial and regional transportation plans as a mobility management strategy (in particular, charging tolls for driving across major bridges toward Vancouver during rush hour) and a source of transportation revenue, but such plans have been deferred due to political opposition. The current provincial government has proposed road tolls to fund new highway capacity, but not on existing roadways, effectively preventing their use for mobility management (MOT, 2002).
61

Evaluating Mobility Management Strategies Victoria Transport Policy Institute
Examples and Case Studies SR 91 Express Toll Lanes (www.91expresslanes.com) State Route 91 in Orange County, California has 10-miles of express toll lanes privately constructed and built by the California Private Transportation Company (CPTC), and funded by variable electronic tolls. CPTC contracts with Caltrans and the California Highway Patrol for maintenance and police services. The 91 Express Lanes uses “FasTrak” electronic transponders to collect tolls that vary from $0.75 to $3.50 per trip, depending on level of congestion. In 1998 more than 9 million tolled trips were made on the facility, with revenues of approximately $20 million. SR91 Project Evaluation (http://ceenve.calpoly.edu/sullivan/sr91/sr91.htm). Highway 407 (www.407etr.com) Highway 407, the Express Toll Route (ETR), is a multi-lane, electronic highway running 69 kilometres across the top of the Greater Toronto Area, from Highway 403 in Oakville to Highway 48 in Markham. The first phase of the Highway opened in 1997 and runs from Highway 410 in Brampton to Highway 404 in Markham. Fees are 10¢ per kilometer during weekday peaks, 8¢ per kilometer during weekends and off-peak periods, and 4¢ per kilometer at night. Speeds on Highway 407 are about double that of parallel free highways. Peak-hour traffic volumes average 11,000 to 12,000 vehicles. Surveys indicate a high level of user satisfaction. London Instituting Congestion Charge (www.london.gov.uk/mayor/congest/index.htm) Since 17 February 2003 the city of London has charged a £5 daily fee for driving private vehicles in an eight square mile central area during weekdays to reduce congestion and raise revenues for transport improvements. The system uses closed-circuit cameras to check license plate numbers of vehicles entering the charging zone against a database of motorists who have paid the fee. Despite considerable controversy the program was implemented without major problems, and has substantially reduced traffic congestion, improved bus and taxi service, and is generating revenues. Public acceptance has grown and there is now support to expand the program to other parts of London. This is the first congestion pricing program in a major European city, and its success suggests that congestion pricing may become more politically feasible elsewhere. Austin Transportation User Fee (www.ci.austin.tx.us/development/ldc1.htm) The City of Austin, Texas has an innovative way of financing transportation infrastructure which rewards households that do not own cars. City utility bills include a “Transportation User Fee” (TUF) which averages $30 to $40 (US) annually for a typical household. This charge is based on the average number of daily motor vehicle trips made per property, reflecting its size and use. For example, single-family development is estimated to generate 40 motor vehicle trips per acre per day, and offices generate approximately 180 motor vehicle trips per acre per day. The city provides exemptions to residential properties with occupants that do not own or regularly use a private motor vehicle for transportation, or if the user is 65 years of age or older. Norwegian Cordon Tolls (www.zietlow.com/docs/odeck.pdf) Many Norwegian cities use tolls to fund transportation improvements. In 1991, Trondheim—Norway’s third largest city with a population of 140,000—implemented a “toll ring” that surrounds the city’s downtown area. The toll ring has 12 toll stations and uses a total of 35 lanes. Each tollbooth operates with an electronic card system, used by 80% of drivers entering the city. Rates range from U.S. $0.62 to $1.56, with peak charges between 6:00 a.m. and 10:00 a.m. Inbound traffic has declined by 10% during toll periods while non-toll period traffic has increased by 9%. Weekday bus travel increased 7%. Revenues are used for roads, public transit, walking and cycling facilities.
62

Evaluating Mobility Management Strategies Victoria Transport Policy Institute
Table 23 Road Pricing Summary
Sector Congested or new highways, representing 20% of total mileage. Impact (per participant) 20% automobile travel reductions where applied, 25% reductions
in fuel consumption and emissions due to less congestion.
Take-Up 0%, 10%, 20%, 30%, 40% Congestion Reduction Large benefit 3
Road and Parking Savings Moderate to large benefit 2 Traffic Safety Small benefit (shifts traffic to safer modes and reduces congestion,
but increases traffic speeds). 1
Land Use Impacts Mixed impacts. 1 Consumer Costs Moderate to large cost (economic transfer) -2
Transportation Options Moderate cost. Reduces driving affordability. -3 Equity Impacts Increases horizontal equity, reduces vertical equity. 0
Technical and Administrative Moderate to large. -3 Public/Political Acceptability Tends to be politically difficult. -3
Implementation Requires provincial legislation and transport planning changes.
Basis for Estimates of “Impacts” and “Take-Up” Generally applied either as a congestion reduction strategy or a way to fund new highway capacity, either way it is generally implemented only on the most congested roads, representing perhaps 20% of total regional travel. Where it is applied, road pricing tends to reduce vehicle travel by 10-30%. Where it reduces congestion, it provides additional energy and emission reductions. I assume it would be deployed on major urban highways and bridges, eventually representing 25% of regional vehicle travel.
Conclusions Road pricing is an efficient way to manage travel demand. Variable fees can be particularly effective at reducing traffic congestion. New electronic tolling technologies allow road pricing to be relatively convenient and cost effective. Experience has generally been positive: once congestion pricing is established consumer acceptance tends to increase. There has been considerable research concerning the feasibility of tolling major bridges in the Vancouver region as a demand management strategy, but proposals face political opposition. During the next few years, road pricing may be implemented to help fund highway projects, but is less likely to be broadly implemented as a mobility management strategy.
Action Options
• Establish a federally-funded road pricing pilot project to identify congestion pricing barriers and opportunities, test potential electronic road pricing technologies, and demonstrate the feasibility and benefits of road pricing.
• Encourage regional and local governments to use road pricing as a way to fund transportation projects, for example, as a way to match federal grants.
• Allow road pricing projects to qualify for emission reduction credits (i.e., as a way to meet federal air quality standards).
• Encourage or require road pricing as a way to provide matching funds for federal infrastructure investments, such as highway and transit improvements.
63

Evaluating Mobility Management Strategies Victoria Transport Policy Institute
Parking Management and Parking Pricing Parking Management and Parking Pricing strategies are effective ways to affect travel patterns, particularly in urban areas. Parking management includes: • Reduced and more flexible parking requirements. • Shared parking facilities, including use of public on- and off-street parking, and spaces shared
among users of a parking lot, rather than reserved to individuals. • In lieu fees, allowing developers to fund public parking rather than supplying all required
parking at each destination. • Regulations that prioritize use of the most convenient spaces. • Price parking (charging motorists directly for using parking facilities) • Tax parking facilities or their use. • Parking Cash Out (allow commuters to choose cash instead of subsidized parking). • Unbundled parking (renting parking spaces separately from building space). Parking management and pricing supports use of alternative modes, support Employee Trip Reduction programs, improves walkability, and encourages more efficient land use. Current parking planning practices, which rely on minimum parking requirements in zoning codes and government subsidy of parking facilities, tend to result in generous parking supply, which reduces prices and results in more dispersed development patterns. Changing these practices can create a more efficient transportation market. Charging motorists directly for the parking tends to reduce automobile trips by 10-30%. Reducing employee parking supply and parking facility subsidies tends to increase use of alternative commute modes. However, parking pricing and taxes may increase sprawl if only applied in urban centers.
Obstacles Parking management requires transportation officials to change the way they define parking problems and solutions (i.e., it reduces emphasis on capacity expansion) and requires new planning techniques and responsibilities. There tends to be little funding to implement parking management compared with the resources available to increase parking facility supply. There is often public skepticism and resistance to parking management strategies, particularly those that involve pricing or which may cause spillover problems. It requires new relationships between regional and local government agencies, businesses and developers.
Current Status in the Vancouver and Fraser Valley Region Some parking management activities are being implemented in various areas within the Vancouver and Fraser Valley, including shared and priced parking, but this represents a relatively small portion of total regional parking spaces. Outside of the most urbanized areas there are few efforts to create flexible parking requirements or encourage shared parking. Most local jurisdictions and the provincial government continue to have generous and rigid minimum parking requirements in zoning codes, and parking is usually bundled with building space.
64

Evaluating Mobility Management Strategies Victoria Transport Policy Institute
Experience and Case Studies Tri-Met Parking Management (www.tri-met.org) The Tri-County Metropolitan Transportation District, which manages transportation in the Portland, Oregon area, has implemented various parking management strategies around transit stations to minimize costs and support transit oriented development. These include:
• Arranging shared parking with Park & Ride and other types of land uses, including apartments, churches, movie theaters and government buildings near transit stations.
• Using lower minimum parking requirements around transit stations.
• Allowing Park & Ride capacity near transit stations to be reduced if the area around the station has residential or commercial development, thus allowing car trips to access transit to be replaced by walk/bike trips.
Monrovia, California Downtown Parking Management (www.ci.monrovia.ca.us) By Dick Singer, City of Monrovia Public Information Officer It seemed a risk worth taking - locating a 12-screen, 2,400-seat movie theater in the middle of Monrovia’s Old Town without providing the usual adjacent parking structure. It made sense. Monrovia’s Old Town business district is compact (six blocks long and two wide) and abutted by residential neighborhoods on three sides. Medium and high-density housing (mainly senior citizen) had been developed immediately adjacent to the commercial properties. Both MTA and Foothill Transit buses provide service to the edges of Old Town and Monrovia has an active dial-a-ride service providing door-to-door public transportation. Old Town was redeveloped in the 1970s as a pedestrian-friendly “main street” shopping and service district. Free public parking lots and street parking combined to provide more than 1,200 spaces scattered throughout the district that were never more than 80% filled. For several years, a Friday night Family Festival street fair - running weekly from March through to Christmas - drew as many as 8,000 people on a typical summer night with very little overflow parking into residential neighborhoods. Additionally, most of the businesses using public parking for their employees closed at 5 p.m. and few stores stayed open past 7 p.m., meaning that a shared parking plan seemed feasible - daytime use for office workers and nighttime use for theater goers. The theater was to go up on one of the public parking lots, so those spaces had to be replaced, and were by the expansion of another City-owned lot and the re-configuration of a sidestreet adjacent to both that lot and the theater site. When the theater opened, there were more spaces than before the project began. In its first six months of operation, the theater has attracted good crowds and the parking has yet to be a problem. Lot and street parking is sufficient to handle the demand and convenient enough so movie-goers will happily walk two-to-three blocks between their cars and the theater to stroll past shops and restaurants. The shared-parking plan has worked well in the project’s early stages. The second phase of our plan is now about to begin. Theater crowds are drawing a new business mix to the district (as planned) and we are aware that more nighttime business use will develop over the next year. An assessment district is now in the works to finance more Old Town parking - either a structure or an additional street-level lot - to handle the expected increase.
65

Evaluating Mobility Management Strategies Victoria Transport Policy Institute
Parking Management Information Development The U.S. Environmental Protection Agency has sponsored research and produced various information resources to encourage parking management implementation (USEPA, 1999). Highland Park (www.cityhpil.com/community/parkingalert.html) The Highland Park (Illinois) Intra-City Parking Committee (ICPC) is an organization of downtown merchants and public officials to improve downtown parking options for customers and employees. In recent years the ICPC has worked to increase parking regulation and enforcement in the downtown core to favor customers. These measures include:
• Restricting on-street parking and certain surface parking lot spaces to two hours, and the first level of a municipal garage to three hours.
• Extending the 2-hour time limit for downtown on-street parking to 7:00 p.m.
• Requiring motorists to travel at least 500 feet to be considered a new space.
• Raising parking fines from $10 to $15, with increasing fines for multiple violations in a 30-day period.
Fee In Lieu Programs In lieu fees allow developers to fund municipal parking facilities instead of providing their own on-site parking. For example, Lake Forest, Illinois has had a fee-in-lieu policy for about 15 years. Developers may choose to pay $22,000 toward municipal parking facilities rather than building a required parking space. Developers frequently use this option. San Francisco Commercial Parking Tax (www.ci.sf.ca.us/tax/parking.htm) The city of San Francisco imposes a 25% tax on all commercial parking transactions (“any rent or charge required to be paid by the user or occupant of a parking space.”) The city collects nearly $50 million annually from this tax, and expects this revenue to increase if parking operators implement better revenue control systems (PT, 2001). Revenues are divided between the city’s general revenue, public transportation and senior citizen funds. Minimum Parking Requirements Eliminated Victoria, British Columbia conducted a design charrette (i.e., a community planning exercise) to create a development plan for the Harris Green neighborhood at the edge of downtown. One result of this process was to eliminate minimum parking requirements for new buildings in that area, and to redevelop the neighborhood to emphasize walkability and efficient management of public parking. Since that plan was established the Harris Green area has experienced a boom in medium- and high-rise mixed residential and commercial development containing middle and higher priced condominiums. Although virtually all of these developments contain some parking, the amount is established by the developer to reflect market demand, not be the city based on generic standards. Many residents, including both young professionals and elderly retirees, do not own a vehicle.
66

Evaluating Mobility Management Strategies Victoria Transport Policy Institute
Table 24 Parking Management Summary
Sector Personal vehicle travel. Impact (per participant) 20% automobile travel reductions are typical with cost-based
pricing.
Take-Up (portion of sector participating)
10%, 20%; 30%; 40%; 50%. Some locations are more suitable for priced parking, but others are not so full participation is unlikely.
Congestion Reduction Moderate benefit. 2 Road and Parking Savings Moderate to large benefit 3
Traffic Safety Small benefit. 1 Land Use Impacts Moderate benefit. May encourage sprawl if applied in just urban
centers. 2
Consumer Costs Increased vehicle costs (economic transfer) -2 Transportation Options Reduces automobile affordability. Improves pedestrian conditions. -3
Equity Impacts Increases horizontal equity, reduces vertical equity. 0 Technical and Administrative Moderate to large. -2 Public/Political Acceptability May be opposition to pricing. -2
Implementation Varies. Generally requires changes to municipal zoning codes, development requirements and transportation planning practices. Some (such as paid rather than unpriced parking) can be implemented by businesses. Special programs can promote best parking practices to planning professionals and businesses.
Basis for Estimates of “Impacts” and “Take-Up” Where it is applied, parking pricing tends to reduce vehicle travel by 10-30%. I assume that with strong provincial, regional and local government support it could achieve 50% take-up (weighted by vehicle trip destinations) after 20 years.
Conclusions Parking management and pricing can be effective mobility management strategies. They tend to be particularly effective for reducing urban commuting, and to help create more efficient land use patterns. These strategies are generally implemented at the local level, but they can be affected by regional, provincial and federal policies.
Action Options
• Sponsor research, professional development workshops, and information resource development on parking management implementation.
• Survey stakeholders to identify obstacles and opportunities for parking management and parking pricing.
• Encourage regional and local governments to use parking taxes as a way to fund transportation projects, for example, as a way to match federal grants.
• Promote the development of TMAs, described earlier, to provide parking management and brokerage services in a particular area.
• Have federal agencies and federally-sponsored programs implement parking management and parking pricing.
• Increase enforcement of employee parking benefit tax collection.
67

Evaluating Mobility Management Strategies Victoria Transport Policy Institute
Mobility Management Marketing Mobility Management Marketing includes various efforts to encourage public support for, and participation in, mobility management activities. It includes: • Educating public officials and businesses about mobility management.
• Informing potential participants about mobility management options they can use.
• Identifying and overcoming market barriers to the use of alternative modes.
• Promoting benefits and changing public attitudes about alternative modes.
• Targeted, personalized marketing campaigns, which involves identifying the subset of consumers who are most amenable to changing their travel patterns and providing them with suitable incentives to try alternatives.
There are different types of marketing programs. Mass marketing programs use broadcast media such as newspapers, radio and television to convey a generic message to a broad audience. Personal or direct marketing programs use telephone or other personal contacts to offer each individual a set of services and resources designed to meet their needs. Some mobility management marketing programs are a combination of these strategies, using contacting specific groups (cyclists, transit riders, downtown employees) with specialized brochures or newspaper advertisements that include information on ways to obtain more personalized information and services (websites and telephone hotlines).
Obstacles Mobility management marketing requires new roles and responsibilities for transport agencies. It requires new funding sources. Benefits are sometimes difficult to measure.
Current Status in the Vancouver and Fraser Valley Region Several mobility management marketing programs exist in the region, including the Go Green program and other promotional campaigns by TransLink and BEST. TransLink will soon start on a 20-month TravelSmart pilot project in 6 GVRD neighbourhoods, funded as part of a Federal Showcase Community project.
Case Studies and Examples TravelWise Website (www.rmoc.on.ca/travelwise) The Ottawa-Carleton regional government established the TravelWise website to provide a one-stop, on-line source for information about walking, cycling, carpooling, public transit and more. TravelWise is home base for the Region’s transportation demand management (TDM) program. The site will have an online Cycling Map, information to help drivers reduce their costs and environmental impacts, a “TravelWise at Work” section that will focus on workplace commuting, and “TravelWise at School,” a local resource for International Walk to School Day. Go For Green (www.goforgreen.ca/home_e.html) Go for Green is a national non-profit, charitable organization encouraging Canadians to pursue healthy, outdoor physical activities while being good environmental citizens. It encourages active transportation (walking and cycling). It sponsors the Commuter Challenge (see below) and school transport management programs. Go For Green provides information and materials, including newsletters, report, case studies and merchandize (logo shirts and hats).
68

Evaluating Mobility Management Strategies Victoria Transport Policy Institute
Commuter Choice Marketing Program (www.commuterchoice.com) Commuter Choice is a U.S. program that encourage employers to offer employee trip reduction programs and incentives. It emphasizes the benefits of such programs to employers, employees and communities, and provides a variety of resources and support services. Like any other product, Commuter Choice relies on marketing initiatives to successfully reach its audience, including employers, commuters and others. The Cooperative Commuter Choice Marketing Initiative has developed a variety of materials and model advertisements to promote transportation alternatives. • Community-wide marketing & education campaigns. • Employer materials promoting commuting choices and benefits. • Educational materials relating to the costs and benefits of commuting choices. • Promotional events or programs to try commuting choices. • Testimonials from satisfied customers. Commuter Challenge (www.commuterchallenge.net) The Commuter Challenge is a week-long, friendly competition between Canadian cities to see which can cut its air pollution the most by using active and/or sustainable modes of transport. Participants commitment to walk, jog, cycle or in-line skate (active transportation) and/or bus, carpool or telework during Environment Week (June 2-8, 2002). With this information, the Commuter Challenge team determines the amount of air pollution each participant reduced using an Environment Canada pollution model that calculates the number of kilograms of pollution produced by automobile commuting. The program emphasizes both personal and community benefits from reduced automobile travel. Environment Canada’s Clean Air Day Clean Air Day (CAD) was proclaimed by the Government of Canada to increase public awareness and action on clean air and climate change. It is part of Canadian Environment Week which was created to promote and to celebrate activities that care and nurture our environmental legacy. Clean Air Day builds on a tradition of community activities that target environment, health and transportation issues during the months of May and June. TravelSmart (www.dpi.wa.gov.au/travelsmart) TravelSmart is a community-based program that encourages people to use alternatives to travelling in their private car. It provides information, motivation and skills to help people choose alternatives to driving for personal travel. This uses Individualised Marketing that reaches households through schools, businesses, local government and major destinations that run their own TravelSmart programs. The Perth Metropolitan Transport Strategy targets a 35% reduction in single-occupant-vehicle trips over the next 30 years. TravelSmart is a significant part of that strategy. TravelSmart research indicates that travellers have alternatives to driving for about 45% of all personal trips. Increasing the portion of these trips made by environmentally-friendly modes from 10% to 25% would achieve the Transport Strategy targets. The Individualised Marketing program started with a pilot project in South Perth in 1997. The pilot project achieved a 10% reduction in car travel, a 16% increase in walking, a 21% increase in public transit use, and a 91% increase in cycling. These changes in travel behaviour were found to continue when measured one and two years later. Large-scale application of the program to the whole City of South Perth population (15,300 households) achieved a 14% reduction in car travel, 35% increase in walking, a 17% increase in transit use, and a 61% increase in cycling. Analysis of transit (bus) boardings for routes through the area showed a 21% increase in patronage.
69

Evaluating Mobility Management Strategies Victoria Transport Policy Institute
This project was funded from capital funds under the concept of a “non-built” solution. It achieves an equal or better transportation benefits as an investment in physical infrastructure improvements. The Western Australian Department of Transport plans to expand the program to the entire city of Perth. If the objectives are realized, a 7% reduction in car travel across the whole region will be achieved at the cost of 2% of new main road construction for the same period. The project is estimated to have a benefit/cost ratio exceeding 13. A Brisbane trial of the individualised marketing approach to promotion of walking, cycling and public transport has achieved a 10 percent reduction in private vehicle use with an approximate benefit to cost ratio of 20:1. The pilot used the IndiMark technique which has also been successfully applied in Perth both as a pilot and on a larger scale. There are five key phases in the IndiMark process: contact and segmentation, motivation, information, convincing and system experience and evaluation. Seattle Way-To-Go Household Car Reduction Program (www.cityofseattle.net/waytogo) Way to Go, Seattle is a new initiative to show people they can save money and make their communities more livable by making more conscious transportation choices, just as they do now with recycling and water conservation. During summer 2001, 23 Seattle families completed a Way to Go pilot program to see if people could get along without their extra car for six weeks. The results are impressive. At least four families liked it so much that they’re selling the car. Some families didn’t need to participate in the program to be convinced. By determining the cost of owning their car on the City’s website, they sold their extra car without evening participating in the program! “We can all take small steps to improve our transportation system,” said Mayor Paul Schell. “These families have proven that we can make choices about how to get around and enjoy spending less time in our cars.” All the families in the study saved money, and most saved about $64 per week. The all found they could get around on transit, walking, bicycling and taking taxis when needed for about $21 a week, far less than the $85 per week cost of an average second car. Most families tell us they will continue to take the bus or ride their bike, and think about whether they need to drive to where they want to go. “We hope more people will see they don’t need that extra car,” said Jamae Hoffman, project manager. “Families making smart decisions about transportation can cut down on vehicle trips, congestion, gasoline use and, of course, air pollution.” The best experience for Richard Kielbowitz and Linda Lawson of the Hawthorne Hills neighborhood was “watching the price of gas rise for other people”. “When we heard reports of traffic jams, we counted our blessings that we were not caught up in them,” they said. After participating in the program, Kielbowitz and Lawson sold their second car. Seattle’s Strategic Planning Office paid participating families $85 per week for keeping a daily dairy of their transport activities and expenses during the six weeks they did not use their extra cars. Families were able to use the $85, the national average cost of owning and operating a second car, for bus fares, joining a carsharing service, or taxi when needed. Most families spent only about $21 getting around without a car, saving an average of $49 per week. As a result the 23 families made nearly 200 fewer car weekly trips totaling 1,260 miles of travel avoided.
70

Evaluating Mobility Management Strategies Victoria Transport Policy Institute
Table 25 Mobility Management Marketing Summary
Sector Personal vehicle travel. Impact (per participant) 7% automobile travel reductions are typical in North America.
Take-Up (portion of sector participating)
0%, 100%, 100%, 100%, 100%
Congestion Reduction Moderate benefit. 2 Road and Parking Cost
Savings Moderate benefit. 2
Traffic Safety Moderate benefit. 2 Land Use Impacts Moderate benefit. 2
Consumer Costs Moderate benefit 2 Transportation Options Moderate benefit 2
Equity Impacts Small benefit (helps make alternative modes more acceptable) 1 Technical and Administrative Moderate. 2 Public/Political Acceptability General public support, but there may be resistance to adequate
funding. 1
Implementation Usually implemented by transportation management association, transit agencies, local governments or independent transportation organizations.
Basis for Estimates of “Impacts” and “Take-Up” Where it is applied, mobility management marketing programs tends to reduce vehicle travel by 5-10%. Such a program could ramp up quickly and be fully deployed throughout the region within 5 years.
Conclusions Experience indicates that marketing programs can make an important contribution toward mobility management implementation. Individualized marketing appears to have considerable potential, particularly if implemented in conjunction with other regional mobility management programs, such as transit, ridesharing and nonmotorized transportation improvements. There is still much to learn about these programs.
Action Options
• Sponsor mobility management marketing pilot projects.
• Help develop regional transportation management associations that can provide both general and targeted mobility management marketing programs.
• Help change policies so mobility management strategies can compete equally with capital investments for transport funding.
• Support research to improve the ability to develop effective mobility management marketing programs and to predict their potential effectiveness.
71

Evaluating Mobility Management Strategies Victoria Transport Policy Institute
Transit Improvements and Incentives There are many ways to improve public transit service and increase ridership: • Increased transit service (more routes and more frequent vehicles). • Lower and more convenient fares (such as discounts for frequent users and “smart card”
electronic fare payment). • Park & Ride facilities. • Comfort improvements, including bus shelters and better seats. • Improved rider information and marketing programs. • Improved security for transit users and pedestrians. • Services targeting particular travel needs, such as express bus and special event service. • Bike/transit integration (such as bikeracks on buses and bicycle parking at transit terminals). The Vancouver region has relatively cost-efficient transit service and is in a relatively good position for increasing transit ridership compared with many other North American cities (CST, 2002). Vancouver area transit ridership has grown significantly in recent years, particularly in response to U-Pass programs (transit passes provided to college and university students). While many cities have trouble attracting transit riders, Vancouver has crowded buses, indicating latent demand for transit travel. There are a number of relatively cost effective strategies that are likely to increase transit ridership, particularly increasing the quantity and quality of transit service on major urban routes. Travel impacts vary, depending on the type of program and how it is evaluated. Some types of transit improvements leverage provide a catalyst for more accessible land use patterns, which provides additional automobile travel reductions besides just the miles shifted from driving to transit (Holtzclaw, 2000; Litman, 2004). Studies indicate that each passenger-kilometre of rail travel represents 3 to 6 kilometres of reduced automobile travel, suggesting that total energy saving and emission reduction benefits can be many times greater than what results directly from shifts from driving to transit.
Obstacles Transit improvements are currently limited by funding and urban design factors. Transit service improvements require government funding. Although consumers can save overall (for example, allowing households to reduce their automobile use or even reduce their vehicle ownership), these tax-based costs are highly visible, while benefits are dispersed and difficult to measure.
Current Status in the Vancouver and Fraser Valley Region Regional transportation plans include substantial transit improvements, but many of these are currently unfunded. There are a number of related efforts to improve transit service and encourage transit ridership, including transit oriented land use development patterns.
72

Evaluating Mobility Management Strategies Victoria Transport Policy Institute
Case Studies and Examples Fewer Vehicles on Road as People Opt for Transit in Vancouver Vancouver Sun, August 30, 2004 The number of vehicles in the city of Vancouver has dipped slightly for the first time after a steady increase over a decade, according to official statistics. “There are some fundamental changes going on,” says David Baxter of the research firm Urban Futures. “It’s increasingly possible to live in Vancouver without a motor vehicle.” TransLink says ridership across Greater Vancouver on buses, SeaBuses and the SkyTrain rose by 9.5% in the first half of this year compared to the same period last year, and was 24.6% higher than 2002. Three times more people used buses (with 100.9 million boardings) than SkyTrains (with 32.4 million). “The numbers show that demand for public transit continues to grow in response to the significant expansion of services TransLink has introduced since it took over the system five years ago,” TransLink chair Doug McCallum said in a press release. 42% of people coming into the downtown core arrive on mass transit, while fewer people – only 47% – are coming into the area by car. Boulder Neighborhood Funds Transit Passes By Property Taxes (www3.ci.boulder.co.us) In November, 2000, residents of the Forest Glen neighborhood in the city of Boulder, voted to form a General Improvement District (GID) to provide RTD transit passes for all neighborhood residents. Any Forest Glen resident is eligible to receive an RTD Eco Pass, regardless of whether they rent or own a home. These passes are paid for by residents in the Forest Glen as part of their annual property tax. The RTD Eco Pass allows unlimited riding on all RTD buses and Light Rail including service to Denver International Airport and Eldora Mountain Resort Free Transit (www.iclei.org) In 1997, funding from the International Council for Local Environmental Initiatives (ICLEI) Transportation Solutions Grant Program allowed Missoula, Montana’s Mountain Line transit service to offer free summer fares to the town’s youths, and for everybody during monthly “Try A Better Way Days,” during an annual “Free Fare” week, and during periods of bad air quality. Transit ridership increased 66% from 1996 to 1997. Smart Card Transit Payment A smartcard is an electronic payment system that allows transit companies to easily handle a variety of fare options (single-trip fares, period passes, special fares) in an automated, user-friendly and cost efficient way. It allows fast and seamless multi-modal journeys across multiple transit systems with a common card, which can be readily expanded to also pay for parking, bicycle rentals and other conveniences not yet explored. Several North American cities have introduced smartcards, often in conjunction with new fare structures and discounts that improve system efficiency and increase ridership. The Ajax and Burlington Transit systems in the Toronto area were the first in North America (1991 and 1995 respectively) to implement contactless/proximity smartcards. They accommodate a variety of fare structures. Transit riders can use their smartcards to pay for individual fares, and/or to pay for accompanying multiple fares. Users can activate a 31-day pass at any time, rather than being restricted to a monthly pass. An important by-product of smartcards are the detailed data they can produce on ridership and use patterns. In 1997 the New York City transit system shifted from a token system to a smart card system called MetroCard, introduced free transfers between various transit modes and companies, a 10% bonus for purchases of $15 or more, other discounted payment options. This new fare structure substantially reduced the cost of many trips. In following years transit ridership increased about 30%, as illustrated below. One
73

Evaluating Mobility Management Strategies Victoria Transport Policy Institute
analyst explains, “Many current and potential transit riders are intimidated by the complexity associated with using multiple fare systems, and some are fearful of carrying cash. An integrated fare system using a single pre-paid card is expected to alleviate many of these concerns and give riders a simpler way to budget for transportation needs.” Figure 1 New York City Annual Subway Ridership (www.schallerconsult.com)
800
1,000
1,200
1,400
1991 1992 1993 1994 1995 1996 1997 1998 1999 2000
Ann
ual S
ubw
ay T
rips
(mill
ions
)
MetroCard and Integrated Fares
Introduced
Trend Line
This figure illustrates changes in transit ridership during the 1990s. Ridership began to grow substantially after the MetroCard system and integrated fares were introduced in 1997. Bus ridership (not shown) showed even stronger growth during that period. Youth Transit Pass (http://solstice.crest.org/sustainable/renew_america/wtgo99) In 1997 and 1998 the San Mateo County Transit District and the Utah Transit Authority teamed up to offer an innovative and highly successful program to encourage young people to ride public transit. The program is called the Summer Youth Pass. Purchase of the pass gives people under 17 unlimited access to transit service throughout San Mateo County in California and along an 80-mile corridor in Utah from June through August. Passes cost $25 each and are designed to look like a “dog tag”. In Utah, they receive a $5 discount if they purchase a pass with one or more friends through the Buddy Plan. In both states youth also receive coupons good for discounts or free products at local merchants. As an added incentive to youth, SamTrans provides a multimodal option by fitting all 317 SamTrans buses with bike racks. Through connections to Caltrain and BART, SamTrans also encourages and supports multimodal travel. In 1998, SamTrans sold 3,614 Summer Youth Passes. Passholders use their pass an average of 30 times per summer, resulting in substantial reductions in energy use and air pollution compared with automobile trips. The pass provides highly valued independence for teens, while at the same time reassuring parents as it gives teens access to a wide range of activities during the day when parents are generally unavailable to provide transportation. Suburban Luxury Bus Express Cleveland’s RTA provides express bus service between downtown and suburban park-and-ride lots. Special buses are used that have upholstered high-back seats that recline, individual reading lights and overhead storage racks on new city buses. The vehicles mark a considerable change from the plastic vandalism-resistant seats currently on many urban buses. These luxury features cost the agency an extra $100,000 per bus.
74

Evaluating Mobility Management Strategies Victoria Transport Policy Institute
Table 26 Transit Improvements and Incentives Summary
Sector Urban commuting, and some other travel. Impact (per participant) 10% automobile travel reductions are possible.
Take-Up 10% 20%, 30%, 40%, 50% Congestion Reduction Significant benefit (since urban-peak trips are targets) 3
Road and Parking Savings Significant benefit (since urban-peak trips are targets) 3 Traffic Safety Moderate benefit 2
Land Use Impacts Moderate to large benefit 3 Consumer Costs Moderate benefit 2
Transportation Options Large benefit 3 Equity Impacts Moderate benefit. Increases vertical equity. 2
Technical and Administrative
Small. Existing transit agencies can provide most services. -1
Public/Political Acceptability Broad political support, but opposition to increased subsidies. -2 Implementation Varies. Some measures require provincial, regional or municipal
support. Most require increased funding. Some can be implemented directly by transit agencies, others require support of provincial or local agencies, or businesses.
Basis for Estimates of “Impacts” and “Take-Up” Where it is applied, major transit improvements tend to reduce urban automobile travel by 5-15%. I assume it would be deployed on major urban corridors eventually representing 50% of regional destinations (weighted by trips).
Conclusions Transit service improvements are an important mobility management strategy, particularly in large urban areas. The Vancouver region has significant potential for increasing transit ridership, and has transit service improvement plans. However, current transit plans are limited by inadequate funding and various other barriers.
Action Options
• Provide federal funding for transit service improvements. Structure such funding to “leverage” additional provincial, regional and local funds. For example, provide 25% match for transit service improvements, with the requirement that provincial, regional and local governments to each provide an equal share.
• Sponsor research on cost-effective ways to improve transit service and encourage transit ridership.
• Help create tools for evaluating the full benefits of transit improvements. For example, sponsor research on best practices for comprehensive transit evaluation and planning.
• Develop cooperation among federal (Environment Canada, Transport Canada, Natural Resources Canada), provincial, regional and local agencies to support transit improvements.
• Help establish long-term transit funding.
• Consult with stakeholders to identify other federal actions to support transit.
• Allow transit improvements to qualify for air pollution reduction credits.
75

Evaluating Mobility Management Strategies Victoria Transport Policy Institute
High Occupant Vehicle (HOV) Priority High Occupant Vehicles (HOVs) include carpools, vanpools and transit vehicles. A number of approaches can be used to give HOVs priority over other traffic: • HOV highway and arterial lanes. These are sometimes reversible (or “counter flow” lanes),
which means they provide traffic capacity in the peak direction. Lanes open only to buses are called busways (WSDOT, 2001).
• High Occupancy Toll (HOT) lanes. These are HOV lanes that also allow low occupancy vehicles if they pay a toll.
• Queue-jumping lanes (other vehicles must wait in line to enter a highway or intersection, but HOVs enter directly).
• Intersection controls that give priority to HOVs. For example, a traffic light might be set to stay green for several extra seconds if that allows a bus to avoid stopping.
• Preferred parking spaces or parking fee discounts provided to rideshare vehicles. HOV priority give transit and rideshare vehicles a speed advantage under congested urban-peak conditions. HOV priority can result in mode shifting, and smoother traffic flow, reducing energy consumption and pollution emissions for HOVs. Building new HOV lanes tends to increase total roadway capacity, which may induce some additional vehicle travel. Converting existing lanes to HOV tends to provide the greatest mobility management benefits, but is more controversial.
Obstacles Only certain roadways are suitable for HOV lanes. There is often controversy about the efficiency and equity of HOV priority, particularly on HOV facilities that are not fully used. There are sometimes concerns about fraud and enforcement costs.
Current Status in the Vancouver and Fraser Valley Region The Vancouver region has several HOV priority routes, and there are plans to implement a few more. Some transit priority routes are being considered on regional highways such as Hastings, Georgia and Burrard Streets, and queue jumper lanes at some intersections. The following is a list of HOV priority facilities in the area.
• Westbound-southbound bus lane, Marine Drive interchange, north end of Lions Gate Bridge, North Vancouver.
• Eastbound-southbound queue jumper lane, Marine Drive interchange, north end of Lions Gate Bridge, North Vancouver.
• Route 7 westbound bus lanes, between Harris Road and Dewdney Trunk road, Pitt Meadows.
• Route 99 southbound bus lane, between Westminster Highway interchange and Steveston highway interchange, Richmond.
• Route 99 northbound bus lane, located at route 17/99/River Road interchange, Delta.
• Route 17 northbound bus lanes, between route 10 (Ladner Trunk Road) and route 17/99/River Road interchange, D.
76

Evaluating Mobility Management Strategies Victoria Transport Policy Institute
Case Studies and Examples Puget Sound HOV Expressways (www.wsdot.wa.gov/eesc/atb/atb/HOV/Titlepg.html) The Puget Sound region has more than 170 miles of HOV lanes on the region’s freeways. An additional 106 miles are in state and regional plans to complete the central Puget Sound Core HOV system, though funding currently is available only for some of the design work. Direct access ramps, which connect surface streets directly to an HOV lane, are being added to eliminate the need for HOVs to weave through traffic to reach the HOV lanes. The Washington State Department of Transportation (WSDOT) has been monitoring freeway vehicle occupancy since October 1989. Vehicles are counted and classified by occupancy at 56 sites. When combined with traffic counts and transit ridership data, these observations provide a good picture of the ability of the region’s freeway system to move people. Traffic volumes in the non-HOV lanes are several times higher than in the HOV lanes because each facility has several non-HOV lanes and only one HOV lane, but HOV lanes can move more people per hour. Average Car Occupancy (ACO) in non-HOV lanes ranges from 1.07 people per vehicle to 1.14 people per vehicle. The ACO for HOV lanes ranges from 2.09 people per vehicle to 2.76 people per vehicle, and most transit vehicles also use the HOV lanes. The chart clearly shows the people-moving ability of the HOV lanes. Houston HOV Lanes (www.hou-metro.harris.tx.us/hov.htm) Houston, Texas has 105 miles of HOV lanes. They move 96-228% more people per lane than general access lanes, and account for 5% of the travel by the workforce. HOV lanes can be used by buses, carpools, vanpools and motorcycles. On weekday mornings, HOV lane traffic moves toward Downtown (inbound). On weekday afternoons and evenings, HOV lane traffic moves away from Downtown (outbound). On some routes, minimum occupancy increases from two to three persons during peak periods. QuickRide, a pilot program started in 1998, allows carpools with two people per vehicle to use the Katy HOV during weekday peak periods for a fee. “Rolling on: System Lets Traffic Lights Wave Buses Through” (The New York Times, September 14, 2000, By Eric Taub) Thanks to new technology plus common sense, 70,000 bus commuters a day can now often outpace the drivers on nearby clogged freeways. Los Angeles County transportation officials managed to shave as much as 25% off the travel time of a local bus trip by adopting technology that, among things, can keep green lights on just a little longer as the bus approaches – as long as doing that does not cause another set of traffic problems. The regional authority decided to take action because a survey showed that speed was the biggest complaint of bus passengers. In just a few years, average bus speeds had declined 17%, to just 10 miles per hour. Buses spent half their time standing still, either at red lights or bus stops. The system gives express buses priority at traffic signals. A transmitter mounted on each bus sends a signal to traffic light controller. It extends the green light up to 10 seconds. The project has been successful so far. On the 16-mile Ventura Boulevard route, from Warner Center to Universal City, the average travel time has decreased by 25%, to 45 minutes from 1 hour. On the 26-mile route from Santa Monica through Beverly Hills to Montebello on the east side of the city, travel times have also dropped by 25%, to 1 1/2 hours from 2 hours. A trip across the San Fernando Valley into Union Station can now be done in about one hour, often faster than a car journey.
77

Evaluating Mobility Management Strategies Victoria Transport Policy Institute
Table 27 HOV Priority Summary
Sector Urban Commuting Impact (per participant) 10% automobile travel reductions are possible.
Take-Up 2%, 10%, 15%, 20%, 25% Congestion Reduction Significant benefit (since urban-peak trips are targets) 3
Road and Parking Savings Significant benefit (since urban-peak trips are targets) 3 Traffic Safety Small benefit 1
Land Use Impacts Small benefit. Encourages transit, but may increase sprawl. 1 Consumer Costs Moderate benefit 2
Transportation Options Moderate benefit 2 Equity Impacts Moderate benefit. Increases horizontal and vertical equity. 2
Technical and Administrative Moderate to large. -3 Public/Political Acceptability Modest public support. 1
Implementation Generally by provincial or regional transportation planning agency, in conjunction with transit agency and municipal governments. My require special funding. Priority parking can be implemented by businesses.
Basis for Estimates of “Impacts” and “Take-Up” Where it is applied, HOV priority tends to reduce vehicle travel by 5-15%. There are currently a few HOV priority routes in the region. I assume it would be deployed on major urban highways and bridges during peak periods, eventually representing roadways carrying 20% of regional commute travel.
Conclusions HOV priority can be an effective way to improve transit service and ridesharing under certain conditions, particularly if implemented in conjunction with other service improvements and employee trip reduction programs. It tends to be most effective at addressing urban-peak traffic problems.
Action Options
• Consult with regional transit and transportation planners to identify cost-effective HOV priority projects.
• Provide funding and other support for HOV priority, including the conversion of existing road lanes to HOV, and the development of transit priority intersection designs and traffic controls.
• Encourage relatively high standards for HOV lanes (e.g., 3+ or 5+) and adequate enforcement.
78

Evaluating Mobility Management Strategies Victoria Transport Policy Institute
Ridesharing Ridesharing refers to vanpooling and carpooling. Vanpooling uses vans that are usually owned by an organization (such as a business, non-profit organization or government agency) made available specifically for commuting. Carpooling generally uses participants’ own automobiles. Vanpooling is particularly suitable for longer commutes (25 kilometres or more each way). Carpooling that makes use of existing vehicle seats which would otherwise travel empty has minimal incremental costs. Vanpooling with 6 or more passengers in a vehicle is one of the most cost effective modes, since it carries more passengers per vehicle than a carpool and does not require a professional driver or empty backhauls like conventional public transit. There are several ways to support and encourage ridesharing, including providing rideshare matching and vanpool organizing services, marketing, commuter financial incentives and HOV priority.
Obstacles Ridesharing requires adequate support to provide services and coordination. Expanded ridesharing requires additional incentives, such as HOV priority on roadways and commuter financial incentives such as parking cash out.
Current Status in the Vancouver and Fraser Valley Region The Jack Bell Foundation (www.ride-share.com) provides vanpool and carpool services, including the provision of vans and cars. As of September 2004 there were 122 vanpool and carpool vehicles owned and operated by JBF, up from 91 in 2002.
Case Studies and Examples Commuter Connections (www.carpool.ca) Commuter Connections is a BC-based non-profit organization committed to reducing single-occupant vehicle travel through the promotion and implementation of rideshare programs. It has been particularly effective at implementing programs at colleges and universities. Metro Vanpooling Program (http://transit.metrokc.gov) Seattle’s Metro transportation agency provides ridematching services throughout the region and operates dozens of self-financing vanpools. Vanpool programs are a division of transit agencies. About 90% of vanpools are driven to worksites with mandatory commute trip reduction programs, which are required by state law. It is one of the most successful programs in North America, with more than 1,000 active vanpools serving 2% of commute trips and 7% of 20-mile-plus commute trips in the region. Despite this success, regional transportation planners believe that vanpooling can increase significantly (double or triple) and is one of the most cost-effective ways of addressing regional traffic congestion problems. The Washington Department of Transportation is currently sponsoring a Vanpool Marketing Plan which will identify ways to improve vanpool services and increase vanpooling in the region.
79

Evaluating Mobility Management Strategies Victoria Transport Policy Institute
CarpoolTool (www.carpooltool.com) CarpoolTool is a free, Internet-based ridematching system that uses city maps and postal code locations at home and work to help commuters find partners. Rideshare Online (www.RideshareOnline.com) RideShare Online is the first self-serve, regional public Internet ridematching service in the US. RideshareOnline.com instantly matches commuters with carpool or vanpool partners with a similar daily commute in nine Puget Sound area counties, including King, Pierce, Snohomish, Kitsap, Thurston, Island, Mason, Skagit and Whatcom counties. Users enter their commute starting point (either a home address or a nearby intersection) and work location. To preserve privacy, home addresses are not displayed. They enter their weekly work schedule and any daily variations. By return e-mail they receive a confirmation code to complete their registration. They can instantly see a list of rideshare matches to whom they may e-mail a rideshare request. “This new service puts the power into the hands of commuters,” said King County Executive Ron Sims. “Instead of sending in applications and information and waiting for a reply, you can go online anytime day or night to find names in our database of 9,000 registered commuters, e-mail them directly, and within minutes you could be hearing back from a potential rideshare partner.” Special Event Ridesharing King County Metro has incorporated special event ridematching into its regional rideshare program (www.rideshareonline.com). Seattle Center and the University of Washington are helping to promote the service in King County, hoping it will attract more attendees to events at their venues. To use the service, visit the website and select an event from a list that currently features more than 30 picks. Then, enter some basic information, including your name and home address or a nearby intersection. If others who live near you are also looking for a buddy for that event, their e-mail addresses will pop up. You can even check a map to see who’s attending and lives closest to your home. People then e-mail one another privately, screening potential buddies for the right match. In coming months Metro plans to launch a similar effort organizing rides to private events. In a region where traffic worsens by the year, the ability to go online and find a car pool fast can revolutionize the way people get around, according to Metro Planner Park Woodworth, or helped establish the program. The possibilities are endless, including business meetings, little League games, industry events, weddings. Neighbors on their way to the grocery could even get online to check whether a nearby senior citizen needs a lift, producing social benefits in addition to environmental and cost-saving benefits. Los Angles SmartTraveler (www.path.berkeley.edu/~leap/TTM/Ride_Matching) The ridesharing service allows users to obtain lists of potential ride matches, via touch-tone telephone. Users must pre-register, which entails giving some personal information, including their usual commute times and preferred pick-up and drop-off locations. Upon request, the system can call the people in the list and deliver a user-recorded message. The ridesharing materials were distributed to 68,000 people.
80

Evaluating Mobility Management Strategies Victoria Transport Policy Institute
Table 28 Ridesharing Summary Sector Commuting
Impact (per participant) 5-10% automobile travel reductions are possible. Take-Up 20%, 40%, 60%, 70%, 80%
Congestion Reduction Significant benefit (since urban-peak trips are targets) 3 Road & Parking Cost Savings Significant benefit (since urban-peak trips are targets) 3
Traffic Safety Moderate benefit 2 Land Use Impacts Mixed benefit. Can accommodates sprawl. 0
Consumer Costs Moderate benefit 2 Transportation Options Moderate to large benefit 3
Equity Impacts Moderate. Increases transportation options for low-income people. 2 Technical and Administrative
Requirements Small. Can be incorporated into transit or mobility management programs.
-2
Public/Political Acceptability General public support. 2 Implementation Generally implemented by transit agencies, local government
agencies, or a private organization with government funding.
Basis for Estimates of “Impacts” and “Take-Up” Where good ridesharing programs are offered, including carpool matching services and financially supported vanpool programs, 5-10% reductions in vehicle travel are possible. Some ridesharing programs already exist in the region, but their financial support is currently limited. Funding per trip is a small fraction of that provided for conventional public transit. I assume that significantly improved rideshare programs could be deployed quickly throughout the region, eventually offering services to 80% of regional employees (all except the most dispersed worksites).
Conclusions Ridesharing is a significant alternative mode which can be effective at reducing medium and long-distance commutes, and is particularly appropriate in areas that lack frequent transit service. There are a number of opportunities to encourage ridesharing, by improving ridesharing services, and implementing ridesharing incentives such as HOV priority and employee trip reduction programs. The Puget Sound region vanpool marketing programs can be a model for improving and expanding vanpooling in this region.
Action Options
• Consult with stakeholders (rideshare program operators, transit planners, employee trips reduction coordinators, transportation planners) to identify barriers and opportunities for increasing ridesharing in this region.
• Help establish and fund a regional rideshare development and marketing plan.
• Coordinate efforts to establish a single, regional ridematch database, or develop a protocol for data sharing among service providers.
• Increase rideshare program funding, including program administration, marketing and incentives.
• Fund vanpooling as a transit service, with operating subsidies if needed.
81

Evaluating Mobility Management Strategies Victoria Transport Policy Institute
Nonmotorized Transport Improvements and Encouragement There are many specific ways to improve nonmotorized transportation: • Improve sidewalks, crosswalks, paths, bikelanes and roadways. • Develop pedestrian oriented land use and building design. • Provide street furniture (e.g., benches and human-scale street lights). • Implement traffic calming, speed reductions and vehicle restrictions. • Implement safety education, law enforcement and encouragement programs. • Integrate walking and cycling improvements with transit. • Provide quality bicycle parking. • Address walking and cycling security concerns. According to some estimates, 5-10% of urban automobile trips representing 2-3% of total vehicle mileage can reasonably be shifted to non-motorized transport (Mackett, 2000). Walking and cycling improvements can leverage additional mileage reductions. Nonmotorized transport improvements support transit use and more accessible land use patterns, and a short walking or cycling trip often replaces a much longer automobile trip. Some pedestrian-friendly communities have 5-10 times as many nonmotorized trips as occurs in more automobile dependent communities, and 10-40% less automobile use. Shifts from automobile to nonmotorized transport are particularly effective at energy conservation and emission reductions because they reduce short motor vehicle trips, which have high per-kilometre fuel consumption and emission rates. Each 1% shift of mileage shifted from automobile to nonmotorized modes tends to reduce energy consumption and pollution emissions by 2-4%.
Obstacles Nonmotorized transportation improvements require new planning activities and responsibilities, such as coordination between public and private facility planners. Nonmotorized transport tends to be undercounted and undervalued in transportation planning and funding (Litman, 2003). Nonmotorized facilities receive less than 0.5% of provincial and federal transportation funds. Although bicycle advocacy groups have succeeded in increasing public support for cycling facilities there is no organized pedestrian lobby, although walkability improvements probably have even greater potential for reducing automobile travel.
Current Status in the Vancouver and Fraser Valley Region Nonmotorized transportation is promoted as part of various commute trip reduction and school transportation management programs, such as Go Green (www.gogreen.com). Most municipal governments regularly implement sidewalk and path improvements, and some have bicycle plans. For example, the city of Vancouver includes walking and cycling improvements in its strategic transportation plan (www.city.vancouver.bc.ca/engsvcs/transport/plan/2000progress).
82

Evaluating Mobility Management Strategies Victoria Transport Policy Institute
Examples and Case Studies City of Portland, OR (www.trans.ci.portland.or.us/Sidewalks_and_Pedestrians.html) The City has adopted a two-part pedestrian plan: Part One outlines the policies and plans for improving conditions for walking; Part Two is a detailed design manual for pedestrian facilities. The Portland Pedestrian Design Guide and Pedestrian Master Plan (www.trans.ci.portland.or.us) are outstanding pedestrian planning resources. It developed an excellent process for prioritizing pedestrian improvements, taking into account demand and current conditions. Washington State DOT (www.wsdot.wa.gov/hlrd/sub-defaults/pedestrian-default.htm) Washington State Department of Transportation adopted a Pedestrian Policy Plan in 1993 that focused on local and regional planning for pedestrians, necessary pedestrian facility types and locations, and who should pay for them. ODOT (www.odot.state.or.us/techserv/bikewalk) The Oregon Department of Transportation has established a comprehensive pedestrian and bicycle plan and design guidelines. Bike To Work Week Campaign (www.biketoworkvictoria.bc.ca) A Bike-to-Work-Week campaign is held annually in Victoria, B.C. In 2000 it included:
• A bicycle commuting contest with more than 200 teams at different worksites competing in various classes to see which can achieve the most bicycle commuters. All participants are eligible for prizes and drawings.
• A friendly contest between drivers and cyclists determines who gets the first cup of hot coffee at a downtown coffee shop without violating traffic rules.
• Free, bicycle skills training workshops for employees.
• An elementary school literary competition between bikes and cars. Cycling and driving parents leave the school at a specified time, travel to the downtown public library, check out a book and return to the school while following all the rules of the road. Students that estimate the closest time differences between the two modes are eligible to win great bike prizes.
• A Bike-to-Work-Week non-profit organization that plans and coordinates activities.
Go For Green (www.goforgreen.ca/home_e.html) Go for Green is a national non-profit, charitable organization encouraging Canadians to pursue healthy, outdoor physical activities while being good environmental citizens. It encourages active transportation (walking and cycling). It sponsors the Commuter Challenge (see below) and school transport management programs. Go For Green provides information and materials, including newsletters, report, case studies and merchandize (logo shirts and hats). Loaner Bicycles The Downtown Management Commission of Boulder, CO, has made available 100 bicycles and 50 helmets for residents and tourists; all that’s required is a credit card as a deposit. Champlain College in Burlington, VT, gives bikes to students who agree not to keep a car on campus. The Nabisco bakery in Buena Park, CA, gives new bicycles to employees who commute to work three out of five days for a six-month period. Those who commute on their own bikes are given $300, the cost of a moderately priced new bike. Ten percent of the plant’s 480 workers now commute regularly by bicycle, helping Nabisco satisfy the Los Angeles area’s anti-pollution rules.
83

Evaluating Mobility Management Strategies Victoria Transport Policy Institute
Table 29 Nonmotorized Transportation Improvement Summary
Sector Short (under 5 kms) personal trips Impact (per participant) 10% automobile travel reductions among short trips are possible.
Take-Up 20%, 35%; 50%; 60%; 70% Congestion Reduction Small benefit (primarily short, surface-street trips) 1 Road & Parking Cost
Savings Moderate benefit 2
Traffic Safety Mixed impacts. Provides health benefits. 0 Land Use Impacts Moderate to large benefit. Encourages infill development. 2
Consumer Costs Moderate benefit 2 Transportation Options Large benefit 3
Equity Impacts Large benefit 3 Technical & Administrative Moderate. Requires changing current planning and funding
practices, and ongoing funding. -2
Public/Political Acceptability General public support. May be opposition to some projects. 2 Implementation Varies. Usually requires changes to provincial, regional and
municipal transportation planning and funding. Some changes (particularly bicycle parking) are implemented by businesses.
Basis for Estimates of “Impacts” and “Take-Up” Where significant non-motorized transportation improvements and promotion programs are implemented, short-distant motor vehicle travel often declines 5-15%. Because fuel consumption and air emission rates are high for short trips, energy savings and emission reductions are about double these percentages (a 10% reduction in mileage provides a 20% reduction in emissions). Walking and cycling improvements are already being implemented in many parts of the region, particularly in the city of Vancouver and other urban centers. I assume that significant walking and cycling improvements could be implemented in areas with 70% of regional residents and employees.
Conclusions Nonmotorized transportation can help achieve mobility management objectives, both directly, and indirectly by supporting transit and creating more accessible communities. It is particularly effective at energy conservation, emission reductions, consumer cost savings, equity objectives, improved public health and community livability. The Vancouver region is implementing a variety of plans and projects to improve nonmotorized travel conditions and encourage nonmotorized travel.
Action Options
• Work with transportation and planning organizations to develop better methods for evaluating nonmotorized transport and the potential benefits of walking and cycling improvements.
• Survey stakeholders to identify barriers and opportunities to increase walking and cycling.
• Encourage local governments to create walking and cycling plans, and to integrate these plans with transportation, transit, land use and school planning activities.
• Use federal grants to leverage increased provincial, regional and local expenditures on walking and cycling facilities and programs.
84

Evaluating Mobility Management Strategies Victoria Transport Policy Institute
Telework/Flextime Telework involves the use of telecommunications to substitute for physical travel. This includes telecommuting, distance learning, and various forms of electronic business and government activities. According to some estimates up to 50% of all job categories involve tasks suitable for telework, but the actual portion of workdays suitable for telecommuting is much lower. Many jobs require access to special materials and equipment, or frequent face-to-face meetings, even if their primary output is information that can be transmitted electronically. Not all employees want to telework or have suitable home conditions. A portion of the reduced travel is often offset by additional vehicle trips teleworkers make to run errands; and because it allows employees to move further from their worksite, for example, choosing a home of job in a rural area or another city because they expect to be able to telecommute. Flextime means that employees may vary their work schedules, and in some cases compress their work week, such as four 10-hour days rather than five 8-hour days. Flextime allows employees to avoid congestion, reduce commute days, and accommodate transit and rideshare schedules, as well as providing other personal benefits.
Obstacles Increased telework and flextime may be limited to employer resistance, management practices that depend on physical contact and oversight of employees, and inadequate telecommunications equipment (such as lack of high-speed Internet connections in employees’ homes). Some employers may be unaware of how to implement telecommuting and flextime. Many jobs and employees are unsuitable for telework or flextime.
Current Status in the Vancouver and Fraser Valley Region Many employers in the Vancouver and Fraser Valley allow telecommuting and flextime, and increasingly government agencies and businesses offer telework and flextime options. They are promoted as part of employee trip reduction programs. There may be opportunities to encourage more telework and flextime further in the region, through promotion, policy changes and government agency examples.
85

Evaluating Mobility Management Strategies Victoria Transport Policy Institute
Examples and Case Studies Commuter Challenge Program (www.CommuterChallenge.org) The Commuter Challenge website has detailed descriptions of more than two-dozen Puget Sound area employers that offer telework. Each case study describes the type of employer, the policies and resources they offer, the program’s effectiveness, and feedback from administrators who manage the programs. Below is a list of participants that promote employee telework. Active Voice The Guardian Life Insurance Company of America AirTouch Cellular Hewlett-Packard Company City of Redmond Holland America Line Westours Inc. ConneXt KCTS Television DDB Seattle Seattle Housing Authority Davis Wright Tremaine LLP Washington Dental Service Electronic Data Systems Washington Mutual Frank Russell Company Washington State Department of Transportation Fred Hutchinson Cancer Research Center TRW TRW uses telecommuting throughout its offices and plants, including more than 1,000 employees in Orange County, California. The telecommuting program is governed by guidelines that identify the responsibilities of all groups and establishes ground rules for participating in the program. One issue for TRW, which does defense and aerospace work, is information access and security for telecommuters. To address these concerns the company developed enhanced local area network connections for telecommuters’ homes. The program has been well received by staff and management. Benefits include reduced stress, increased productivity and reduced vehicle travel. State of Arizona Telecommuting Program (USDOT, 1997) Arizona state agencies have allowed telecommuting since a pilot project was established in 1989. The program includes policies and information materials to promote telecommuting within all state agencies. The program has expanded, and has a goal that 15% of state agency personnel participate in some type of telecommuting. An evaluation performed in 1996 found: • Senior managers tend to be positive toward telecommuting, due to their perception of
increased work efficiency and productivity. • Supervisors were also supportive of telecommuting, due to the perception that telecommuters
have fewer disruptions and are better able to work during their peak performance times. Improved staff morale among telecommuters was also noted.
• Both telecommuters and non-telecommuting state employees indicated support for the
program, due to increased productivity, job satisfaction and flexibility. • A public opinion survey indicated general support toward telecommuting.
86

Evaluating Mobility Management Strategies Victoria Transport Policy Institute
Table 30 Telework/Flextime Summary
Sector Commuting, and some other trips. Impact (per participant) 7% automobile travel reductions are possible.
Take-Up (portion of sector participating)
20%, 40%, 50%, 60%, 70%
Congestion Reduction Moderate to large benefit. 3 Road and Parking Cost
Savings Moderate benefit 2
Traffic Safety Moderate benefit. 2 Land Use Impacts May encourage sprawl. -1
Consumer Costs Moderate benefit 2 Transportation Options Large benefit 3
Equity Impacts Tends to increase vertical equity by providing more transportation options for people who are transportation disadvantaged.
2
Technical and Administrative
Small to moderate. -2
Public/Political Acceptability General public support. 2 Implementation Implemented by employers. Supported by commute trip reduction
programs. Provincial and municipal governments can provide incentives and education programs, usually as part of overall mobility management programs.
Basis for Estimates of “Impacts” and “Take-Up” Where good telework and flextime programs are offered, 5-10% reductions in vehicle travel are possible. Many employers, businesses and government agencies already have telework programs, and these will probably expand in the future, but not as much as would occur with public support and incentives. I assume that significantly improved telework programs could be deployed quickly throughout the region, eventually applying to 70% of regional employees and services.
Conclusions Telework and flextime are important transportation options that can be effective at reducing certain types of physical travel, including commuting, personal errands and work. They are particularly effective at reducing urban-peak travel, but a portion of this reduction may be offset by additional off-peak and non-urban travel, reducing the energy conservation and air emission reduction benefits. Telework and flextime are increasingly common and are being promoted by a number of organizations.
Action Options
• Sponsor research on the travel impacts of telework and flextime.
• Develop a national telecommunications plan that helps create suitable infrastructure for telework.
• Promote telework and flextime for federal employees and federally-sponsored organizations and projects.
87

Evaluating Mobility Management Strategies Victoria Transport Policy Institute
Land Use Management Land use management strategies such as smart growth, new urbanism and location-efficient development can reduce per capita automobile use, transportation energy use and emissions by improving accessibility and transportation options. This involves changing development patterns to increase density and clustering, land use mix, roadway connectivity, transit accessibility and service quality, and nonmotorized travel conditions. Smart growth tends to refer to these design principles applied at a regional scale, new urbanism refers to local and street scale application, and location-efficient development refers to street and site scale application, but these scales significantly overlap. Figure 2 Average Daily Trips Per Resident by Geographic Area (National Personal Transportation Survey, US Bureau of Transportation Statistics, 1995)
0
1
2
3
4
5
Rural Suburban Tow n Urban Average
Ave
rage
Dai
ly T
rips
Per R
esid
ent
OtherWalkBicycleTransitAuto Passenger
Auto Driver
Urban residents drive less and use transit, cycling and walking more than elsewhere. US Data. Residents of communities based on these concepts tend to drive 20-40% less than otherwise comparable residents of automobile-dependent communities, as illustrated in Figures 2 and 3 (also see “Land Use Impacts on Transportation,” VTPI, 2002). Figure 3 Average Daily Trips Per Household (Friedman, Gordon and Peers, 1995)
0
2
4
6
8
10
12
Suburban TraditionalAve
rage
Dai
ly T
rips
Per H
ouse
hold
WalkBicycleTransitAuto PassengerAuto Driver
Vehicle trips per household are significantly lower in traditional urban communities.
88

Evaluating Mobility Management Strategies Victoria Transport Policy Institute
These can be achieved through changes in (SGN, 2002):
• Zoning laws – to allow higher density, clustered, mixed land use and reduced parking supply.
• Planning practices – to encourage higher density, infill development.
• Public funding incentives – to encourage infill development.
• Cost-based development fees and utility funding – to encourage infill, clustered development.
• Urban growth boundaries and greenspace protection policies.
• Location of public facilities and services to support infill development and clustering.
• Transportation planning and investments that favor higher-density, infill development. These reforms can provide several benefits, including reduced impervious surface (providing more greenspace, lower stormwater management costs, and reduced heat island effects), more affordable development, and more attractive communities. Increased density tends to reduce total per capita emissions, although it increases emissions per hectare, and may increase exposure to local emissions such as carbon monoxide, particulates and noise.
Obstacles Land use management strategies require new responsibilities and relationships for transportation agencies. There is often public resistance to infill development. Land use management benefits tend to be dispersed and long-term, while costs are up-front and direct (such as reduced development options for land owners, and additional construction costs). There tends to be relatively little funding for land use management programs.
Current Status in the Vancouver and Fraser Valley Region There are currently several efforts to implement smart growth land use policies in the Vancouver region, particularly by the GVRD and some jurisdictions, but they are not universally supported by provincial or municipal policies. Although Agricultural Land Reserve (ALR) policies limit urban expansion in some areas, other smart growth policies, such as location-based development fees, utility fees and tax structures, have not been applied in this region.
89

Evaluating Mobility Management Strategies Victoria Transport Policy Institute
Examples and Case Studies Who is the Smart Growth Leader? It’s not Portland (www.mlui.org/growthmanagement) Portland, Oregon is a success story among mid-sized American cities. Its downtown grew more vibrant over the last two decades, attracting new residents and businesses at a time when many other cities were drying up. At the same time, its pioneering growth boundary — in place since the mid-1970s — limited sprawl while protecting farmland and open space. So it’s no surprise that planners flock to Portland for good ideas about how Smart Growth policies help a city. But what about Portland’s own planners? Where do they look for new ideas? The answer: Vancouver, British Columbia, the Pacific Northwest’s uncontested leader in Smart Growth. Vancouver’s metropolitan area consumes less land per person. Its transit system is more widely used. And its downtown renaissance is more profound than any other city in the region. Thousands of new residents have flocked to pedestrian-friendly neighborhoods, such as the fashionable high-rise districts in Vancouver’s West End and Yaletown neighborhoods. And many of greater Vancouver’s transportation policies focus on improving transit, and creating new bike and walking paths rather than widening roads and bridges for cars. Vancouver’s success is not just anecdotal; it’s confirmed by numbers. International research suggests that public transit flourishes when urban density exceeds about twelve people per acre. In greater Vancouver, 62% of residents live in areas with such “transit-friendly” densities, up from 51% a decade ago. In greater Portland the figure is just 24%, up from 19% in 1990 – a sizable gain but still far below Vancouver. And because more than one in ten greater Vancouver residents live in neighborhoods with more than 40 people per acre, pedestrians, bikers, and public transit dominate the streets. Automobiles are the alternative form of transport. How did Vancouver achieve such remarkable success in directing growth to people-friendly, land-saving neighborhoods? Many factors are responsible, some of which have more to do with geography than good planning. The city is hemmed in by water to the west and mountains to the north. Vancouver’s growth can only radiate east and south, limiting the land available for sprawl. Far-seeing public policies played a role as well. Although greater Vancouver doesn’t have an urban growth boundary like Portland’s, it has something even stronger. In the 1970’s British Columbia created an Agricultural Land Reserve that put farmland around the metropolitan area off limits to residential development. At the time, the reserve was viewed principally as an agricultural safeguard that protected fertile farmland in a mountainous province with little arable land to spare. But over time, the biggest benefits are felt in urban planning because developers had to learn to do more with less land. Greater Vancouver’s other saving grace is that unlike most American cities it never built an extensive system of freeways. The city considered them, but ultimately rejected the idea. It’s a good thing, too. Three hours to the south, Seattle’s interstates have sapped vitality from center city, spread new residents across former farmland and open space, and left motorists stranded in some of the worst gridlock in North America. That’s not to say that Vancouver has no congestion. The city, though, has managed to work with traffic congestion rather than against it by offering alternatives to the automobile, including buses and light rail, as well as a growing network of bike trails. The city’s thriving neighborhoods have not only helped transit flourish but have had a surprising effect on traffic: On Vancouver’s downtown peninsula, where densities are highest, car movements declined by 12% between 1994 and 1999 while walking increased by more than 50%.
90

Evaluating Mobility Management Strategies Victoria Transport Policy Institute
Several British Columbia communities are implementing Alternative Development Standards (www.marh.gov.bc.ca/GROWTH/NOV1996/alt.html): • Kelowna’s Kettle Valley is the first of three new neighbourhoods to be developed in a
community village concept. In the first neighbourhood, 1,028 residential units will be focused around a 50,000 square-foot neighbourhood commercial centre. The project developer and designer, in working with the city, have created a ‘neotraditional’ neighbourhood which encourages pedestrian traffic over cars and focuses activity in a centralized commercial area. “There are a lot of ‘firsts’ for Kelowna with this project,” said Hazel Christy, Kelowna’s Manager of Special Projects. “We have created a new, comprehensive development zone based on the neighbourhood village concept.” Other features include a seniors’ residential and care centre, residential units above the mixed use commercial area, reduced building setbacks and hillside development.
• The Regional District of Nanaimo (RDN) proposes to use ADS to achieve densified village cores in Lantzville and Cedar Village and to create village centres in the Shaw Hill - Deep Bay area. The goal is to create urban enclaves within rural areas while limiting urban sprawl. “Our basic philosophy is to accommodate growth in denser communities and not waste the land we have,” said Electoral Area Director Bob Jepson. The Lantzville community plan uses what Jepson calls “modern tools” for planning: density bonusing, promoting residential uses above commercial development and discouraging large-lot subdivisions in favour of smaller lots. In addition, to meet the need for seniors’ housing, the area is proposed to accommodate townhomes and a care facility. Jepson believes public education and involvement are vital to elicit community support and the RDN has held round-table discussions with groups in the area. “We try to educate rather than legislate,” he said.
• Salmon Arm, with its population of 16,000, is a growing community that has incorporated many ADS into its goal of achieving compact communities. “Our community had been allowed to develop through the creation of subdivisions literally miles from each other,” said Salmon Arm Mayor Ian Wickett. “It was really a necessity to implement a different planning approach that was more cost-effective.” Council divided Salmon Arm into four development areas and started by densifying the downtown area to maintain “a living core to the community.” “We still have a downtown that people shop in,” said Mayor Wickett. He added that the development of mixed-use housing in the past few years, including rental housing, has proved to be very popular.
• Surrey’s Clover Valley Station - a partnership development - is a compact-lot neighbourhood of 215 affordable detached homes. The subdivision is pedestrian-friendly with homes situated on lots with narrow frontages and minimal side yards. Car access is from rear lanes. The homes provide an affordable and popular choice for home buyers who prefer fee simple ownership to strata title. Council has approved in principle an additional 335 compact lots at Clover Valley Station. The first phase of Panorama Village, another compact community with average lot sizes of 2,400 square feet, is also underway in Surrey. “In both projects, application of neo-traditional design creates a sense of spaciousness between the small lots, and the clustering of houses has created significant open spaces, preserving valuable views,” said Surrey Mayor Bob Bose.
91

Evaluating Mobility Management Strategies Victoria Transport Policy Institute
Location-Based Development Fees (www.newrules.org/environment/lancaster.html) The city of Lancaster, California has development impact fees that reflect the infrastructure costs of a particular location, calculated by a civil engineering firm. A typical new house located near the city core is charged $5,500, while the same house located one mile beyond the core would be charged $10,800, reflecting the additional costs of providing more dispersed city infrastructure. Since this fee structure was implemented in 1993, no new development has occurred outside the central core. The result is a system that discourages sprawl, promotes a more cohesive and orderly development pattern, and supports downtown businesses. These fees only represent a portion of the total public costs that increase with more dispersed development (costs of school busing and utility maintenance are not included), so even greater land use changes would probably occur if other costs were efficiently priced. Charlotte (NC) Sacks Cul De Sac According to an October 18th story in the Charlotte Observer, “The reign of the cul-de-sac ended Wednesday, with a unanimous vote of the Charlotte City Council.” Under a change in the subdivision ordinance, the dead-end circles so common in suburbia can be constructed only when geographic barriers prevent street connections. Though existing cul-de-sacs won’t be affected, the idea, city planners and politicians say, is to alleviate traffic by better linking future communities. “Charlotte went cul-de-sac happy in the 1970s and 1980s,” said Mayor Pat McCrory. “We failed to develop a grid system of roads and now we have gridlock.” The case against cul-de-sacs is the way they limit access to and from neighborhoods. Frequently, subdivisions of cul-de-sacs have only one or two connections to an adjacent road. When cul-de-sac communities are lined up along that road, it clogs with drivers who have no alternative route. Planners note that traffic flows better in and around neighborhoods such as Myers Park, built in the early 20th century on a grid system that gives drivers more choices.” Palo Alto Zoning Ordinance Update (www.city.palo-alto.ca.us/zoning) The city of Palo Alto, California has embarked on a zoning ordinance update to support New Urbanism and Smart Growth. This process included extensive research and publication of issue papers, and public consultation to create zoning codes that reflect the city’s transportation and land use development objectives. Toronto Policies for Land Use Intensification (www.movingtheeconomy.ca) Toronto has several examples of how design and policies for streetscape, public art and open space improvements which support intensification can encourage business and boost the economy, quality of life and pride of a city. City Patterns, an inventory and analysis of Toronto’s physical form and structure, describes the City through a series of 44 maps. This work has promoted a common understanding of the form of the city. Toronto’s official City Plan has a strong focus on the physical form of the city. It assumes that new development will build upon and reinforce Toronto’s current strengths in this regard. Street Hierarchy is a classification system developed to facilitate decision making for street-scape improvements. This hierarchy is unique in North America because it is not based on transportation capacity but rather on the cultural and civic role of streets. Finally, the City’s Streetscape Manual is a guide for the development and implementation of both public and private sector streetscape improvements based on the street hierarchy, including detailed drawings and specifications on paving, lighting, tree planting and street furniture by street and by district. Public sector initiatives have positioned the City to lead by example, and added leverage to negotiating with the private sector for similar improvements. Privately funded improvements result from rezoning and site plan approval requirements which prescribe sidewalk and open space improvements as a part of a private sector development.
92

Evaluating Mobility Management Strategies Victoria Transport Policy Institute
Metro Planners Get New Tool For New Urbanism Projects (www.nashville.gov/mpc) Nashville Metro planning agency has a new tool to help create traditional neighborhoods following the New Urbanism style, called Transect - a guidance and analysis tool for creating a vibrant neighborhood. “Our goal is to proved housing, transportation and development choices for different needs and life stages,” says Planning Director Rick Bernhardt. “To do so fairly and equitably, we must level the regulatory playing field and make it just as easy to develop a community with mixture of retail, restaurants, town homes and single-family homes as it is to build the conventional, single-use subdivision.” Until now, it usually took up to six months longer to plan for a development incorporating New Urbanism than for conventional developments. “It’s common to think of each community as having an urban core in the center with each of the subsequent zones around it, like a fried egg,” Bernhardt said. “But in fact, the zones are usually mixed throughout a community. The key is that the zones must be internally consistent for a successful town.” Transect consists of six zones (T1-T6) — natural zone, rural zone, suburban zone, neighborhood zone, urban center zone and urban core zone – and a district zone that serves for a specific single use such as industries, universities and airports. The Transect is a guidance and analysis tool, which identifies the necessary elements for a vibrant neighborhood. Fannie May LEM Programs (www.locationefficiency.com) Seattle Mayor Paul Schell introduced the Location Efficient Mortgage Initiative, a program that increases homebuyers’ purchasing power in more accessible neighborhoods. The pilot program, the first of its kind in the U.S., soon will be launched in Los Angeles, San Francisco and Chicago. “We’re in the American Dream business,” said Heyward Watson, director of Fannie Mae’s Puget Sound office. It’s a well-known fact, however, that attaining that dream in Seattle and King County has become increasingly more difficult.” Since 1990, the median cost of a house in Seattle has risen from $138,000 to $223,000, and countywide the median price has increased from $140,000 to $215,000. According to county statistics released Tuesday, homebuyers making 80% of median income -- about $48,560 for a two-person household -- could afford only 8.5% of the single-family homes available in the county last spring. To give Seattle homebuyers more leverage, the Location Efficient Mortgage Initiative rewards homebuyers with larger loans than they normally would qualify for and lower downpayments. In return, Fannie Mae and the city will request that participants own one car or less per household and live within a quarter mile of a bus line or half a mile from a train or light rail system. The initiative will also offer discounted annual bus passes for one member of the household. “We want to encourage home ownership and fewer trips in the car,” Schell said. “As Seattle’s housing prices escalate, we need to be creative to encourage affordability.” The program works by assigning values to each Seattle home based on residential density, amenities such as shopping, and access to public transit. Homes in neighborhoods with fewer amenities and less transit access are assigned a lower “location efficient value” than areas which have more amenities and greater transport access. A family earning $60,000 a year would qualify, under traditional mortgage underwriting guidelines, for a $143,000 home. But if the family gives up one car, their annual savings would be $3,200, according to a city-commissioned study. Because of that savings, Continental Savings Bank would extend the family’s credit by $17,800 toward the purchase price of a $160,700 home.
93

Evaluating Mobility Management Strategies Victoria Transport Policy Institute
Table 31 Land Use Management Summary
Sector All travel Impact (per participant) 10-30% per capita travel reductions are possible.
Take-Up 20%, 30%, 40%, 50%, 60% Congestion Reduction Mixed. Tends to increase congestion intensity but reduce per capita delay. 1
Road and Parking Savings Moderate 2 Traffic Safety Moderate to large 2
Land Use Impacts Large 3 Consumer Costs Reduces transport costs, but some development costs may increase. 1
Transportation Options Significant benefits. Improves accessibility for non-drivers 2 Equity Impacts Varies. Can provide horizontal and vertical equity benefits. 2
Technical and Administrative
Moderate. Must overcome institutional inertia, such as changing current planning and funding practices.
2
Public/Political Mixed. 0 Implementation Federal, provincial and municipal legislative and policy changes to
development, investment and tax policies; changes to zoning codes and transport planning; educate planners and designers about best practices.
Basis for Estimates of “Impacts” and “Take-Up” Where smart growth land use is implemented, per capita vehicle travel reductions of 10-30% are typical. Many regional communities have some smart growth features, such as neighborhood shops and clustered employment centers, but more could be done to encourage more mixed land use, infill redevelopment, jobs/housing balance and compact development. These changes are relatively slow to implement. I assume that currently, 20% of regional residents and businesses are located in smart growth communities, and with aggressive policies this could increase to 60% over 20 years.
Conclusions Smart growth land use management can make a significant contribution to transportation energy conservation and emission reductions, particularly over the long run. There are several smart growth programs in the region, but there may be additional opportunities to help support smart growth policies.
Action Options
• Sponsor research on the relationships between public policies, land use development patterns, travel behavior and transportation energy use/pollution emissions.
• Sponsor research projects and contests to develop high quality urban designs that address concerns about higher-density, mixed use, infill development.
• Select federal infrastructure grants that support smart growth.
• Make federal infrastructure grants contingent on provincial and local land use policy reforms, such as zoning codes that favor infill development, flexible parking requirements, utility pricing that rewards clustered development, infill school siting, etc.
• Locate federal facilities (e.g., offices and service centers) to support smart growth objectives.
• Reform tax policies to correct biases that favor greenfield over infill development, such as more favorable tax treatment of new construction over renovation of existing buildings.
94

Evaluating Mobility Management Strategies Victoria Transport Policy Institute
Carsharing and Alternative Vehicle Ownership Options Carsharing refers to automobile rental services intended to substitute for private vehicle ownership. It makes occasional use of a vehicle affordable while providing an incentive to minimize driving and rely on alternative travel options as much as possible. Carsharing is a middle option between having no vehicle and owning a private automobile. It requires these features:
• Accessible (i.e., located in or near residential neighborhoods).
• Affordable (reasonable rates, suitable for short trips).
• Convenient (vehicles are easy to check in and out at any time).
• Reliability (vehicles are usually available and have minimal mechanical failures). Carsharing is common in Europe, and is being developed in some North American cities. Carsharing services are provided either by for-profit firms or non-profit cooperatives. Station cars are vehicles rented at transit stations for travel between terminals and local destinations. This supports transit use, particularly in suburban areas where destinations are too dispersed for convenient pedestrian access. Because they are intended for short trips, station cars can employ small, alternative fuel vehicles, such as battery powered electric cars. Other vehicle sharing strategies are possible. One proposed system would allow vehicle owners to identify when and where their vehicles are available (for example, at home or at worksites) through a matching service. Registered customers could rent the vehicle during those times, with access automatically controlled by an electronic key or pass code, and payments made from user’s to vehicle owner’s account. Travel time and distance could be recorded manually or by special meters installed in participating vehicles. By allowing households to reduce their vehicle ownership while increasing variable costs, carsharing tends to reduce per capita vehicle mileage by participants, although the magnitude of travel reductions varies depending on demographic and geographic factors. Carshare members who would otherwise not own an automobile may increase their vehicle use. Participant surveys indicate mileage reductions of 30-60% are common.
Obstacles A major barrier is the need to establish and maintain a critical mass of users (typically 30 members or more) in individual neighborhoods. Carsharing cannot develop until enough potential users in each area are familiar with the concept, understand how it can benefit them, and are willing to commit themselves to a Carshare organization. This often requires education and marketing. Carshare organizations often require seed money to become established.
95

Evaluating Mobility Management Strategies Victoria Transport Policy Institute
Current Status in the Vancouver and Fraser Valley Region The Co-operative Auto Network (CAN, www.cooperativeauto.net) is a not-for-profit car sharing organization in Vancouver, established in 1996 with government support. It currently has about 55 vehicles and 1,000 members located in several urban neighbourhoods. CAN has vehicles available at Edmonds and Metrotown Skytrain stations for convenient use by transit riders.
Examples and Case Studies North American Carsharing Organizations The Carsharing Network (www.carsharing.net) identifies several established Carsharing organizations in North America and Europe. The table below summarizes some operating North America carshare organizations. Most North American Carsharing organizations rely on grants to provide administrative support during the startup period. User fees fund all vehicle costs and an increasing portion of administrative costs over time. Only CommunAuto has become entirely self-funding. Table 32 Carsharing Organizations
Organization Website Established Membership Vehicles CommunAuto (Quebec) www.comunauto.com 1995 750 40 Carsharing Portland www.carsharing-pdx.com 1998 231 14 AutoShare (Toronto) www.autoshare.com 1998 225 15 Cooperative Auto Network (Vancouver, BC)
www.cooperativeauto.net 1997 450 24
Victoria Car Share (Victoria, BC)
www.vvv.com/~carshare 1997 40 4
Flexcar (Seattle) www.flexcar.com 1999 350 12 Zipcar www.zipcar.com 2000 650 37 Smart Moves www.smartmoves.co.uk City Carshare www.sfcarshare.org 2001 250+ 4+ Intermodal Mobility Operation Systems
www.raillink.ch 2001
Automatic Transit Collection
www.easyride.ch 2000
Car Modal – New Service For Organised Private Car Transport (www.tellus-cities.net) This project will develop and demonstrate new vehicle use and ownership options, including carsharing, dynamic ridematching and collective taxi services using cell-phone and computer technology. This will enable travellers to match vehicles and travelers to specific destinations, with payment using direct cash transfer via cell-phone. This pilot project involves: • Designing the overall system. • Developing hardware and software for data and billing. • Building a customer organisation. • Marketing • Integration with public transport and traffic management centres.
96

Evaluating Mobility Management Strategies Victoria Transport Policy Institute
Table 33 Carsharing Summary
Sector Personal vehicle travel. Impact (per participant) 30-50% mileage reductions by participants.
Take-Up (portion of sector participating)
Likely to increase, but unlikely to exceed 5% of total regional residents, representing 3% of total regional travel. 1%, 2%, 3%, 4%, 5%
Congestion Reduction Small benefit (few regular automobile commuters would choose this option).
1
Road and Parking Cost Savings
Moderate benefit 2
Traffic Safety Moderate benefit 2 Land Use Impacts (“Smart
Growth”) Moderate benefit 2
Consumer Costs Moderate to large benefit. Increases automobile affordability. 3 Transportation Options Moderate to large benefit. 3
Equity Impacts Horizontal and vertical equity. 2 Technical and
Administrative Requirements
Small to moderate. 2
Public/Political Acceptability
Moderate to large popular support for optional service. 2
Implementation Uncertain what additional public policy could increase take-up.
Basis for Estimates of “Impacts” and “Take-Up” Carsharing tends to significantly reduce participants’ vehicle travel, often by 30-50%. However, the portion of regional residents who are likely to choose carsharing instead of owning a personal automobile tends to be small, even where excellent carshare programs exist, perhaps representing 10% of households in denser urban neighborhoods, and about 5% of total regional households, and since these are lower-annual-mileage households, mileage reductions will total about 3%.
Conclusions Carsharing and other vehicle sharing programs can help reduce the need for personal vehicle ownership, which can provide benefits to consumers as well as reducing per capita vehicle travel. Because it requires a critical mass of users within convenient walking distance of vehicles, this strategy is most effective in higher-density urban areas where the benefits of traffic reductions are greatest.
Action Options
• Work with existing carsharing organizations to overcome obstacles and expand service.
• Provide incentives for automobile rental companies to locate offices in residential areas and offer short-term (hourly) rates.
• Work to integrate carsharing with new development and public transit stations.
97

Evaluating Mobility Management Strategies Victoria Transport Policy Institute
Car-Free Planning and Vehicle Restrictions Car-free planning and vehicle restrictions can reduce vehicle use, energy consumption and emissions if widely implemented in conjunction with other mobility management strategies. This can include:
• Developing urban districts (such as a downtown or residential neighborhood) where personal cars are unnecessary and vehicle traffic is restricted. Such restrictions can be part- or full-time and include exceptions for delivery vehicles, taxis, and vehicles for people with disabilities.
• Housing developments where residents are discouraged from owning private cars.
• Pedestrian-oriented commercial streets where driving is discouraged or prohibited.
• Resorts and parks that encourage or require non-automotive access.
• Car-free days and car-free events.
• Temporary restrictions on driving, such as during an air pollution emergencies or a major sport event that would otherwise create excessive traffic problems.
If applied on a small scale, such as a single street or commercial centers, they may simply shift when and where driving occurs. Some types of vehicle restrictions, such as no-drive days based on license plate numbers, are used during extreme air pollution emergencies, but are probably not effective as long-term strategies (some households will purchase a second car to use during their regular vehicle’s no-drive days, or rely on taxis).
Obstacles Carfree planning and vehicle restrictions are only appropriate under certain conditions. There tends to be significant public opposition to vehicle restrictions.
Current Status in the Vancouver and Fraser Valley Region Some organizations in the region promote carfree events, but there are currently no major carfree developments or plans for vehicle restrictions in the region.
Examples and Case Studies European Cities Limit Cars (www.carfree.com) Many European cities prohibit personal automobile travel in their city core. Amsterdam is implementing programs to significantly reduce automobile use through a combination of restrictions on parking and road access matched with improvements in pedestrian, cycling and public transit services. This program was endorsed by a public referendum. European Car Free Day (www.eta.co.uk) Ten local authorities in Britain, including five London boroughs (Camden, Lambeth, Merton, Southwark and Sutton) are participating in European Car Free Day In Town, Without My Car! on 22nd September 2000, closing town centre streets to motor traffic. European Car Free Day is intended to give people the opportunity to experience the benefits that traffic reduction can bring to their own town and city centres. It is co-ordinated in Britain by the Environmental Transport Association, a motoring organisation which campaigns for greener transport.
98

Evaluating Mobility Management Strategies Victoria Transport Policy Institute
Road Diets Support Local Economic Development (Burden and Lagerway, 1999) Several sets of roads in Florida (Atlantic Boulevard in Del Ray Beach, and another couplet of main street streets in West Palm Beach County) went on 4- to 3-lane and 4- to 2-lane reductions on the Main Street roads. In each case the businesses did much better once the roads were made more attractive and speeding was reduced. The Atlantic Beach treatment was so successful that it is being extended another 10 blocks. In Ferndale, Michigan, a 4-lane was converted to a 2-lane on their very busy main street. Before the transition most businesses had either failed or were operating out of the alley. Following the conversion there has been a major return of shoppers. The treatment is being extended. Table 34 Car-Free Planning Summary
Sector Local Street Travel Impact (per participant) Varies. Perhaps 10% reduction in average per capita vehicle travel
where applied.
Take-Up (portion of sector participating)
Likely to be slow, since the most effective strategies involve land use changes (i.e., Carfree Housing). 0, 4%, 6%, 8%, 10%
Congestion Reduction Small benefit. If implemented on a small scale may shift congestion rather than reduce it overall.
1
Road and Parking Cost Savings Small benefit, depending on program and scope. 1 Traffic Safety Small benefit, depending on program and scope. 1
Land Use Impacts Small benefit, depending on program and scope. 1 Consumer Costs Small benefit, depending on program and scope. 1
Transportation Options Large benefit. 3 Equity Impacts Small benefit. Tends to reduce externalities and improve mobility
options for non-drivers. 1
Technical and Administrative Varies, depending on program and scope. -2 Public/Political Acceptability Varies, depending on program and scope. -1
Implementation Generally by municipal governments. Can be supported by provincial funding and policies.
Basis for Estimates of “Impacts” and “Take-Up” Where carfree planning is implemented, including carfree housing and pedestrian-oriented commercial centers, 5-15% reductions in vehicle travel are possible. I assume that with aggressive implementation, 10% of residents and businesses could be located in carfree areas after 20 years.
Conclusions Carfree planning and vehicle restrictions can support other traffic and land use management strategies that reduce motor vehicle use. However, if poorly planned or implemented they may fail to achieve their objectives and create new problems due to unintended consequences.
Action Options
• Support transport and land use planning reforms that allow carfree planning to be implemented where appropriate and supported by local communities.
• Help fund pilot projects and urban redevelopment that includes carfree planning and vehicle restrictions.
99
Evaluating Mobility Management Strategies Victoria Transport Policy Institute
Traffic Calming and Roundabouts Traffic calming includes a variety of roadway design features that reduce vehicle traffic speeds and volumes. The energy and emission impacts depend on project design and conditions. Some traffic calming strategies result in smoother traffic and more optimal speeds, reducing energy consumption and emissions. In particular, modern roundabouts that replace stop signs and traffic signals can improve traffic flow. Other traffic calming strategies increase stop-and-go driving and reduce traffic speeds below optimal vehicle efficiency (i.e., below 20 mph), and so may increase per-kilometre vehicle energy consumption and emissions. Impacts on per capita energy consumption and emissions depend on whether Traffic Calming reduces total vehicle travel by making alternative modes and more central urban neighborhoods relatively more attractive.
Obstacles Traffic calming requires planning support and funding. It is only appropriate under certain circumstances. There is sometimes opposition to traffic calming.
Current Status in the Vancouver and Fraser Valley Region The city of Vancouver is a leader in traffic calming implementation (www.city.vancouver.bc.ca/engsvcs/transport/calming.htm). Other local jurisdictions are also implementing traffic calming projects, particularly in residential areas. ICBC helped finance such projects in the past, but funding has declined.
Examples and Case Studies Seattle Traffic Calming (www.usroads.com/journals/rmej/9801/rm980102.htm) The City of Seattle, Washington has implemented more than 700 traffic circles on residential streets and adds dozens more each year (Mundell, 1998). It has a standard process for residents to request Traffic Calming, and various funding sources (Seattle, 1996). The response has been positive: there are hundreds of requests each year for more Traffic Calming projects, and although devices can be removed if residents are unhappy with the final result, this has only happened once. Community Planning Charrettes (www.walkable.org) The organization Walkable Communities has participated in dozens of community planning charrettes, in which residents and experts work together to design and organize roadway improvements, many of which include Traffic Calming. Home Zones (www.homezonenews.org.uk) The British government has developed policies to allow highway authorities to designate streets as “home zones,” residential streets with limited traffic speeds. Within these zones, street activity, including play, will be lawful. Design speeds will be less than 20mph - probably 10mph. Signs will be posted at the area edges to indicate their special status. Designs will include shared surfaces (no curbs), landscaping and play equipment. The federal government will distribute funding to local agencies for planning and implementation.
100

Evaluating Mobility Management Strategies Victoria Transport Policy Institute
Table 35 Traffic Calming Summary
Sector Local vehicle travel Impact (per participant) Small. 5% reductions in local street vehicle traffic are possible,
more if combined with other strategies such as Smart Growth.
Take-Up (portion of sector participating)
10%, 20%, 30%, 40%, 50%
Congestion Reduction Mixed. 0 Road and Parking Cost Savings Minor benefit 1
Traffic Safety Major benefits 3 Land Use Impacts Major benefit 3
Consumer Costs Mixed 0 Transportation Options Moderate benefit 2
Equity Impacts Small benefit. Tends to reduce externalities and improve mobility options for non-drivers.
1
Technical and Administrative Moderate -2 Public/Political Acceptability Tends to be popular in some areas. 2
Implementation Generally by local governments. Can be supported by provincial funding and policies.
Basis for Estimates of “Impacts” and “Take-Up” Where comprehensive traffic calming is implemented, travel reductions of 5% are possible. I assume that with strong support, 50% of regional residents and businesses could be located in areas with effective traffic calming programs.
Conclusions Traffic calming and roundabouts can be effective ways to create more pedestrian-friendly urban areas and reduce vehicle travel. The impacts of any individual traffic calming project are small, and their energy and emission impacts are difficult to predict. Traffic calming can probably reduce save energy and emissions as part of overall transportation and land use reforms to reduce automobile dependency. Traffic calming can provide other benefits, including increased safety and more attractive street environments.
Action Options
• Support research on traffic calming impacts, including safety benefits and effects on energy consumption and pollution emissions.
• Support transportation and land use planning reforms that allow traffic calming and roundabouts to be implemented where appropriate.
• Help fund pilot projects and urban redevelopment that includes traffic calming.
101

Evaluating Mobility Management Strategies Victoria Transport Policy Institute
Traffic Speed Reductions Traffic speed reductions can reduce energy consumption and emissions in two ways. Reduced speeds tends to reduce total vehicle mileage. The elasticity of vehicle travel with respect to travel time is calculated to be –0.2 to –0.5 in the short run and –0.7 to –1.0 over the long run, meaning that a 10% reduction in average traffic speeds reduces affected vehicle travel by 2-5% during the first few years, and up to 7-10% over a longer time period (“Transportation Elasticities,” VTPI, 2002). Vehicle fuel consumption and emissions are lowest at moderate speeds (40-90 kph), as indicated in figure 4 and 5. Fuel efficiency typically declines about 0.6% for each additional km above 90 kph. Reducing speed from 110 to 90 kph provides about 10% fuel savings for a 1997 model vehicle, and 18% for a 1984 model vehicle. Energy savings and emission reductions can be achieved by simply enforcing existing speed limits. This is included as a strategy in the Climate Change Plan for Canada (2002, p. 23). Figure 4 Vehicle Fuel Efficiency By Speed (ORNL, 2000, Table 7.21)
0
5
10
15
20
25
30
24 40 56 72 88 105 121Vehicle Speed (Km Per Hour)
Litr
es P
er 1
00 k
m
199719841973
Model Year
This figure shows how average vehicle fuel efficiency for a typical set of automobiles (cars, SUVs and light trucks) is affected by vehicle speed. Figure 5 Vehicle Emissions By Speed (TRB, 1995)
8 16 24 32 40 48 56 64 72 80 88 97 105Vehicle Speed (KPH)
Per-
KM
Em
issi
on R
ates Carbon
MonoxideVOCs
NOx
This figure shows how typical vehicle emissions are affected by speed.
102

Evaluating Mobility Management Strategies Victoria Transport Policy Institute
Obstacles There tends to be opposition to significant speed reduction and speed enforcement programs. There is some uncertainty as to the energy saving and emission reduction value of speed reductions, particularly with newer vehicles in urban travel conditions.
Current Status in the Vancouver and Fraser Valley Region There are various speed control efforts sponsored by ICBC and local governments, to improve road safety. Some have been reduced in recent years (particularly photo radar). There are no broad speed control efforts to reduce vehicle travel or emission rates. Table 36 Speed Reduction Summary
Sector All vehicle travel Impact (per participant) Small. Up to 2% mileage reductions, 4% energy and emission reductions.
Take-Up Can be implemented quickly. 50%, 75%, 100%, 100% Congestion Reduction Mixed. High-to-moderate speed changes tend to reduce congestion,
moderate-to-low speed changes tend to increase congestion. 0
Road & Parking Cost Savings Small 1 Traffic Safety Large 3
Land Use Impacts Medium 2 Consumer Costs Mixed 0
Transportation Options Small benefit, due to improved nonmotorized transport 1 Equity Impacts Mixed 0
Technical and Administrative Moderate -2 Public/Political Acceptability Mixed. May be support if justified primarily on safety grounds. 0
Implementation Provincial or municipal governments, including changes in legislation, policies, funding, and law enforcement practices.
Basis for Estimates of “Impacts” and “Take-Up” Based on previous studies, speed reduction programs are estimated to reduce mileage by 2% (reflecting the elasticity of vehicle travel to travel time), and energy consumption and emissions by 4% (reflecting improved vehicle efficiency at lower speeds). These can be deployed quickly, so I assume that they could achieve 90% take-up (weighted by vehicle travel) within a few years, that is, jurisdictions that carry 90% of regional vehicle travel would have significantly improved speed management programs.
Conclusions Speed reduction strategies, including stricter enforcement of existing speed regulations (as opposed to reducing posted speed limits) could probably make a modest contribution toward energy consumption and emission reductions, and provide other benefits including increased safety and improved walking conditions. It is primarily a provincial and local issue, evaluated based on safety and driver impacts.
Action Options
• Support research on the energy, emission and safety impacts of speed changes.
• Support local and provincial speed control efforts.
• Make federal transportation grants to local and provincial governments contingent on a certain level of traffic speed regulation and enforcement.
103

Evaluating Mobility Management Strategies Victoria Transport Policy Institute
Evaluating Mobility Management Strategies
Quantitative Analysis A spreadsheet model was developed that calculates the projected energy conservation and emission reductions of each strategy over a 20-year period, taking into account the size of its sector, the energy growth rate of its sector, average emission reductions per participant and predicted Take-Up over the 20-year period. Figure 6 illustrates the results. Of course, actual results will vary depending on implementation details, and strategies that have small emission impacts may still be justified if they provide additional benefits. Figure 6 Predicted 20-Year Energy Savings
0% 1% 2% 3% 4% 5% 6% 7% 8% 9%
Car-Free Planning and Vehicle Restrictions
Aviation Transport Management
Traffic Calming
High Occupant Vehicle (HOV) Priority
School & Campus Transport Management
Nonmotorized Improvements & Encouragement
Tourist & Special Event Transport Mgt.
Transit Improvements and Incentives
Transportation Management Association
Telework
Ridesharing
Commuter Financial Incentives
Carsharing and vehicle rentals
Road Pricing
Freight Transport Management
Employee Trip Reduction Programs
Optional PAYD Insurance
Traffic Speed Reductions
MM Programs & Institutional Reforms
Distance-Based Emission Fees
Parking Pricing
Mobility Management Marketing
Fuel Tax Increases
Land Use Management Strategies
Distance-Based Pricing
Mandatory PAYD Insurance
Reduction in Total Transport Energy Consumption
This figure compares the potential energy conservation impacts of the mobility management strategies described in this report. Of course, these results will vary depending on assumptions.
104

Evaluating Mobility Management Strategies Victoria Transport Policy Institute
105
Qualitative Evaluation The strategies were rated from 3 (very good) to –3 (very bad) according to the following criteria:
• Congestion Reduction • Road and Parking Cost Savings • Traffic Safety • Land Use Impacts • Consumer Costs • Transportation Options • Equity Impacts • Technical and Administrative • Public/Political Acceptability • Implementation
These are subjective ratings by this report’s author, with advice from various stakeholders that were consulted. Another process or stakeholder group could result in somewhat different ratings. The table on the next page illustrates the results of this analysis. When these ratings are summed, the strategies listed below rank highest. Of course, these results depend on inputs and assumptions used, and may change if different weightings are applied. • Transit Tax Exemption • Mandatory Pay-As-You-Drive Vehicle Insurance and Registration Fees • Optional Pay-As-You-Drive Vehicle Insurance • Employee Trip Reduction Programs • Carsharing • Transportation Management Association • School and Campus Transport Management Programs • Mobility Management Marketing • Land Use Management Strategies

Evaluating Mobility Management Strategies Victoria Transport Policy Institute
106
Table 37 Qualitative Analysis Summary Totals Emission
Red. Cong. Red.
Road & Parking
Safety Land Use Impacts
Consumer Costs
Transport Options
Equity Impacts
Tech./Adm. Requ.
Popular/ Political
Commuter Financial Incentives 25 2 3 3 2 3 3 3 3 1 2 Mandatory PAYD Insurance & Reg. Fees 24 3 2 2 3 2 2 3 3 2 2 Optional Pay-As-You-Drive Vehicle Fees 23 2 2 2 3 2 2 3 3 2 2 Employee Trip Reduction 23 2 3 3 2 2 2 3 3 2 1 Transportation Management Association 21 2 3 3 2 2 2 2 2 2 1 Carsharing 20 1 1 2 2 2 3 3 2 2 2 School and Campus Management 18 1 2 2 2 2 2 3 3 -1 2 Mobility Management Marketing 18 2 2 2 2 2 2 2 1 2 1 Land Use Management Strategies 17 2 1 2 2 3 1 2 2 2 0 Institutional Reforms 14 2 1 2 2 2 2 2 2 2 -3 Transit Improvements and Incentives 16 1 3 3 2 3 2 3 2 -1 -2 Ridesharing 16 1 3 3 2 0 2 3 2 -2 2 Distance-Based Taxes and Lease Fees 15 2 2 2 2 2 2 2 2 -1 0 Nonmotorized Improvements 15 2 1 2 0 2 2 3 3 -2 2 High Occupant Vehicle (HOV) Priority 14 2 3 3 1 1 2 2 2 -3 1 Mobility Management Programs 14 3 3 3 2 2 2 2 2 -2 -3 Telework/Flextime 14 1 3 2 2 -1 2 3 2 -2 2 Tourist/Event Transport Management 11 1 2 2 2 2 2 2 1 -2 -1 Traffic Calming 11 1 0 1 3 3 0 2 1 -2 2 Car-Free Planning and Vehicle Restrictions 7 1 1 1 1 1 1 3 1 -2 -1 Traffic Speed Reductions 7 2 0 1 3 2 0 1 0 -2 0 Freight Mobility Management 5 3 1 1 1 1 0 0 0 -1 -1 Fuel Tax Increases 2 3 1 1 1 1 -1 -2 0 0 -2 Parking Management and Parking Pricing 2 3 2 3 1 2 -2 -3 0 -2 -2 Aviation Transport Management -1 2 1 1 0 0 -1 -2 0 -1 -1 Distance-Based Emission Fees -2 3 1 1 1 1 -1 -2 0 -3 -3 Road Pricing -2 2 3 2 1 1 -2 -3 0 -3 -3 This table summarizes the qualitative analysis of mobility management strategies, based on a seven-point ranking system from 3 (very good) to –3 (very bad). Of course, these ratings may vary depending on perspective and situation.

Potential Mobility Management Emission Reductions Report Summary Victoria Transport Policy Institute
Implementation The table below identifies the administrative level with major implementation responsibilities for the various strategies. Pub. Agency refers to public agencies such as schools, hospitals and ports. Table 38 Mobility Management Implementation Responsibilities Federal Prov. Reg. Local Pub. Agency Private Mobility Management Programs & Institutional Reform X X X X X Employee Trip Reduction Programs X X X X School & Campus Transport Management X X X Tourist & Special Event Transport Management X X X X Freight Transport Management X X X X X X Aviation Transport Management X X X X X Transportation Management Associations X X X X Commuter Financial Incentives X X X X X X Distance-Based Taxes and Lease Fees X X Pay-As-You-Drive Vehicle Insurance X Fuel Tax Increases X X Road Pricing X X Parking Management and Parking Pricing X X X X Mobility Management Marketing X X X X X X Transit Improvements and Incentives X X X High Occupant Vehicle (HOV) Priority X X X Ridesharing X X X X Nonmotorized Improvements & Encouragement X X X Telework/Flextime X X X Land Use Management Strategies X X X X X Carsharing and Alternative Vehicle Ownership Options X X X X X Car-Free Planning and Vehicle Restrictions X X X Traffic Calming and Roundabouts X X X Traffic Speed Reductions X X X This table indicates the administrative levels with major implementation responsibilities. Many mobility management strategies appear to be technically feasible and economically justified, that is, their total economic benefits (congestion reductions, road and parking facility cost savings, road safety, consumer savings, and direct consumer benefits) can exceed their incremental costs. As a result, they can provide “free” energy savings and emission reductions. This is not to say that there are no costs or barriers to their implementation, or that they are always effective and efficient, but it does mean that if properly implemented society can benefit overall, regardless of the value assigned to climate change emissions and other vehicle pollutants. Political acceptability is an important consideration in selecting mobility management strategies. Table 39 rates these strategies according to these two factors, identifying those that seem to offer the best combination of benefits and political acceptability. Of course, these factors vary depending on assumptions, conditions and how a strategy is implemented.
107

Potential Mobility Management Emission Reductions Report Summary Victoria Transport Policy Institute
Table 39 Strategies Categorized By Net Benefits and Political Acceptability Greatest Political
Acceptability Moderate Political
Acceptability Least Political Acceptability
Greatest Net Benefits
Optional Employee Trip Reduction (ETR) Programs
Optional PAYD Insurance
Mandatory Commuter Financial Incentives
Transit Tax Exemption
Parking Management
Ridesharing
Transit Improvements
Institutional Reforms
Land Use Management
Distance-based Taxes and Lease Fees
Road Pricing
Mandatory PAYD Fees
Speed reduction programs
Moderate Net
Benefits
TMAs
NMT Transport Improvements
MM Marketing
Optional Commuter Financial Incentives
School and Campus MM
Traffic Calming
Freight MM
Traffic Speed Reductions
(HOV) Priority
Distance-based Emission Fees
Aviation MM
Fuel Tax Increases
Least Net Benefits
Telework/Flextime
Carsharing Tourist/Event MM Carfree Planning
This table illustrates how various mobility management strategies rank according to total economic benefits and political acceptability. Even strategies that appear politically unattractive may be implemented when conditions are favorable. For example, there may be circumstances in which parking pricing or road pricing become acceptable, for example, if there is consensus that new revenues are needed for some purpose, because they turn out to be politically more acceptable than other transportation improvement options, or because public attitudes and preferences change. Federal and provincial policies can increase the political feasibility of many mobility management strategies by offering appropriate support and incentives. For example, these levels of government can provide funding for mobility management programs, and infrastructure grants can be contingent on communities establishing more efficient transportation and land use policies.
108
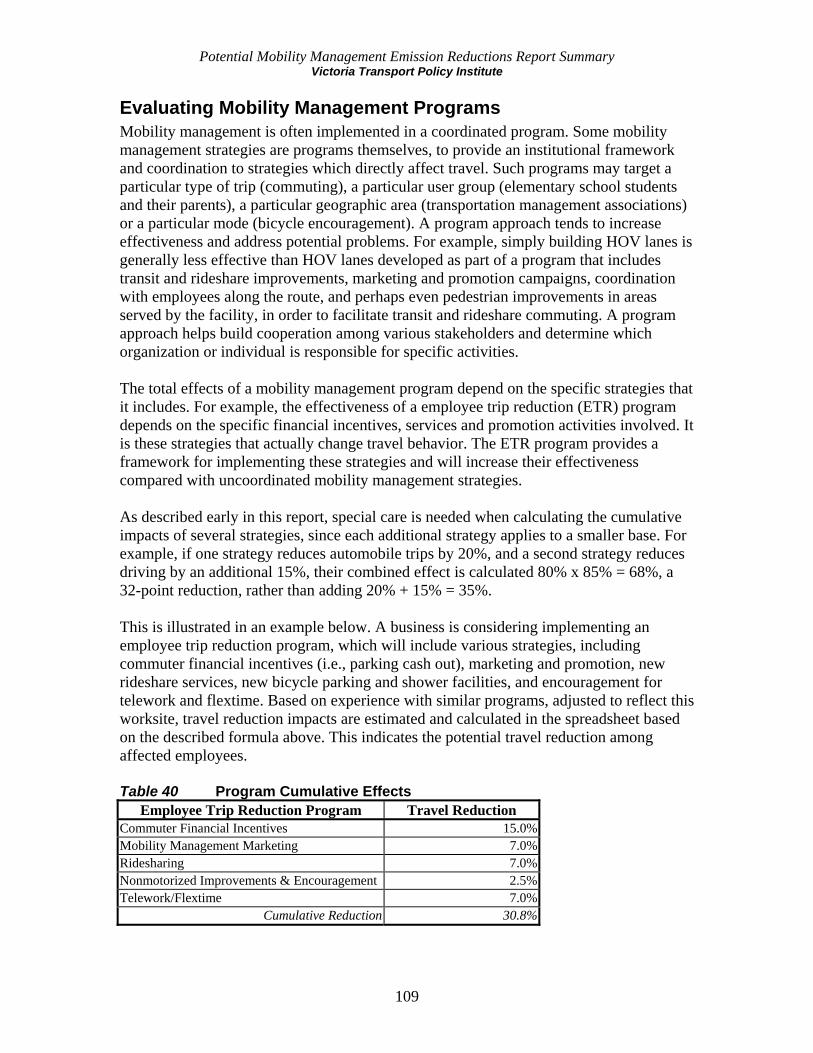
Potential Mobility Management Emission Reductions Report Summary Victoria Transport Policy Institute
Evaluating Mobility Management Programs Mobility management is often implemented in a coordinated program. Some mobility management strategies are programs themselves, to provide an institutional framework and coordination to strategies which directly affect travel. Such programs may target a particular type of trip (commuting), a particular user group (elementary school students and their parents), a particular geographic area (transportation management associations) or a particular mode (bicycle encouragement). A program approach tends to increase effectiveness and address potential problems. For example, simply building HOV lanes is generally less effective than HOV lanes developed as part of a program that includes transit and rideshare improvements, marketing and promotion campaigns, coordination with employees along the route, and perhaps even pedestrian improvements in areas served by the facility, in order to facilitate transit and rideshare commuting. A program approach helps build cooperation among various stakeholders and determine which organization or individual is responsible for specific activities. The total effects of a mobility management program depend on the specific strategies that it includes. For example, the effectiveness of a employee trip reduction (ETR) program depends on the specific financial incentives, services and promotion activities involved. It is these strategies that actually change travel behavior. The ETR program provides a framework for implementing these strategies and will increase their effectiveness compared with uncoordinated mobility management strategies. As described early in this report, special care is needed when calculating the cumulative impacts of several strategies, since each additional strategy applies to a smaller base. For example, if one strategy reduces automobile trips by 20%, and a second strategy reduces driving by an additional 15%, their combined effect is calculated 80% x 85% = 68%, a 32-point reduction, rather than adding 20% + 15% = 35%. This is illustrated in an example below. A business is considering implementing an employee trip reduction program, which will include various strategies, including commuter financial incentives (i.e., parking cash out), marketing and promotion, new rideshare services, new bicycle parking and shower facilities, and encouragement for telework and flextime. Based on experience with similar programs, adjusted to reflect this worksite, travel reduction impacts are estimated and calculated in the spreadsheet based on the described formula above. This indicates the potential travel reduction among affected employees. Table 40 Program Cumulative Effects
Employee Trip Reduction Program Travel Reduction Commuter Financial Incentives 15.0%Mobility Management Marketing 7.0%Ridesharing 7.0%Nonmotorized Improvements & Encouragement 2.5%Telework/Flextime 7.0%
Cumulative Reduction 30.8%
109

Potential Mobility Management Emission Reductions Report Summary Victoria Transport Policy Institute
Conclusions This study evaluates the benefits, costs and feasibility of 27 mobility management (MM) strategies. This analysis indicates that if properly selected and implemented, mobility management programs can offer economic benefits that exceed their costs, and so can provide “free” energy and emission reductions. This is not to say that their implementation is costless or easy, but it does mean that society can benefit overall. The following appear to offer the best combination of benefits and political acceptability. Commuter Incentives Distance-based taxes and fees Land Use Management Institutional Reforms MM Marketing
NMT Improvements Optional ETR Programs Optional PAYD Insurance Parking Management Ridesharing
School and Campus MM TMAs Transit Improvements
A portion of current vehicle travel results from market distortions (pricing, tax policies and planning practices that favor motor vehicle use). Many mobility management strategies reflect market principles that correct existing distortions, and so tend to increase overall economic efficiency and productivity while reducing vehicle mileage. Most individual mobility management strategies only affect a small portion of total vehicle traffic, and so provide modest benefits. When evaluated based on just one or two objectives, such as congestion reduction or energy conservation, they may not seem very cost effective. However, as more impacts are considered, mobility management becomes increasingly attractive. An integrated mobility management program can effect a significant portion of total vehicle traffic in an area, and provide large total benefits. Mobility management faces various political and institutional obstacles. Some require changing current policy and planning practices, or new organizational responsibilities. Others impose costs that are concentrated on specific groups, while benefits are more dispersed. Some face common misconceptions of their costs, benefits and equity impacts. The Vancouver region is already a leader in mobility management, although many of the most effective mobility management strategies have yet to be fully implemented. In some cases, relatively modest additional effort may result in more successful implementation. One of the major challenges of mobility management implementation is that it requires coordination between various public and private organizations: employers, developers, local, regional, provincial and federal governments. The federal government currently has little direct role in implementing most strategies. However, federal policies and programs could make important contributions toward mobility management implementation by providing incentives to other levels of government, supporting research and pilot projects, and helping to create new relationships. The next section summarizes specific actions that can be taken by various levels of government to help support mobility management implementation.
110

Potential Mobility Management Emission Reductions Report Summary Victoria Transport Policy Institute
Action Options Below are some potential federal or provincial government actions that this study indicates could help implement cost-effective mobility management strategies.
Federal Funding Practices • Federal agencies can help fund mobility management programs, such as information
materials and pilot projects for innovations such as transportation management associations, distance-based vehicle fees and parking management.
• Target federal infrastructure grants at projects that support mobility management, including improvements to alternative modes (walking, cycling, public transit), and locating services and facilities based on smart growth principles (urban redevelopment, locating public facilities and employment centers within urban centers and mixed-use urban villages).
• Make federal infrastructure grants contingent on a community establishing mobility management programs.
• Allow federal infrastructure funds to be used for transport program operations rather than just capital expenditures, including mobility management planning and marketing activities.
• Allow mobility management programs to qualify for emission reduction credits (i.e., as a way to meet federal air quality standards).
• Require that matching funds for infrastructure projects such as highway and transit improvements reflect mobility management objectives. For example, such projects could be funded through road and parking user charges, providing a double benefit: funds for improved transport services and an incentive to reduce vehicle traffic.
• Educate people who affect infrastructure investment decisions on the potential role of mobility management in improving transportation.
• Investigate and correct planning practices that may undercount and undervalue alternative modes. For example, improve the ability of travel surveys to account for walking, and improve travel modes so they better predict the effects of generated traffic.
Mobility Management Programs and Institutional Reforms • Develop a cooperative program involving federal (Environment Canada, Transport Canada,
Natural Resources Canada), provincial and regional agency officials to support and implement regional mobility management plans.
• Develop tools to better evaluate the full economic, social and environmental impacts of transportation policies and projects, including mobility management programs.
• Develop an “office of operations” within federal and provincial transportation agencies to provide an organizational home for research, planning and implementation related to mobility management, freight management and intelligent transportation system programs.
• Consult with stakeholders (federal, provincial, regional and local officials; businesses; professional organizations; NGOs) to identify policy reforms that encourage more efficient transportation and land use patterns.
• Provide incentives for local and regional governments to implement institutional reforms such as least cost planning practices and alternative development standards.
111

Potential Mobility Management Emission Reductions Report Summary Victoria Transport Policy Institute
Employee Transport Management • Help develop a regional Employee Trip Reduction (ETR) agenda that includes a combination
of education materials for policy makers, transport professionals, business leaders and employers; predictable funding; flexible parking requirements (so employers can capture financial savings when employees reduce their vehicle trips); and goals, objectives and responsibilities in each geographic area.
• Support federal incentives, such as transit benefits tax exemptions to employees, and tax deductions to employers who implement ETR programs.
• Encourage regional and provincial governments to pass ETR legislation. For example, make infrastructure grants contingent on implementing such policies.
• Implement employee trip reduction programs for federal agencies and federally-supported organizations. Develop appropriate training materials for agency planners, personnel departments and facility managers.
• Allow employee trip reduction programs to qualify for emission reduction credits (i.e., as a way to meet federal air quality standards).
School and Campus Mobility Management • Sponsor research on the effectiveness of school transport management programs.
• Consult with stakeholders to identify opportunities to improve school transport management programs.
• Help establish ongoing funding for school transport management programs. This could include provincial, regional or local funding, from transportation, school or environmental program budgets.
• Evaluate provincial and regional school policies to identify biases that favor automobile travel over other modes (such as funds available for parking facilities and school bus programs that is not available for mobility management programs, or policies that favor less walkable school locations).
• Sponsor conferences, workshop and education programs to develop better communication among school administrators, transportation professionals and local public officials concerning ways to implement school transport management programs.
Tourist Transport Management • Sponsor a study of the potential of implementing tourist and special event transport
management.
• Sponsor a process to develop and implement a regional tourist transport management program.
• Help support tourist transport management pilot projects and resource development.
• Work with other federal and provincial agencies to support tourist transport management programs to achieve other goals, such as wildlife protection.
• Implement visitor transportation management programs at federal parks and for federally-supported events.
112

Potential Mobility Management Emission Reductions Report Summary Victoria Transport Policy Institute
Freight Transport Management • Sponsor a study of the potential of implementing freight transport management in this region.
• Sponsor a process to develop and implement a regional freight management program.
• Work with existing freight transport planners to incorporate sustainability objectives and apply mobility management strategies as much as appropriate.
• Make federal infrastructure policies and grants consistent with freight transport management objectives. For example, provide grants for port and rail system improvements, and for industrial development along multi-modal freight corridors.
Aviation Transport Management • Sponsor a federal study of the potential of implementing aviation transport management at a
national level.
• Investigate possible hidden subsidies and policy biases that favor air travel over other travel options and consumer expenditures. If such distortions exist, identify ways to correct them.
• Sponsor a process to develop and implement a regional aviation management program.
• Make federal infrastructure policies and grants consistent with aviation transport management objectives. For example, fund transit improvements to airports, and support improved intercity rail service.
Transportation Management Associations • Promote the development of TMAs through special funding (such as start-up grants) and
workshops involving local and regional officials and business representatives.
• Have federal agencies and federally-sponsored programs support the development of TMAs where they are located.
Commuter Financial Incentives • Change federal tax policy to allow transit benefits and parking cash out provided by
employers to employees to be income tax exempt.
• Support Employee Trip Reduction programs (described above) that include commuter financial incentives.
• Encourage local governments to reduce minimum parking requirements for employers that offer commuter financial incentives, and support other parking management strategies. This allows businesses to capture savings from reduced automobile commuting.
• Expand commuter financial incentives offered to federal employees.
113

Potential Mobility Management Emission Reductions Report Summary Victoria Transport Policy Institute
Distance-Based Pricing • Support research and pilot projects of distance-based fee implementation.
• Change federal tax policies so vehicle sales taxes are prorated by mileage.
• Provide incentives to provincial governments to implement distance-based vehicle insurance, registration fees, weight-distance fees and taxes.
• Provide incentives, such as regulations or tax discounts, to private companies that offer distance-based insurance and lease fees.
• Support research and pilot projects of distance-based emission fee implementation.
Pay-As-You-Drive Vehicle Insurance • Sponsor research on PAYD pricing. For example, investigate the potential role of PAYD
insurance as an emission-reduction strategy, and help fund pilot projects.
• Support pilot projects to test the costs and effectiveness of PAYD. In particular, encourage the BC government and ICBC to test PAYD pricing.
• Provide incentives for insurance companies to offer PAYD.
• Allow PAYD insurance to qualify for emission reduction credits.
Fuel Tax Increases • Support research on the economic costs and benefits of tax shifting.
• Support an integrated North American policy to increase fuel taxes.
Road Pricing • Establish a federally-funded road pricing pilot project to identify congestion pricing barriers
and opportunities, test potential electronic road pricing technologies, and demonstrate the feasibility and benefits of road pricing.
• Encourage regional and local governments to use road pricing as a way to fund transportation projects, for example, as a way to match federal grants.
• Allow road pricing projects to qualify for emission reduction credits (i.e., as a way to meet federal air quality standards).
• Encourage or require road pricing as a way to provide matching funds for federal infrastructure investments, such as highway and transit improvements.
114

Potential Mobility Management Emission Reductions Report Summary Victoria Transport Policy Institute
Parking Pricing and Management • Sponsor research, professional development workshops, and information resource
development on parking management implementation.
• Survey stakeholders to identify obstacles and opportunities for parking management and parking pricing.
• Encourage regional and local governments to use parking taxes as a way to fund transportation projects, for example, as a way to match federal grants.
• Promote the development of TMAs, described earlier, to provide parking management and brokerage services in a particular area.
• Have federal agencies and federally-sponsored programs implement parking management and parking pricing.
• Increase enforcement of employee parking benefit tax collection.
Mobility Management Marketing • Sponsor mobility management marketing pilot projects.
• Help develop regional transportation management associations that can provide both general and targeted mobility management marketing programs.
• Help change policies so mobility management strategies can compete equally with capital investments for transportation funding.
• Support research to improve the ability to develop effective mobility management marketing programs and to predict their potential effectiveness.
Transit Improvements • Provide federal funding for transit service improvements. Structure such funding to
“leverage” additional provincial, regional and local funds. For example, provide 25% match for transit service improvements, with the requirement that provincial, regional and local governments to each provide an equal share.
• Sponsor research on cost-effective ways to improve transit service and encourage transit ridership.
• Help create tools for evaluating the full benefits of transit improvements. Develop cooperation among federal (Environment Canada, Transport Canada, Natural Resources Canada), provincial, regional and local agencies to support transit improvements.
• Help establish long-term transit funding.
• Consult with stakeholders to identify other federal actions to support transit.
HOV Priority • Consult with regional transit and transportation planners to identify cost-effective HOV
priority projects.
• Support for HOV priority programs, including the conversion of existing road lanes to HOV, and the development of transit priority intersection designs and traffic controls.
• Encourage relatively high HOV standards (e.g., 3+ or 5+) and adequate enforcement.
115

Potential Mobility Management Emission Reductions Report Summary Victoria Transport Policy Institute
Ridesharing • Consult with stakeholders (rideshare program operators, transit planners, employee trips
reduction coordinators, transportation planners) to identify barriers and opportunities for increasing ridesharing in this region.
• Help establish and fund a regional rideshare development and marketing plan.
• Coordinate efforts to establish a single, regional ridematch database, or develop a protocol for data sharing among service providers.
• Find ways to increase funding for rideshare program.
Nonmotorized Transportation Improvements • Work with transportation and planning organizations to develop better methods for evaluating
nonmotorized transportation and the full potential benefits of specific walking and cycling improvements.
• Survey stakeholders to identify barriers and opportunities to increase walking and cycling for transportation.
• Encourage local governments to create walking and cycling plans, and to integrate these plans with transportation, transit, land use and school planning activities.
• Use federal grants to leverage increased provincial, regional and local expenditures on walking and cycling facilities and programs.
Telework/Flextime • Sponsor research on the travel impacts of telework and flextime.
• Develop a national telecommunications plan that help create suitable infrastructure for telework.
• Promote telework and flextime for federal employees and federally-sponsored organizations and projects.
Land Use Management • Sponsor research on the relationships between public policies, land use development patterns,
travel behavior and transportation energy use/pollution emissions.
• Sponsor research projects and contests to develop high quality urban designs that address concerns about higher-density, mixed use, infill development.
• Select federal infrastructure grants that support smart growth.
• Make federal infrastructure grants contingent on provincial and local land use policy reforms, such as zoning codes that favor infill development, flexible parking requirements, utility pricing that rewards clustered development, infill school siting, etc.
• Locate federal facilities (e.g., offices and service centers) to support smart growth objectives.
• Reform tax policies to correct any biases that favor new greenfield construction over infill redevelopment (such as more favorable tax treatment of new construction over renovation of existing buildings).
116

Potential Mobility Management Emission Reductions Report Summary Victoria Transport Policy Institute
Carsharing • Work with existing carsharing organizations to overcome obstacles and expand service.
• Provide incentives for automobile rental companies to locate offices in residential areas and offer short-term (hourly) rates.
Carfree Planning and Vehicle Restrictions • Support transportation and land use planning reforms that allow carfree planning to be
implemented where appropriate.
• Help fund pilot projects and urban redevelopment that includes carfree planning and vehicle restrictions.
Traffic Calming and Roundabouts • Support transportation and land use planning reforms that allow carfree planning to be
implemented where appropriate.
• Help fund pilot projects and urban redevelopment that includes carfree planning and vehicle restrictions.
Vehicle Speed Reductions • Support research on the energy, emission and safety impacts of speed changes.
• Support local and provincial speed control efforts.
• Make federal transportation grants to local and provincial governments contingent on a certain level of traffic speed regulation and enforcement.
117

Potential Mobility Management Emission Reductions Report Summary Victoria Transport Policy Institute
References Dr. Peter Bein, Monetization of Environmental Impacts of Roads, Planning Services Branch, B.C. Ministry of Transportation and Highways (Victoria, www.th.gov.bc.ca/bchighways), 1997. BC Legislature, Draft Transportation Investment Act – Bill 57, BC Legislature (www.legis.gov.bc.ca/37th3rd/1st_read/gov57-1.htm#section3), 2002. BTCE, Transport and Greenhouse; Costs and Options for Reducing Emissions, Bureau of Transport Economics (www.dot.gov.au/programs/bte/btehome.htm), 1996. CAA, Canadian Automobile Association Statement of Policy, Canadian Automobile Association (www.caa.ca/e/news-issues/pdf/statement-policy.pdf), 2002. CST, “Canada’s Major Urban Regions: How They Compare,” Sustainable Transportation Monitor 7, Centre for Sustainable Transportation (www.cstctd.org), October 2002. Leo Dobes, “The Transport Sector: Is a Carbon Tax Better?” Trading Greenhouse Emissions: Some Australian Perspectives, Bureau of Transport Economics (www.dot.gov.au/programs/bte/btehome.htm), 1998. Bruce Friedman, Stephen Gordon and John Peers, “Effect of Neotraditional Neighborhood Design on Travel Characteristics,” Transportation Research Record 1466, 1995, pp. 63-70. Lew Fulton, Sustainable Transport: New Insights From The IEA’s Worldwide Transit Study, International Energy Agency (www.iea.org), Oct. 2001. David L. Greene and John DeCicco, Engineering-Economic Analysis of Automotive Fuel Economy Potential in the United States, Oak Ridge National Laboratory (ORNL-27, 3-96), 2000. GVRD, Livable Region Strategic Plan, Greater Vancouver Regional District (www.gvrd.bc.ca), 1996. Greig Harvey and Elizabeth Deakin, “The STEP Analysis Package: Description and Application Examples,” Appendix B, in Technical Methods for Analyzing Pricing Measures to Reduce Transportation Emissions, USEPA Report #231-R-98-006, (www.epa.gov/clariton), 1998. John Holtzclaw, Does A Mile In A Car Equal A Mile On A Train? Exploring Public Transit’s Effectiveness In Reducing Driving, The Sierra Club, (www.sierraclub.org/sprawl/articles/reducedriving.asp), 2000. IBI, Transportation Issue Table Tax Exempt Status For Employer-Provided Transit Benefits, National Climate Change Process and Transport Canada (www.tc.gc.ca/envaffairs/subgroups1/passenger%5Furban/study5/finalreport/final%5Freport.htm), 1999. ICF Incorporated, Opportunities to Improve Air Quality Through Transportation Pricing Programs, USEPA (www.epa.gov/omswww/market.htm), Sept. 1997.
118

Potential Mobility Management Emission Reductions Report Summary Victoria Transport Policy Institute
IEA, Saving Oil and Reducing CO2 Emissions in Transportation, International Energy Agency (www.iea.org/public/studies/savingoil.htm), 2001. ITSBC, British Columbia’s Provincial ITS Vision and Strategic Plan, ITS Corporation of BC (www.itsbc.ca), 2001. Heinz Jansen and Cecile Denis, “A Welfare Cost Assessment of Various Policy Measures to Reduce Pollutant Emissions from Passenger Road Transport,” Transportation Research D, Vol. 4, No. 6, Nov. 1999, pp. 379-396. Doug Koplow and John Dernbach, Federal Fossil Fuel Subsidies and Greenhouse Gas Emissions: A Case Study of Increasing Transparency for Fiscal Policy, Annual Review of Energy and Environment, Vol. 26 (www.annualreviews.org), 2001, pp. 361-89. Todd Litman, Socially Optimal Transport Prices and Markets, VTPI (www.vtpi.org), 2001. Todd Litman, Efficient Vehicles Versus Efficient Transportation: Comprehensive Comparison of Fuel Efficiency Standards And Transportation Demand Management, VTPI (www.vtpi.org), 2002; presented at the Transportation Research Board 81st Annual Meeting. Todd Litman, “Economic Value of Walkability,” Transportation Research Record 1828, Transportation Research Board (www.trb.org), 2003, pp. 3-11; available at the VTPI website (www.vtpi.org/walkability.pdf). Todd Litman, Evaluating Public Transit Benefits and Costs, VTPI (www.vtpi.org), 2004. Todd Litman, Charles Komanoff and Douglas Howell, Road Relief; Tax and Pricing Shifts for a Fairer, Cleaner, and Less Congested Transportation System in Washington State, Climate Solutions (www.climatesolutions.org), 1998. Roger Mackett, How to Reduce the Number of Short Trips by Car, European Transport Conference, Centre for Transport Studies, University College London (www.ucl.ac.uk/transport-studies/shtrp.htm), 2000. Moving the Economy (www.city.toronto.on.ca/mte) provides information on ways to create more sustainable transportation, including an online database with numerous case studies. MOT, Draft Policy Paper: Creating Opportunities for Expanding Transportation Infrastructure, Ministry of Transportation (www.th.gov.bc.ca/BCHighways/partnerships/2417-1_AltDelivery_web.pdf), 2002. Peter Newman and Jeff Kenworthy, Sustainability and Cities: Overcoming Automobile Dependence, Island Press (www.islandpress.org), 1999. NRT, Greenhouse Gas Emissions from Urban Transportation, National Round Table on Environment and Economy (www.nrtee-trnee.ca/publications/Colour/URBTRANE.pdf), 1998. OECD/IEA, Saving Oil and Reducing CO2 Emissions in Transport: Options & Strategies, OECD (www.oecd.org) and the International Energy Agency (www.iea.org), 2001.
119

Potential Mobility Management Emission Reductions Report Summary Victoria Transport Policy Institute
Dan Perrin, Options to Reduce Light Duty Vehicle Emissions in British Columbia, Discussion Paper, BC Ministry of Finance (www.fin.gov.bc.ca/tbs/emissions.htm), 2000. Maureen Sevigny, Taxing Automobile Emissions for Pollution Control, New Horizons in Environmental Economics, Edward Elgar (www.e-elgar.co.uk), 1998. SGN, Getting To Smart Growth: 100 Policies for Implementation, and Getting to Smart Growth II: 100 More Policies for Implementation, Smart Growth Network (www.smartgrowth.org) and International City/County Management Association (www.icma.org), 2002 and 2004. Sheltair Group, Greater Vancouver and Vancouver and Fraser Valley Air Quality Management Plan; Phase 1 Options for Reducing Greenhouse Gases and Air Pollution in the GVRD, Greater Vancouver Regional District (www.sheltair.com), 2000. Suzuki, Canadian Solutions: Practical and Affordable Steps to Fighting Climate Change, David Suzuki Foundation and Pembina Institute (www.davidsuzuki.org), 1998. T&E, Aviation; Air Transport’s Environmental Impact, European Federation for Transport and Environment (www.t-e.nu), 1999a. TC, Transportation and Climate Change: Options for Action, Transport Canada (www.tc.gc.ca/envaffairs/english/climatechange/ttable), November 1999. TC, Freight Efficiency and Technology Initiative (www.tc.gc.ca/programs/environment/freight/menu.htm), Transport Canada, 2004. TC, Commuter Options: A Complete Guide for Canadian Employers, Transport Canada (www.tc.gc.ca/commuter), 2002. TransPriceProject (www.cordis.lu/transport/src/transpricerep.htm) is a European study of various pricing strategies for reducing urban traffic congestion and air pollution emissions. TRB, Expanding Metropolitan Highways: Implications for Air Quality and Energy Use, Transportation Research Board, Special Report 345 (www.trb.org), 1995. TUV, CANTIQUE: Concerted Action on Non Technical Measures and Their Impact on Air Quality and Emissions, Research For Sustainable Mobility, European Union (http://europa.eu.int/comm/transport/extra/final_reports/strategic/cantique.pdf), Nov. 2000. Urban Systems, A Comprehensive Parking Management Strategy, BC Transportation Financing Authority, 1996. Urban Systems, Provincial Vanpool Program, Urban Systems for BC Transit (www.bctransit.com/corporate/pdf/Prov_Vpool_May2001.pdf), 2001. USDOE, Transportation Energy Data Book, Oak Ridge National Laboratory, US Department of Energy, (http://cta.ed.ornl.gov/Publications/Tedb.html), 2001. USEPA, Transportation Air Quality Center (www.epa.gov/otaq/transp.htm) provides information regarding transportation programs to reduce vehicle air pollution.
120

Potential Mobility Management Emission Reductions Report Summary Victoria Transport Policy Institute
USEPA, Technical Methods for Analyzing Pricing Measures to Reduce Transportation Emissions, USEPA Report #231-R-98-006, (www.epa.gov/clariton/clhtml/pubtitle.html), 1998. USEPA, Parking Alternatives: Making Way for Urban Infill and Brownfield Development, Urban and Economic Development Division, US Environmental Protection Agency, EPA 231-K-99-001 (www.smartgrowth.org/pdf/PRKGDE04.pdf), 1999. USEPA, Directory of Air Quality Economic Incentive Programs, U.S. Environmental Protection Agency (http://yosemite.epa.gov/aa/programs.nsf), 2001. USEPA, Improving Air Quality Through Land Use Activities - EPA Guidance, Transportation and Air Quality, USEPA (www.epa.gov/otaq/transp/traqsusd.htm#eval) EPA420-R-01-001, 2001. USEPA, Transportation Control Measures Program Information Directory, U.S. Environmental Protection Agency (http://yosemite.epa.gov/aa/tcmsitei.nsf), 2002. VTPI, Online TDM Encyclopedia, Victoria Transport Policy Institute (www.vtpi.org), 2002. Kevin Washbrook, Lower Mainland Commuter Preference Survey, School of Resource and Environmental Management, Simon Fraser University (www.sfu.ca), 2002.
121