evaluating the efficacy of value-driven methods: a
TRANSCRIPT

26TH INTERNATIONAL CONFERENCE ON INFORMATION SYSTEMS DEVELOPMENT (ISD2017 CYPRUS)
Evaluating the efficacy of value-driven methods: a controlled experiment
Eric Souza [email protected] Universidade Nova de Lisboa FCT, NOVA LINCS, Monte de Caparica, Portugal
Silvia Abrahão [email protected] Universitat Politècnica de València València, España
Ana Moreira [email protected] Universidade Nova de Lisboa FCT, NOVA LINCS, Monte de Caparica, Portugal
Emilio Insfran [email protected] Universitat Politècnica de València València, España
João Araújo [email protected] Universidade Nova de Lisboa FCT, NOVA LINCS, Monte de Caparica, Portugal
Abstract A value model is used to describe the rationale of how an organization creates, delivers, and captures business value. Value-driven development methods use the notion of “economic value exchange” to define more efficient business strategies and align Information Systems with the organization goals. Current value-driven methods are complex and there isn’t enough empirical evidence about which of the existing methods is more effective under what circumstances. This paper addresses this issue by presenting a controlled experiment aimed at comparing the Dynamic Value Description (DVD) method, a recently defined cognitive early requirements approach, with the well-known e3value method, with respect to their effectiveness, efficiency, perceived ease of use, perceived usefulness and intention to use. The results show that DVD has proved to be a promising method for specifying business value. Keywords: value model, value-driven, controlled experiment.
1. Introduction Business models describe daily behavior of businesses using traditional description languages such as workflow diagrams, UML activity diagrams, and BPMN. These models are used as early requirements specifications for information system development. Value-driven methods emerged more recently to represent the economic point of view in business models, showing how economic values are created and exchanged in an inter-organizational network [13]. Value is at the core of trading, and it defines the relationship between satisfying needs and expectations and the resources required to achieve them [27]. The notion of economic value exchange is important to elaborate and prioritize information system specifications and to facilitate knowledge transfer from business analysts to requirements engineers [18]. Kundisch and John classify 12 business model representations [20], which are still complex, with
brought to you by COREView metadata, citation and similar papers at core.ac.uk
provided by AIS Electronic Library (AISeL)

SOUZA ET AL. EVALUATING THE EFFICACY OF VALUE-DRIVEN METHODS: A CONTROLLED EXPERIMENT
unclear concepts [2], and with no enough empirical evidence about which method is more effective under what circumstances [26]. To address this, we created the Dynamic Value Description (DVD) method [26] , which is a cognitive early requirements approach recently proposed, and which simple and intuitive characteristics are worth comparing with a well-known method, such as e3value [12]. Therefore, this paper describes an empirical research by presenting a controlled experiment aimed at comparing e3value with DVD, with respect to effectiveness, efficiency, perceived ease of use, perceived usefulness and intention to use. The results show that the efficiency and effectiveness of DVD are higher than the actual efficacy of e3value, that the perceived ease of use and intention to use of participants are greater for DVD, and that there is no significant difference between the methods for perceived usefulness. Although further experiments must be carried out to strengthen these results, DVD has proved to be a promising method for specifying business value. The remainder of this paper is organized as follows. Section 2 introduces e3value and Section 3 describes DVD. Section 4 presents the design of the experiment while Section 5 discusses its results and threats to validity. Section 6 discusses related work. Finally, Section 7 concludes this paper and summarizes directions for further work.
2. e3value method e3value [26] contains fifty concepts, according to its metamodel available in [12] the method introduced in [11]. Figure 1 shows an e3value model and the legend lists its main concepts.
Fig. 1. e3value example extracted from [11].
Actors, elementary or composite, are environment entities economically independent. A composite actor is a group actor with value interfaces of the inner elementary actors. Value interfaces group value ports, which provide or request value objects to or from actors or market segments. A market segment is a group of actors sharing common properties. A value exchange is defined by a set of value objects, It happens when actors perform a set of operational activities, known as value activity. Value transfers link two value ports and may be grouped into value transactions. e3value represents value exchange scenarios, inheriting from Use Case Maps the start (Consumer need) and stop (Boundary element) stimuli, and AND, OR and Connect elements [12] (absent in the metamodel). A connection element links a start-stop stimulus to a value interface or links value interfaces of the same actor internally. AND and OR split or collapse paths of value scenarios, reusing start and stop stimuli.
3. Dynamic Value Description method DVD (Dynamic Value Description) is a cognitive early requirements method aimed at analyzing and representing business values exchange [26]. It offers an environment wherein stakeholders can share their economic views in a semi-structured mindmap model. From a DVD model, other goal-oriented models can be derived using model-driven techniques, one per value exchange. The resulting requirements specification is modularized from a business economic perspective, facilitating requirements prioritization. Those goal models must be
ISD2017 CYPRUS
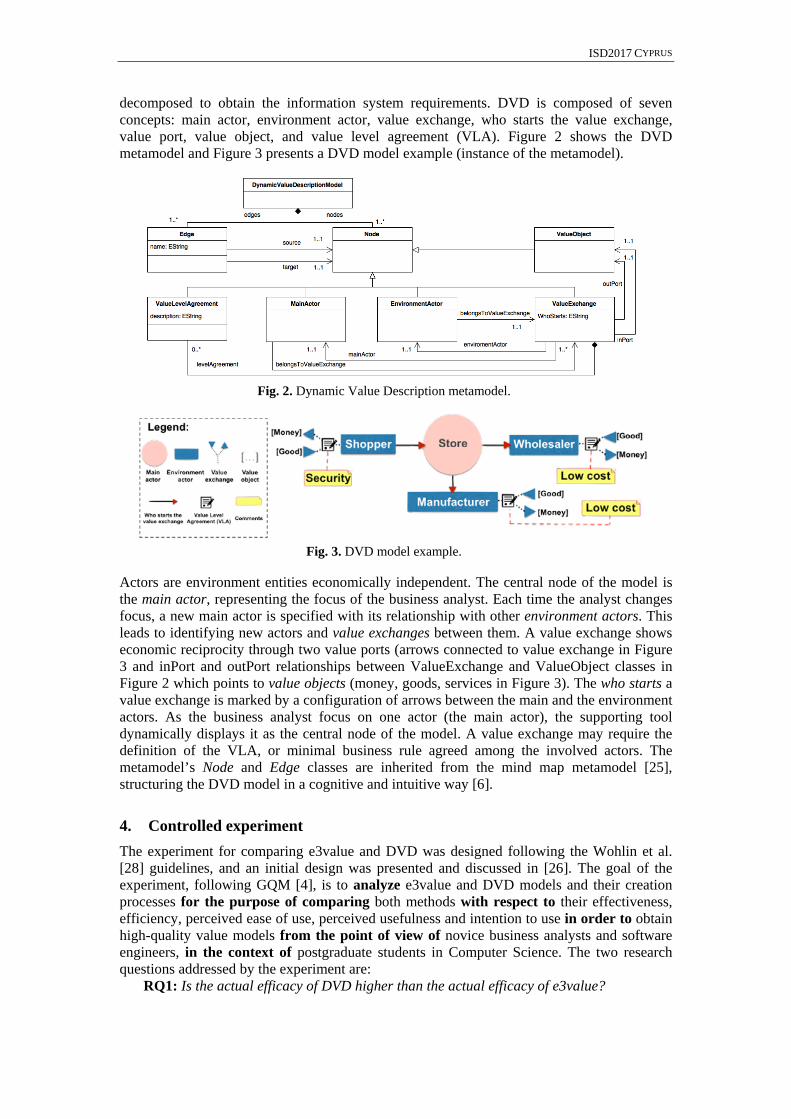
decomposed to obtain the information system requirements. DVD is composed of seven concepts: main actor, environment actor, value exchange, who starts the value exchange, value port, value object, and value level agreement (VLA). Figure 2 shows the DVD metamodel and Figure 3 presents a DVD model example (instance of the metamodel).
Fig. 2. Dynamic Value Description metamodel.
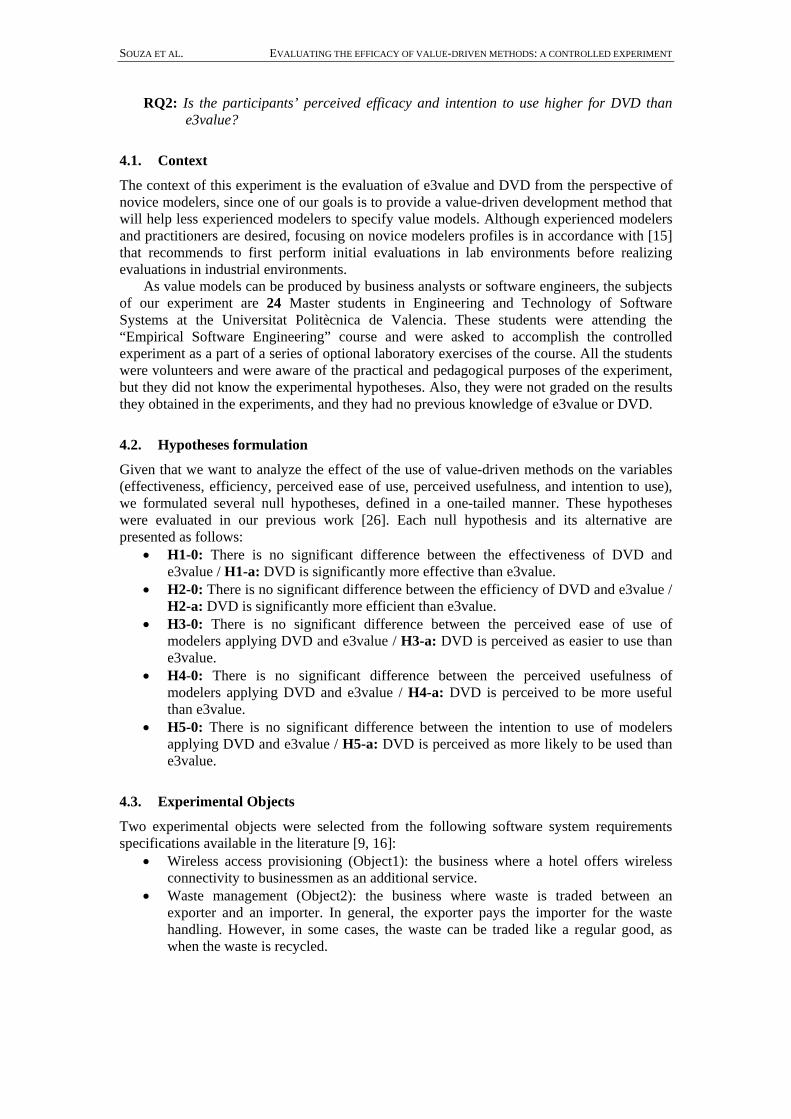
Fig. 3. DVD model example.
Actors are environment entities economically independent. The central node of the model is the main actor, representing the focus of the business analyst. Each time the analyst changes focus, a new main actor is specified with its relationship with other environment actors. This leads to identifying new actors and value exchanges between them. A value exchange shows economic reciprocity through two value ports (arrows connected to value exchange in Figure 3 and inPort and outPort relationships between ValueExchange and ValueObject classes in Figure 2 which points to value objects (money, goods, services in Figure 3). The who starts a value exchange is marked by a configuration of arrows between the main and the environment actors. As the business analyst focus on one actor (the main actor), the supporting tool dynamically displays it as the central node of the model. A value exchange may require the definition of the VLA, or minimal business rule agreed among the involved actors. The metamodel’s Node and Edge classes are inherited from the mind map metamodel [25], structuring the DVD model in a cognitive and intuitive way [6].
4. Controlled experiment The experiment for comparing e3value and DVD was designed following the Wohlin et al. [28] guidelines, and an initial design was presented and discussed in [26]. The goal of the experiment, following GQM [4], is to analyze e3value and DVD models and their creation processes for the purpose of comparing both methods with respect to their effectiveness, efficiency, perceived ease of use, perceived usefulness and intention to use in order to obtain high-quality value models from the point of view of novice business analysts and software engineers, in the context of postgraduate students in Computer Science. The two research questions addressed by the experiment are:
RQ1: Is the actual efficacy of DVD higher than the actual efficacy of e3value?
SOUZA ET AL. EVALUATING THE EFFICACY OF VALUE-DRIVEN METHODS: A CONTROLLED EXPERIMENT
RQ2: Is the participants’ perceived efficacy and intention to use higher for DVD than e3value?
4.1. Context
The context of this experiment is the evaluation of e3value and DVD from the perspective of novice modelers, since one of our goals is to provide a value-driven development method that will help less experienced modelers to specify value models. Although experienced modelers and practitioners are desired, focusing on novice modelers profiles is in accordance with [15] that recommends to first perform initial evaluations in lab environments before realizing evaluations in industrial environments. As value models can be produced by business analysts or software engineers, the subjects of our experiment are 24 Master students in Engineering and Technology of Software Systems at the Universitat Politècnica de Valencia. These students were attending the “Empirical Software Engineering” course and were asked to accomplish the controlled experiment as a part of a series of optional laboratory exercises of the course. All the students were volunteers and were aware of the practical and pedagogical purposes of the experiment, but they did not know the experimental hypotheses. Also, they were not graded on the results they obtained in the experiments, and they had no previous knowledge of e3value or DVD.
4.2. Hypotheses formulation
Given that we want to analyze the effect of the use of value-driven methods on the variables (effectiveness, efficiency, perceived ease of use, perceived usefulness, and intention to use), we formulated several null hypotheses, defined in a one-tailed manner. These hypotheses were evaluated in our previous work [26]. Each null hypothesis and its alternative are presented as follows:
• H1-0: There is no significant difference between the effectiveness of DVD and e3value / H1-a: DVD is significantly more effective than e3value.
• H2-0: There is no significant difference between the efficiency of DVD and e3value / H2-a: DVD is significantly more efficient than e3value.
• H3-0: There is no significant difference between the perceived ease of use of modelers applying DVD and e3value / H3-a: DVD is perceived as easier to use than e3value.
• H4-0: There is no significant difference between the perceived usefulness of modelers applying DVD and e3value / H4-a: DVD is perceived to be more useful than e3value.
• H5-0: There is no significant difference between the intention to use of modelers applying DVD and e3value / H5-a: DVD is perceived as more likely to be used than e3value.
4.3. Experimental Objects
Two experimental objects were selected from the following software system requirements specifications available in the literature [9, 16]:
• Wireless access provisioning (Object1): the business where a hotel offers wireless connectivity to businessmen as an additional service.
• Waste management (Object2): the business where waste is traded between an exporter and an importer. In general, the exporter pays the importer for the waste handling. However, in some cases, the waste can be traded like a regular good, as when the waste is recycled.
ISD2017 CYPRUS
4.4. Design
An initial design of this experiment was published and discussed for a preliminary evaluation [26]. The experiment is planned as a balanced within-participant design with a confounding effect, i.e. the same participants apply both methods with both experimental objects in a different order. We formed two groups (each using one method to one experimental object) with participants randomly assigned. Table 1 summarizes the design of the experiment. The within-participant experimental design is intended to minimize the impact of learning effects on the results since none of the participants repeat any treatment or experimental object during the execution. The comprehension of the software systems requirements may also affect the application of both methods. We alleviated the influence of this factor by selecting two representative software systems with requirements of a complexity suitable for application in the time slot available for the execution of the experiments (2-hour sessions).
Table 1. Experiment design.
Groups Session 1 Session 2 A Object1, e3value Object2, DVD B Object1, DVD Object2, e3value
4.5. Selected variables
The relevant independent variable is the use of each value-driven method with nominal values: DVD and e3value. Thus, the experiment involves creating a value model for two software systems using DVD and e3value. The experimental data gathered allows comparing the effects of both treatments. There are two types of dependent variables in which the treatments are compared: (i) performance-based variables used to assess how well participants perform the experimental task, and to evaluate the actual efficacy of the methods; (ii) perception-based variables used to assess the participants' perceptions of their performance and their subsequent intention to use DVD or e3value, and to evaluate the perceived efficacy of the methods as well as their likely adoption in practice. There are two performance-based variables:
• Efficiency: the time required to apply the method. • Effectiveness: the accuracy and completeness of the value models created with a
particular method (e3value or DVD). We used an approach based on information retrieval theory [10] to get a quantitative assessment for this variable. This same approach has been applied in software engineering experiments [1, 24] to compare models created by participants against an Oracle (the correct model created by an expert) regarding each type of graphic elements through equation (1).
𝑝𝑝𝑝𝑝𝑝𝑝𝑝𝑝𝑝𝑝𝑝𝑝𝑝𝑝𝑝𝑝𝑝𝑝𝑒𝑒𝑒𝑒𝑒𝑒𝑒𝑒𝑒𝑒𝑒𝑒𝑒𝑒 = | 𝑃𝑃𝑒𝑒𝑒𝑒𝑒𝑒𝑒𝑒𝑒𝑒𝑒𝑒𝑒𝑒 ∩ 𝑂𝑂𝑒𝑒𝑒𝑒𝑒𝑒𝑒𝑒𝑒𝑒𝑒𝑒𝑒𝑒|𝑃𝑃𝑒𝑒𝑒𝑒𝑒𝑒𝑒𝑒𝑒𝑒𝑒𝑒𝑒𝑒
, 𝑝𝑝𝑝𝑝𝑝𝑝𝑟𝑟𝑟𝑟𝑟𝑟𝑒𝑒𝑒𝑒𝑒𝑒𝑒𝑒𝑒𝑒𝑒𝑒𝑒𝑒 = | 𝑃𝑃𝑒𝑒𝑒𝑒𝑒𝑒𝑒𝑒𝑒𝑒𝑒𝑒𝑒𝑒 ∩ 𝑂𝑂𝑒𝑒𝑒𝑒𝑒𝑒𝑒𝑒𝑒𝑒𝑒𝑒𝑒𝑒|𝑂𝑂𝑒𝑒𝑒𝑒𝑒𝑒𝑒𝑒𝑒𝑒𝑒𝑒𝑒𝑒
(1)
where Pelement indicates all particular graphical element modeled by a participant, and Oelement means the known correct set of expected type of graphical element that can be easily derived by an Oracle. So, precisionelement measures the correctness of a graphical element belonging to a given value model and recallelement measures the completeness of a value model about its graphical element.
Precision and recall quantitatively summarize two different concepts. Therefore, we used their harmonic mean [10] to get a balance between correctness and completeness of each graphical element within a value model (equation 2):
𝐹𝐹𝑒𝑒𝑒𝑒𝑚𝑚𝑚𝑚𝑚𝑚𝑚𝑚𝑒𝑒 = 2∗ 𝑝𝑝𝑚𝑚𝑒𝑒𝑝𝑝𝑝𝑝𝑚𝑚𝑝𝑝𝑝𝑝𝑒𝑒𝑒𝑒𝑒𝑒𝑒𝑒𝑒𝑒𝑒𝑒𝑒𝑒𝑒𝑒∗ 𝑚𝑚𝑒𝑒𝑝𝑝𝑚𝑚𝑒𝑒𝑒𝑒𝑒𝑒𝑒𝑒𝑒𝑒𝑒𝑒𝑒𝑒𝑒𝑒𝑒𝑒𝑝𝑝𝑚𝑚𝑒𝑒𝑝𝑝𝑝𝑝𝑚𝑚𝑝𝑝𝑝𝑝𝑒𝑒𝑒𝑒𝑒𝑒𝑒𝑒𝑒𝑒𝑒𝑒𝑒𝑒𝑒𝑒+ 𝑚𝑚𝑒𝑒𝑝𝑝𝑚𝑚𝑒𝑒𝑒𝑒𝑒𝑒𝑒𝑒𝑒𝑒𝑒𝑒𝑒𝑒𝑒𝑒𝑒𝑒
(2)
where Fmeasure quantitatively summarizes the accuracy of a value model about its graphical elements and is compared with an Oracle. The effectiveness dependent variable is computed as the arithmetic mean of all Fmeasure. All the measures above assume values between 0 and 1,

SOUZA ET AL. EVALUATING THE EFFICACY OF VALUE-DRIVEN METHODS: A CONTROLLED EXPERIMENT
where 0 is the worst value (indicating that participants’ value models are far from the Oracle) and 1 is the best (indicating that participants’ value models are very similar to the Oracle). The effectiveness variable has been defined to give the same relevance to correctness and completeness of value models for all graphical elements of the value model.
An expert developed the first Oracle prior to the experiment (one for each experiment object). For the e3value case, the first Oracle was extracted from the literature [9, 16]. As value models could have different levels of granularity, the expert developed new Oracles based on the granularity. At the end, we checked the effectiveness of all models created by the participants against the Oracles, and the higher effectiveness result was selected.
There are also three perception-based variables. They are based on TAM [8], which is a widely applied theoretical model to analyze user acceptance and usage behavior of emerging information technologies that have empirical support through validations and replications [19]. The perceived efficacy [8] of a method can be decomposed into the following variables:
• Perceived Ease of Use (PEOU): the degree to which a person believes that learning and using a particular value-driven method would be free of effort.
• Perceived Usefulness (PU): the degree to which a person believes that using a particular method will increase her/his job performance within an organizational context.
• Intention to Use (ITU): the extent to which a person intends to use a particular method. It represents a perceptual judgment of the method’s efficacy, that is, whether it is cost-effective and is commonly used to predict the likelihood of acceptance of a method in practice.
These three subjective variables were measured using a 5-point Likert scale questionnaire with a set of 12 closed-questions: 5 questions for perceived ease of use (PEOU), 5 for perceived usefulness (PU), and 2 for intention to use (ITU)1. They were formulated using the opposing statement format and each question contains two contradictory statements representing the max and min possible values (5 and 1), where 3 is considered a neutral perception. The aggregated value of each variable was calculated as the arithmetical mean of the answers to the questions associated with each perception-based variable. We used Cronbach's alpha test to evaluate the reliability of the survey and of each variable. The variables and the procedure to measure them were evaluated in [26].
4.6. Pilot, preparation, and execution
We conducted a pilot experiment with 2 professors and 1 MSc student in Computer Science at the Universitat Politècnica de Valencia. They were not successively involved in the controlled experiment. The goals of this pilot were to evaluate all experimental material, the instructions on the experimental procedure, and the task completion time. The results indicated that the experimental objects were well suited and that 2-hour was sufficient to accomplish the task.
We defined only one experimental task (create the value model), with steps varying according to the method (e3value or DVD) used. No software tool was used, to avoid possible usability bias. Before the experiment, we carried out a training session to explain the concepts and processes and where participants created a value model following the experimental procedure. During the experiment session, participants received a pencil, eraser, paper sheets, and the printed copy of the experimental material slides introducing business modeling and value-driven development, slides describing the value-driven development method, along with an example of its application, slides describing the e3value and DVD methods, with an example of its implementation, the specification documents of the software systems to be used in the tasks, and the post-experimental questionnaire. The materials were in Spanish, the participants' native language. No interaction among participants was allowed and no time limit was imposed to accomplish the tasks. We gave no details on how to deal with the
1 The questionnaire can be found at https://goo.gl/pmoSFM

ISD2017 CYPRUS
modeling tasks, but any issues with the specification documents were clarified. Finally, participants were asked to register their start and end times for each step performed.
Figure 4 presents the steps to create a value model using e3value (a) and DVD (b). To create the e3value model [12], participants start by identifying a list of scenarios (which are short textual sentences, meaning the product, service, or experience expected by a customer), next they identify the actors (who offers and who receives the product, service or experience expected) from the scenarios’ list, then they create the initial e3value model by using the products and services mentioned in the scenarios’ list and the actors in the actors’list, and, finally, they insert the UCM elements representing the paths of all scenarios.
To create a DVD model, participants start by describing the main actor (the focus of their analysis) and their related environment actors. The model is created like a mind map. Next, participants add the value exchanges to the model, defining the value element related to each value port, and follow by determining the actor originating the value exchange, checking if the value elements are specified in the correct value port. The final step is to define the criteria required for value exchanges to be performed, being crucial to understand the business constraints related to each value exchange. Due to this “main actor” focus, participants need to create as many DVD models as necessary to represent the whole business.
Fig. 4. Processes for the creation of an e3value model (a) and a DVD model (b).
Once the value model was created, participants were asked to answer a post-experimental questionnaire. This questionnaire contains a set of closed-questions, allowing participants to express their opinion on the ease of use, usefulness, and intention to use the method in the future. It also includes two open questions to obtain their feedback regarding the changes they would make to improve the method and their reasons for using a given method in the future (if any). This questionnaire was a Google Form and the data collected was kept anonymously.
The information collected by this questionnaire was the basis to evaluate the perception-based variables (PEOU, PU and ITU). The performance-based variables (effectiveness and efficiency) were evaluated by comparing the value models created by the participants against the value model designed by experts and by analyzing the time registered to perform each experimental step.
4.7. Analysis procedure
We chose statistical tests for their robustness and sensitivity to analyze the data collected and because they have been used in similar experiments ([1], [5]). As usual, in all the tests we decided to accept a 5% probability of committing a Type-I-Error [28], i.e., rejecting the null hypothesis when it is true. We tested the normality of the data distribution by applying the Shapiro–Wilk test. The results of the normality test allow us to select the proper significance test to examine our hypotheses. When data is assumed to be normally distributed (p-value>0.05), we applied the parametric one-tailed t-test for independent samples [17].
SOUZA ET AL. EVALUATING THE EFFICACY OF VALUE-DRIVEN METHODS: A CONTROLLED EXPERIMENT
However, when data could not assume the normal distribution (p-value<0.05), we applied the non-parametric Mann–Whitney test [7].
5. Results and discussion This section discusses the results of the experiment (performance-based variables) and the post-experiment survey questionnaire (perceived-based variables).
5.1. Performance-based variables
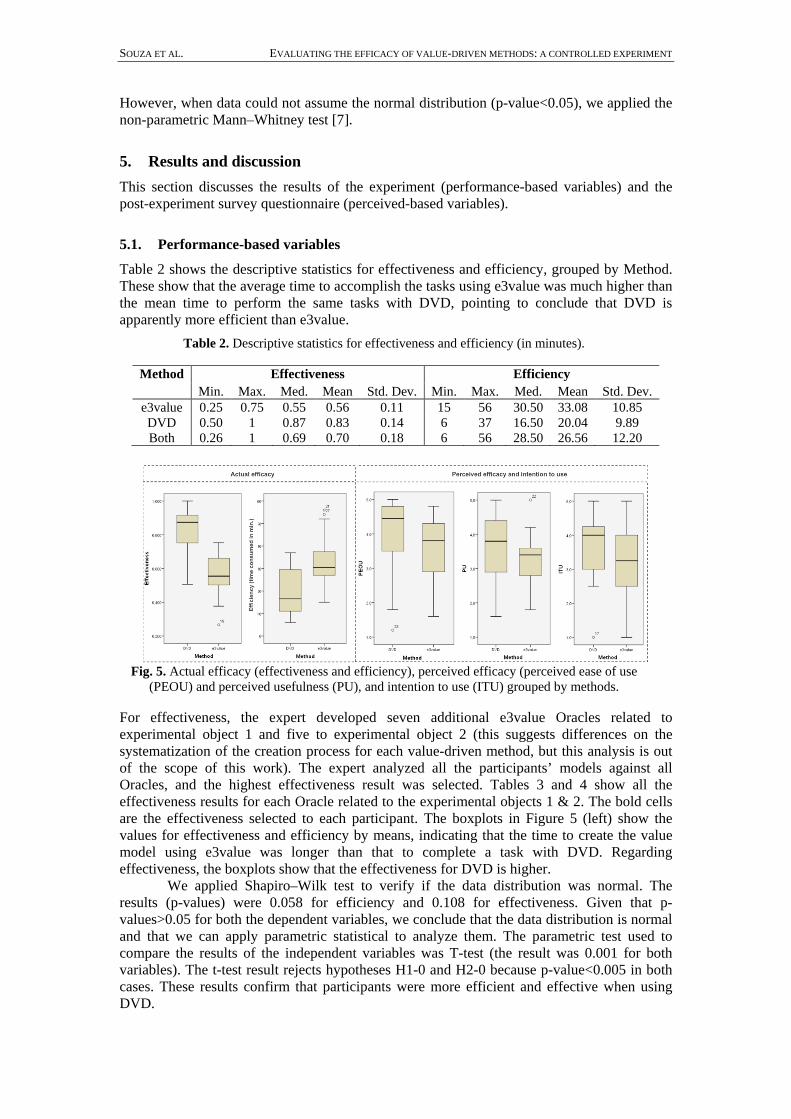
Table 2 shows the descriptive statistics for effectiveness and efficiency, grouped by Method. These show that the average time to accomplish the tasks using e3value was much higher than the mean time to perform the same tasks with DVD, pointing to conclude that DVD is apparently more efficient than e3value.
Table 2. Descriptive statistics for effectiveness and efficiency (in minutes).
Method Effectiveness Efficiency Min. Max. Med. Mean Std. Dev. Min. Max. Med. Mean Std. Dev.
e3value 0.25 0.75 0.55 0.56 0.11 15 56 30.50 33.08 10.85 DVD 0.50 1 0.87 0.83 0.14 6 37 16.50 20.04 9.89 Both 0.26 1 0.69 0.70 0.18 6 56 28.50 26.56 12.20
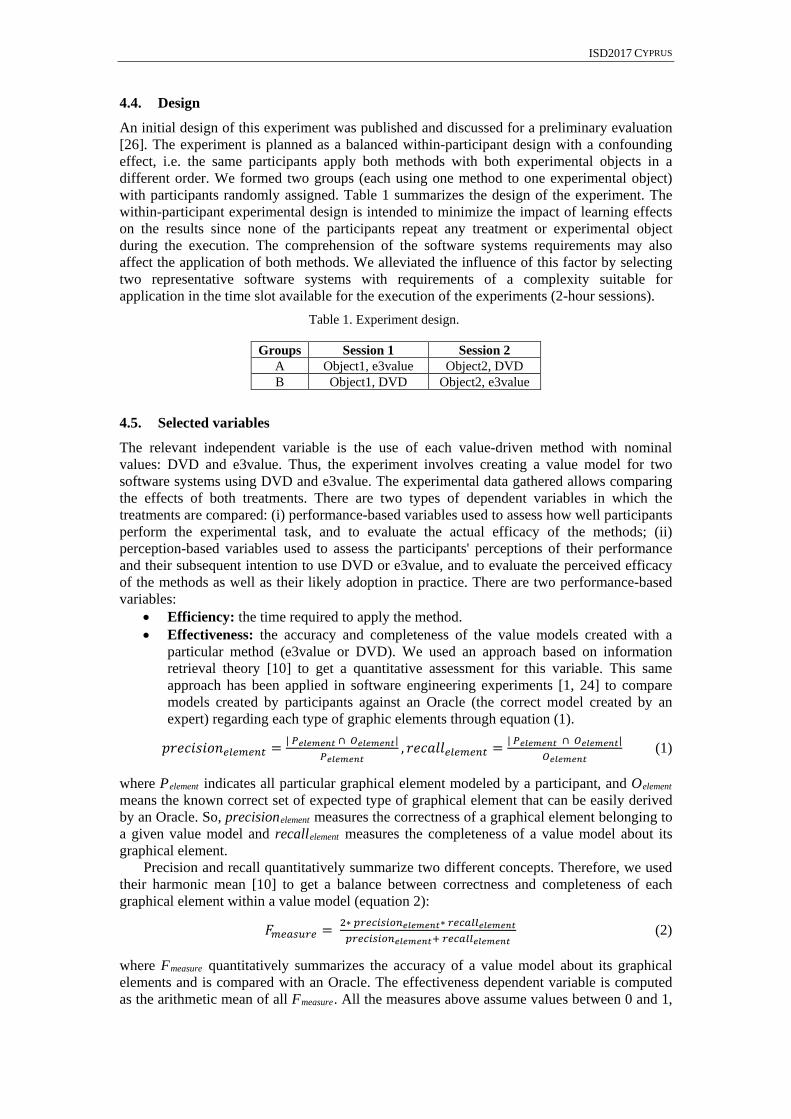
Fig. 5. Actual efficacy (effectiveness and efficiency), perceived efficacy (perceived ease of use
(PEOU) and perceived usefulness (PU), and intention to use (ITU) grouped by methods.
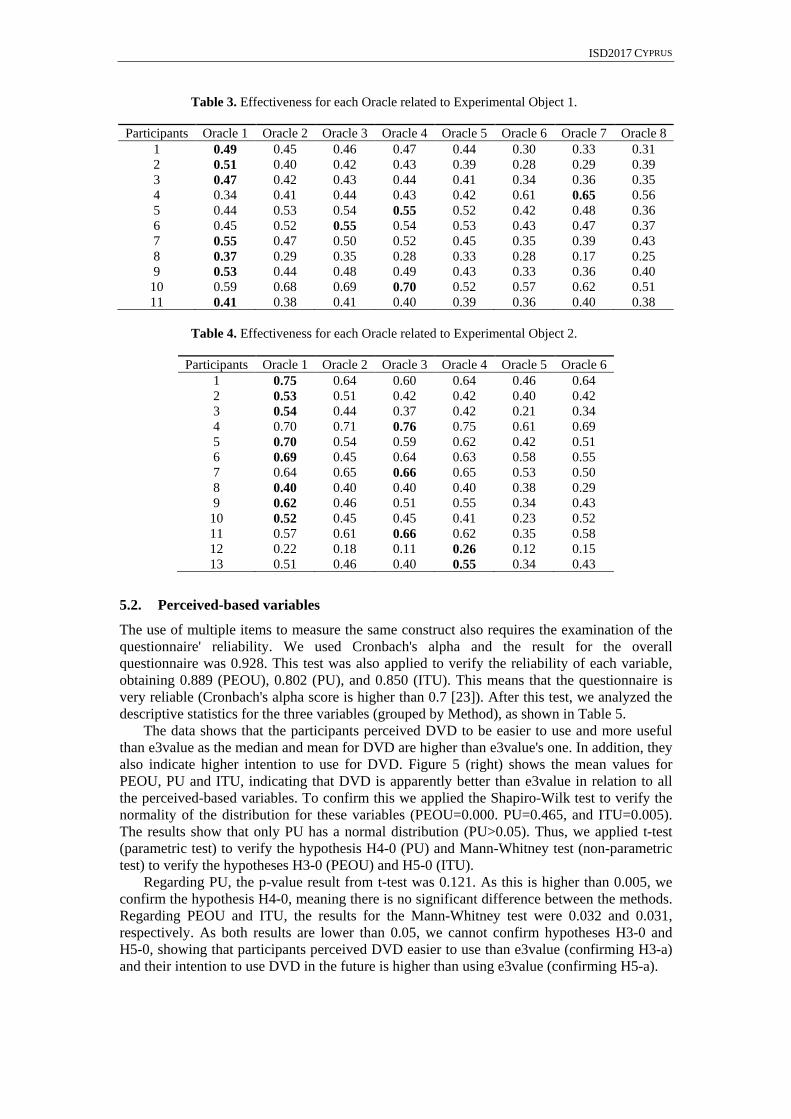
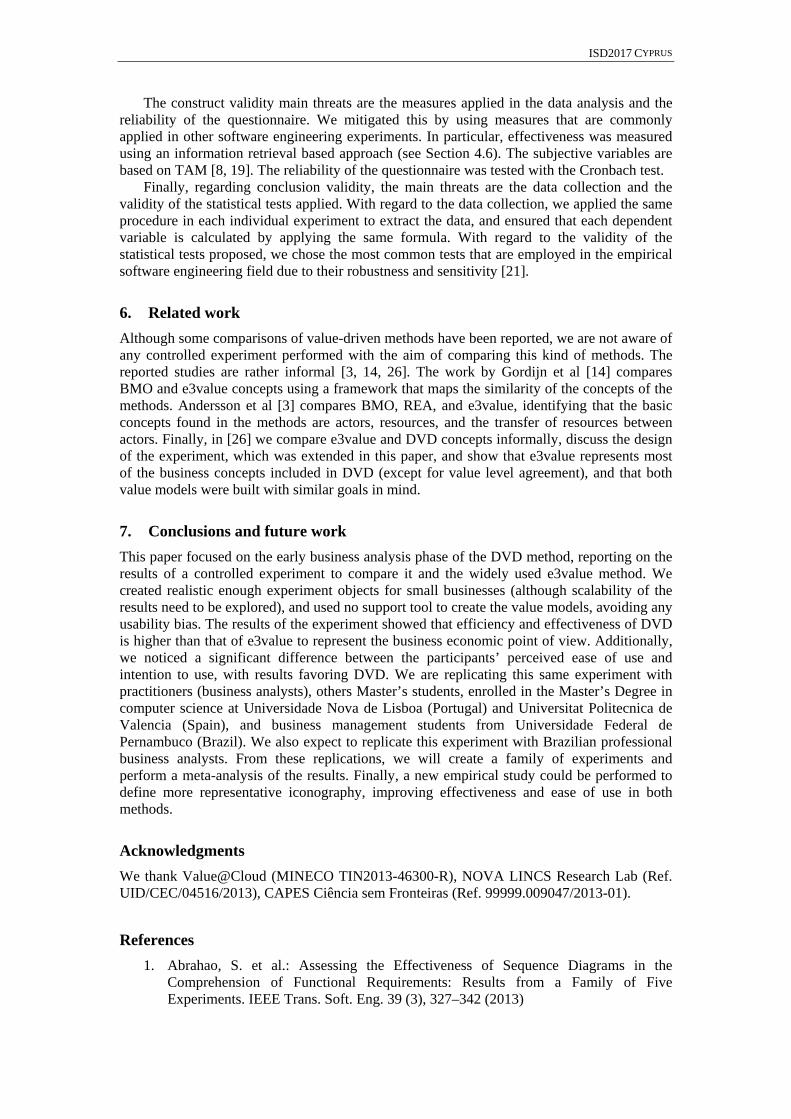
For effectiveness, the expert developed seven additional e3value Oracles related to experimental object 1 and five to experimental object 2 (this suggests differences on the systematization of the creation process for each value-driven method, but this analysis is out of the scope of this work). The expert analyzed all the participants’ models against all Oracles, and the highest effectiveness result was selected. Tables 3 and 4 show all the effectiveness results for each Oracle related to the experimental objects 1 & 2. The bold cells are the effectiveness selected to each participant. The boxplots in Figure 5 (left) show the values for effectiveness and efficiency by means, indicating that the time to create the value model using e3value was longer than that to complete a task with DVD. Regarding effectiveness, the boxplots show that the effectiveness for DVD is higher.
We applied Shapiro–Wilk test to verify if the data distribution was normal. The results (p-values) were 0.058 for efficiency and 0.108 for effectiveness. Given that p-values>0.05 for both the dependent variables, we conclude that the data distribution is normal and that we can apply parametric statistical to analyze them. The parametric test used to compare the results of the independent variables was T-test (the result was 0.001 for both variables). The t-test result rejects hypotheses H1-0 and H2-0 because p-value<0.005 in both cases. These results confirm that participants were more efficient and effective when using DVD.
ISD2017 CYPRUS
Table 3. Effectiveness for each Oracle related to Experimental Object 1.
Participants Oracle 1 Oracle 2 Oracle 3 Oracle 4 Oracle 5 Oracle 6 Oracle 7 Oracle 8 1 0.49 0.45 0.46 0.47 0.44 0.30 0.33 0.31 2 0.51 0.40 0.42 0.43 0.39 0.28 0.29 0.39 3 0.47 0.42 0.43 0.44 0.41 0.34 0.36 0.35 4 0.34 0.41 0.44 0.43 0.42 0.61 0.65 0.56 5 0.44 0.53 0.54 0.55 0.52 0.42 0.48 0.36 6 0.45 0.52 0.55 0.54 0.53 0.43 0.47 0.37 7 0.55 0.47 0.50 0.52 0.45 0.35 0.39 0.43 8 0.37 0.29 0.35 0.28 0.33 0.28 0.17 0.25 9 0.53 0.44 0.48 0.49 0.43 0.33 0.36 0.40
10 0.59 0.68 0.69 0.70 0.52 0.57 0.62 0.51 11 0.41 0.38 0.41 0.40 0.39 0.36 0.40 0.38
Table 4. Effectiveness for each Oracle related to Experimental Object 2.
Participants Oracle 1 Oracle 2 Oracle 3 Oracle 4 Oracle 5 Oracle 6 1 0.75 0.64 0.60 0.64 0.46 0.64 2 0.53 0.51 0.42 0.42 0.40 0.42 3 0.54 0.44 0.37 0.42 0.21 0.34 4 0.70 0.71 0.76 0.75 0.61 0.69 5 0.70 0.54 0.59 0.62 0.42 0.51 6 0.69 0.45 0.64 0.63 0.58 0.55 7 0.64 0.65 0.66 0.65 0.53 0.50 8 0.40 0.40 0.40 0.40 0.38 0.29 9 0.62 0.46 0.51 0.55 0.34 0.43
10 0.52 0.45 0.45 0.41 0.23 0.52 11 0.57 0.61 0.66 0.62 0.35 0.58 12 0.22 0.18 0.11 0.26 0.12 0.15 13 0.51 0.46 0.40 0.55 0.34 0.43
5.2. Perceived-based variables
The use of multiple items to measure the same construct also requires the examination of the questionnaire' reliability. We used Cronbach's alpha and the result for the overall questionnaire was 0.928. This test was also applied to verify the reliability of each variable, obtaining 0.889 (PEOU), 0.802 (PU), and 0.850 (ITU). This means that the questionnaire is very reliable (Cronbach's alpha score is higher than 0.7 [23]). After this test, we analyzed the descriptive statistics for the three variables (grouped by Method), as shown in Table 5.
The data shows that the participants perceived DVD to be easier to use and more useful than e3value as the median and mean for DVD are higher than e3value's one. In addition, they also indicate higher intention to use for DVD. Figure 5 (right) shows the mean values for PEOU, PU and ITU, indicating that DVD is apparently better than e3value in relation to all the perceived-based variables. To confirm this we applied the Shapiro-Wilk test to verify the normality of the distribution for these variables (PEOU=0.000. PU=0.465, and ITU=0.005). The results show that only PU has a normal distribution (PU>0.05). Thus, we applied t-test (parametric test) to verify the hypothesis H4-0 (PU) and Mann-Whitney test (non-parametric test) to verify the hypotheses H3-0 (PEOU) and H5-0 (ITU).
Regarding PU, the p-value result from t-test was 0.121. As this is higher than 0.005, we confirm the hypothesis H4-0, meaning there is no significant difference between the methods. Regarding PEOU and ITU, the results for the Mann-Whitney test were 0.032 and 0.031, respectively. As both results are lower than 0.05, we cannot confirm hypotheses H3-0 and H5-0, showing that participants perceived DVD easier to use than e3value (confirming H3-a) and their intention to use DVD in the future is higher than using e3value (confirming H5-a).

SOUZA ET AL. EVALUATING THE EFFICACY OF VALUE-DRIVEN METHODS: A CONTROLLED EXPERIMENT
Table 5. Descriptive statistics for the perception variables
Method PEOU PU Min. Max. Med. Mean Std. Dev. Min. Max. Med. Mean Std. Dev.
e3value 1.6 4.8 3.80 3.59 0.93 1.8 5 3.40 3.29 0.66 DVD 1.2 5 4.45 4.06 1.05 1.6 5 3.80 3.66 0.95
ITU Min. Max. Med. Mean Std. Dev.
e3value 1 5 3.25 3.19 1.09 DVD 1 5 4.00 3.75 0.96
5.3. Discussion
With regard to the RQ1 (Is the actual efficacy of DVD higher than the actual efficacy of e3value?), the data analysis results indicate a significant difference between the methods concerning efficiency (time to create the model) and effectiveness (correctness and completeness of the model). A plausible justification for this result is that DVD facilitates the representation of the business economic point of view, thanks to its cognitive-based, semi-structured nature. The questionnaire open answers hint that the e3value is a weak separation of concerns; it represents static (e.g., objects) and dynamic (e.g., scenarios) business concepts in the same model, making the value model complex and arduous to build.
With regard to RQ2 (Is the participants’ perceived efficacy and intention to use higher for DVD than e3value?) the data analysis results show that the perceived efficacy is higher for DVD. However, results show no significant difference between the methods for perceived usefulness (PU). This is not surprising as both methods share the same goal and represent the same central economic concepts. For perceived ease of use (PEOU), the results indicate that DVD is significantly easier to use than e3value. We also associate this result with DVD being a cognitive approach. This conclusion is reinforced by 9 positive answers extracted from the participants’ questionnaire, for instance, “(DVD) shows clearly among those who make the most important exchanges”. The questionnaire open answers also hint that a new empirical study on defining a more representative iconography based on Moody's physics of notation theory [22] would be useful, to improve both methods ease of use. Finally, regarding the intention to use the results indicate significantly higher values in favor of DVD.
5.4. Threats to Validity
Certain issues could threaten the validity of this experiment. With regard to internal validity, the main threats are the learning effect, participant experience, information exchange among participants, and understandability of the documents. The learning effect was mitigated by ensuring that each group of participants worked with the two methods, on two different experimental objects. Participants’ experience was not an issue as none of them had previous experience in value-driven development. To minimize the information exchange among participants, they were monitored by the experimenters to avoid communication biases while performing the tasks. Finally, understandability of the material was alleviated by performing a pilot study.
With regard to external validity, the main threats are representativeness of the results and the size and complexity of the tasks. The representativeness of the results may be affected by the software systems used and the participants' context selected. With regard to the selection of software systems, we mitigated this by considering a set of artifacts with similar size and complexity, containing representative artifacts of an existing value-driven development method (i.e., e3value). The size and complexity of the tasks may also affect the external validity. We used small tasks since a controlled experiment requires participants to complete the assigned tasks in a limited amount of time.
ISD2017 CYPRUS
The construct validity main threats are the measures applied in the data analysis and the reliability of the questionnaire. We mitigated this by using measures that are commonly applied in other software engineering experiments. In particular, effectiveness was measured using an information retrieval based approach (see Section 4.6). The subjective variables are based on TAM [8, 19]. The reliability of the questionnaire was tested with the Cronbach test.
Finally, regarding conclusion validity, the main threats are the data collection and the validity of the statistical tests applied. With regard to the data collection, we applied the same procedure in each individual experiment to extract the data, and ensured that each dependent variable is calculated by applying the same formula. With regard to the validity of the statistical tests proposed, we chose the most common tests that are employed in the empirical software engineering field due to their robustness and sensitivity [21].
6. Related work Although some comparisons of value-driven methods have been reported, we are not aware of any controlled experiment performed with the aim of comparing this kind of methods. The reported studies are rather informal [3, 14, 26]. The work by Gordijn et al [14] compares BMO and e3value concepts using a framework that maps the similarity of the concepts of the methods. Andersson et al [3] compares BMO, REA, and e3value, identifying that the basic concepts found in the methods are actors, resources, and the transfer of resources between actors. Finally, in [26] we compare e3value and DVD concepts informally, discuss the design of the experiment, which was extended in this paper, and show that e3value represents most of the business concepts included in DVD (except for value level agreement), and that both value models were built with similar goals in mind.
7. Conclusions and future work This paper focused on the early business analysis phase of the DVD method, reporting on the results of a controlled experiment to compare it and the widely used e3value method. We created realistic enough experiment objects for small businesses (although scalability of the results need to be explored), and used no support tool to create the value models, avoiding any usability bias. The results of the experiment showed that efficiency and effectiveness of DVD is higher than that of e3value to represent the business economic point of view. Additionally, we noticed a significant difference between the participants’ perceived ease of use and intention to use, with results favoring DVD. We are replicating this same experiment with practitioners (business analysts), others Master’s students, enrolled in the Master’s Degree in computer science at Universidade Nova de Lisboa (Portugal) and Universitat Politecnica de Valencia (Spain), and business management students from Universidade Federal de Pernambuco (Brazil). We also expect to replicate this experiment with Brazilian professional business analysts. From these replications, we will create a family of experiments and perform a meta-analysis of the results. Finally, a new empirical study could be performed to define more representative iconography, improving effectiveness and ease of use in both methods.
Acknowledgments We thank Value@Cloud (MINECO TIN2013-46300-R), NOVA LINCS Research Lab (Ref. UID/CEC/04516/2013), CAPES Ciência sem Fronteiras (Ref. 99999.009047/2013-01).
References 1. Abrahao, S. et al.: Assessing the Effectiveness of Sequence Diagrams in the
Comprehension of Functional Requirements: Results from a Family of Five Experiments. IEEE Trans. Soft. Eng. 39 (3), 327–342 (2013)

SOUZA ET AL. EVALUATING THE EFFICACY OF VALUE-DRIVEN METHODS: A CONTROLLED EXPERIMENT
2. Al-Debei, M.M., Avison, D.: Developing a unified framework of the business model concept. European Journal of Information Systems. 19 (3), 359–376 (2010)
3. Andersson, B. et al.: Towards a Reference Ontology for Business Models. In: de Lucena, C.J.P. (ed.) Experiences with Model Reuse: Non-Functional Requirements Catalogues for Ubiquitous Systems. pp. 482–496. Springer (2006)
4. Basili, V.R., Rombach, H.D.: The Tame Project - Towards Improvement-Oriented Software Environments. IEEE Trans. Soft. Eng. 14 (6), 758–773 (1988)
5. Briand, L.C., Labiche, Y., Di Penta, M., Yan-Bondoc, H.: An experimental investigation of formality in UML-based development. IEEE Trans. Soft. Eng. (2005)
6. Buzan, T., Buzan, B.: The Mind Map Book. Reed Business Information, Inc. (1996) 7. Conover, W.J.: Practical Nonparametric Statistics. Wiley India Pvt. Limited (2006) 8. Davis, F.D.: Perceived usefulness, perceived ease of use, and user acceptance of
information technology. MIS quarterly. 13 (3), 319 (1989) 9. Derzsi, Z., Gordijn, J.: A Framework for Business/IT Alignment in Networked Value
Constellations. BUSITAL. (2006) 10. Frakes, W.B., Baeza-Yates, R.: Information Retrieval: Data Structures & Algorithms.
Prentice-Hall, Inc., Upper Saddle River, New Jersey, USA (1992) 11. Gordijn, J.: E3-value in a Nutshell. International Workshop on e-Business Modeling.
1–12 (2002) 12. Gordijn, J.: Value-based Requirements Engineering. (2002) 13. Gordijn, J., Akkermans, H.: Designing and evaluating e-business models. IEEE Intell.
Syst. 16 (4), 11–17 (2001) 14. Gordijn, J. et al.: Comparing Two Business Model Ontologies for Designing e-
Business Models and Value Constellations. Bled eConference. (2005) 15. Gorschek, T., Wohlin, C., Garre, P., Larsson, S.: A model for technology transfer in
practice. IEEE Software. 23 (6), 88–95 (2006) 16. Huemer, C., Schmidt, A., Werthner, H.: A UML profile for the e3-value e-business
model ontology. Third International Workshop on Business/IT Alignment and Interoperability (BUSITAL“08) held in conjunction with CAiSE”08. (2008)
17. Juristo, N., Moreno, A.M.: Basics of Software Engineering Experimentation, 1st edition. Springer Publishing Company, Incorporated (2010)
18. Kartseva, V. et al.: Towards Control Patterns for Smart Business Networks. Proceedings of the Smart Business Networks Initiative Discovery Session. (2006)
19. King, W.R., He, J.: A meta-analysis of the technology acceptance model. Information & Management. 43 (6), 740–755 (2006)
20. Kundisch, D., John, T.: Business Model Representation Incorporating Real Options: An Extension of e3-Value. Presented at the 45th Hawaii International Conference on System Sciences (HICSS), (2012)
21. Maxwell, K.: Applied statistics for software managers. Software Quality Institute Series, Prentice Hall (2002)
22. Moody, D.: The Physics of Notations: Toward a Scientific Basis for Constructing Visual Notations in Software Engineering. IEEE Trans. Soft. Eng. (2009)
23. Nunnally, J.: Psychometric theory. McGraw-Hill, New York (1978) 24. Scanniello, G., Erra, U.: Distributed modeling of use case diagrams with a method
based on think-pair-square: Results from two controlled experiments. Journal of Visual Languages & Computing. 25 (4), 494–517 (2014)
25. Siochos, V., Papatheodorou, C.: Developing a Formal Model for Mind Maps. Presented at the First Workshop on Digital Information Management, Greece (2011)
26. Souza, E. et al.. Comparing Value-Driven Methods: an experiment design. Second International Workshop on Human Factors in Modeling. Saint Malo, France, 2016.
27. The Institute of Value Management: What is Value?, https://ivm.org.uk/what-is-value-management, Accessed: July 21, 2016
28. Wohlin, C., Runeson, P., Höst, M., Ohlsson, M.C., Regnell, B., Wesslén, A.: Experimentation in Software Engineering. Springer Berlin Heidelberg (2012)