evaluating the efficacy of an adaptation...
TRANSCRIPT

EVALUATING THE EFFICACY OF AN ADAPTATION OF PALS FOR MATH
IN A SEVENTH GRADE CLASSROOM
Alexis Marie Berry Kiburis, M.S.
B.A. University of New Hampshire, 2007
M.S. University of Southern Maine, 2010
This manuscript represents a dissertation submitted in partial fulfillment of the
requirements for the degree of Doctor of Psychology (in School Psychology)
University of Southern Maine
May 2012
Advisory Committee:
Rachel Brown-Chidsey, Associate Professor of School Psychology, Advisor
Mark W. Steege, Professor of School Psychology
David L. Silvernail, Professor of Research and Evaluation

ii
© 2012 Alexis Marie Berry Kiburis
All Rights Reserved

iii
LIBRARY RIGHTS STATEMENT
In presenting the Dissertation, EVALUATING THE EFFICACY OF AN ADAPTATION
OF PALS FOR MATH IN A SEVENTH GRADE CLASSROOM, in partial fulfillment
of the requirements for the PsyD in School Psychology at the University of Southern
Maine, I agree that the Library shall make it freely available for review. I further agree
that permission for copying, as provided for by the Copyright Law of the United States
(Title 17, U.S. Code), of this Dissertation for scholarly purposes may be granted. It is
understood that any copying or publications of this Dissertation for financial gain shall
not be allowed without my written permission.
I hereby grant permission to the University of Southern Maine Library to use my
Dissertation for scholarly purposes.
Alexis Marie Berry Kiburis
Date
EVALUATING THE EFFICACY OF AN ADAPTATION OF PALS FOR MATH
IN A SEVENTH GRADE CLASSROOM
Alexis Kiburis, M.S.
Dissertation Advisor: Rachel Brown-Chidsey, PhD
An Abstract of the Dissertation Submitted in Partial Fulfillment of the Requirements for
the Degree of Doctor of Psychology (in School Psychology)
University of Southern Maine
May 2012
In an attempt to validate and expand the potential application of PALS for math in
a wider variety of settings, this research study examined the effects of implementing a
modified version of PALS for math with seventh grade students in regular education
mathematics classes. Utilizing a pre-post group design with a nested within-subject ABC
single case design, the results of this study suggested that an adaptation of PALS for math
for seventh grade students resulted in significant improvement in posttest mathematics
computation performance within the experimental group when their pretest mathematics
computation scores were considered as covariates. When comparing the performance of
lower performing and higher-performing students, lower performing students
demonstrated higher average weekly ROI in comparison to higher-performing students.

The results of this study suggest that implementing an adaptation of PALS for math with
seventh grade students systematically provides opportunities for all students to engage in
mathematical computation practice and provides students with high levels of error
correction and feedback. PALS for math provides educators with a supplementary
intervention that helps to support groups of students with diverse levels of mathematics
achievement. The limitations and implications for future research are considered.
v
ACKNOWLEDGEMENTS
I would like to express my gratitude to my committee Dr. Rachel Brown-Chidsey
Dr. David Silvernail Dr. Mark Steege
for providing their assistance and expertise.
I am obliged to my colleagues who helped with data collection and provided support for this project.
Rebekah Bickford Amanda Zangrillo
I am appreciative of the Middle School administration and faculty who supported this research.
I owe my sincere thankfulness to my husband, my parents, my family, and my friends. Your encouragement has been monumental.

vi
TABLE OF CONTENTS
LIST OF TABLES ............................................................................................................. ix
LIST OF FIGURES .............................................................................................................x
Chapter
1. INTRODUCTION .........................................................................................................1
2. DESCRIPTION OF THE INTERVENTION ................................................................3
3. LITERATURE REVIEW ..............................................................................................5
Research Support for the Components of PALS for Math ......................................5
Class-Wide Peer Tutoring (CWPT) .............................................................6
The Importance of Student Training ............................................................8
Research Support for PALS for Math ....................................................................10
The Efficacy of PALS for Math at the Elementary Level .........................10
The Efficacy of PALS for Math at the Secondary Level ...........................14
The Social Validity of PALS for Math ......................................................15
Summary of Literature Review ..............................................................................17
4. RESEARCH QUESTIONS AND HYPOTHESES .....................................................18
5. METHOD ....................................................................................................................20
Design ....................................................................................................................20
Participants .............................................................................................................21
Setting ....................................................................................................................22
Materials ................................................................................................................23
Assessment Materials .................................................................................23
Training Materials ......................................................................................24
viii
Intervention Materials ................................................................................24
Procedures and Schedule .......................................................................................25
Baseline ......................................................................................................25
Teacher Training ........................................................................................25
Student Pairing ...........................................................................................26
Student Training .........................................................................................26
Intervention: Fractions Phase .....................................................................26
No-PALS Control Group ...........................................................................27
Intervention: Integers Phase .......................................................................28
Treatment Integrity and Assessment Accuracy .....................................................28
Data Analysis Methods ..........................................................................................29
6. RESULTS ....................................................................................................................30
Treatment Integrity and Assessment Accuracy .....................................................30
Research Question #1: PALS Effects ....................................................................32
Research Question #2: Outcomes by Student Groups ...........................................36
Research Question #3: Lower Performing Students ..............................................38
7. DISCUSSION ..............................................................................................................40
8. SUMMARY .................................................................................................................47
REFERENCES ..................................................................................................................49
APPENDIX A ....................................................................................................................52
APPENDIX B ....................................................................................................................56
BIOGRAPHY OF THE AUTHOR ....................................................................................58


ix
LIST OF TABLES Table 1: Participant and School Demographics .................................................................22
Table 2: Treatment Integrity Data ......................................................................................31
Table 3: Inter-Observer Agreement of Treatment Integrity ..............................................31
Table 4: Inter-Scorer Agreement of Assessment Measures ...............................................32
Table 5: M-COMP Scores .................................................................................................32
Table 6: Fractions-CBM Scores ........................................................................................34
Table 7: ANCOVA Results ...............................................................................................35
Table 8: Comparing AIMSweb® National Norms to Sample Population’s Data .............36
Table 9: M-COMP Average Weekly ROI by Group and Student Performance Level .....37
Table 10: M-COMP Data and Weekly ROI for Three Lower Performing Students .........38
x
LIST OF FIGURES
Figure1: Fractions-CBM Data for Three Lower Performing Students ..............................39
Figure 2: Integers-CBM Data for Three Lower Performing Students ...............................39

1
Introduction
During the 20th century, the United States was a frontrunner in mathematical
competence, which in turn brought numerous advantages in technology, medicine, health,
defense, and economics. However, recent reports of student progress, based on the
National Assessment of Educational Progress (NAEP), indicated that 32% of American
eighth graders are performing proficiently in mathematics and only 23% of American
twelfth graders are performing proficiently in mathematics (National Mathematics
Advisory Panel, 2008). Without considerable changes to our current educational system,
the United States will be forced to resign as a leader in technical expertise. In addition to
the success of the nation as a whole, improvement in mathematics instruction is also of
considerable importance to individual students and families. Success in mathematics,
particularly in Algebra, provides students with an increased likelihood for future
accomplishments and economic opportunities. More specifically, research has
demonstrated that students who complete Algebra II are more than twice as likely to
receive college degrees.
The National Mathematics Advisory Panel (2008) reported that there is a notable
decline in mathematics proficiency as students in the United States reach late middle
school and begin to engage with more advanced mathematical concepts, particularly
Algebra. Thus, researchers and educators have begun to explore ways to better set the
foundation for preparing students to be successful with more advanced material. The
National Mathematics Advisory Panel (2008) identified difficulties with fractions and
integers as two significant, yet common, barriers to students’ success with Algebra.
Additionally, the National Mathematics Advisory Panel (2008) identified instructional

2
strategies that offer opportunities for increased student learning, such as peer assisted
learning.
Peer assisted learning is a type of interactive learning, which may be used to
support students in a socially inclusive manner in core curriculum areas, such as
mathematics and literacy. In chapter seven of the National Mathematics Advisory Panel’s
Final Report (2008), the topics of teacher-directed and student-centered instruction are
explored. As stated in the report, cooperative learning may be used for a variety of
purposes, including: tutoring, enrichment, brainstorming, and as an intermittent substitute
for independent practice. While research suggests that collaborative learning may be
beneficial for student learning outcomes, the panel suggested that classroom instruction
in mathematics should not be entirely teacher-directed or entirely student-centered.
Instead, the panel suggested that components from both of these teaching methodologies
could be combined in an effort to support student learning. Multiple cooperative learning
approaches exist, including: Team Assisted Individualization (TAI), Student Teams-
Achievement Division, Peer-Assisted Learning Strategies (PALS) for math, and a range
of other variations on peer-to-peer learning. The panel suggested that some evidence does
exist to support the use of peer tutoring at the elementary grades; however, additional
research on this topic is necessary.
The purpose of this study was to examine the effects of implementing a modified
version of PALS with seventh grade students in regular education mathematics classes.
The focus of the supplemental instruction was on two of the problematic skill areas
identified by the National Mathematics Advisory Panel: fractions and integers. More
specifically, the researcher investigated the extent to which an adaptation of PALS for

3
math, as a supplement to an existing curriculum, would result in a greater increase in
math performance among seventh grade students, in comparison to having students
complete math problem worksheets independently. Furthermore, the study examined the
extent to which lower performing and higher-performing students benefitted from the
intervention.
Description of the Intervention
PALS for math is a form of dyadic instruction that has demonstrated efficacy for
improving mathematics computation, as well as concepts and application skills, among
various populations of students in Kindergarten through sixth grade. A version of class-
wide peer tutoring (CWPT), PALS for math is designed as a way to increase the amount
of time that students spend engaged in math practice and also to increase opportunities to
receive immediate corrective feedback. PALS for math was developed by Doug Fuchs,
PhD, and Lynn Fuchs, PhD, in an effort to expand the types of mathematics skills
targeted by CWPT (Fuchs, Fuchs, Karns, & Phillips, 2009). Extending beyond CWPT’s
supplemental instruction for math facts, PALS for math includes materials to supplement
instruction on calculation, concepts, and applications within the general curriculum for
students in Kindergarten through sixth grade. The efficacy of this program has been
demonstrated through research and PALS for math is currently listed as an effective
educational practice in the Johns Hopkins University’s Best Evidence Encyclopedia
(Johns Hopkins University, 2012).
This intervention involves assigning students into pairs, based on mathematics
skills, and providing opportunities for the pairs to engage in peer-to-peer learning
sessions twice per week for about 30 minutes per session. Each PALS for math unit is

4
designed to cover a specific mathematics topic over a period of two weeks, or four
sessions. PALS for math includes many of the components that are considered essential
for teaching new academic skills, including: the use of small interactive groups during
instruction, the use of directed questioning and responses, breaking tasks down into parts
and gradually fading prompts, and the use of extensive practice with feedback.
During each session, the students complete two major activities: coaching and
practice. During coaching, each member of the pair takes a turn playing the roles of
coach and player. The higher-performing student of each pair is assigned the role of first
coach and coaches the first half of a coaching worksheet. During coaching, the student
follows a scripted, stepwise guide to solving the particular problem type, while also
providing immediate error correction. The lower performing student is assigned the role
of second coach and coaches during the second half of the coaching worksheet. During
the coaching portion of the session, the teacher monitors the pairs and awards points to
each pair on a point sheet, contingent on appropriate behavior. During practice, students
independently complete a timed drill practice worksheet, which contains a variety of
types of math problems. After five minutes have elapsed, students switch practice
worksheets with their partners and score one point for each correctly answered math
problem. Each student in each pair marks his or her earned points during the practice
session on his or her point sheet and the pair with the highest score is recognized and
congratulated.
An important component of PALS for math is the implementation of student
training lessons. Before the intervention is implemented with the students, a training
procedure is completed with the entire class. Training procedures are outlined over the

5
course of five class days in the teacher’s manual of the intervention materials. Scripts and
outlines are available for each of the five days of training. Additionally, videos are
available to provide students with a model of appropriate interactions and to assist in
student comprehension. The cost of PALS for math implementation is relatively
affordable and is advertised as being practical and effective (Vanderbilt Kennedy Center,
2012). A summary of the research related to PALS for math follows in this literature
review.
Literature Review
Research Support for the Components of PALS for Math
PALS for math was originally designed based on CWPT, which was initially
developed at Juniper Gardens Children’s Project in Kansas City (Delquadri, Greenwood,
Whorton, Carte, & Hall, 1986). CWPT is a dyadic form of instruction that has
demonstrated efficacy for teaching math facts and computation to elementary-aged
students. This instructional procedure is based on several principles, such as: providing
increased opportunities for students to respond, focusing on the functionality of academic
skill areas, and implementing behavioral principles to encourage responding. Similar to
CWPT, PALS for math also includes dyadic instruction and peer-to-peer learning. In
addition, PALS for math includes a training period, in order to ensure that students
understand the purpose of PALS for math, as well as their roles and responsibilities
during each lesson. This section of the literature review will explore the research that
supports the essential features of PALS for math: CWPT and the inclusion of a training
period for student participants.

6
Class-wide Peer Tutoring (CWPT). Greenwood, Delquadri, and Hall (1989)
conducted a four-year longitudinal investigation, centered on the efficacy of CWPT. The
researchers focused their investigation around comparing the differences between the
classroom dynamics, student behaviors, and academic achievement of low-SES and high-
SES elementary students. More specifically, the authors were interested to see how a
CWPT intervention would impact student learning over the course of four years. The
sample consisted of 94 first, second, third, and fourth grade classroom teachers and a
total of 416 first grade students from two low-SES elementary schools and one high-SES
elementary school. From this sample, three groups were created: a low-SES experimental
group (CWPT), a low-SES control group (teacher-designed instructional program), and a
high-SES comparison group. The following measures were used in an effort to compare
differences in classroom dynamics, student behavior, and academic achievement: Otis
Lennon School Abilities Test-Primary I, Form R; direct classroom observations, Code for
Instructional Structure and Beauregard Academic Response (CISSAR); and the
Metropolitan Test-Basic Battery.
The results of this longitudinal study suggest that the CWPT group spent less time
in nonacademic activities and transitions than both the control group and the comparison
group. In addition, the CWPT students who were considered to be at-risk for academic
delays exceeded or approached the national norm in reading, language, and mathematics.
The researchers found that the implementation of CWPT produced improved classroom
dynamics, student behavior, and student achievement. This study demonstrated the power
of peer-to-peer learning and suggests that students from low-SES backgrounds and

7
students who are at-risk for academic delays may benefit from CWPT and experience
improved academic outcomes.
The majority of the research on CWPT demonstrates its effectiveness with basic,
elementary level mathematical skills; however, very little research is available regarding
how CWPT may be used to support the development of applications and higher order
thinking skills. Additionally, very few studies have been published evaluating the effects
of CWPT in heterogeneous middle school classrooms. Allsopp (1997) conducted a study
in an effort to examine the effectiveness of CWPT in heterogeneous eighth grade math
classrooms, teaching algebra problem-solving skills. The sample consisted of 262
students in eighth grade classrooms. Of these 262 students, 99 students were considered
to be at-risk for math failure and 163 were considered to be not at-risk for math failure.
The researchers used a pretest-posttest design in order to compare the effectiveness of the
use of CWPT to independent student practice. The following measures were used to
assess student achievement and social validity: California Test of Basic Skills (CTBS), a
19-item Likert scale evaluation inventory, and an informal survey.
The results of this study suggest that both CWPT and independent student
practice were found to be effective strategies for helping students learn beginning algebra
skills. A repeated measures ANOVA revealed that neither strategy was significantly more
effective than the other; however, student and teacher responses on the social validity
measures suggested that both the students and the teachers involved in this study enjoyed
using CWPT. The authors suggested that lack of significant findings of this study might
be attributable to the characteristics of middle school students and the middle school
curriculum. For example, the authors stated that middle school students might be less
8
motivated by the group contingency reinforcement present in the CWPT protocol. In
addition, the middle school curriculum required the students to master higher-order
problem solving skills, which may have made the presentation of prompts and the scoring
of answers less straightforward than the elementary implementation of CWPT. The
authors suggested that future research should focus on how CWPT procedures may be
modified so that they may be more appropriate and effective for middle school students.
The importance of student training. One of the essential components of PALS
for math is a training period for students, which is presented to the students before they
begin working in pairs. The training period provides students with information about the
basic PALS for math process, in order to ensure that students understand the purpose of
PALS for math, as well as the roles and responsibilities during each lesson. Fuchs, Fuchs,
Bentz, Phillips, and Hamlett (1994) conducted a study to examine the effects of previous
student training and experience in peer tutoring on the quality of student interactions.
Sixteen third, fourth, and fifth grade general education classrooms were assigned to two
conditions: an experimental group that received training and experience in peer tutoring
(PT) and a control group that did not receive training in PT (no-PT). The students in the
PT group received five 30-minute sessions of training. The researchers utilized measures
among three different levels of analysis. Level one measures examined the following: the
duration of the tutoring sessions, the accuracy of the students’ performance during
tutoring sessions, and systematic observations of student interactions during tutoring.
Level two measures included blind, global judgments and classifications of tutoring
performance. Level three analysis examined transcripts of representative cases.
9
The findings from the first level of analysis demonstrated a significant difference
for the average session length across tasks. The PT group averaged 7.72 minutes per task,
while the no-PT group averaged 5.73 minutes (effect size=1.36). The percentage of
correct problems completed on far-transfer tasks was significantly higher for the PT
group (89.50 percent correct) than the no-PT group (43.88 percent correct) with an effect
size of 1.41. Performance on near-transfer tasks was comparable between groups (effect
size=.18). The findings from the second level of analysis demonstrated that the PT group
received significantly higher ratings from blind observers [3.69 (SD=1.33)] than the no-
PT group [2.44 (SD=.68)]. Findings from the third level of analysis revealed that the PT
tutor provided more interactions with his partner and also provided more opportunities
for the tutee to respond. In contrast, the researchers noted that the no-PT tutor more often
verbally completed problems in their entirety, while the tutee sat and watched. In
summary, the findings of this study suggest that the group that had received training on
PT was better able to provide explanations, use appropriate interactions, and comply with
instructional principles than the no-PT group.
Fuchs, Fuchs, Hamlett, Phillips, Karns, and Dutka (1997) attempted to extend the
previous research on promoting effective helping behavior during collaborative learning
activities. The sample consisted of 40 second, third and fourth grade general education
classrooms, each with at least one student identified with a learning disability. Of the
sample of 40 classrooms, three conditions were created: a group of 10 classrooms used
peer-mediated instruction (PMI) and received one lesson on how to offer and request
elaborated help (PMI-Elaborated), a group of 10 classrooms used PMI and received the
lesson on elaborated help and also received a lesson on methods for providing conceptual
10
mathematical explanations (PMI-Elaborated + Conceptual), and a group of 20 classrooms
used the teacher-directed curriculum that was being used across all 40 classrooms and did
not use PMI (no-PMI). The researchers used two measures to evaluate the differences
between groups: the Comprehensive Mathematics Test and in situ observations.
The researchers reported that academic improvement in the PMI-Elaborated +
Conceptual group significantly exceeded the PMI-Elaborated group (p=.018) and the no-
PMI group (p=.0001). Additionally, academic improvement in the PMI-Elaborated group
significantly exceeded the no-PMI group (p=.004). The effect size, comparing the PMI-
Elaborated + Conceptual group and the no-PMI group was .73. When comparing the
PMI-Elaborated and no-PMI group, the effect size was .42. Finally, the effect size
comparing the two PMI groups was .32. A constructive style of interaction was more
typically observed in both PMI groups. Additionally, the PMI-Elaborated + Conceptual
group tutors asked more procedural questions than the PMI-Elaborated group tutors. The
results of this study support the incorporation of a student-training session, before the
implementation of a peer-to-peer learning intervention in a classroom.
Research Support for PALS for Math
The efficacy of PALS for math at the elementary level. Fuchs, Fuchs, Phillips,
Hamlett, and Karns (1995) sought to extend the research on peer-to-peer learning in three
ways. First, the researchers wanted to examine the effects of PALS for math among a
variety of learners in a general education setting. Secondly, the researchers wanted to
expand the use of peer-to-peer learning from mathematics computation to mathematics
concepts and applications. The third focus of the study was to investigate the effects of
PALS for math on nonacademic, classroom dynamics. The sample consisted of 40 second,
11
third, and fourth grade general education classrooms, each with at least one student
identified with a learning disability. The sample was split into two conditions: teacher-
mediated instruction with PALS and teacher-mediated instruction without PALS. It is
important to note here that PALS for math replaced components of, rather than added to,
the existing teacher-mediated instruction. Within these two groups, students were
identified as learning-disabled, low-achieving, and average-achieving students. The
researchers utilized a pretest-posttest design and employed the following measures:
instructional planning sheets, the Teacher Planning Scale, the Math Operations Test-
Revised (MOT-R), and the Mathematics Concepts and Applications Test (MCAT).
The authors of this study reported that a significant difference was found among
learning-disabled, low-achieving, and average-achieving students between groups on
both the MOT-R and the MCAT. On the MOT-R, the effect sizes are reported as .30 for
students with learning disabilities and .95 for students who had been identified as low-
achieving. Results of the Teacher Planning Scale suggested that PALS wasted less
instructional time and helped to keep the classrooms running smoothly. The results of this
study suggest that PALS for math may be a beneficial intervention for students with a
variety of learning histories. Additionally, the results of this study suggest that PALS for
math may improve a classroom’s efficiency and organization.
In an effort to expand the age-range with which PALS for math had been shown
to be effective, Fuchs, Fuchs, and Karns (2001) designed a study to examine the effects
of PALS for math on Kindergarten students’ mathematics achievement. The sample
consisted of 168 Kindergarten students from 20 different Kindergarten classrooms. All 20
of the Kindergarten teachers followed the district’s core curriculum, Math Advantage.

12
The treatment group (PALS) consisted of 10 teachers who used PALS for math to replace
other math activities, so that the overall time allocated to mathematics each week
remained constant for both groups. The control group teachers (no-PALS) continued to
use the Math Advantage curriculum with their students. Based on the results of the
Stanford Early School Achievement Test (SESAT), the students were classified as high-
achieving students, medium-achieving students, and low-achieving students. Additionally,
students with disabilities were noted. In addition to the SESAT, the researchers also used
the mathematics section of the Primary 1 level of the Stanford Achievement Test and a
teacher questionnaire to collect data on student improvement and social validity.
The authors of this study reported that the growth of the PALS group on the
SESAT (M=6.80, SD=4.69) exceeded that of the no-PALS group (M=4.86, SD=4.05)
with an effect size of .24. However, no significant differences were found between the
PALS group and the no-PALS group on the Stanford Achievement Test. The authors
stated that of the two measures used to assess mathematics achievement, the SESAT was
more closely aligned with the PALS for math program content. PALS demonstrated
larger effect sizes among initially classified medium-achieving students (.53), low-
achieving students (.46), and students with disabilities (.41) than for students who were
initially classified as high-achieving students (-.20). The results of this study suggest that
PALS for math may promote student learning and achievement at the Kindergarten level.
In an effort to expand the research further, Fuchs, Fuchs, Yazdian, and Powel
(2002) sought to examine the effects of PALS on the development of mathematics skills
among first grade students. The sample consisted of 327 first grade students within 20
different first grade classrooms. All 20 of the participating teachers continued to follow

13
the district’s core curriculum, Math Advantage. The 10 participating teachers in the
experimental condition (PALS) replaced parts of the core curriculum with PALS for math,
while the 10 participating teachers in the control condition (no-PALS) continued to
implement the Math Advantage curriculum without any supplemental interventions in
place. At the start of the study, each teacher was asked to classify each of his or her
students based on mathematics proficiency as high-achieving, average-achieving, and
low-achieving students. The researchers utilized a pretest-posttest design and used a
measure of academic achievement and a measure of social validity for data collection. In
order to measure academic achievement, the researchers selected 94 items from the
Primary 1 level and the Primary 2 level of the Stanford Achievement Test and coded the
selection into those questions that were aligned with PALS for math content and those
that were not aligned with PALS for math content. In addition, a teacher questionnaire
was developed as a measure of social validity.
On the aligned portion of the Stanford Achievement Test, the average
improvement of students in the PALS group exceeded the average improvement of the
students in the no-PALS group [F (1, 325) = 5.66, p < .018] with an effect size of .31. Effect
sizes for students who had been identified as high-achieving students, average-achieving
students, and low-achieving students were .31, .33, and .34, respectively. No significant
differences were reported between the two groups on the unaligned portion of the
Stanford Achievement Test. In the case of students with disabilities in the PALS group,
the average improvement on the aligned portion of the Stanford Achievement Test was
16.00, while the average improvement for students with disabilities in the no-PALS
group was 10.10, resulting in an effect size of .68. In addition to improved mathematics

14
skills, teacher perception data from the social validity measure indicated that the
participating teachers generally considered PALS for math to be a practical intervention
for classroom use.
The efficacy of PALS for math at the secondary level. Much of the research
supporting the efficacy of PALS for math has examined the effects of the intervention
when used with a sample of elementary students. In an effort to extend the research to
additional populations, Calhoon and Fuchs (2003) designed a study to examine how
PALS for math and curriculum-based measurement (CBM)impacted the mathematics
performance of secondary students with disabilities. The sample consisted of 92 students
in ninth through twelfth grade, all of whom received mathematics instruction in self-
contained resource rooms. This sample was taken from 10 resources classrooms from
three different high schools. Five of the 10 classrooms were assigned to the treatment
condition (PALS + CBM). The treatment condition utilized PALS, a tangible
reinforcement structure, and CBM. The students in the control condition were provided
instruction using the Buckle Down on Tennessee Mathematics workbook. The researchers
utilized a pretest-posttest design and used the following measures: the Math Operations
Test-Revised (MOT-R), the Math Concepts and Applications Test (MCAT), the
mathematics section of the Tennessee Comprehension Achievement Test (TCAP), a
student questionnaire, and a teacher questionnaire.
The results of this study demonstrated a moderate effect size of .40 for students in
the PALS + CBM group for improvement on computation skills. Both groups improved
significantly in math concepts and applications; however, no significant difference was
found between the two groups. Social validity measures indicated that both the teachers

15
and the students enjoyed using PALS for math and felt that the intervention was helpful
in increasing mathematics skills. In addition, both the teachers and the students felt that
using CBM to graph progress helped to increase motivation. Finally, the majority of
teachers and students agreed that they would like to participate in PALS for math and
CBM again. This study demonstrates that PALS for math may be an effective
intervention for providing instruction to students with disabilities at the high school level.
The social validity of PALS for math. Previously published studies had
provided information and data about the effectiveness of PALS for math on students’
achievement in mathematics, as well as some information regarding the social validity of
this supplemental intervention. In an effort to investigate the likelihood and success of
sustained used of PALS for math at the elementary level, Baker, Gersten, Dimino, and
Griffiths (2004) designed a study to examine whether teachers who had previously been
involved in research studies related to PALS for math maintained their use of PALS for
math after the research studies ended. The participants in this study consisted of nine
second, third, and fourth grade teachers, eight of whom had been involved in the study
conducted by Fuchs, Fuchs, Bentz et al. in 1994. The authors utilized a case study design
and collected data using the following measures: semi-structured interviews, two sets of
classroom observations (observations of PALS implementation and observations of
general math instruction), the Stages of Concern survey, the Teacher Efficacy Measure,
and the Teacher Community, Professionalism, and Job Satisfaction Scales.
The authors reported that all eight of the teachers who had originally been
involved in the 1994 study had continued to utilize PALS for math in their classrooms on
a regular basis. In regard to procedural fidelity, teachers completed, on average, 96% of

16
the teacher-related intervention components correctly. In addition, 99% of the student-
related intervention components were completed correctly. In contrast, the new teacher
who had not been present during the original study reportedly had great difficulty
implementing the intervention effectively. When asked about her familiarity with the
intervention, she reported having a negative experience when receiving professional
development on how to implement PALS for math, stating that the PALS coordinator
took over the teaching of the lesson and never truly trained her. This study demonstrates
that the successful sustained use of the PALS for math intervention is possible when
effective training is provided to teachers; however, it also serves as a reminder that
professional development must be modified to meet the needs of individual teachers in
order for teachers to feel autonomous enough to implement the intervention with fidelity.
Kroeger and Kouche (2006) wrote about their own experiences with PALS for
math in an effort to describe how the addition of PALS for math may influence the
teachers and the students in middle school mathematics classes. The sample consisted of
150 seventh grade students. Of these students, 14 percent had been identified with a
disability, six had behavior plans, and two had received diagnoses of Asperger’s
syndrome. The authors of this article were a math teacher and an intervention specialist.
These two educators worked together to implement the supplemental intervention within
the teacher’s seventh grade classrooms. The authors used a case study design and
conducted informal interviews in order to collect information about the experiences and
perceptions of the students. Additionally, the teacher and the intervention specialist
summarized their own perceptions and experiences with PALS for math.

17
The data collected from the interviews suggest that the participants found PALS
for math to be beneficial in the classroom. The classroom teacher reported that 100% of
the students were engaged while they were working in pairs on PALS. Additionally, she
reported that she observed the confidence levels of many students rise. Students’ scores
on quizzes and students’ retention material were reported to have improved as well. The
intervention specialist reported that the students with IEPs benefitted from the social
skills built into the program. The majority of the students reported that they enjoyed
using PALS and that this supplemental intervention helped them better understand
mathematics.
Summary of Literature Review
The existing literature on PALS for math suggests that the components of this
intervention, based on CWPT, are grounded in evidence-based literature (Delquardi et al.,
1986; Greenwood et al., 1989; Allsopp, 1997). Additionally, the inclusion of training
procedures for students and teachers appears to be an essential element for student
success with this intervention (Fuchs et al., 1994; Fuchs et al., 1997). The research also
suggests that PALS for math has demonstrated efficacy among students in elementary
school in general education classrooms. These published studies have demonstrated that
students with a wide variety of learning histories may benefit from this type of
supplemental mathematics intervention. More specifically, students who have been
classified as high-achieving, average-achieving, and low achieving, as well as students
with disabilities may benefit from PALS for math (Fuchs et al., 1995; Fuchs et al., 2001;
Fuchs et al., 2002). Additionally, studies have demonstrated the social validity of this
intervention and report that teachers and students generally enjoy using this intervention

18
(Fuchs et al., 1995; Fuchs et al., 2001; Fuchs et al., 2002; Calhoon & Fuchs, 2003;
Kroeger and Kouche, 2006). Additionally, teachers will sustain the use of this
intervention when proper training has been provided (Baker et al., 2004). In regard to
secondary classrooms, only one study demonstrating the efficacy of PALS could be
found (Calhoon & Fuchs, 2003).
As increased advocacy for collaborative learning has appeared within the field of
education over the past several decades, the necessity for research on this topic has also
increased. While research on the topic of PALS for math has begun to demonstrate the
efficacy of this intervention, areas for future research do exist. Particularly, research with
students at the middle school and high school level is essential. Specifically, researchers
could investigate whether this intervention is effective with middle and high school
populations and curricula. Additionally, researchers may want to investigate whether
modifications to the training procedures, session implementation, and materials need to
be modified in order for PALS for math to be effective with this older age group. PALS
for math appears to offer some promising results for students in regard to mathematics
achievement; however, a stronger research base is necessary in order to validate and
expand the potential uses of this intervention in a wider variety of settings.
Research Questions and Hypotheses
Research has demonstrated that success in Algebra is a gateway to later
achievement; however, many students begin to demonstrate increased difficulty with
mathematics as they enter late middle school (National Mathematics Advisory Panel,
2008). Given the common difficulties that students have with mathematics as they enter
late middle school, it is important to explore the ways in which student achievement in
19
mathematics during this critical time period may be increased. As a supplement to a
general curriculum, PALS for math offers a methodology for educators to use in an effort
to support students at the Tier One (i.e., core curriculum) level. While currently published
research has demonstrated the efficacy of this intervention among kindergarten through
sixth grade students, additional research is needed to determine whether PALS is
effective for secondary level students and specialized populations. In an attempt to
validate and expand the potential application of PALS for math in a wider variety of
settings, this research study examined the effects of implementing a modified version of
PALS with seventh grade students in regular education mathematics classes. The research
questions for this study are as follows:
1. Will the implementation of PALS for math, as a supplement to an existing
curriculum, result in a greater increase in math performance among
seventh grade students, in comparison to when PALS for math does not
supplement an existing curriculum?
2. Will PALS for math benefit some students more than others?
3. Will three lower performing students demonstrate improved performance
in fractions computation during the phase in which the intervention
includes collaborative practice with fractions? Furthermore, will three
lower performing students demonstrate improved performance in integer
computation during the phase in which the intervention includes
collaborative practice with integers?

20
Based on a review of the PALS for math curricular materials and the current research that
has been published about the efficacy of PALS for math, the following research
hypotheses were made:
1. The implementation of PALS for math, as a supplement to an existing
curriculum, will result in a greater increase in math performance among
seventh grade students, in comparison to when PALS for math does not
supplement an existing curriculum.
2. PALS for math will benefit all students, but will be more beneficial to
those students scoring below the 50th percentile on the Math Computation
(M-COMP) CBM from AIMSweb.
3. During the phase in which the intervention includes collaborative practice
with fractions, the three lower performing students will demonstrate an
improvement in fractions computation. Similarly, during the phase in
which the intervention includes collaborative practice with integers, the
three lower performing students will demonstrate an improvement in
integers computation.
Method
Design
This study utilized a pre-post group design with a nested within-subject ABC case
study design. In regard to the pre-post group design, intact seventh grade math classes
were used and comparisons were made between the students’ class-wide mean scores on
generalized outcomes measures of math skills. Prior to receiving the PALS for math
intervention, both groups completed pretest measures: AIMSweb Math Computation (M-

21
COMP) and researcher-created Fractions-CBM. Following the intervention, both groups
completed posttest measures with M-COMP and Fractions-CBM and the class means
were compared.
In regard to the nested within-subjects comparison, an ABC case study design
was used to explore the impact of the intervention for three lower performing students as
they learned two different mathematics skills: fractions computation skills and
computation skills with positive and negative integers. These three students were selected
based on two criteria: (1) they were not receiving any special education or RTI services
for mathematics and (2) they were the lowest scoring participants on the M-COMP
during the baseline phase. These three students completed weekly Fractions-CBM and
weekly Integers-CBM throughout all phases of the study. During the next phase (B),
these students participated in the class wide implementation of PALS for math, during
which the focus of the intervention was on fractions computation skills. After four weeks,
when this phase of the study ceased, data were collected on the students’ general math
computation performance. Following, the next phase (C) began, during which the focus
of the class wide intervention changed to integers. After four weeks, when this phase of
the study ceased, data were again collected on the students’ general math computation
performance.
Participants
The participants of this study were middle school students and the mathematics
teacher in two regular education seventh grade mathematics classes in a suburban school
located in the Northeast. The school served grades six through eight and had a total
enrollment of 624. At the time of the study, 22.37% of the total school population

22
qualified for free/reduced-price lunch, 0.16% of the total school population was identified
as being English language learners (ELL), and 12.98% of the total school population
received special education services. The host district student data policy prohibited
release of classroom-specific demographic data. The student participants included all of
the students on one seventh grade “team.” The experimental group contained 21 total
seventh grade students (12 male and 9 female). The control group contained 20 total
seventh grade students (10 male and 10 female). The majority of the students had
attended school in the same town since Kindergarten. A summary of student and school
information is found in Table 1. The three lower performing students were all general
education students who did not receive any supplementary math supports (i.e., Response
to Intervention). Two of the lower performing students were males and one was female.
The teacher who participated in the study worked on the team with one other teacher and
together they provided the language arts, math, science, and social studies instruction for
41 students. The teacher participant was the math and social studies teacher. This teacher
had 25 years of teaching experience at the middle school level, primarily teaching math.
Table 1.
Participant and School Demographics
Percent Participants
Boys 54 Girls 46
School English Language Learners .16 Free and Reduced Lunch 22.37 Special Education 12.98

23
Setting
The setting for this study was a regular education seventh grade mathematics
classroom. The classroom contained approximately 19 to 21 students at a time, the
mathematics teacher, and one or two graduate students who collected data on student
progress and treatment fidelity. Each mathematics class received instruction in the same
classroom by the same mathematics teacher. All training, intervention, and no-
intervention sessions took place in the same classroom.
Materials
Assessment materials. A selection of assessment tools was utilized in order to
measure student performance and progress. A total of three different assessments tools
were used: M-COMP, researcher-created Fractions-CBM, and researcher-created
Integers-CBM.
M-COMP. In order to collect data on students’ mathematics comprehension M-
COMP CBM probes from AIMSweb® were used (Pearson, 2010). The 8-minute
assessment was administered in a group setting and was given in accordance to the
standardized procedures described by AIMSweb®. M-COMP was used to collect
baseline data of student performance and as a pre- and posttest measure of student
performance.
Researcher-created Fractions-CBM and Integers-CBM. In addition, the
researcher created more specific CBM probes to reflect the local curriculum (McDougall-
Littell Integrated Mathematics 2) and to target the specific skills being taught during each
mathematics unit of study: Fractions-CBM and Integers-CBM (Larson, Boswell, Kanold,
& Stiff, 2004). These brief assessments were created with the test generator software that
24
was provided with the curriculum materials. These researcher-created CBM probes were
administered in a group setting and took four minutes for students to complete. The
Fractions-CBM were administered as a progress monitoring tool on a weekly basis to all
students during the Fractions Phase of the study and to three lower performing students in
the PALS Group during Phase-B of the study. The Integers-CBM were administered as a
progress-monitoring tool on a weekly basis to three lower performing students in the
PALS Group during the Fractions Phase and the Integers Phase of the study.
Training materials. The PALS for math Teacher Manual and DVD were used to
guide teacher and student training (Fuchs et al., 2009). Teacher training was provided by
the researcher prior to implementing the PALS for math intervention. Teacher training
sessions included treatment modeling, direct instruction, and independent practice.
During student training, the teacher utilized the student training scripts within the
Teacher Manual to guide student training (Fuchs et al, 2009). The student training scripts
may be found on pages 35 through 60 in the PALS for Math Teacher Manual (Fuchs et
al., 2009).
Intervention materials. The currently published version of PALS includes
materials up through sixth grade. In order to explore whether PALS was effective for
seventh grade students, the PALS method was applied to math activities matched to the
participants’ math curriculum, McDougall-Littell Integrated Mathematics 2 (Larson et al.,
2004). The specific instructional activities for the duration of the study were sampled to
create PALS items and CBM probes matched to the textbook material. The PALS for
math Teacher Manual was used to guide intervention implementation (Fuchs et al, 2009).
Materials specific to PALS for math are listed in the Teacher Manual and include: folders,

25
Coach’s Question Sheets, Coaching Sheets, Coaching Answer Sheets, Practice Sheets,
Practice Answer Sheets, Point Sheets, and several posters that may be displayed on the
classroom walls (Fuchs et al, 2009). Materials in need of modification were created using
the test generator software that is provided with the McDougall-Littell Integrated
Mathematics 2 curriculum materials. These materials were made to match the format of
the published PALS materials. Due to the adaptation of PALS for seventh grade students,
the researcher consulted weekly with the teacher in order to gather information about the
appropriateness of the PALS content for the students’ instructional level. Based on this
information, the researcher selected and modified PALS materials in order to include
relevant practice materials.
Procedures and Schedule
Baseline. The study began with a baseline phase during which the students in
both math classes completed three M-COMP assessments and three Fractions-CBM. The
median score of each of these measures served as the pretest measure. The three lower
performing students from the PALS Group were selected, based on M-COMP
performance, to participate in the ABC case study component. These students completed
additional CBM (Integers-CBM) during phase C of the study. After the pretest data were
obtained, the math teacher implemented the PALS in one of the classrooms (PALS
Group).
Teacher training. Prior to starting the PALS procedure, the researcher trained the
teacher to use PALS according to the PALS manual (Fuchs et al., 2009). Teacher training
sessions included treatment modeling, direct instruction, and independent practice.
26
Training sessions were scheduled at the teacher’s convenience and continued until the
teacher demonstrated 100% mastery of the procedures.
Student pairing. Students were paired with partners for the PALS for math
intervention based on the M-COMP results. The students were rank ordered according to
their performance on the M-COMP measure. More specifically, the students were rank
ordered from highest-performing to lowest-performing and numbered from one to 20
respectively. This list was used to create student pairs which had a balanced set of one
higher performing and one lower performing student.
Student training. The first week of PALS implementation included training the
students in the PALS Group to use PALS correctly. The PALS for math manual provides
an initial student training outline and corresponding scripts that are organized over the
course of five days. However, due to the fact that the participants in this study were
seventh grade students and that they had received previous instruction about working
collaboratively with peers, the students were able to move more quickly through the
student training materials and the teacher needed only three days to present the training
materials to the students. Sample student training scripts can be found in the PALS for
math Teacher Manual (Fuchs et al., 2009).
Intervention: Fractions Phase. The focus of the PALS intervention during the
Fractions Phase was on fractions computation. The Fractions Phase began after student
training had been completed. Within the PALS Group, the PALS intervention was
implemented two times per week for 30 minutes each. During PALS implementation, the
teacher followed the procedures outlined on the PALS Command Card, which may be
found within the PALS for Math Teacher Manual (Fuchs, et al., 2009). A description of

27
the materials used during a typical PALS lesson, may be found on pages 11 through 14 of
the PALS for Math Teacher Manual (Fuchs et al., 2009). During each session, the
students completed two major activities: coaching and practice. During coaching, each
member of the pair took a turn playing the role of coach and player. The higher-
performing student of each pair was assigned the role of first coach and coached the first
half of a coaching worksheet. During coaching, the student followed a scripted, stepwise
guide to solving the particular problem type, while also providing immediate error
correction. The lower performing student was assigned the role of second coach and
coached during the second half of the coaching worksheet. During the coaching portion
of the session, the teacher monitored the pairs and awarded points to each pair on a point
sheet, contingent on appropriate behavior. During practice, students independently
completed a timed drill practice worksheet, which contained a variety of types of math
problems. After five minutes had elapsed, students switched practice worksheets with
their partners and scored one point for each correctly answered math problem. Each
student in each pair marked his or her earned points during the practice session on his or
her point sheet and the pair with the highest score was recognized and congratulated.
No-PALS control group. During the time block when the PALS Group
completed the PALS intervention, the students in the no-pals condition (No-PALS
Group) completed a worksheet with math problems similar to those on the PALS
worksheets but without the PALS procedure. This ensured that the No-PALS Group
participated in the same amount of math instruction as the PALS Group. In order to
compare the performance of students in the PALS and no-PALS conditions, all students
were given the same homework each night and completed the same weekly Fractions-
28
CBM probe. In addition to the weekly Fractions-CBM probes, three lower performing
students in the PALS Group also completed weekly progress monitoring probes with
sample items not yet taught (e.g., integers). Having selected lower performing students to
complete probes which sample both targeted skills (e.g., Fractions-CBM) and untargeted
skills (e.g., Integers-CBM) provided a way to determine if the PALS intervention led to
within-student skill improvements specific to the target skill area: fractions.
At the end of the four-week intervention period, the M-COMP was administered
to the students three times. The mean result of the M-COMP served as the posttest score
for the end of The Fractions Phase.
Intervention: Integers Phase. The focus of the PALS intervention during the
Integers Phase was on the computation of positive and negative integers. The same
implementation standards remained in place for the duration of the Integers Phase.
During the Integers Phase, only the three identified lower performing students completed
CBM probes (e.g., Integers-CBM). These probes were designed to show whether these
students demonstrated skill improvements in the area of integers after PALS sessions
with integer content had been targeted. At the end of the four-week intervention period,
the M-COMP was administered to the students three times. The mean result of the M-
COMP served as the posttest score for the end of the Integers Phase.
Treatment Integrity and Assessment Accuracy
In an effort to increase the likelihood that the PALS procedures were
implemented correctly, the teacher and the students were observed during 30% of the
PALS and no-PALS lessons. During each observation, the observer used a checklist of
the required PALS components, or of the no-PALS planned worksheet activity and

29
recorded whether the teacher and the students completed the intervention or worksheet
activity correctly. An implementation teacher and student fidelity checklist for PALS is
found in Appendix A. A second observer collected inter-observer agreement data during
50% of the observations. Additionally, in an effort to monitor any spillover effects of the
PALS for math intervention into the No-PALS Group, an observer monitored 30% of the
no-PALS lessons. This observation was similar to the observation that took place during
the PALS sessions and involved the use of an implementation checklist for the no-PALS
lessons. An implementation checklist for the no-PALS lessons may be found in Appendix
B. Similarly, assessment accuracy was verified by having a second trained evaluator
score 30% of the M-COMP assessments, 30% of the Fractions-CBM assessments, and
30% of the Integers-CBM assessments. Together, these data provided information
concerning inter observer agreement and data accuracy.
Data Analysis Methods
To answer the first research question, information about student performance
between the two groups on the M-COMP measure and the Fractions-CBM was compared
using a series of t-tests. First, independent samples t-tests were run to compare the
baseline M-COMP means of the two groups and the Fractions-CBM means of the two
groups. These tests were run in order to determine if the baseline M-COMP performance
of the two groups or the Fractions-CBM performance of the two groups differed
significantly. Next, a series of paired samples t-tests were run to compare the following:
(1) within-group M-COMP performance at baseline to within-group M-COMP
performance at the end of The Fractions Phase, (2) within-group Fractions-CBM
performance at the end of baseline to within-group Fractions-CBM performance at the

30
end of the Fractions Phase, (3) within-group M-COMP performance at the end of the
fractions phase to within-group M-COMP performance at the end of the Integers Phase,
(4) within-group M-COMP performance at baseline to within-group M-COMP
performance at the end of the Integers Phase. Additional independent samples t-tests
were run to compare the end of the Integers Phase M-COMP means of the two groups, as
well as the end of the Fractions Phase Fractions-CBM means of the two groups. Finally, a
full-factorial Analysis of Covariance (ANCOVA) was run to learn whether the
differences in students’ posttest M-COMP scores were significant when their pretest M-
COMP scores were entered as covariates.
In an effort to answer the second research question, the participants in the PALS
Group and the No-PALS Group were divided into two groups based on baseline M-
COMP performance. Next, the rate of improvement (ROI) of each of these groups was
calculated and compared to the AIMSweb® seventh grade M-COMP ROI, which is
based on a national normative sample. To address the third research question, the results
of the researcher-created local CBM probes of fractions and integer skills were graphed
for the three lower performing students. Visual inspection of the trend and level of these
data provided additional information about the efficacy of the PALS instruction for these
students.
Results
Treatment Integrity and Assessment Accuracy
Table 2 presents the treatment integrity data for both the PALS Group and the No-
PALS Group session observations. With the PALS Group, treatment integrity ranged
31
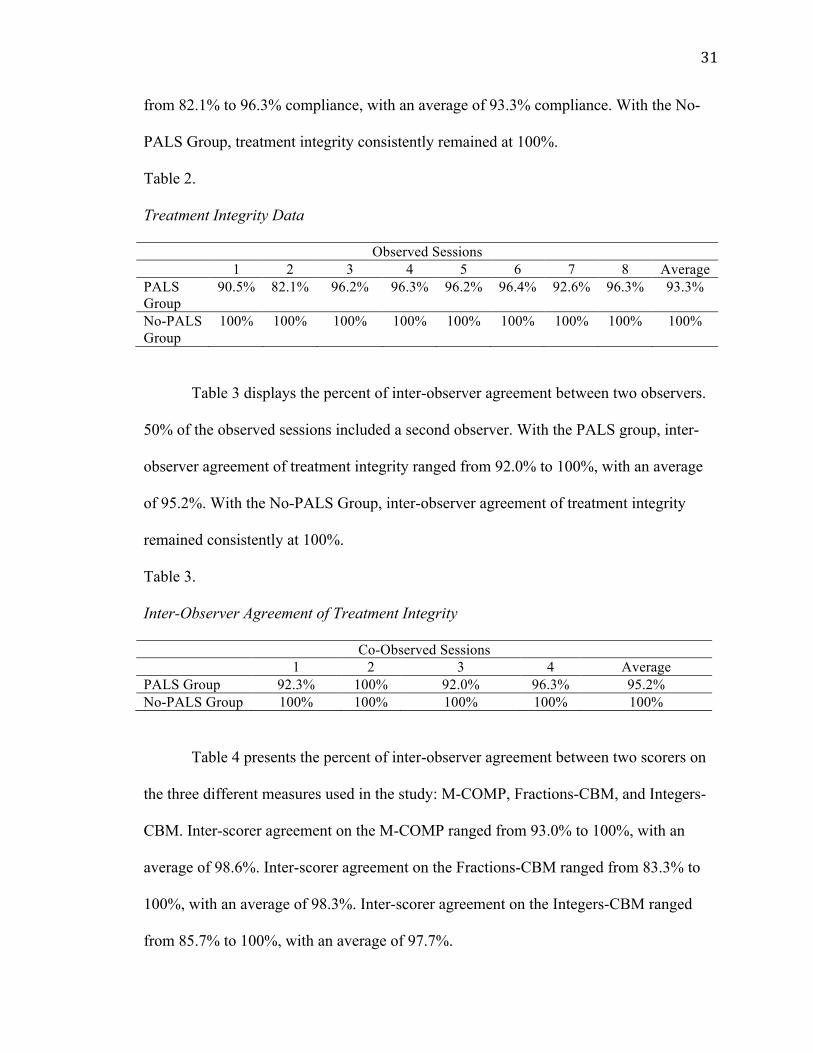
from 82.1% to 96.3% compliance, with an average of 93.3% compliance. With the No-
PALS Group, treatment integrity consistently remained at 100%.
Table 2.
Treatment Integrity Data
Observed Sessions 1 2 3 4 5 6 7 8 Average
PALS Group
90.5% 82.1% 96.2% 96.3% 96.2% 96.4% 92.6% 96.3% 93.3%
No-PALS Group
100% 100% 100% 100% 100% 100% 100% 100% 100%
Table 3 displays the percent of inter-observer agreement between two observers.
50% of the observed sessions included a second observer. With the PALS group, inter-
observer agreement of treatment integrity ranged from 92.0% to 100%, with an average
of 95.2%. With the No-PALS Group, inter-observer agreement of treatment integrity
remained consistently at 100%.
Table 3.
Inter-Observer Agreement of Treatment Integrity
Co-Observed Sessions 1 2 3 4 Average
PALS Group 92.3% 100% 92.0% 96.3% 95.2% No-PALS Group 100% 100% 100% 100% 100%
Table 4 presents the percent of inter-observer agreement between two scorers on
the three different measures used in the study: M-COMP, Fractions-CBM, and Integers-
CBM. Inter-scorer agreement on the M-COMP ranged from 93.0% to 100%, with an
average of 98.6%. Inter-scorer agreement on the Fractions-CBM ranged from 83.3% to
100%, with an average of 98.3%. Inter-scorer agreement on the Integers-CBM ranged
from 85.7% to 100%, with an average of 97.7%.
32
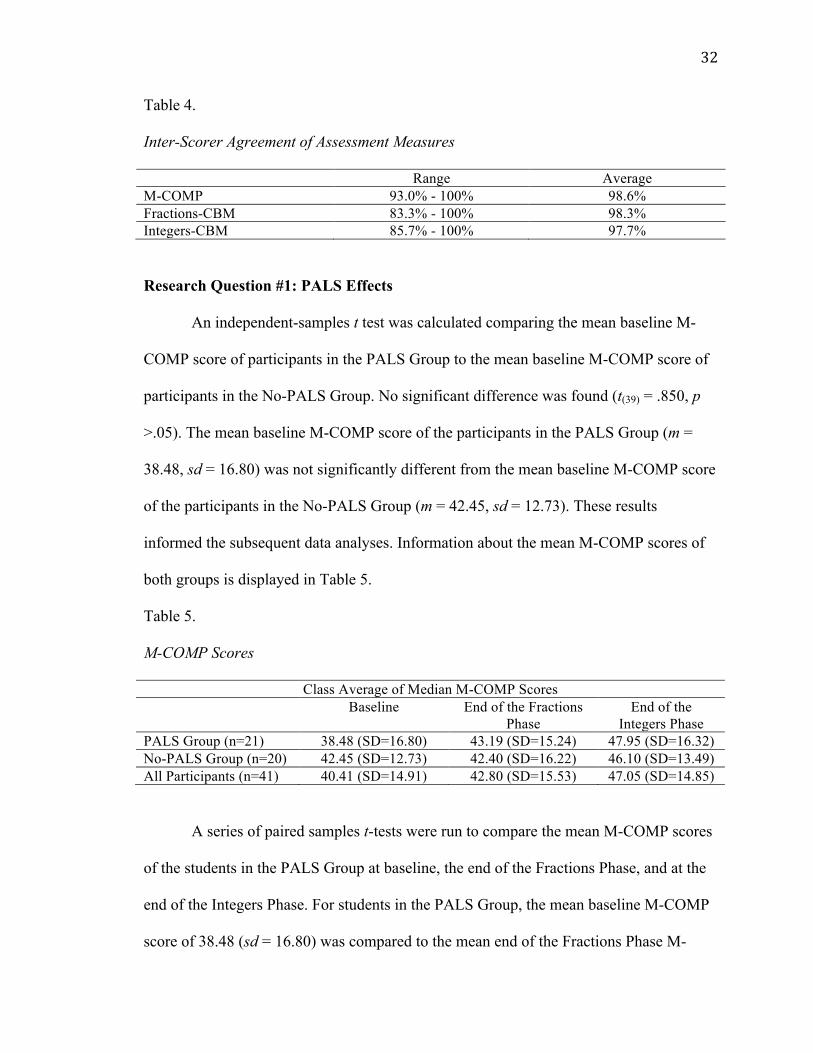
Table 4. Inter-Scorer Agreement of Assessment Measures
Range Average M-COMP 93.0% - 100% 98.6% Fractions-CBM 83.3% - 100% 98.3% Integers-CBM 85.7% - 100% 97.7%
Research Question #1: PALS Effects
An independent-samples t test was calculated comparing the mean baseline M-
COMP score of participants in the PALS Group to the mean baseline M-COMP score of
participants in the No-PALS Group. No significant difference was found (t(39) = .850, p
>.05). The mean baseline M-COMP score of the participants in the PALS Group (m =
38.48, sd = 16.80) was not significantly different from the mean baseline M-COMP score
of the participants in the No-PALS Group (m = 42.45, sd = 12.73). These results
informed the subsequent data analyses. Information about the mean M-COMP scores of
both groups is displayed in Table 5.
Table 5.
M-COMP Scores
Class Average of Median M-COMP Scores Baseline End of the Fractions
Phase End of the
Integers Phase PALS Group (n=21) 38.48 (SD=16.80) 43.19 (SD=15.24) 47.95 (SD=16.32) No-PALS Group (n=20) 42.45 (SD=12.73) 42.40 (SD=16.22) 46.10 (SD=13.49) All Participants (n=41) 40.41 (SD=14.91) 42.80 (SD=15.53) 47.05 (SD=14.85)
A series of paired samples t-tests were run to compare the mean M-COMP scores
of the students in the PALS Group at baseline, the end of the Fractions Phase, and at the
end of the Integers Phase. For students in the PALS Group, the mean baseline M-COMP
score of 38.48 (sd = 16.80) was compared to the mean end of the Fractions Phase M-

33
COMP score of 43.19 (sd = 15.24). A statistically significant increase from baseline to
the end of the Fractions Phase was found (t(20) = -5.021, p <.001). For students in the
PALS Group, the mean end of the Fractions Phase score of 43.19 (sd = 15.24) was
compared to the mean end of the Integers Phase M-COMP score of 47.95 (sd = 16.32). A
significant increase from the end of the Fractions Phase to the end of the Integers Phase
was found (t(20) = -4.374, p <.001). For students in the PALS Group, the mean baseline
M-COMP score of 38.48 (sd = 16.80) was compared to the mean end of the Integers
Phase M-COMP score of 47.95 (sd = 16.32). A significant increase from baseline to the
end of the Integers Phase was found (t(20) = -5.973, p <.001).
A series of paired samples t-tests was run to compare the mean M-COMP scores
of the students in the No-PALS Group at baseline, the end of the Fractions Phase, and at
the end of the Integers Phase as well. For students in the No-PALS Group, the mean
baseline M-COMP score of 42.45 (sd = 12.73) was compared to the mean end of the
Fractions Phase M-COMP score of 42.40 (sd = 16.22). No significant difference was
found from baseline to the end of the Fractions Phase (t(19) = .019, p >.05). For students in
the No-PALS Group, the mean end of the Fractions Phase score of 42.40 (sd = 16.22)
was compared to the mean end of the Integers Phase M-COMP score of 46.10 (sd =
13.49). No significant difference was found from baseline to the end of the Fractions
Phase (t(19) = -1.214, p >.05). For students in the No-PALS Group, the mean baseline M-
COMP score of 42.45 (sd = 12.73) was compared to the mean end of the Integers Phase
M-COMP score of 46.10 (sd = 13.49). No significant difference was found from baseline
to the end of the Integers Phase? (t(19) = -1.771, p >.05).

34
An independent-samples t-test was calculated comparing the end of the Integers
Phase M-COMP score of participants in the PALS Group to the mean end of the Integers
Phase M-COMP score of participants in the No-PALS Group. No significant difference
was found (t(39) = -.395, p >.05). The mean end of the Integers Phase M-COMP score of
the participants in the PALS Group (m = 47.95, sd = 16.32) was not significantly
different from the mean end of the Integers Phase M-COMP score of the participants in
the No-PALS Group (m = 46.10, sd = 13.49).
Another independent-samples t-test was calculated comparing the mean baseline
Fractions-CBM score of participants in the PALS Group to the mean baseline Fractions-
CBM score of participants in the No-PALS Group. No significant difference was found
(t(39) = -1.154, p >.05). The mean baseline Fractions-CBM score of the participants in the
PALS Group (m = 4.43, sd = 2.58) was not significantly different from the mean baseline
Fractions-CBM score of the participants in the No-PALS Group (m = 3.60, sd = 1.96).
Information about the mean Fractions-CBM scores of both groups is displayed in Table 6.
Table 6.
Fractions-CBM Scores
Class Average of Fraction-CBM Scores Median Baseline Score End of the Fractions Phase PALS Group (n=21) 4.43 (SD=2.58) 8.86 (SD=4.11) No-PALS Group (n=20) 3.60 (SD=1.96) 6.95 (SD=3.57) All Participants (n=41) 4.02 (SD=2.31) 7.95 (SD=3.94)
For students in the PALS Group, the mean baseline Fractions-CBM score of 4.43
(sd = 2.58) was compared to the mean end of the Fractions Phase Fractions-CBM score
of 8.86 (sd = 4.11). A significant increase from baseline to the end of the Fractions Phase
was found (t(20) = -7.106, p <.001). For students in the No-PALS Group, the mean

35
baseline Fractions-CBM score of 3.60 (sd = 1.96) was compared to the mean end of the
Fractions Phase Fractions-CBM score of 6.95 (sd = 3.57). A significant increase from
baseline to the end of the Fractions Phase was found (t(18) = -4.012, p <.001). Although
the students showed significant increases in their fractions scores over time, no
significant difference was found (t(38) = -1.561, p >.05) between the PALS and No-PALS
groups. The mean end of the Fractions Phase Fractions-CBM score of the participants in
the PALS Group (m = 8.86, sd = 4.11) was not significantly different from the mean end
of the Fractions Phase Fractions-CBM score of the participants in the No-PALS Group
(m = 6.95, sd = 3.57).
The differences between groups on all of the t-test comparisons were quite small.
Therefore, the four-point difference between the PALS and No-PALS groups on the
pretest did appear to have potentially relative significance. For this reason, an ANCOVA
was run and the results may be found in Table 7. The ANCOVA results, which took into
Table 7.
ANCOVA Results
Source Type III Sum of Squares df Mean Square F Sig.
Pretest M-COMP Score 6310.310 1 6310.310 98.829 .000
Group 275.272 1 275.272 4.224 .047 Error 2476.442 38 65.170
account the students’ pretest M-COMP scores, revealed that there were statistically
significant differences between the PALS and No-PALS groups at posttest (F(1, 38) =
4.224, p = .047). This finding was different than the t-test conclusion, in that the
independent t-test comparison showed no significant differences. Controlling for the
pretest scores was critical in isolating the source of variance contributing to the

36
ANCOVA result. This finding indicates that participation in the PALS condition did
impact students’ posttest M-COMP scores.
Research Question #2: Outcomes by Student Groups
To answer the second research question, the participants in the PALS and No-
PALS Groups were divided into two groups based on baseline M-COMP performance.
Originally, the researcher had planned to create these two groups based on AIMSweb®
national norms. AIMSweb ® provides national norms, which are divided into percentiles;
however, the AIMSweb® national normative data and the performance of the sample
population were notably different. A comparison of the two groups is presented in Table
8.
Table 8.
Comparing AIMSweb® National Norms to Sample Population’s Data
AIMSweb® National Norms: Seventh Grade M-COMP Winter
Benchmark Performance (n=805)
Study Participants: Seventh Grade M-COMP Baseline
Performance (n=41)
90th Percentile 50 61.60 75th Percentile 38 49.50 50th Percentile 27 42.00 25th Percentile 17 28.50 10th Percentile 10 18.40 Mean 28 40.41 Standard Deviation 15 14.91
The AIMSweb® 50th percentile score for the seventh grade winter M-COMP is 27.
When dividing the study’s participants into two groups (participants whose baseline M-
COMP score was at or above 27 and participants whose baseline M-COMP score was
below 27), only seven students were identified as scoring below 27. More specifically,
there were five students in the PALS Group who scored below the AIMSweb® 50th
37
percentile and two students in the No-PALS Group who scored below the AIMSweb®
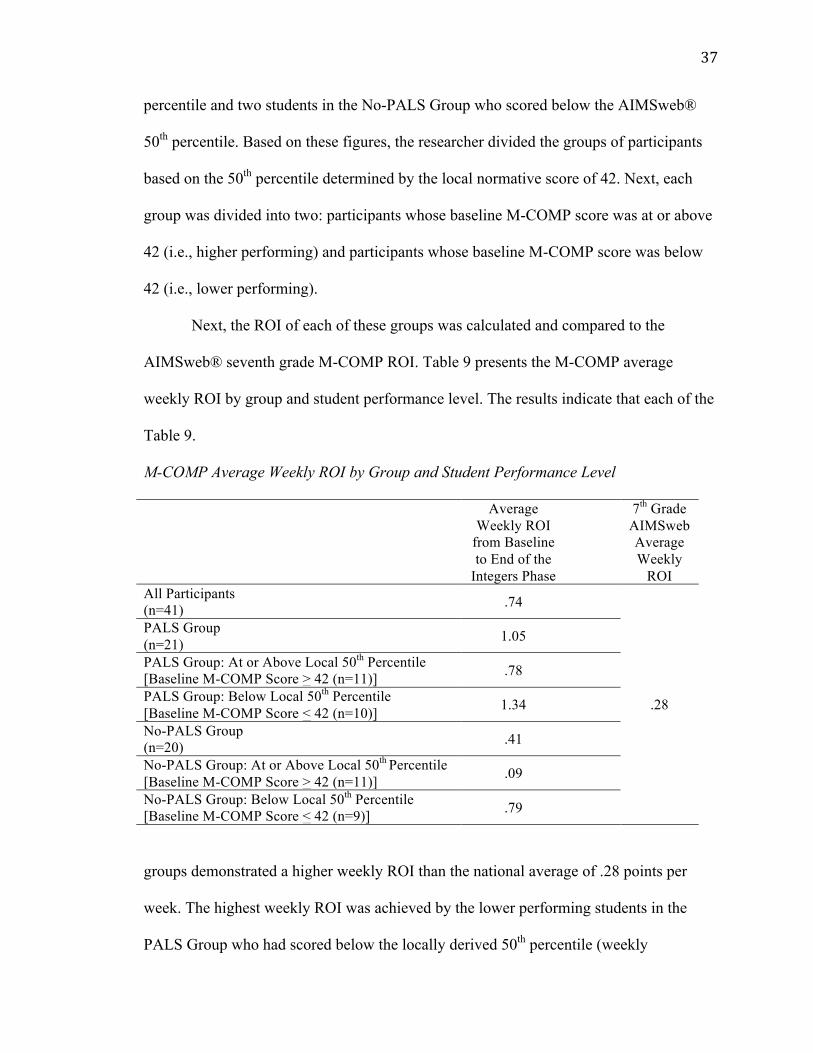
50th percentile. Based on these figures, the researcher divided the groups of participants
based on the 50th percentile determined by the local normative score of 42. Next, each
group was divided into two: participants whose baseline M-COMP score was at or above
42 (i.e., higher performing) and participants whose baseline M-COMP score was below
42 (i.e., lower performing).
Next, the ROI of each of these groups was calculated and compared to the
AIMSweb® seventh grade M-COMP ROI. Table 9 presents the M-COMP average
weekly ROI by group and student performance level. The results indicate that each of the
Table 9. M-COMP Average Weekly ROI by Group and Student Performance Level
Average Weekly ROI
from Baseline to End of the
Integers Phase
7th Grade AIMSweb Average Weekly
ROI All Participants (n=41) .74
.28
PALS Group (n=21) 1.05
PALS Group: At or Above Local 50th Percentile [Baseline M-COMP Score > 42 (n=11)] .78
PALS Group: Below Local 50th Percentile [Baseline M-COMP Score < 42 (n=10)] 1.34
No-PALS Group (n=20) .41
No-PALS Group: At or Above Local 50th Percentile [Baseline M-COMP Score > 42 (n=11)] .09
No-PALS Group: Below Local 50th Percentile [Baseline M-COMP Score < 42 (n=9)] .79
groups demonstrated a higher weekly ROI than the national average of .28 points per
week. The highest weekly ROI was achieved by the lower performing students in the
PALS Group who had scored below the locally derived 50th percentile (weekly
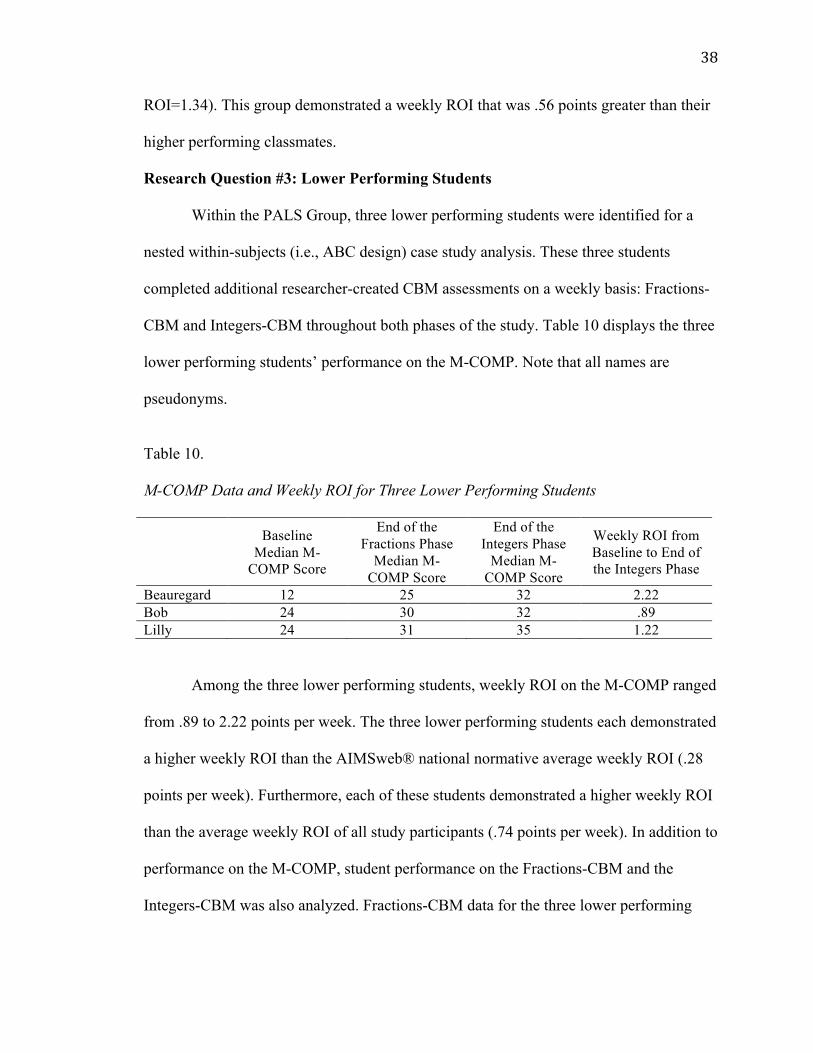
38
ROI=1.34). This group demonstrated a weekly ROI that was .56 points greater than their
higher performing classmates.
Research Question #3: Lower Performing Students
Within the PALS Group, three lower performing students were identified for a
nested within-subjects (i.e., ABC design) case study analysis. These three students
completed additional researcher-created CBM assessments on a weekly basis: Fractions-
CBM and Integers-CBM throughout both phases of the study. Table 10 displays the three
lower performing students’ performance on the M-COMP. Note that all names are
pseudonyms.
Table 10. M-COMP Data and Weekly ROI for Three Lower Performing Students
Baseline Median M-
COMP Score
End of the Fractions Phase
Median M-COMP Score
End of the Integers Phase
Median M-COMP Score
Weekly ROI from Baseline to End of the Integers Phase
Beauregard 12 25 32 2.22 Bob 24 30 32 .89 Lilly 24 31 35 1.22
Among the three lower performing students, weekly ROI on the M-COMP ranged
from .89 to 2.22 points per week. The three lower performing students each demonstrated
a higher weekly ROI than the AIMSweb® national normative average weekly ROI (.28
points per week). Furthermore, each of these students demonstrated a higher weekly ROI
than the average weekly ROI of all study participants (.74 points per week). In addition to
performance on the M-COMP, student performance on the Fractions-CBM and the
Integers-CBM was also analyzed. Fractions-CBM data for the three lower performing

39
students is displayed in Figure 1.Integers-CBM data for the three-lower performing
students are displayed in Figure 2.
Figure 1. Fractions-CBM Data for Three Lower Performing Students
Figure 2.
Integers-CBM Data for Three Lower Performing Students
The Fractions-CBM data and the Integers-CBM data revealed that all three of the
lower performing students demonstrated an improvement in fractions and integers
computation skills during the intervention, in comparison to baseline. An investigation of
the Fractions-CBM data indicates that the percentages of non-overlapping data points
between baseline and the Fractions Phase for Beauregard, Bob, and Lilly were 100%,
75% and 75%, respectively. The percentages of non-overlapping data points between the
40
Fractions Phase and the Integers Phase for Beauregard, Bob, and Lilly were 0%, 25%,
and 0%, respectively. This information indicates that student performance on the
Fraction-CBM showed the greatest improvement during the Fractions Phase, which was
the time period during which the PALS intervention focused on fractions computation
skills. An investigation of the Integers-CBM data indicates that the percentages of non-
overlapping data points between baseline and the Fractions Phase for Beauregard, Bob,
and Lilly were each at 25%. The percentages of non-overlapping data points between the
Fractions Phase and the Integers Phase for Beauregard, Bob, and Lilly were 100%, 100%,
and 75% respectively. This information indicates that student performance on the
Integers-CBM showed the greatest improvement during the Integers Phase, which was
time period during which the PALS intervention focused on integers computation skills.
Discussion
The purpose of this study was to examine the effects of implementing a modified
version of PALS with seventh grade students in regular education mathematics classes.
More specifically, the researcher investigated the extent to which an adaptation of PALS
for math, as a supplement to an existing curriculum, would result in a greater increase in
math performance among seventh grade students, in comparison to having students
complete math problem worksheets on their own. Furthermore, the study examined the
extent to which lower performing and higher-performing students benefitted from the
intervention.
In regard to the extent to which an adaptation of PALS for math resulted in an
increase in math performance among seventh grade students, the PALS Group improved
significantly when comparing the pre- and post-M-COMP scores, as well as the pre- and
41
post-Fractions-CBM scores within the group. This finding, which shows significantly
improved mathematics computational skills within the group that received the PALS
intervention, is consistent with findings among elementary-age PALS applications by
Fuchs et al. (1995), Fuchs et al. (1997), Fuchs et al. (2001), and Fuchs et al. (2002).
Furthermore, the PALS Group displayed a greater average weekly ROI on the M-COMP
(1.05) than the AIMSweb® normative sample for this measure (.28), demonstrating
major student growth in mathematics performance during the time that the PALS
intervention was in place.
When comparing the post-Fractions-CBM scores of the PALS Group to the post-
Fractions-CBM scores of the No-PALS group with an independent samples t-test, no
significant differences between the two groups existed. Similarly, when comparing the
post-M-COMP scores of the PALS Group to the post-M-COMP scores of the No-PALS
group with an independent samples t-test, the PALS Group did not appear to differ
significantly from the No-PALS Group. However, the ANCOVA result showed that
when the students’ M-COMP pretest scores were considered as covariates, the PALS
Group students obtained statistically significant gains over the No-PALS Group. While
the PALS Group’s scores were not hugely different, their relative growth is consistent
with prior research findings. Results from prior research have shown larger gains in
students’ scores, compared to the results obtained here.
One potential reason for this inconsistency with the existing literature on the
efficacy of PALS may be related to the frequency of the intervention implementation.
While the PALS intervention was implemented twice per week in the current study, as
recommended in the PALS manual, Fuchs et al. reported that the intervention was
42
implemented three times per week in their 2002 study. An additional possible reason for
the inconsistency with the existing literature on the efficacy of PALS may be related to
the duration of the study. More specifically, the students in the current study received the
intervention for nine weeks, whereas earlier studies ranged from 25-weeks (Fuchs et al,
1995), 18-weeks (Fuchs et al, 1997), 16-weeks (Fuchs et al., 2002), to 15-weeks (Fuchs
et al, 2001). When considering the duration of the study as a possible reason for the
inconsistency with the existing literature, a comparison of the average weekly ROI of the
PALS Group on the M-COMP (1.05) to the average weekly ROI of the No-PALS Group
(.41) suggests that more significant gains in mathematics computation may have been
observed if the duration of the study had been extended.
In regard to the extent to which lower performing and higher-performing students
benefit from the intervention, the existing literature suggests that both high-performing
and lower performing students may benefit from the PALS intervention (Fuchs et al.,
1995; Fuchs et al., 2001; Fuchs et al. 2002). When comparing these two groups, Fuchs et
al. (1995) and Fuchs et al. (2002) indicated that while all students demonstrated increased
learning outcomes, lower performing students demonstrated greater growth in
comparison to the higher-performing students. The results of the current study were
consistent with the existing literature and indicated that lower performing students
demonstrated a greater average weekly ROI on the M-COMP (1.34) than the higher-
performing students (.78). While the extent to which the lower performing and higher-
performing students benefited from the intervention differed, both of these groups within
the PALS Group demonstrated greater average weekly ROI growth in comparison to the
AIMSweb® normative sample (.28). Additionally, the lower performing students in the

43
PALS Group demonstrated a greater weekly ROI on the M-COMP (1.34) than the lower
performing students in the No-PALS Group (.79). Similarly, the higher-performing
students in the PALS Group demonstrated a greater weekly ROI on the M-COMP (.78)
than the higher-performing students in the No-PALS Group (.09).
Lower-achieving students likely benefit from the PALS intervention due to the
high level of error correction and feedback they receive during the intervention. Higher-
achieving students likely benefit from the PALS intervention due to the fact that the
intervention requires them to create explanations about mathematical processes for their
peers. The generative model of learning, which suggests that the retention of information
is improved if the information is meaningfully related to previously learned knowledge,
provides theoretical support for this hypothesis (Wittrock, 1989).
When examining the performance of the three lower performing students who
were selected to participate in the nested within-subjects (i.e., ABC) case study analysis
component of the study, the Fractions-CBM data and the Integers-CBM data revealed
that all three of the lower performing students demonstrated notable improvements in
fractions and integers computation skills during the intervention, in comparison to
baseline. Additionally, the data indicated that student performance on the Fractions-CBM
showed the greatest improvement during the Fractions Phase, which was the time period
during which the PALS intervention focused on fractions computation skills.
Furthermore, the data indicated that student performance on the Integers-CBM showed
the greatest improvement during the Integers Phase, which was time period during which
the PALS intervention focused on integers computation skills.

44
Beauregard, a seventh grade male student, obtained the lowest median M-COMP
score among the three lower performing students during the baseline phase of the study.
His median M-COMP score of 12 was at the 13th percentile, based on AIMSweb®
national norms. His baseline scores on the Fractions-CBM were 1, 0, and 0 problems
correct. His baseline scores on the Integers-CBM were 4, 2, and 3 problems correct.
During the Fractions Phase of the study, when the students in the PALS Group received
the PALS intervention with a focus on fractions, Beauregard demonstrated improved
performance on the Fractions-CBM. By the end of the Fractions Phase, Beauregard’s
performance on the Fractions-CBM had increased to 5 problems correct. Furthermore,
his M-COMP performance had increased from a score of 12 to a score of 25 by the end of
the Fractions Phase. During the Integers Phase of the study, when the students in the
PALS Group received the PALS intervention with a focus on integers, Beauregard
demonstrated improved performance on the Integers-CBM. By the end of the Integers
Phase, Beauregard’s performance on the Integers-CBM had increased to 11 problems
correct. Furthermore, his M-COMP performance had increased to a score of 32 by the
end of the Integers Phase. By the end of the Integers Phase of the study, Beauregard had
met the AIMSweb® 50th percentile goal for the spring benchmark period. Of the three
lower performing students, Beauregard demonstrated the highest rate of improvement on
the M-COMP, an average weekly ROI of 2.22 points per week. This weekly ROI is much
greater than the AIMSweb® normative weekly ROI of .28 points per week.
Bob, a seventh grade male student, obtained a median M-COMP score of 24
during the baseline phase. His median score was at the 42nd percentile, based on
AIMSweb® national norms, but much lower than his classroom peers who scored well
45
above the national norms. His baseline scores on the Fractions-CBM were 2, 1, and 2
problems correct. His baseline scores on the Integers-CBM were 3, 3, and 5. At the end
of the Fractions Phase, Bob demonstrated only slightly improved performance on the
Fractions-CBM, scoring 3 problems correct. At the end of the Fractions Phase, Bob
increased his M-COMP score from 24 to 30. By the end of the Integers Phase, Bob’s
performance on the Integers-CBM had increased to 9 problems correct. His M-COMP
score at the end of the Integers Phase was a 32, which is equivalent to the AIMSweb®
spring benchmark 50th percentile. Bob demonstrated a weekly ROI of .89 on the M-
COMP. While his weekly ROI was greater than the AIMSweb® normative ROI (.28), it
was the lowest ROI of the three lower performing students. Additionally, his ROI on the
M-COMP was lower than the PALS Group’s average weekly ROI (1.05); however, his
ROI was greater than the No-PALS Group’s average weekly ROI (.41). Fractions seemed
particularly difficult for this student and he appeared to need additional intervention in
this area.
Lilly, a seventh grade female student, obtained a median M-COMP score of 24
during the baseline phase. This score was at the 42nd percentile, based on AIMSweb®
national norms. Her baseline scores on the Fractions-CBM were 2, 2, and 1 problems
correct. Her baseline scores on the Integers-CBM were 3, 4, and 4 problems correct. By
the end of the Fractions Phase, Lilly demonstrated improved performance on the
Fractions CBM, scoring 4 problems correct. At the end of the Fractions Phase, Lilly
increased her M-COMP score from 24 to 31. By the end of the Integers Phase, Lilly’s
performance on the Integers-CBM had increased to 10 problems correct. Furthermore,
her M-COMP performance increased to a score of 35 by the end of the Integers Phase.
46
By the end of the Integers Phase of the study, Lilly had met the AIMSweb® 50th
percentile goal for the spring benchmark period. Lilly demonstrated an average weekly
ROI of 1.22 points per week.
When the whole-class data are considered in conjunction with the improvement
scores for the three lower performing students, the combination suggests that a seventh
grade adaptation of PALS could be a useful intervention for lower performing students.
The rates of gain observed in the PALS condition, as compared with national ROI data
and the students in the control classroom, suggest that the PALS method could help
seventh graders who are struggling in math to move toward, and even catch up to, end of
year benchmarks.
Conclusions about the results of this study must be interpreted with caution, as
several limitations to internal and external validity exist within the group design
component of the study. In regard to internal validity, the study’s participants were
selected from previously assigned groups of students in two classrooms, thus random
assignment was not used. In regard to external validity, the participants in the current
study demonstrated higher baseline mathematics achievement on the M-COMP than the
AIMSweb® national sample, suggesting that the students who participated in the study
are not representative of a typical seventh grade classroom. Another potential limitation
is the amount of work required to implement the adapted PALS. The researcher prepared
all of the materials required for the PALS intervention (e.g., modification of materials,
photocopying, organizing student folders) and classroom teachers may not have the time
to do the same. This time factor suggests that conclusions about the feasibility of this
intervention should be considered with caution.

47
When interpreting the results of the within-subjects case study component of this
study, conclusions must be interpreted with caution, as limitations exist. The within-
subjects ABC design is inferentially weak due to the fact that order effects are not
controlled for when comparing the treatment conditions to the baseline condition. Direct
comparisons among the phases cannot be made and carry-over effects may exist between
the phases, which pose a threat to external validity. For example, classroom instruction,
opportunities to practice, and the possibility of generalization may have played a role in
student improvement in integer computation during the Fractions Phase. In future
research, a return to the baseline condition between the Fractions Phase and the Integers
Phase may provide the opportunity for stronger evidence that the treatment was
responsible for improvement in student performance; however, it is likely that skill
acquisition would confound the return to the baseline condition, as removal of treatment
would not necessarily result in a return to baseline performance in mathematics
computation.
Additional research should seek to explore the impact of this intervention on
middle school students when the duration of the intervention is extended. Furthermore,
additional research should seek to investigate the impact of this intervention with a more
representative sample of seventh grade students. Future exploration of the social validity
of this intervention among middle school students would provide additional information
about student motivation and engagement.
Summary
Johns Hopkins University’s Best Evidence Encyclopedia reports strong evidence
for a variety of structured, cooperative, peer-based mathematics interventions, including:

48
CWPT, Student Teams Achievement Divisions, Team Accelerated Instruction (TAI)
Math, and PALS (Johns Hopkins University, 2012). In an attempt to validate and expand
the potential application of PALS for math in a wider variety of settings, this research
study examined the effects of implementing a modified version of PALS with seventh
grade students in regular education mathematics classes. The results of this study
suggested that an adaptation of PALS for math for seventh grade students resulted in
significant improvement in posttest mathematics computation performance within the
PALS Group when their pretest M-COMP scores were considered as covariates. When
comparing the performance of lower performing and higher-performing students, lower
performing students demonstrated higher average weekly ROI in comparison to higher-
performing students. The results of this study suggest that implementing an adaptation of
PALS for math with seventh grade students systematically provides opportunities for all
students to engage in mathematical computation practice and provides students with high
levels of error correction and feedback. PALS for math provides educators with a
supplementary intervention that helps to support groups of students with diverse levels of
mathematics achievement.

49
References
Allsopp, D.H. (1997). Using classwide peer tutoring to teach beginning algebra problem-
solving skills in heterogeneous classrooms. Remedial and Special Education,
18(6), 367-379.
Baker, S., Gersten, R., Dimino, J.A., & Griffiths, R. (2004). The sustained use of
research-based instructional practice: A case study of peer-assisted learning
strategies in mathematics. Remedial and Special Education, 25(1), 5-24.
Calhoon, M.B. & Fuchs, L.S. (2003). The effects of peer-assisted learning strategies and
curriculum-based measurement on mathematics performance of secondary
students with disabilities. Remedial and Special Education, 24(2), 235-245.
Delquadri, J., Greenwood, C.R., Whorton, D., Carte, J.J., & Hall, R.V. (1986). Classwide
peer tutoring. Exceptional Children, 52(6), 535-542.
Fuchs, L.S., Fuchs, D., Bentz, J., Phillips, N.B., & Hamlett, C.L. (1994). The nature of
student interactions during peer tutoring with and without prior training and
experience. American Educational Research Journal, 31(1), 75-103.
Fuchs, L.S., Fuchs, D., Hamlett, C.L., Phillips, N.B., Karns, K., & Dutka, S. (1997).
Enhancing students’ helping behavior during peer-mediated instruction with
conceptual mathematical explanations. Elementary School Journal, 97(3), 223-
249.
Fuchs, L.S., Fuchs, D., & Karns, K. (2001). Enhancing kindergartener’s mathematical
development: Effects of peer-assisted learning strategies. Elementary School
Journal, 101(5), 495-510.

50
Fuchs, L.S., Fuchs, D., Karns, K., & Phillips, N. (2009). Peer-assisted learning strategies
math methods for grades 2-6: Teacher manual 2009 revised edition. Nashville,
TN: Vanderbilt University.
Fuchs, L.S., Fuchs, D., Phillips, N.B., Hamlett, C.L., & Karns, K. (1995). Acquisition
and transfer effects of classwide peer-assisted learning strategies in mathematics
for students with varying learning histories. School Psychology Review, 24(4),
604-620.
Fuchs, L.S., Fuchs, D., Yazdian, L., & Powel, S.R. (2002). Enhancing first-grade
children’s mathematical development with peer-assisted learning strategies.
School Psychology Review, 31(4), 569-583.
Greenwood, C.R., Delquadri, J.C., & Hall, R.V. (1989). Longitudinal effects of classwide
peer tutoring. Journal of Educational Psychology, 81(3), 371-383.
Johns Hopkins University. (2012). Best Evidence Encyclopedia. Retrieved from
http://www.bestevidence.org
Kroeger, S.D. & Kouch, B. (2006). Using peer-assisted learning strategies to increase
response to intervention in inclusive middle math settings. Teaching Exceptional
Children, 38(5), 6-13.
Larson, R., Boswell, L., Kanold, T, & Stiff, L. (2004). McDougal Littell middle school
math course 2: Teacher’s Edition. Houghton Mifflin Company: Boston, MA.
National Mathematics Advisory Panel. (2008). Foundations for success: The final report
of the national mathematics advisory panel (Publication No. ED04CO0082/0001).
Retrieved from http://ed.gov/about/bdscomm/list/mathpanel/report/final-
report.pdf

51
Vanderbilt Kennedy Center. (2012). Peer-Assisted Learning Strategies: Strategies for
Successful Learning. Retrieved from http://kc.vanderbilt.edu/pals
Wittrock, M.C. (1989). Generative processes of comprehension. Educational
Psychologist, 24(4), 345-376.
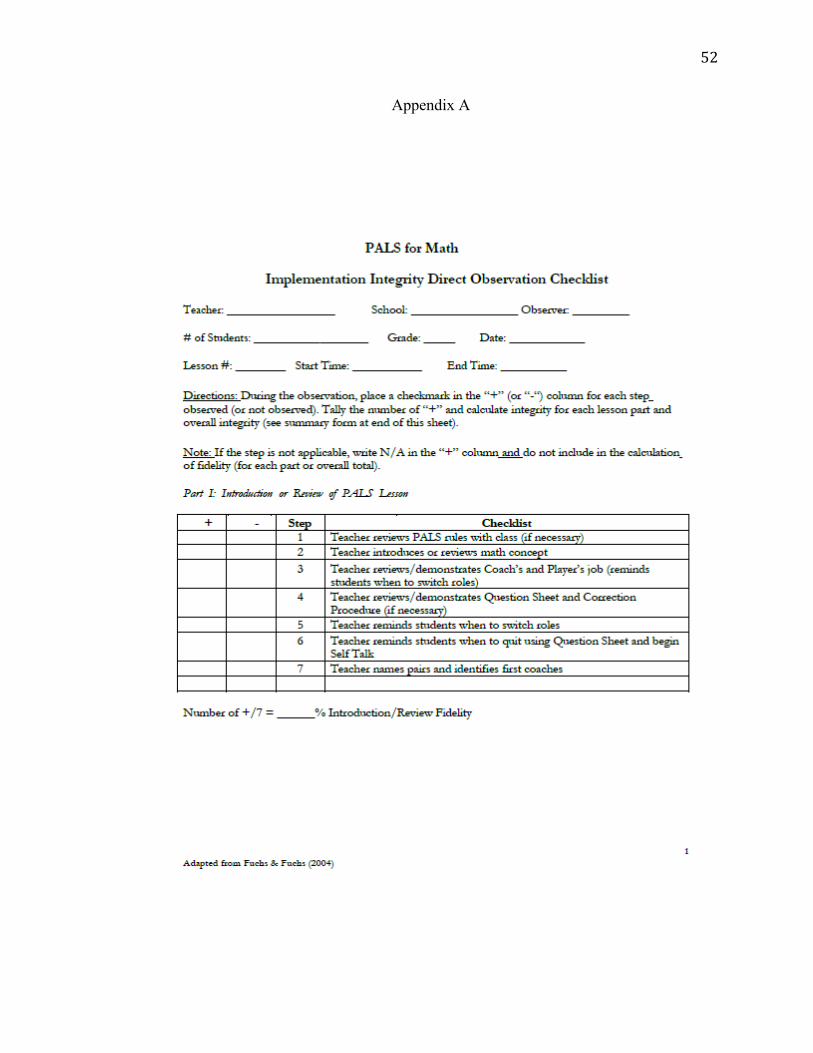
52
Appendix A

53
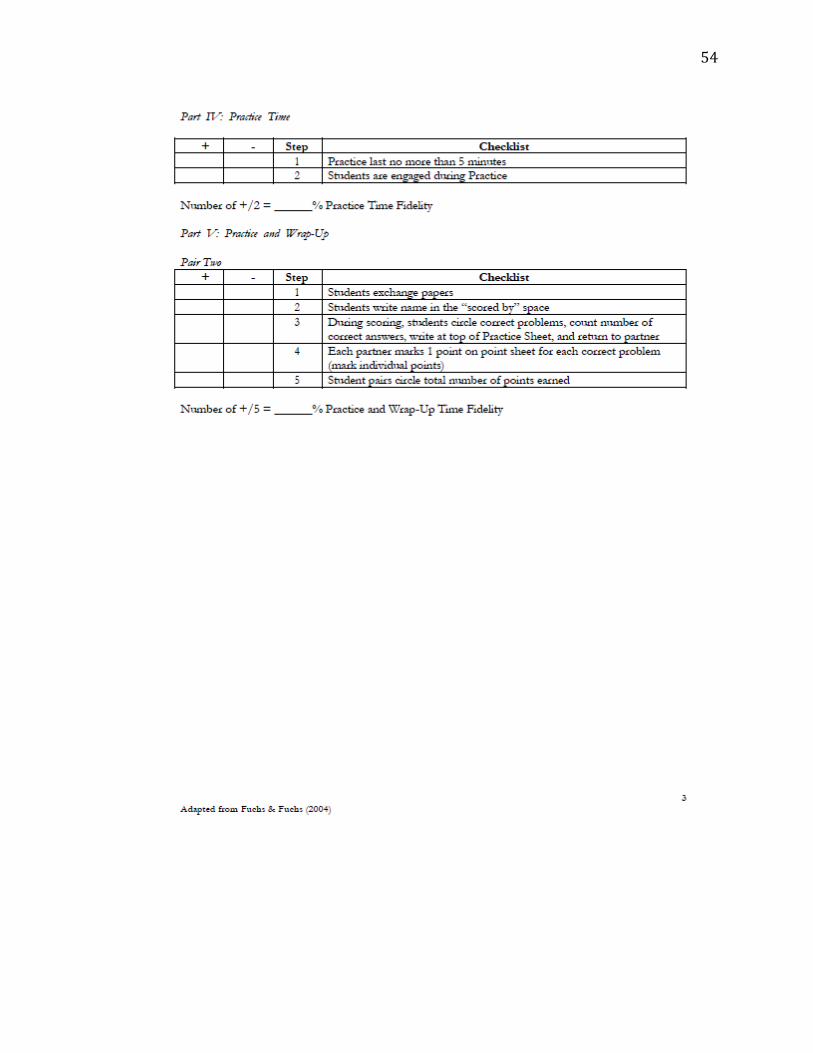
54

55
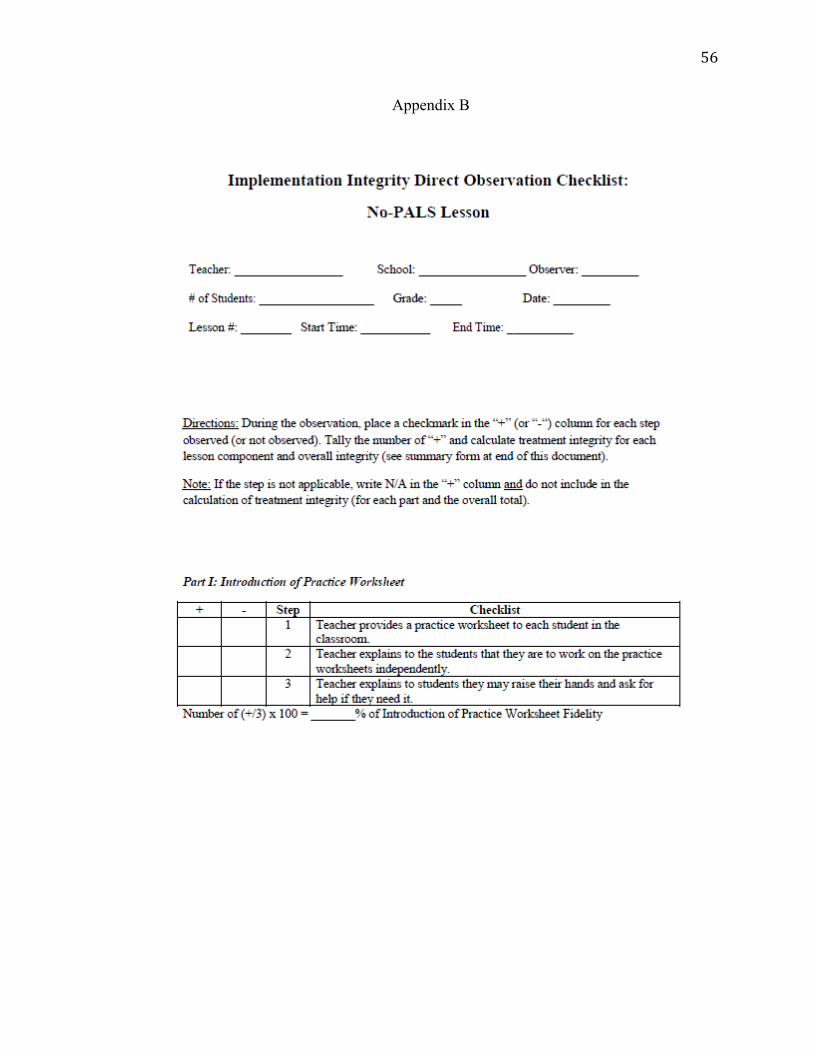
56
Appendix B
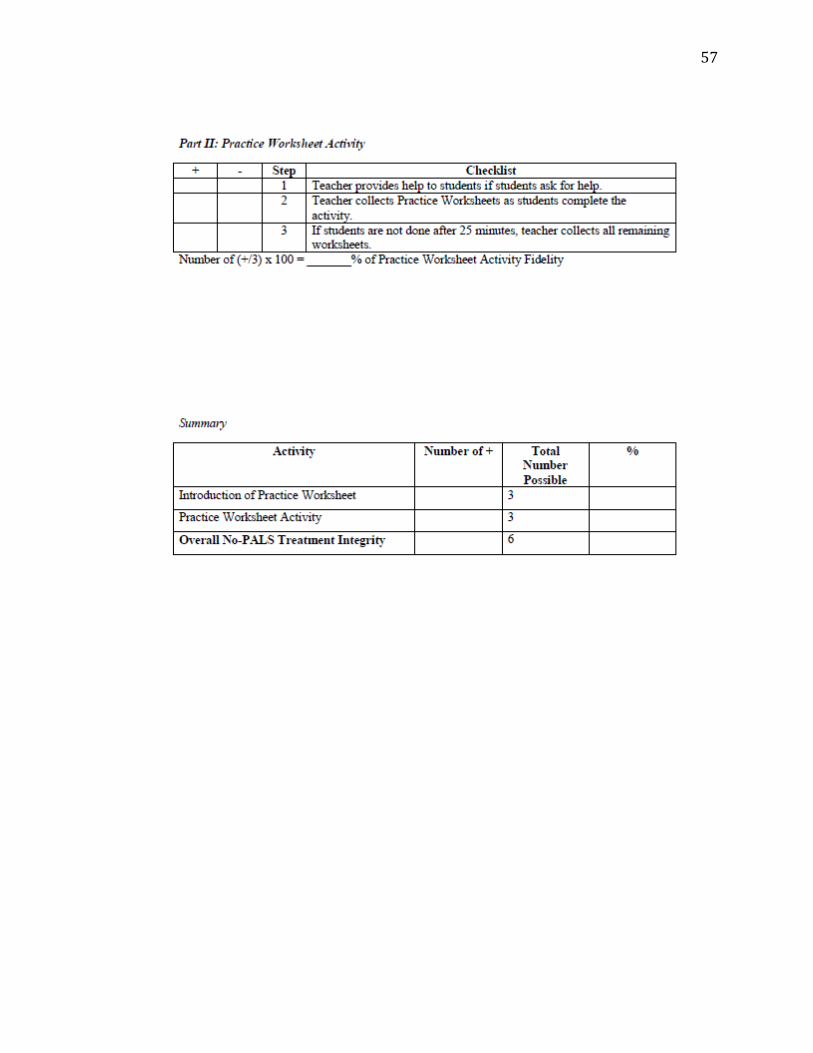
57

58
BIOGRAPHY OF THE AUTHOR
Alexis Kiburis was born in Saratoga Springs, New York and received her high school
diploma from Pinkerton Academy in Derry, New Hampshire. She graduated from the
University of New Hampshire in 2007 with a B.A. in Psychology. Ms. Kiburis moved to
Maine in 2007 and enrolled in the University of Southern Maine graduate program in
School Psychology. In 2010, she earned her M.S. in Educational Psychology from the
University of Southern Maine. Ms. Kiburis completed her pre-doctoral internship at the
Sebago Educational Alliance Day Treatment Center. Her areas of interest include Multi-
tiered Systems of Support (MTSS; Response to Intervention/RTI), empirically-based
reading and mathematics instruction and intervention, as well as topics related to
Curriculum-Based Measurement (CBM). She is currently a candidate for the Psy.D.
degree in School Psychology from the University of Southern Maine in August, 2012.