evaluating rice losses in various harvesting practices
TRANSCRIPT

International Research Journal of Applied and Basic Sciences © 2013 Available online at www.irjabs.com ISSN 2251-838X / Vol, 4 (4): 894-901 Science Explorer Publications
Evaluating rice losses in various harvesting practices
Mohammad Reza Alizadeh1* and Alireza Allameh1
1. Agricultural Engineering Department, Rice Research Institute of Iran, Rasht, Iran
* Corresponding author email: [email protected]
ABSTRACT: Field performance of five different harvesting methods were assessed on randomized complete block design with four replications which included three indirect harvesting methods of (i) hand cutting + threshing by a tractor driven thresher (T1), (ii) rice reaper + threshing by a tractor driven thresher (T2), (iii) rice reaper + threshing by universal combine harvester equipped with pick-up type header (T3), and two direct harvesting methods of (iv) head-feed rice combine, and (v) whole-crop rice combine. Results revealed that the maximum and minimum effective field capacity were for whole-crop combine (0.361 hah
-1) and hand cutting (0.009 hah
-1), respectively. Quantitative
losses (grain and panicle shattering) in harvesting and threshing obtained to be 2.58% and 2.33% in average on indirect harvesting (T1, T2 and T3) and direct harvesting (T4 and T5), respectively which were not significant statistically. The average qualitative losses (broken, husked and cracked grains) were 2.30% for indirect harvesting and 0.61% for direct harvesting that showed a decline of 63.3% compared to indirect harvesting. Total harvesting losses were 5.07% for T3 (maximum) and 2.74% for T4 (minimum). The harvesting method affected percentage of broken rice after milling significantly. The average broken rice for T1, T2 and T3 was 23.72, 23.28 and 24.56% respectively which were significantly higher than T4 (21.05%) and T5 (20.87%). Also, in the view of loss reduction, applying rice combine harvesters had priority respect to indirect harvesting methods. Key words: rice harvesting, combine harvester, losses, milling.
INTRODUCTION
Harvesting and threshing operations are known as crucial and influential processes on quantity, quality and production cost of rice. Manual harvesting of rice is such a troublesome, time-consuming and costly operation that it needs about 100-150 man-hour labor to harvest one hectare of paddy field. In these conditions, developing mechanized approaches especially rice combine harvesters would be an effective solution to reduce production cost and enhance labor productivity. Therefore, some rice producing countries in Asia have seriously attempted to introduce compatible technologies for current circumstance and pass from this crisis (Bora and Hansen, 2007).
Labor shortage and wage rise over work peak time will cause delay in harvesting operations and increase of grain and panicle shattering in consequence so that farmers encounter severe detriments. In addition, because of seasonal rainfall in northern parts of Iran in harvest time, rice stalks tend to lodge. Hence, mechanized harvesting operations gets into trouble and the number of labor required for manual harvesting gets up to double. Within few past years, farmers drawn to purchase substantial number of rice reapers and combine harvesters and it is estimated they will consider utilizing more machinery due to increasing trend of wages for upcoming years. Therefore, it is required to conduct technical and economic investigations for determining appropriate type on the viewpoint of existing conditions across the region. Many studies have been done regarding the effect of different harvesting methods on quantitative and qualitative losses in rice producing countries. Here, some of them will be pointed out. Investigations by Ali et al. (1990), Siebenmorgen et al. (1998), Surek and Beser (1998), and Hossain et al. (2009) stated that harvest time had significant effect on head rice yield (HRY) so that it was required harvesting on optimum rough rice moisture content to obtain uttermost HRY. If rough rice moisture content becomes lower than critical level, broken rice percentage will raise significantly.
Other researchers examined field performance of different combine harvesters. Kalsirislip and Singh (1999) reported that in a combine equipped with a 3m width head stripper, field capacity and field efficiency were 0.66 hah
-1and 74% for standing crop and 0.3 hah
-1 and 72% for lodged crop, respectively. Bora and Hansen (2007)
examined field performance of a portable reaper for rice harvesting and compared it with manual harvesting. Their results showed that field capacity and fuel consumption of that reaper were 0.15 hah
-1 and 0.25 lith
-1,
respectively. Harvest duration of that device dropped 7.8 times in comparison to manual harvesting. They reported that grain loss was 2.3% and 1% for reaper and manual harvesting, respectively.

Intl. Res. J. Appl. Basic. Sci. Vol., 4 (4), 894-901, 2013
895
Fouad et al. (1990) studied a self-propelled rice combine harvester and reported that raising travel speed from 0.8 to 2.9 kmh
-1 increased grain losses but decreased field efficiency of the combine. Loveimi et al.
(2008) investigated losses of two rice combine harvesters equipped with spike-tooth and rasp-bar threshing units. In direct harvesting, average crop loss was 1.73 and 3.68% for spike-tooth and rasp-bar combines, respectively. In indirect harvesting, it was reported 3.45%.
Alizadeh (2002) appraised field performance of two types of rice reapers namely self-propelled and power tiller driven against manual harvesting. He pointed out that harvesting loss was the lowest in manual method while it was the highest with power tiller driven reaper. Alizadeh and Bagheri (2009) studied the effect of different rice threshing methods on quantitative and qualitative losses. Their results showed that the threshing method had significant effect on grain losses namely broken and cracked rough rice as well as broken rice percentage after milling.
Although, there has been numerous studies regarding the effect of harvesting and threshing methods on rice losses but no research has taken place to compare direct harvesting through rice combine harvesters (i.e. head-feed and whole-crop) with indirect harvesting namely manual harvesting and or reaper plus threshing. Therefore, this study aimed to investigate technical and field aspects of utilizing rice combine harvesters and comparing them with indirect harvesting on the view of quantitative and qualitative grain losses.
MATERIALS AND METHODS
This study was conducted at paddy fields of Haraaz Agricultural Center for Extension and Technology, Amol, Iran in 2010, where dedicated to cultivation of a high yielding variety, Fadjr. Five harvest methods examined as follows: i. Manual harvesting (cutting with sickle) + tractor driven thresher (T1), ii. Rice reaper + tractor driven thresher (T2), iii. Rice reaper + threshing by a universal combine equipped with pick-up header (T3), iv. Head-feed rice combine harvester (T4), v. Whole-crop rice combine harvester (T5) Treatments T1, T2 and T3 are considered as indirect harvesting but treatments T4 and T5 are known as direct harvesting.
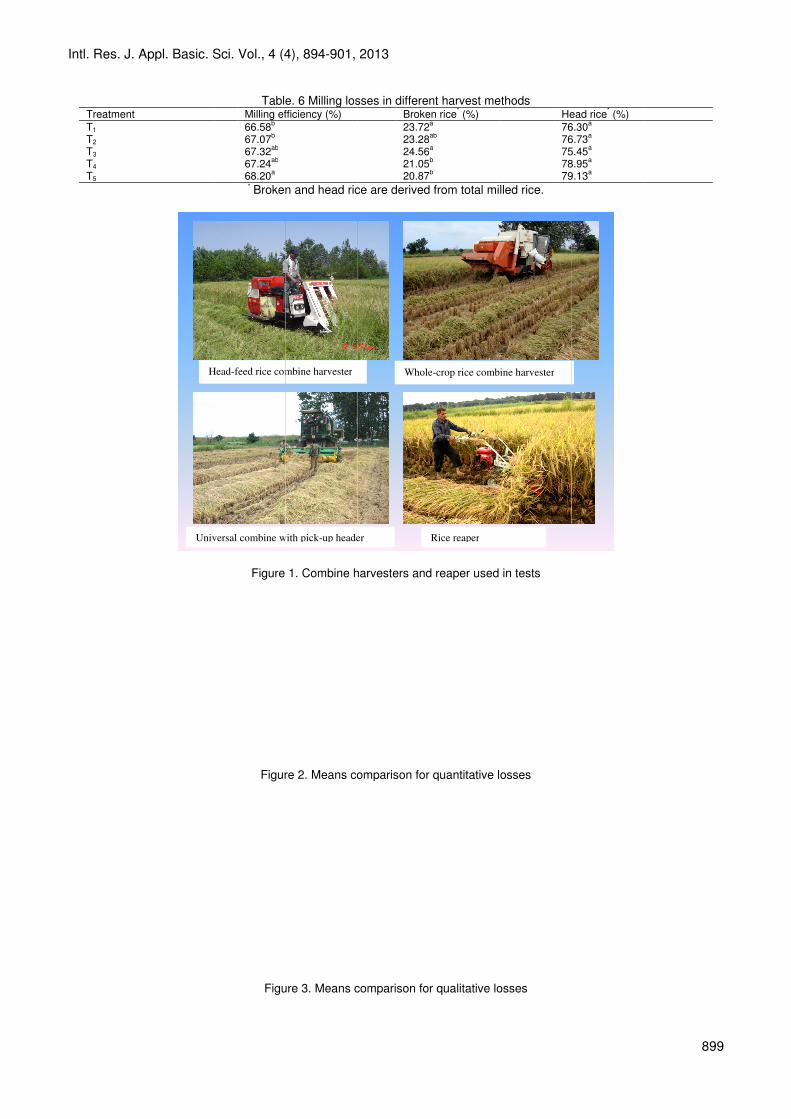
Technical specifications for tested machinery are given in Table 1 and their images are shown in Fig. 1. In indirect harvesting (T1, T2 and T3), cut paddy stalks were left across the field around 24 hours to reduce moisture content and then gathered and threshed by a tractor driven thresher. In direct harvesting (T4 and T5), harvesting and threshing took place in a quick succession. Before operating, crop conditions were measured in terms of plant height, number of hill per unit area, grain moisture content and grain separating force from panicle (Table 2). Rough rice moisture content was determined by grain moisture meter (GMK 303 RS, Korea) at harvest time. To determine soil penetration resistance at harvest time, a cone penetrometer (Eijelkamp, UK) was used for measuring soil cone index up to 25 cm deep underneath soil surface whose standard cone had a base area of 5 cm
2 and diameter of 25.23 mm. Grain separating force from panicle as an indication of grain
shattering level was measured so that in each plot 10 panicles and from each panicle 10 grains were selected from three portions of a panicle, i.e. upper, middle and lower parts. Then, the force required to detach a grain was recorded by a force gauge (Cat 156, Model tr-2, Everwell Corporation, Japan).
In each treatment, performance parameters of harvesting machines were measured which included travel speed, working width, lost time and total required time. To determine travel speed within operation, time required to traverse 30 m over harvesting was recorded by a timer. This was repeated four times in each plot. Theoretical field capacity (Ct), effective field capacity (Ce), work capacity (Wc), and field efficiency (Fe) of harvesting machines obtained from following formulas (Hunt, 1995; Konaka, 2005):
�� ����
�� (1)
� ����
�� (2)
�� ��
(3)
� ��
��� ��� (4)
Where, Ct: theoretical field capacity, hah
-1
Ce: effective field capacity, hah-1
W: working width, m S: travel speed, kmh
-1
Tt: total time, h Te: useful time, h Wc: work capacity, hha
-1

Intl. Res. J. Appl. Basic. Sci. Vol., 4 (4), 894-901, 2013
896
Fe: field efficiency, % In general, crop loss occurs from natural phenomena before harvest besides mechanical and physical
parameters during harvesting. In the indirect harvesting, since reaping and threshing operations take place by separate machines, it is possible to measure harvesting loss on these two operations. In the direct harvesting, rice combine harvesters accomplish reaping and threshing operations in a quick succession. Basically, harvest loss can be divided into quantitative and qualitative lossed. Quantitative losses are as the result of shattering and losing of grain and non-threshed panicles during reaping and threshing. Whereas, qualitative losses are due to broken, husked and cracked grains from environmental and or mechanical impacts.
To determine quantitative loss before and after harvesting on manual cutting and reaper harvester, a 1m×1m wooden frame was thrown out randomly over four spots in each plot. The grains inside the frame were gathered and weighted. In combine harvesters, losses are observed at two main units i.e. cutting and threshing units (Sangvigit and chin suan, 2010). For this, the wooden frame was thrown out ahead and back sides of the combine and all grains and panicles inside it gathered and weighted (Roy et al., 2001). Then, weight percentage of harvesting loss computed by following formula (Pradham et al., 1998):
�� ��������
�� ��� (5)
Where, HL: harvest loss, % Wgt: total harvest loss, gm
-2
Wgo: pre-harvest loss, gm-2
Y: grain yield, gm
-2
For determining loss on threshing stage, a wide plastic sheet was spread over a flat surface and thresher settled on it. In experiments, threshing chamber was fed uniformly and afterward all grains and panicles on plastic sheet gathered and weighted. The weight percentage of loss derived as a ratio of the weight of grains thrown out of different parts of thresher to total grain weight (sum of grains weight collected of the main outlet and weight of grains thrown out).
To determine percentage of broken and husked grains, four samples of 100g rough rice was taken from the outlet of thresher and rice combine harvester and then broken and husked grains separated manually and weighted (Srivastava et al., 1998).
To compute cracked grains percentage in each replication, 50 intact kernels of rough rice were randomly selected and their husks were carefully removed by hand. Then, brown rice kernels were placed on crack tester (Mahsa, 50, Iran), number of cracked ones counted and weighted.
In order to study the effect of harvest method on milling properties i.e. milling recovery, broken and head rice yield, from each treatment four samples of 150g rough rice were randomly selected from the outlets of thresher and combines. All impurities in the samples were removed by hand. Afterwards, samples were placed in an oven with 43°C (Alizadeh et al., 2006) to be dried up to 9% (w.b.). Dried rough rice samples were then husked by a laboratory rubber roll husker (Satake Eng. Co. Ltd., Japan). From the outlet of the husker, four samples of 120g brown rice were selected and whitened by a laboratory friction-type rice whitener (Baldor, McGill Miller, USA). A rotary indented grader (TRG058 Model, Satake test Rice Grader, Japan) was used to separate broken rice kernels from head ones. Milling recovery was computed by the ratio of total milled rice weight to the initial rough rice weight. Broken rice yield derived from the following formula (Firouzi et al., 2010):
��� ���
��� ��� (6)
where, BMR: broken milled rice, % W2: broken rice weight, g W1: total milled rice weight, g
Randomized complete block design (RCBD) was laid out in data analysis of variance with five treatments and four replications. Means comparison was conducted by Duncan’s multiple range tests.
RESULTS AND DISCUSSION
Comparison between field performances of harvesting machines has been shown in Table 3. As it can be seen, among harvest methods, universal combine harvester equipped with pick-up header has the least travel speed (1.63 kmh
-1). In this system, combine harvester moves along the field and performs threshing of what
has been cut by the self-propelled reaper in advance. Also, results indicated that the highest travel speed was for self-propelled reaper in the experiments which it was due to low weight of machine and higher maneuverability.
Theoretical and effective field capacities of whole-crop and head-feed combines were 0.495 and 0.361 hah-
1, respectively which were the highest compared to the other treatments. According to (1), theoretical field

Intl. Res. J. Appl. Basic. Sci. Vol., 4 (4), 894-901, 2013
897
capacity depends on working width and machine travel speed. Also, in accordance with (2), effective field capacity is a product of theoretical field capacity by field efficiency. Although, its working width was more than whole-crop combine but because of lower travel speed during harvesting, field capacity of crop combine equipped with pick-up header was less than whole-crop combine.
Working capacity (time required to harvest one hectare) was the highest in manual harvesting with the mean of 111.10 hha
-1 while in the whole-crop combine it was the least with the mean of 2.75 hha
-1. The
maximum working capacity belonged to a treatment which had the minimum effective field capacity because, based on (3), working capacity was obtained by inverting effective field capacity. Field efficiency varied from 73.90% on head-feed combine to 78.90% on self-propelled reaper. This feature depends on wasted time, type and agronomic characteristics of a variety, plot size and operator’s skill. Kalsirislip and Singh (1999) reported that for a combine equipped with a 3m working width head stripper, field capacity and field efficiency were o.66 hah
-1 and 74% for standing crop and 0.3 hah
-1 and 72% for lodged crop, respectively. Roy et al., (2001)
expressed that field capacity and field efficiency of a whole-crop rice combine harvester were 1.05 hah-1
and 72%, respectively for a common rice variety in Malaysia. Veerangouda et al., (2010) reported that field capacity for a tractor operated combine harvester was varied from 2.88 to 3.60 hah
-1.
Results of data analysis of variance indicated that harvest method had no significant effect on quantitative loss however there was significant effect (p<0.05) on qualitative loss (Table 4). The average quantitative losses were 2.58 and 2.33% for indirect harvesting (treatments T1, T2, and T3) and direct harvesting (treatments T4 and T5), respectively (Table 5). In indirect harvesting, loss on cutting and gathering was higher than threshing. Among the harvest methods, the maximum and minimum quantitative losses were related to T3 (2.66%) and T4 (2.27%), respectively (Fig. 2).
In indirect harvesting, qualitative loss obtained 2.30% on average, but it was 0.61% in direct harvesting which showed a decline of 73.5% compared to indirect method. Amidst the indirect harvest methods, the highest and lowest qualitative loss found to be 2.44 and 2.05% for treatments T2 and T1, respectively. Qualitative loss was determined 0.47 and 0.75% for treatments T4 and T5, respectively (Fig. 3). Total harvest losses (quantitative and qualitative) were the highest for treatment T3 (5.07%) while the lowest (2.74%) belonged to treatment T4. In general, total harvest losses in indirect method averaged out 4.88% but it was 2.94% in direct method which decreased 39.75%. The proportion of harvest losses in each stage of the experiment is shown in Fig. 4. As it shows, quantitative and qualitative losses are 79.5 and 20.5% in direct harvesting by rice combines but they are 53.30 and 46.70% in indirect harvesting, respectively. Results indicated that harvest loss in direct method occurred mainly on cutting stage. Qualitative loss included a considerable proportion of total harvest losses in indirect harvesting. Among experiment stages for all harvest methods, reaping had the highest proportion in loss whereas broken and husked grains had the lowest proportion in loss. Also, cracked grains had the highest proportion amid qualitative losses. This was explicitly observed in indirect harvesting, as it was mentioned earlier, where environmental impacts applied on grains during harvesting and threshing operations.
In their research, Loveimi et al., (2008) reported that rice harvest losses in indirect method were 3.77 and 1.67% by a combine equipped with rasp-bar and spike-tooth type threshing drum and they were 3.6 and 1.8% in direct method, respectively. Harvest loss of a rice combine harvester was 1.68% for a common variety in Malaysia (Roy et al., 2001). Fouad et al., (1990) in their investigations in Egypt reported that harvest losses were 178-380 kgha
-1 for a common variety in that region by rice combine harvesters.
In general, loss could be attributed to harvest and threshing method, harvest time, type of variety and its physical properties, crop condition in terms of maturity, lodging and soil condition. In indirect harvesting, since cut crop is laid out on residuals from 24 to 48 hours depending on climate condition and then they are collected after moisture reduction and threshed later, therefore crop moisture reduction would lead to not only a rise in grain shattering during gathering and packing but also paddy would be exposed to environmental impacts that bring about crop qualitative loss in consequence.
Table 6 shows the comparison of rough rice milling properties obtained by different harvest methods. The average milling recovery (the ratio of total milled rice weight to rough rice weight) was 67.00% in indirect harvesting treatments and 67.72% in direct ones which indicated a significant difference (p<0.05). Also, broken rice and head rice yield were 23.85 and 76.16% in indirect harvesting and 20.96 and 79.04% in direct one, respectively. Analysis of variance (Table 4) demonstrated that harvest method had significant effect on broken rice at 5% level.
As the results have shown, broken rice in indirect harvesting was significantly higher than direct harvesting. This, on one side, could be attributed to mechanical stresses applied on grains during harvest and threshing and on the other side environmental impacts due to reabsorption of dried grains across the field and their crack which result in rise of broken rice and fall of head rice yield within milling process. This has been approved by other investigations (Siebenmorgen et al., 1998; Nguyen and Kunze, 1984; Banaszek and Siebenmorgen, 1990).

Intl. Res. J. Appl. Basic. Sci. Vol., 4 (4), 894-901, 2013
898
CONCLUSION The maximum and minimum effective field capacity averaged to 0.361 and 0.009 hah
-1 for treatments T5
and T1, respectively. Time requirement to harvest one hectare was 111.10 hha-1
for manual harvesting (T1) but it was 3.64 hha
-1 for mechanized treatments (T2, T3, T4 and T5) on average which dropped 96.70% compared to
manual method. Quantitative and qualitative losses constituted 53.00 and 46.98% of total harvest loss in indirect harvesting on average, while they were 79.51 and 20.47% in direct harvesting on average, respectively. Total harvest loss was 4.88% in indirect harvesting whereas it was 2.94% in direct method which declined 39.75%.
Table 1. Technical specifications of machinery used in tests
Type Self-propelled reaper Head-feed combine Whole-crop combine Crop combine with
pick-up header
Model YAP 120 CA48ex DE238 JD 955 Manufacturer Yanmar, Japan Yanmar, Japan Foton, China Iran Working width (m) 1.2 1.40-1.54 2.38 3.04 Cutting height adjustable adjustable adjustable adjustable Thresher type - Wire loop Spike-tooth Spike-tooth Thresher length (m) - 0.71 1.50 NA
1
Thresher diameter (m) - 0.42 0.55 0.61 Overall length (m) 2.035-2.148 3.99 5.36 NA Overall width (m) 1.50 1.925 2.70 NA Overall height (m) 0.89-1.31 2.47 2.89 NA Weight (kg) 136.5 2195 3200 NA Wheel type Tubeless tire Rubber crawler Rubber crawler Rubber tire Engine power (hp) 5 48 75 105
1NA: non-available in the catalogue
Table 2. Agronomic traits of Fadjr variety and field conditions at harvest
Treatment Plant height (cm)
No. of hills per m
2
No. of plant per hill
Grain yield (kgm
-2)
Grain moisture content (wb)
Cutting height (cm)
Grain detaching force (N)
Soil cone index (kPa)
T1 112.5a 17.5
a 20.3
a 0.70
a 18.6
a 43.1
a 0.81
a 972
b
T2 112.8a 18.2
a 18.6
a 0.65
a 18.2
a 16.8
c 0.84
a 1116
a
T3 117.4a 19.0
a 18.8
a 0.73
a 19.4
a 14.2
c 0.70
a 812
b
T4 114.2a 18.0
a 18.0
a 0.61
a 20.1
a 37.8
a 0.85
a 900
b
T5 113.0a 19.7
a 19.2
a 0.58
a 21.6
a 34.20
b 0.74
a 944
b
Table 3. Field capacity and efficiency of machinery used in tests
Treatment Travel speed (kmh
-1)
Working width (m)
Total work time (min)
Waste time (min)
Useful time (min)
TFC (hah-1
) EFC (hah-1
) Wc (hha-1
) FE (%)
T1 - - 665.70 31.00 636.70 - 0.009 111.10 - T2 2.54 1.2 25.02 5.28 19.74 0.304 0.240 4.17 78.90 T3 1.63 2.40 19.80 4.45 15.35 0.391 0.303 3.30 77.54 T4 2.37 1.40 24.60 5.70 18.90 0.331 0.254 3.93 76.83 T5 2.08 2.38 16.62 4.50 12.14 0.495 0.361 2.77 73.09
Table 4. ANOVA for different harvesting methods
Source of variation
df Mean squares Reaper waste
Broken paddy
Husked broken
Husked paddy
Cracked paddy
Milling efficiency
BRY HRY impurity
Replication 3 0.043ns
0.079ns
0.006ns
0.010ns
0.324ns
0.055ns
2.632ns
2.899ns
0.229ns
Treatment 4 0.095
ns 0.166
ns 0.031
* 0.021
* 1.015
** 1.382
* 10.891
* 10.818
ns 0.295
ns
Error 12 0.706 0.530 0.007 0.004 0.231 0.793 2.967 5.410 0.916 ns
non-significant; * significant at 5%;
** significant at 1%
Table 5. Means comparison of tested parameters
Treatment
Quantitative losses Qualitative losses Total losses
Impurity %
Reaper and gathering
Threshing Broken paddy
Husked paddy
Broken and husked
Cracked grains
T1 1.60
b 0.98 0.53
a 0.21
a 0.11
b 1.20
a 4.63
a 2.63
a
T2 1.48b 1.04 0.48
ab 0.23
a 0.10
b 1.63
a 4.96
a 2.52
a
T3 1.54b 1.12 0.61
a 0.25
a 0.27
a 1.28
a 5.07
a 2.78
a
T4 2.27a - 0.13
a 0.07
b 0.04
b 0.23
b 2.74
b 2.26
a
T5 2.40a - 0.24
b 0.16
ab 0.08
b 0.27
b 3.15
b 2.34
a
In each column, figures with common letter have no significant difference at 5% level. In combine harvesting (T4 and T5), cutting and threshing losses are considered in the lump.
Intl. Res. J. Appl. Basic. Sci. Vol., 4 (
Intl. Res. J. Appl. Basic. Sci. Vol., 4 (
Treatment
T1 T2 T3 T4 T5
Intl. Res. J. Appl. Basic. Sci. Vol., 4 (
�������������� ����������������������
Head
Universal combine with pick
Intl. Res. J. Appl. Basic. Sci. Vol., 4 (4
Table. 6 Milling Milling efficiency (%)
66.58b
67.07b
67.32ab
67.24
ab
68.20a
* Broken and head rice are derived from total milled rice.
����������� !�"���
�������������� ����������������������
Figure
Figure
Figure
Head-feed rice combine harvester
Universal combine with pick
4), 894-901, 2013
Table. 6 Milling lossesMilling efficiency (%)
Broken and head rice are derived from total milled rice.
����������������
�������������� ����������������������
1. Combine harvesters and
ure 2. Means comparison for quantitative
ure 3. Means comparison for qualitative
feed rice combine harvester
Universal combine with pick-up header
, 2013
losses in different harvest methodsBroken rice
23.7223.2824.5621.0520.87
Broken and head rice are derived from total milled rice.
��"
�������������� ����������������������
Combine harvesters and
2. Means comparison for quantitative
3. Means comparison for qualitative
Whole
up header
in different harvest methodsBroken rice
* (%)
23.72a
23.28ab
24.56
a
21.05b
20.87b
Broken and head rice are derived from total milled rice.
������#����$����%���"
&����'(����������
Combine harvesters and reaper used in tests
2. Means comparison for quantitative losses
3. Means comparison for qualitative losses
Whole-crop rice combine harvester
Rice reaper
in different harvest methods Head rice
76.3076.7375.4578.9579.13
Broken and head rice are derived from total milled rice.
�������������#���
&����'(����������
used in tests
losses
losses
crop rice combine harvester
Head rice* (%)
76.30a
76.73a
75.45a
78.95a
79.13a
899 899

Intl. Res. J. Appl. Basic. Sci. Vol., 4 (
Intl. Res. J. Appl. Basic. Sci. Vol., 4 (Intl. Res. J. Appl. Basic. Sci. Vol., 4 (4), 894894-901, 2013
Figure 4. Contribution of different Contribution of different stages in harvest losses
stages in harvest losses for treatmentsfor treatments
900
Intl. Res. J. Appl. Basic. Sci. Vol., 4 (4), 894-901, 2013
901
REFERENCES Ali A, Majid A, Rehman H, Sagar MA. 1990. Milling recovery of Basmati as affected by threshing methods and crop harvesting
time. Pakistan J. Agric. Res. 11: 7-12. Ali MY, Hossain SMA, Ahmed SM, Gaffer MA. 2000. Effect of harvesting time on seed and seed quality of transplant Aman rice
varieties. Bangladesh Journal of Crop Science. 11: 31-37. Alizadeh MR, Allameh A. 2011. Threshing force of paddy as affected by loading manner and grain position on the panicle.
Research in Agricultural Engineering. 57(1): 8-12. Alizadeh MR, Bagheri I. 2009. Field performance evaluation of different rice threshing methods. International Journal of Natural
and Engineering Sciences. 3(3): 139-143. Alizadeh MR, Minaei S, Tavakoli T, Khoshtaghaza MH. 2006. Effect of de-awning on physical properties of paddy. Pakistan
Journal of Biological Sciences. 9(9): 1726-1731. Anonymous. 1995. RNAM test codes and procedures for farm machinery. Regional Network for Agricultural Machinery, Bangkok,
Thailand, RNAM Technical Series No. 12. Banaszek MM, Siebenmorgen TJ. 1990. Head rice yield reduction rates by moisture adsorption. Transactions of the ASAE.
33(4): 1263-1269. Bautista RC, Siebenmorgen TJ. 2001. Rice kernel properties affecting milling quality at harvest. In Rice Research Studies 2000,
eds. R.J. Norman and J.F. Meullent. Research Series 485, University of Arkansas, Fayetteville. Bora GC, Hansen GK. 2007. Low cost mechanical aid for rice harvesting. Journal of Applied Sciences. 7(23): 3815-3818. Firouzi S, Alizadeh MR, Minaei S. 2010. Effect of the size of perforated screen and blade-rotor clearance on the performance of
Englebreg rice whitener. African J Agric Res. 5(9): 941-946. Fouad HA, Tayel SA, EI-Hadad Z, Abdel-Mawla H. 1990. Performance of two different types of combines in harvesting rice in
Egypt. Agricultural Mechanization in Asia, Africa and Latin America (AMA). 21(3): 17-22. Hossain MF, Bhuiya MSU, Ahmed M, Mian MH. 2009. Effect of harvesting time on the milling and physiochemical properties of
aromatic rice. Thai Journal of Agricultural Science. 42(2): 91-96. Hunt D. 1995. Farm power and machinery management. 9
th ed. Iowa State University Press. Ames, IA, USA.
Ichikawa T, Sujiyama T. 1986. Development of a new combine equipped with screw type threshing and separating mechanism. Japan Agricultural Research Quarterly (JARQ). 20: 31-37.
Kalsirislip R, Singh G. 1999. Performance evaluation of Thai-made rice combine harvester. Agricultural Mechanization in Asia, Africa and Latin America (AMA). 30(4): 63-69.
Konaka T. 2005. Farm mechanization planning. Tsukuba International Center, Japan International Cooperation Agency (JICA). p5.
Lu R, Siebenmorgen TJ, Costello A, Frayer Jr EO. 1995. Effect of rice moisture content at harvest on economic return. Applied Engineering in Agriculture. 11(5): 685-690.
Nguyen CN, Kunze OR. 1984. Fissures related to post-drying treatments in rough rice. Cereal Chemistry. 6(1): 63-68. Pradhan SC, Biswajit R, Das DK, Mahapatra M. 1998. Evaluation of various paddy harvesting methods in Orissa, India.
Agricultural Mechanization in Asia, Africa and Latin America (AMA). 29(2): 35-38. Qin G, Siebenmorgen TJ. 2005. Harvest location and moisture content effects on rice kernel-to-kernel breaking force
distributions. Applied Engineering in Agriculture, 21(6): 1011-1016. Roy SK, Jusoff K, Ismail WI, Ahmed D. 2001. Performance evaluation of a combine harvester in Malaysian paddy field. Paper
presented at 19th Asia-Pasific Advanced Network (APAN), University Science Malaysia (USM), Penang, Malaysia,
August 20-22. Sangwijit P, Chinsuwan W. 2010. Prediction equations for losses of axial flow rice combine harvester when harvesting Chainat 1
Rice variety. KKU Res J. 15(6): 496-504. Siebenmorgen TJ, Perdon AA, Chen X, Mauromous A. 1998. Relating rice milling quality changes during adsorption to individual
kernel moisture content distribution. Cereal Chem. 75(1): 129-136. Srivastava AK, Goering CE, Rohrabach RP. 1998. Engineering principles of agricultural machines. ASAE-Text Book Number 6.
Published by American Society of Agricultural Engineers. Pamela Devore-Hansen, Editor Books & Journal, USA. Surek H, Beser N. 1998. A research to determine the suitable rice (Oryza sativa L.) harvesting time. Tr. J. of Agricultural and
Forestry. 22: 391-394. Veerangouda M, Sushilendra K, Prakash V, Anantachra M. 2010. Performance evaluation of tractor operated combine harvester.
Karnataka J. Agric. Sci. 23(2): 282-285.