evaluating 3d task performance for fish tank virtual worlds
TRANSCRIPT

Evaluating 3D Task Performancefor Fish Tank Virtual Worlds
KEVIN W. ARTHUR and KELLOGG S. BOOTH
University of British Columbia
and
COLIN WARE
University of New Brunswick
“Fish tank virtual reality” refers to the use of a standard graphics workstation to achieve
real-time display of 3D scenes using stereopsis and dynamic head-coupled perspective. Fish tankVR has a number of advantages over head-mounted immersion VR which makes it morepractical for many applications. After discussing the characteristics of fish tank VR, we describea set of three experiments conducted to study the benefits of fish tank VR over a traditional
workstation graphics display. These experiments tested user performance under two conditions:(a) whether or not stereoscopic display was used and (b) whether or not the perspective displaywas coupled dynamically to the positions of a user’s eyes. Subjects using a comparison protocol
consistently preferred head coupling without stereo over stereo without head coupling. Errorrates in a tree-tracing task similar to one used by Sollenberger and Milgram showed an order ofmagnitude improvement for head-coupled stereo over a static (nonhead-coupled) display, and the
benefits gained by head coupling were more significant than those gained from stereo alone. Thefinal experiment examined two factors that are often associated with human performance invirtual worlds: the lag (or latency) in receiving and processing tracker data arid the rate at whichframes are updated. For the tree-tracing task, lag had a larger impact on performance than
did frame update rate, with lag having a multiplicative effect on response time. We discuss therelevance of these results for the display of complex 3D data and highlight areas requiringfurther study,
Categories and Subject Descriptors: 1.3.6 [Computer Graphics]: Methodology and Techniques
—interaction techniques; 1.3.7 [Computer Graphics]: Three-Dimensional Graphics and Realism
General Terms: Human Factors
Additional Key Words and Phrases: Head-coupled display, stereopsis. virtual reality, virtual
worlds
This work was supported in part by the Natural Sciences and Engineering Research Council of
Canada under various operating grants and a postWaduate fellowship, by the British ColumbiaAdvanced Systems Institute under a research fellowship and a visiting fellowship, and by theUniversity and Province of British Columbia.Authors’ addresses: K. W. Arthur, Department of Computer Science, Umversity of North
Carolina, Chapel Hill, NC 27599-3175; email: [email protected]; K. S. Booth, Department ofComputer Science, University of British Columbia, Vancouver, British Columbia V6T 1Z4,
Canada; email: ksbooth@~cs.ubc.ca; C. Ware, Faculty of Computer Science, University of NewBrunswick, Fredericton, New Brunswick E3B 5A3, Canada; email: [email protected] to copy without fee all or part of this material is granted provided that the copies arenot made or distributed for direct commercial advantage, the ACM copyright, notice and the title
of the publication and its date appear, and notice is given that copying is by permission of theAssociation for Computing Machinery. To copy otherwise, or to republish, requires a fee and/orspecific permission.(C 1993 ACM 1046–8188/93/0700–0239 $01.50
ACM Transactions on Information Systems, Vol. 11, No. 3, July 1993. Pages 239-265

240 . Kevin W. Arthur et al.
1, INTRODUCTION
Recently, considerable interest has been shown in the area of virtual reality
(VR). The idea was first introduced by Sutherland [1968] when he developed
a research prototype of a head-mounted display. It was popularized almost
two decades later when off-the-shelf systems started to become practical for
virtual reality [Brooks, 1986; Fisher et al. 1986]. The underlying motivation
in virtual reality is to realistically present 3D virtual worlds to a user so that
he or she perceives and interacts with them naturally, thus borrowing from
built-in human abilities that evolved from our normal dealings with the 3D
world that surrounds us every day.
Current virtual worlds are still quite limited in terms of the realism they
achieve. This is due in part to the resolution limits of current head-mounted
displays and to certain temporal artifacts that seriously affect human percep-
tion. While much can be expected from future hardware advances, such
problems are not likely to disappear for some time, and hence there is a need
for careful study of these effects if task performance using current and
soon-to-be-available virtual worlds is going to be acceptable.
Almost all of the current VR research assumes the use of head-mounted
displays. But many of the benefits of virtual worlds can be achieved using
conventional display technologies if a few augmentations are made to hard-
ware and software [Deering 1992; Fisher 1982; McKenna 1992; Venolia and
Williams 1990]. A high-resolution workstation monitor supplemented with
hardware for stereoscopic viewing and a head-tracking device for adjust-
ing the perspective transformation to a user’s eye position can simulate
the appearance of stable 3D objects positioned behind or just in front of the
screen. This is not the full virtual world produced by a head-mounted display,
but it affords a number of practical advantages that make it an attractive
alternative to the immersion VR produced by a head-mounted display. We
have adopted the term “fish tank VR’ to describe such systems because the
experience is similar to looking at a fish tank inside which there is a virtual
world.
In the next two sections we define our terminology and describe some of the
advantages of fish tank VR. We then summarize important issues regarding
the effective use of this type of display technology and survey previous
related work. With this as background, three experiments are described in
the main body of the paper. The first two experiments measured the useful-
ness of fish tank VR for 3D tasks often performed on graphics workstations.
This was done using subjective user preference tests in the first experimentand objective task performance studies in the second experiment to com-
pare fish tank VR with a variety of other viewing conditions. The third
experiment assessed the effect of lag and frame rate on user performance for
fish tank VR.
In the first two experiments, fish tank VR was found to be of significant
value compared to standard display techniques, with head coupling being
more important than binocular vision. Both are superior to nonhead-coupled
monocular viewing. The third experiment showed that lag is more important
ACM TransactIons on Information Systems, Vol 11, No 3, July 1993

Fish Tank Virtual Worlds . 241
than frame rate in determining user performance and that frame rate itself is
probably not important except for the lag it produces; these results probably
apply to immersion VR as well. The paper concludes with a discussion of the
results and suggestions for future research.
2. VIRTUAL REALITY TERMINOLOGY
Many of the terms that are used in discussing virtual reality are overloaded.
This section provides a definition of the terms as they are used in this paper,
with appropriate references to the literature and to related terms.
Virtual reality is the presentation of a 3D scene of sufficient quality to
evoke a perceptual response similar to a real scene. The 3D scene is often
called a uirtual world, and the term “virtual reality” is commonly abbrevi-
ated “VR,” a practice we will adopt throughout this paper. The first use of the
term is usually credited to Ivan Sutherland.
The number of times per second that an image or scene is presented to the
eye(s) is the refresh rate of the display. High-speed repetition is required to
produce persistence of vision. The image may or may not change each time it
is presented. The frame rate or update rate is the number of times per second
that an image or scene is changed. Baecker [1979] emphasized the difference
between refresh rate and frame rate in his survey paper on dynamic raster
graphics. He observed that a double-buffered display need not have the same
refresh and frame rates and that refresh rates on the order of 60 frames per
second are needed to achieve persistence of vision whereas update rates of
only 10 frames per second are often adequate to provide the illusion of a
smoothly changing scene. One can expect similar rates to be acceptable for
VR systems, although the effects of rapid head movements and lag may call
for faster updates.
The delay between the time that new viewing parameters are determined
by a user’s movement and the time that the virtual world is seen to change in
response to the new viewing parameters is an instance of lag or latency. A
low frame rate implies a certain degree of lag, but a high frame rate alone is
no guarantee that lag is not present. There are many places within a VR
system where lag can occur. Only some of these are in the graphics pipeline.
Many others occur in the measuring or processing of the viewing parameters
prior to entering the graphics pipeline.
A monocular display presents an image or scene to only a single eye. A
binocular display presents a scene or image to both eyes. If the presentation
has different images for each eye, each appropriate for the position of the
respective eye, the display is stereoscopic, a term derived from the Greek
word for solid or three dimensional.
A head-mounted display presents images to one or both eyes through the
use of small displays located on or near the head with appropriate lenses so
that the images are seen as if viewing the world through glasses. A head-
coupled display is one in which the calculation of a viewing transformation,
usually including perspective, is based on the position of a user’s head. Othercommonly used terms for this type of display include head-tracked display,
used by Deering [1992] and others, and viewpoint-dependent imaging, used
ACM Transactions on Information Systems, Vol 11, No. 3. July 1993.

242 . Kevin W. Arthur et al
by Fisher [1982]. The head-coupling technique has been employed in various
guises since the early 1980s.
Head coupling assumes a fixed relationship between the position and
orientation of a user’s head and the position(s) and orientation(s) of the user’s
eye(s). A more accurate approach would involve tracking eye movements
because the perspective transformation for an eye is actually determined by
the position of the optical center of the eye, not just the position of the head.
The difference between the optical center of the eye and the center of rota-
tion of the eye makes this harder than head tracking unless a simplifying
assumption is made that the eyes are looking in the general direction of the
center of the screen (an assumption we make). Few practical systems track
eye movements, and only experimental systems track eye focus, which is
required for correct depth-of-field calculations.
Immersion VR uses a head-mounted display to totally surround the user in
a virtual world. When it works, it is a very effective technique. The term
presence is sometimes used for the effect created by immersion VR.
Fish tank VR is the use of a regular workstation display to provide a less
ambitious virtual world where the effect is limited to the volume of space
roughly equivalent to the inside of the display monitor. Fish tank VR is also
referred to by the names of the combination of techniques used to produce
it, head-coupled stereo display. Another term that is sometimes used is uir-
tual holog-raph ic display. Deering [ 1992] cites the earliest reference to a
holographic-like display as being the Krell teaching machine in the 1956 film
Forbidden Planet, where the character Morbius created a 3D “live” image of
his daughter in a volume display much like today’s holographic displays. An
even earlier example might be the fish tank virtual world that appeared in
the film The Wizard of Oz, in which the wicked witch spies on Dorothy and
her companions using a crystal ball 3D holographic display.
3. FACTORS AFFECTING PERFORMANCE IN FISH TANK VR
A monitor-based display cannot provide the immersion experience possible
with head-mounted displays. But head-mounted displays suffer from a num-
ber of difficulties that are not nearly as bothersome in a standard worksta-
tion display. Fortunately, immersion is not necessary for all applications.
Only a few applications, such as entertainment or building walk-through
systems, really need the full power of immersion VR [Brooks 1986]. There are
a number of good reasons to settle for something less.
Cost is one reason. Immersion VR is still quite expensive. Many current
systems use two high-performance workstations to compute images, one for
each eye [Blanchard et al. 1990; Shaw et al. 1992]. Cost will not always be a
problem, however. So this alone does not rule out immersion VR.
A more serious problem with immersion VR is the effect of separating a
user from the real world. This results in the loss of conventional interaction
devices such as the keyboard or mouse. More importantly, it provides the
sensation of being in only the computer-generated world, so a “handler” is
required to be present to guard against physical injury to an immersion VR
ACM TransactIons on Information Systems. Vol 11, No 3, July 1993
Fish Tank Virtual Worlds . 243
user. “See-through” head-mounted displays solve this problem to a degree,
but the illusion of immersion is then diminished. With fish tank VR, a user
sees both the virtual world within the display and the surrounding environ-
ment in which he or she is working. There is no need for a handler. Because
of the small amount of extra equipment required, a fish tank. VR workstation
can be part of the office, just as the conventional workstation is part of the
office.
Virtual reality may be the display technique of choice in the future, but
there are some technical problems that must be solved before that happens.
We discuss three types of factors that are of particular relevance to fish tank
VR: spatial display artifacts, temporal display artifacts, and the use of
auxiliary depth cues to enhance the sense of three-dimensionality in a virtual
world.
3.1 Spatial Display Artifacts
The resolution of the display is an important consideration. In immersion VR,
computer-generated images are viewed through wide-angle optics to provide
a wide field of view to the eyes. The small LCD screens that are typically used
in head-mounted displays suffer from low resolution that ia made worse by
the fact that the optical elements must stretch the image nonlinearly [Hew-
lett 1990; Robinett and Rolland 1992]. In typical head-mounted display
systems the resolution is such that a pixel will subtend approximately
12 minutes of arc. Viewing a high-resolution monitor with a 30 degree field
of view results in 2 minutes of arc per pixel, which is close to the resolu-
tion limits of the human eye. While head-mounted display technology can
be expected to improve in the coming years, it may be some time before
the angular resolution of immersion VR will match that of monitor-based
displays.
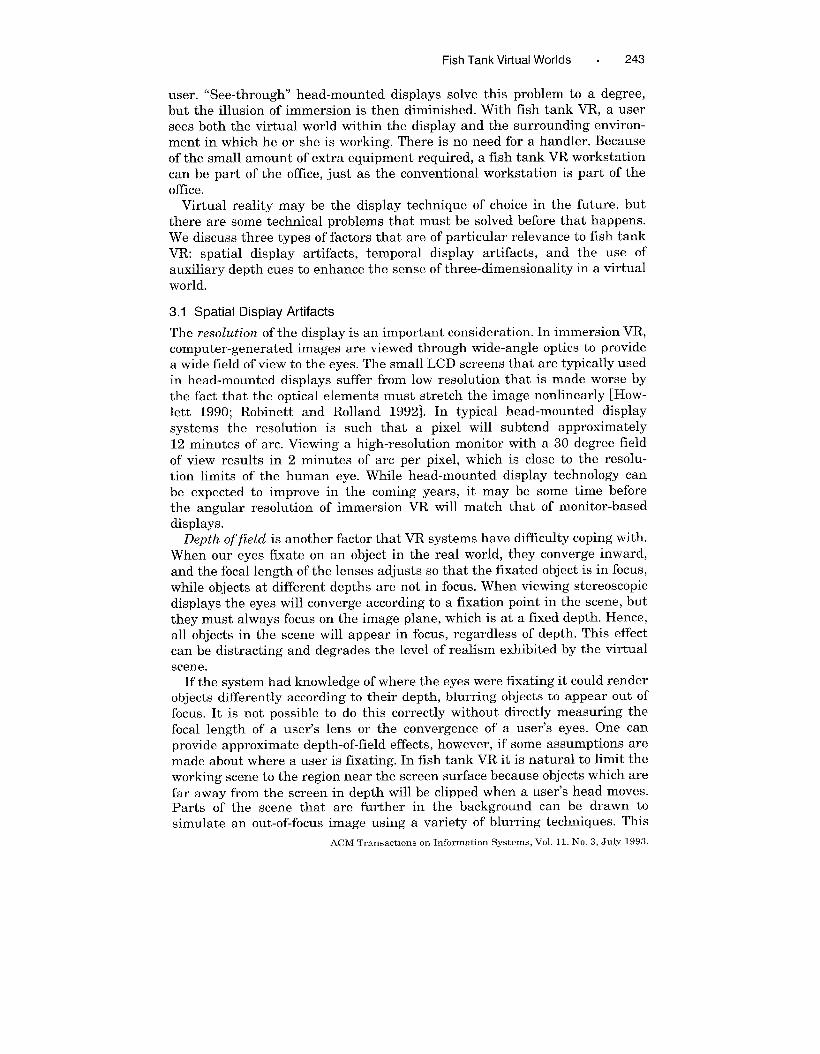
Depth of field is another factor that VR systems have difficulty coping with.
When our eyes fixate on an object in the real world, they converge inward,
and the focal length of the lenses adjusts so that the fixated object is in focus,
while objects at different depths are not in focus. When viewing stereoscopic
displays the eyes will converge according to a fixation point in the scene, but
they must always focus on the image plane, which is at a fixed depth. Hence,
all objects in the scene will appear in focus, regardless of depth. This effect
can be distracting and degrades the level of realism exhibited by the virtual
scene.
If the system had knowledge of where the eyes were fixating it could render
objects differently according to their depth, blurring objects to appear out of
focus. It is not possible to do this correctly without direct] y measuring the
focal length of a user’s lens or the convergence of a user’s eyes. One can
provide approximate depth-of-field effects, however, if some assumptions are
made about where a user is fixating. In fish tank VR it is natural to limit the
working scene to the region near the screen surface because objects which are
far away from the screen in depth will be clipped when a user’s head moves.Parts of the scene that are further in the background can be drawn to
simulate an out-of-focus image using a variety of blurring techniques. This
ACM TransactIons on Information Systems, Vol. 11. No. 3, JUIY 1993.

244 . Kevin W, Arthur et al
technique is less useful for immersion VR because it is harder to make such
an assumption about where a user is fixating.
3.2 Temporal Display Artifacts
Inaccuracies resulting from timing delays due to communication and process-
ing time either in the graphics pipeline or prior to that in the computation of
the viewing parameters for the virtual world must be dealt with in any VR
system. The two main problems are related to the overhead required to
change the image of the virtual world presented to a user.
Lag is inherent in all instances of human-machine interaction, including
virtual reality and telerobotics. In telerobotics systems, the human operator
is physically separated from the mechanical robot performing the task. Slow
transmission lines, low bandwidth, and slow mechanical linkages lead
to greater lag than is typical in VR. Lag in six-degree-o f- f~<eedom trackers
arises from delays in transmitting data records, hardware or software delays
while processing the data to perform smoothing or prediction, and additional
processing time spent in the main display loop prior to sending scene descrip-
tion data through the graphics pipeline.
Although lag is recognized as an important factor in all VR interfaces and
work has been done on techniques to compensate for it, there has been little
experimental study of the perceptual and performance effects of lag in
practical virtual world applications.
A low frame rate will not only contribute to lag, but if it is very low the
image distortions resulting from head movement will no longer be smooth,
and the scene will appear jittery. This is a standard problem in computer
graphics, usually caused by a scene complexity that exceeds the processing
capacity of the graphics pipeline. What is different in VR is that the changes
required in the image are a direct result of a user’s natural movements
while viewing, and these may make the user much more sensitive to jitter
than for a regular workstation.
3.3 Auxiliary 3D Cues
Also contributing to a convincing illusion of three-dimensionality in the
display is the use of traditional techniques from computer graphics for
providing depth cues. Particular techniques include shading, both Lambertian
and specular, and the use of shadows to suggest the shape and relative
positions of objects. The perspective projection alone provides depth informa-
tion as the extent of objects in the x and y directions is scaled with z (depth).
These and other well-known cues are described in most standard graphicstexts [Foley and van Dam 1982; Foley et al. 1992; Newman and Sproull 1972;
1979].
4. PREVIOUS WORK
This section surveys related research that is directly related to the work
reported here. A more general discussion of human factors issues for virtual
reality can be found in the survey article by Ellis [ 1991] and the collection of
papers by Ellis et al. [ 199 I].
ACM TransactIons on Information Systems, Vol 11, No 3, July 1993

Fish Tank Virtual Worlds . 245
4.1 Fish Tank Virtual Reality
Some of the first work on this type of display took place in the early 1980s.
Fisher [1982] used a fixed monitor with head tracking to provide different
views to the observer by way of precomputed images stored on a video
disc. Diamond et al. [1982] generated head-coupled perspective wire-frame
images with head positions obtained by using a video camera to track a light
bulb placed on a user’s head. Venolia and Williams [1990] describe a simi-
lar system using a Polhemus tracker and stereo shutter glasses to provide
stereoscopic images with head-coupled perspective. They propose a system
that uses precomputed perspective images and tracks only the horizon-
tal movements of a user to minimize the number of images which must be
computed.
Deering [1992] discussed the technical components required to create a
high-quality 3D display on a monitor using head-coupled perspective and
stereoscopic display. He provided a thorough discussion of the mathematics
required to derive the correct viewing transformations for each eye and the
need to have accurate estimates for each of the parameters that correlate
the centers of the eyes with head position and orientation as measured by
most head trackers. Deering takes into account a number of effects in his
derivation, including the distortions due to the curvature and thickness of
a display screen.
McKenna [1992] reported on experiments conducted with three types
of monocular displays, all employing head tracking. The first was a
stable high-resolution monitor with head-coupled perspective. The next was
the same monitor but with a tracker attached to it in addition to the head
tracker; the display changed accordingly as the monitor was tilted or swiveled
as well as when the user’s head moved. The third was a small hand-held LCD
screen that could be freely moved and rotated; again the display depended on
the screen position and the head position. McKenna reports on an experiment
to evaluate performance with the stationary head-coupled high-resolution
monitor system. Subjects were given a positioning task under three different
perspective viewing conditions which were a static view, a view that changes
with mouse position, and a head-coupled view. Subjects performed best
with the head-coupled perspective. The mouse-controlled condition generally
decreased performance.
A similar type of experimental study, this time using immersion VR,
was performed by Chung [1992]. Subjects performed a task under various
head-coupled and nonhead-coupled conditions using a 6D mouse, joystick,
Spaceball, or no device at all for interaction. The task was taken from an
application in radiation therapy treatment. The goal was to optimally posi-
tion and orient a beam in 3D so that it covered a tumor while avoiding the
surrounding healthy tissue. The subjective rankings obtained showed no
significant differences between the head-tracked and nonhead-tracked modes,
although there were differences within these two groups. The best overall
rating was for a constrained head-tracked viewing mode with no additional
input device, referred to as “orbital” mode.
ACM Transactions on Information Systems, Vol. 11, No. 3, July 1993.

246 . Kevin W. Arthur et al,
Ware and Osborne [1990] reported on the experimental study of different
metaphors for navigation through virtual worlds. Their experimental system
used a fixed nonhead-coupled monitor display and a six-degree-of-freedom
hand-held tracker. Although the results showed no clear winner, they sug-
gested which metaphors may be better for different navigation tasks.
4.2 Spatial and Temporal Accuracy
There are two methods for assessing spatial and temporal inaccuracies in VR
systems. One is by making physical measurements on the devices that are
being used and thereby obtaining calibration data that can be incorporated
into the VR system. The other is to measure the effect that these inaccuracies
have on the performance of VR users. Both are important.
Liang et al. [ 1991] measured the lag inherent in the hardware processing
performed by the Polhemus IsoTrak device and found a delay of approxi-
mately 110 msec (newer trackers from Polhemus have improved lag, report-
edly less than 20 msec). They suggest the use of a predictive Kalman filter to
compensate for lag, as do Friedmann et al. [1992]. One must be careful,
however, that the prediction method does not introduce undesirable artifacts
into the data. In particular, overshoot or amplification of the sensor noise can
occur. These artifacts become apparent when the prediction interval is chosen
to be too large. Based on their experience with Kalman filtering, Liang et al.
recommended that prediction not be performed using an interval more than
three times the sampling interval of the device. For example, with a sampling
rate of 20 Hz, a prediction interval of no more than 150 msec would be
tolerable.
MacKenzie and Ware [ 1993] have studied the effect of lag on a 2D Fitts’s
Law target selection task. Analysis of response times and error rates showed
that a model in which lag has a multiplicative effect on Fitts’s index of
difficulty accounts for 95% of the variance in the data. This is better than
alternative models which propose only an additive effect for lag.
4.3 Auxiliary 3D Cues
Atherton and Caporael [ 1985] assessed the quality of 3D images by subjective
rankings to determine the degree of polygonalization required to adequately
approximate a sphere and the relative effectiveness of three commonly used
shading models. Meyer et al. [ 1986] used subjective pairwise comparisons
to assess the quality of radiosity-based global-illumination models for render-
ing 3D scenes. Further work at Cornell has examined the use of shadows to
provide depth cues for interactive 3D tasks [Wanger 1992; Wanger et al.
1992].
5. A TESTBED FOR STUDYING FISH TANK VR
Hardware and software for testing fish tank VR in a realistic setting must
have a number of properties that follow from a consideration of the factors
that affect VR performance. This section discusses these requirements and
describes a hardware and software testbed that has been implemented for
ACM TransactIons on Information Systems, Vol 11, No 3, July 1993.

Fish Tank Virtual Worlds . 247
fish tank VR studies. The testbed was used to conduct all of the experiments
described in this paper.
5.1 Stereo Display
We use the StereoGraphics Crystal Eyes stereo system connected to a Silicon
Graphics IRIS workstation with the ability to display 120 frames per second.
The shutter glasses are synchronized to the monitor refresh and provide an
effective 60 Hz frame rate to each eye. The monitor we were using, like most
color workstation monitors, suffers from a longer-than-ideal phosphor decay
time. This results in faint ghosting of the left-eye image to the right eye and
vice versa. We minimized this effect by choosing colors with only a small
green component because the green phosphor has the longest decay time on
this type of monitor.
For our experiments, we used a 4D/240VGX workstation. our tests with a
Crimson/VGX and an Indigo Elan also gave adequate frame rates, but less
powerful versions of the IRIS did not prove very satisfactory. The software
also runs on various IBM RS\6000 workstations; none of the ones we use has
a monitor capable of 60 Hz stereo, but this is apparently possible given an
appropriate monitor and synchronization hardware [Codella et al. 1992].
5.2 Head-Coupled Perspective
A necessary component for rendering a 2D image of a 3D scene is the
determination of the correct projection to use for transforming points and
geometric primitives in 3-space into points in 2-space. Most commonly,
orthographic or perspective projections are employed. Perspective projection
scales the horizontal and vertical coordinates inversely with depth, and hence
provides depth cueing. Conventional computer graphics display applications,
in the absence of head-tracking capability, employ a perspective projection
according to a single viewpoint, usually translated from the center of the
screen perpendicular to its surface. Nonperpendicular viewing projections
have been discussed in the literature [Carlbom and Paciorek 1978], but are
seldom used except in flight simulators where one or more of the display
surfaces are mounted at an angle to the principal direction of view [ Schacter
1983].
In fish tank VR systems, a user’s head is tracked so that by moving his or
her head, a user can view the scene from different angles. This requires
computing the correct off-axis perspective projection to accommodate the
corresponding eye positions. The effect of head-coupled perspective is illus-
trated by the four screen photographs in Figure 1. In all cases the program is
displaying the same 3D model of an automobile positioned at the center of the
screen, level with respect to the monitor. Two different perspective projec-
tions and two corresponding camera angles are employed (resulting in four
photographs). Only in the two photographs where the camera position matchesthe perspective projection does the object appear three dimensional and
undistorted. In the other two photographs, where the camera position does
not match the perspective projection, the object appears distorted.
ACM Transactions on Information Systems, Vol. 11, No 3, July 1993

248 . Kevin W, Arthur et al.
Fig, 1. An illustration of the effects of head-coupled perspective. The program 1s displaying
images of a car positioned in 3-space at the center of the screen In the top row the image is
computed with an on-axis perspective projection and in the bottom row with an off-axisprojection The left column shows the screen when viewed from a position on axis, and the right
column shows the screen when viewed from a position off axis. Only m the top-left
and bottom-right photographs does the perspective projection match the viewing position,resulting in a realistic image which does not appear distorted.
5.3 Spatial and Temporal Accuracy in Head Tracking
Inaccuracies in the measurement and processing of head-tracking data can
result in delays or noise which in turn effect the calculation of the off-axis
perspective transformation. Accuracy is especially important in conjunction
with stereo. If the artifacts are serious enough, head coupling will not be
effective, and stereo-induced motion may occur. The scene may appear to
deform and twist as the viewer moves.
We use a Shooting Star Technology ADL-1 tracker to provide head position
and orientation records. No smoothing or prediction techniques are applied in
hardware or in software. The ADL-1 uses mechanical linkages with poten-
tiometers at the joints to provide fast readings. This device has a lag of less
than 3 msec, which is shorter than the lag induced by other factors such as
the time taken to read the tracker input buffer and to update the image. The
ACM TransactIons on Information Systems, Vol 11, No 3. July 1993

Fish Tank Virtual Wc)rlds . 249
rated absolute positional accuracy of the ADL- 1 is 0.51 cm, and its rated
repeatability is better than 0.25 cm. Our head-coupled perspective software
was calibrated once for all users, and hence some residual inaccuracies in
the display due to variation in eye position relative to head position will be
present.
The rate of screen updates is inversely related to the complexity of the 3D
scene being displayed. The maximum rate attainable when using alternate-eye
stereo shutter glasses is 60 Hz. A scene of moderate complexity will easily
reduce this to around 10 Hz. For our experiments comparing head cou-
pling and stereo, we desired as high a frame rate as possible. With careful
adjustment of scene complexity, we were able to achieve the 60 Hz update
rate with our test scenes on a Silicon Graphics 4D\240VGX.
In one experiment, frame rate was a manipulated condition. The testbed
includes a provision for this. The program’s main display loop can be main-
tained at a frame rate of 30 frames per second by synchronizing to the
monitor’s refresh rate. Synchronization accuracy was verified with tim-
ing calls to the system both during calibration tests and during the actual
experiments.
When frame rate was a manipulated condition in an experiment, frame
rates of 15 Hz and 10 Hz were generated by repeating the display loop within
the program two or three times, respectively. Thus to produce an effective 15
frames per second using the double-buffered display system, each frame
would be refreshed twice before swapping frame buffers to update the image.
Frame rate of 30, 15, and 10 Hz generate frame interval times of 33.3 msec,
66.7 msec, and 100 msec, respectively.
When tracker lag was a manipulated condition in an experiment, it was
simulated by buffering the in-coming tracker records for a number of frame
intervals. The tracker data is always requested by the program just after a
new frame interval begins, and the device responds within less than a frame
time. Thus the data does not affect the current frame, but does affect the next
frame. We treated the time half-way into the frame interval as the time at
which a user perceives the new frame. The user does not effectively see the
tracker update until approximately 1.5 frame intervals after the tracker
record is requested. Hence, a frame rate of 30 Hz produces a frame interval of
33.3 msec and an inherent lag of 1.5 x 33.3 msec = 50 msec. Buffering the
tracker data by one extra frame time will produce a total lag of 83.3 msec.
Similarly, a frame rate of 15 Hz introduces an inherent lag of 100 msec and a
lag of 166.6 msec when tracker data is buffered for one frame time. During
the experiments, the actual average frame times and total lags were mea-
sured. During none of the trials were the measurements found to be more
than 3 msec away from their intended values.
5.4 Auxiliary 3D Cues
Because stereo and head coupling are by no means the only factors affecting
3D fidelity, we endeavored to provide as many additional depth cues as
possible within the design constraints. The following is a discussion of the
qualities that were used in our experimental testbed.
ACM TransactIons on Infm-matlon Systems, Vol 11, No. 3, July 1993.

250 . Kewn W Arthur et al.
The term “vection” is usually used to refer to the feeling of self-movement
when a large field display is moved with respect to an observer. Recent
evidence indicates that the effect can be achieved with even. a small field
of view [Howard and Heckman 1989]. Howard and Heckman suggest that
one of the important factors in eliciting vection is the perceived distance of a
moving visual image, with images that are perceived as furthest away
contributing the most. In our experiments, we desire the observer to perceive
the monitor as a window into an extensive space. We created a background
consisting of a random field of objects computed as though they were an
infinite distance from the observer. To give the illusion of depth of field we
chose discs with blurred edges as our background objects. These discs are not
intended to be focused on; they are intended to give a feeling of spaciousness
when objects in the foreground are fixated. We call this a vection background.
Shading from one or more light sources is an important depth cue in 3D
scenes. This was used in the first experiment where we constructed two
3D scenes to investigate subjective evaluation of viewing conditions (see
Figure 3). The first scene consisted of a pink sphere with smooth shading and
specular highlights, positioned above a striped ground plane. Smooth shad-
ows were computed and displayed on the ground plane. The second scene
consisted of a bent-tube object, again with smooth shading and specular
highlights. Both scenes were lit by a directional light source and an ambient
source.
5.5 Physical Configuration and General Experimental Procedure
The experiments were conducted using the workstation and testbed software
described earlier. The physical configuration of the equipment consisted of
the monitor mounted so that the screen center was level with the subject’s
eyes. The mouse and its pad were positioned comfortably for the subject, and
the ADL-1 head tracker was mounted above the monitor by a wooden frame
strapped to the sides of the monitor (see Figure 4). Throughout the experi-
ments the subjects always wore the stereo glasses and the head-tracking
equipment. This was to avoid effects related solely to the physical factors ofwearing the equipment.
Five viewing conditions were used in the experiments. These are shown
schematically by the diagrams in Figure 2. In the nonstereo conditions the
same image was presented to both eyes. In the binocular nonstereo condition
the perspective was computed for a viewpoint midway between the two eyes.
In the monocular-viewing condition the right eye position was used, and the
subject was asked to close or cover the left eye. In the fixed-viewpoint
condition the perspective was established as in the head-coupled binocular
nonstereo condition, according to the head position at the start of the trial.
Subjects were asked to move their heads around for all conditions in order to
assess the value of head coupling.
6. EXPERIMENT 1: SUBJECTIVE IMPRESSION OF 3D
To allow subjects to subjectively compare the relative effectiveness of head
coupling and stereopsis, we implemented an experimental protocol which
ACM TransactIons on Information Systems, Vol 11, No 3, July 1993

Fish Tank Virtual Worlds . 251
Non-Head-CoupIcd
Non-Stereo
1.,, •1
-
‘, ~ ,:
0 ‘, ..’
B ‘,,’
3., n
Stereo
2.. , ❑ ,.,
‘\ -:,.,.,,, ~(
.... ,,.,... .,
e‘,,’.‘,,. .,
B . .’- :.. .
,.. 5. ~n . .
Head-Coupled
4.‘u ,.. ,
0
Fig, 2, The five viewing conditions used in Experiments 1 and 2. In each of the diagrams theimage plane is represented by the bold horizontal line, and virtual objects are shown in front of
and behind the screen. The dotted lines indicate the perspective projections employed, eachdefined by an eyepoint and the corners of the screen.
involves comparison of randomly selected pairs of conditions. The first experi-
ment used this protocol to obtain subjective rankings for the five viewing
conditions when looking at a stationary 3D scene.
6.1 Procedure
Subjects were presented with one of the two scenes described earlier (the
sphere or the tube). For each trial, two of the five viewing conditions were
selected, and subjects were asked to compare the two and decide which type
of viewing gave them a better perception of 3D space. The subjects were told
to alternate between the two conditions by pressing the space bar, until they
decided which condition they preferred, and then to click on a mouse but-
ton corresponding to one of the two conditions. After the experiment we
questioned subjects on their opinions regarding the quality of the different
viewing conditions.
6.2 Design
There were 10 pairwise comparisons of the 5 viewing conditions. These 10
comparisons were performed twice each, once for the sphere scene and once
for the bent-tube scene. A trial block consisted of these 20 trials in random
ACM Transactions on Information Systems, Vol. 11, No. 3, July 1993

252 . Kevin W. Arthur et al
Fig, 3.
‘,’:’,::’:’:’:,’
sphere and bent-tube displays used in Experiment 1. Hardware hghting was used to
achieve the specular reflection The blurry cast shadow was precomputed ‘and subsequently
texture-mapped onto the floor. The colors and background have been modu’ied for black and
white reproduction,
ACM TransactIons on Information Systems, Vol 11, No. 3, July 1993

Fish Tank Virtual Worlds . 253
Fig. 4. The fish tank VR system. The subject’s head position is measured by the ADL-1mechanical tracker. StereoGraphics glasses are worn to provide different images to the left and
right eyes, and the display monitor is synchronized with the glasses to provide an effective 60 Hzto each eye.
order. Each subject was presented with two blocks (a different ordering was
used for each block).
Following the comparison trials, subjects were asked for their comments
in an effort to gain further insight into the results. The following set of
questions was presented.
All of the following questions relate to the quality of the 3D spatial
impression:
—Is head coupling as important, more important, or less important than
stereo?
—Is the combination of head coupling and stereo better than either alone?
—Is head coupling alone worthwhile? (If you had the option would yolL use
it?)
—Is stereo alone worthwhile? (If you had the option would you use it?)
—Is head coupling with stereo worthwhile? (If you had the option would you
use it?)
—Do you have any other comments on these methods of displaying 3D data?
ACM TransactIons on Information Systems, Vol. I. 1, No. 3, July 1993.

254 . Kevin W, Arthur et al.
Seven subjects were used in this experiment, four of whom were familiar
with high-performance graphics systems.
6.3 Results
The data resulting from comparisons with the sphere scene showed no
systematic differences from the data resulting from the bent-tube scene, and
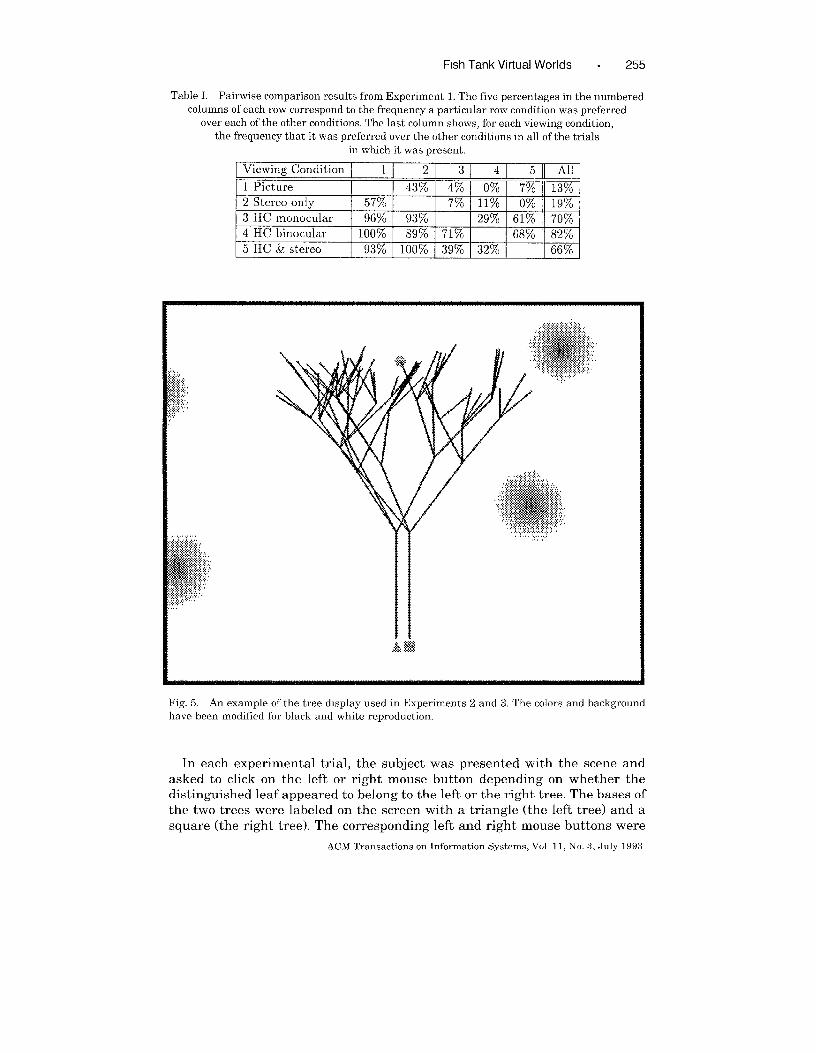
so these data were merged. Table I summarizes the combined results from all
subjects. Each entry in the numbered columns corresponds to a pair of
viewing conditions, and the values are the percentages of trials in which the
row condition was preferred over the column condition. Hence, corresponding
percentages across the diagonal sum to 100%. For example, the value 8970 in
row 4, column 2 means that condition 4 was preferred over condition 2 in 25
out of 28 possible responses (4 responses from each of 7 subjects), and the
value of 11% in row 2, column 4 accounts for the other 3 responses in which
condition 2 was preferred over condition 4. The most significant result
apparent from the data is that head coupling without stereo was preferred
over stereo alone by a wide margin of 91% to 99ZC(averaging the monocular
and binocular results).
The last column in Table I shows for each viewing condition the percentage
of times it was preferred overall in the trials in which that condition was
present. The values in the column sum to n/2 X 100% = 25070, where the
number of viewing conditions is n = 5 in our experiment. Head-coupled
display without stereo (both monocular and binocular) was preferred some-
what more often than head-coupled display with stereo.
The responses to the questions also showed strong preference for head
coupling. All users said that they would use it for object visualization if it
were available. When asked to compare the importance of head coupling with
stereo, two of the seven subjects stated that they thought stereo was more
important than head coupling. However, these same subjects preferred head
coupling in the direct-comparison task. One subject complained about the
awkwardness of the apparatus and pointed out that this would be a factor inhow often it would be used.
7. EXPERIMENT 2: A GRAPH-TRACING TASK
In the second experiment, we took a more rigorous approach and measured
subjects’ performance on a 3D tree-tracing task. Subjects were given a taskvery similar to one designed by Sollenberger and Milgram [ 1991] who tested
the ability of observers to perceive arterial branching in brain scan data
under different viewing conditions.
Two trees consisting of straight line segments were constructed in 3-space
and placed side by side so that a large number of the branches overlapped
(see Figure 5). One leaf of one of the trees was distinguished, and the subjectwas asked to respond as to whether the leaf was part of the left tree or part of
the right tree. In each case, the leaf chosen was the one whose x coordinate
was nearest the center of the screen.
ACM Transactions on Information Systems, Vol 11, No 3, July 1993
Fish Tank Virtual Worlds . 255
Table 1, Pairwise comparison results from Experiment 1. The five percentages in the numbered
columns of each row correspond to the frequency a particular row condition was preferred
over each of the other conditions. The last column shows, for each viewing condition,
the frequency that it was preferred over the other conditions in all of the trials
in which it was present.
Fig. 5. An example of the tree dmplay used in Experiments 2 and 3. The colors and backgroundhave been modified for black and white reproduction.
In each experimental trial, the subject was presented with the scene and
asked to click on the left or right mouse button depending on whether thedistinguished leaf appeared to belong to the left or the right tree. The bases of
the two trees were labeled on the screen with a triangle (the left tree) and a
square (the right tree). The corresponding left and right mouse buttons were
ACM Transactions on Information Systems, Vol 11, No. 3, July 1993

256 . Kevin W, Arthur et al,
similarly labeled with a triangle and a square as an additional aid to help
subjects remember the labeling.
The trees were recursively defined ternary trees. A trunk of 8.0 cm was
drawn at the base of the tree, connected to the root node. Nodes above the
root were defined recursively, with the horizontal and vertical positions of
the children placed randomly, relative to the parent. There were three levels
of branches above the root, resulting in 27 leaves for each tree. The following
recurrence relation gives a precise specification for one tree. This assumes a
right-handed coordinate system with y pointing upward and z out.
x bus, = Ybabe = Zba,,e = 0.0
VerticalSpacing, OOf = 8.0 cm
HorizontalSpaci ng,OOt = 8.0 cm
x root = Xba,,c
Yroot = Yba,, + VerticalSpacingr OOl
z rout = Zbase
VerticalSpacing<k, ~~ = 0.7 X VerticalSpacingP~ ,Cn t
Horizon talSpacmgcf, tld = 0.7 x HorizontalSpacingP~,,,,t
x rhlld = Xparent + HorizontalSpacingCJZ ,~d X Rand( )
‘child = ‘parent+ VerticalSpacingvh,lCI x (1.0 + 0.25 x Rand( ))
z Llllld = Zpa,ent + Horizon talSpacingChll~ x Rand( )
The function Rand( ) returns a uniform random number in the range
[ – 1, + 1]. The two trees constructed for each trial were displayed side by side
separated by a distance of 1.0 cm.
The visual complexity of the trees was tested beforehand, with the goal of
making the task difficult enough that depth perception was a factor, but not
so difficult that a significant number of errors would be made by a typical
subject. This resulted in the specific parameters that were selected.
The experiment employed the same five viewing conditions as in Experi-
ment 1, and subjects wore the stereo glasses and head-tracking equipment
throughout the experiment. Ten undergraduate and graduate students, most
of whom had experience with computer graphics workstations, served as
subjects for the experiment. They were instructed that their error rates andresponse times were being recorded and that they should be mostly concerned
with making as few errors as possible.
7.1 Design
A new pair of random trees was generated for each trial. Trials were given in
groups of 22 with the viewing condition being constant within the group. The
first two trials of each group were designated as additional practice trials
to familiarize the subject with the condition. A trial block consisted of all 5
ACM TransactIons on Informatmn Systems, Vol 11, No 3, July 1993

Fish Tank Virtual Worlds . 257
groups given in a random order, and the entire experiment consisted of 3
such blocks, resulting in a total of 60 trials in each of the 5 experimental
conditions. A practice group of 10 trials (two in each condition) was given at
the start of the experiment. A stereo test scene was presented to each subject
prior to the experiment to verify the subject’s ability to use stereopsis to
perceive depth.
7.2 Results
The results from Experiment 2 are summarized in Table II. The timing
data shows that the head-coupled stereo condition was the fastest, but that
head coupling alone was slow. There are significant differences at the
0.05 level between conditions 3 and 5 and between conditions 4 and 5, by
the Wilcoxon Matched Pairs Signed Ranks Test. The only other difference
that is significant is between conditions 4 and 1.
The error data in Table II provide more interesting results, with errors
ranging from 21.8?% in the static nonstereo condition without head coupling
to 1.3% for the head-coupled stereo condition. All of the differences
are significant in pairwise comparisons except for the difference between
conditions 3 and 4, the two head-coupled conditions without stereo.
8. EXPERIMENT 3: EFFECTS OF LAG AND FRAME RATE
In a head-coupled display system the lag in the display update arises from
two primary sources. The first is the delay in receiving and processing
physical measurements from the tracker. The second lag comes from the
delay between receiving the tracker values and updating the display. That
is, the time required to compute and render the scene using a perspective
projection that takes into account the latest tracker measurements. This
second lag is a function of frame rate. There is usually a third component
which is also present due to variations in system load. In our experiment, we
eliminated this as a factor by restricting network access to the workstation
during the experiment.
8.1 Procedure
The Sollenberger-Milgram tree-tracing task was used again for this experi-
ment. All of the experimental trials employed head coupling and stereo
viewing (condition 5). Subjects were informed that the accuracy of their
responses and their response times would be recorded. They were instructed
to perform the task as quickly as they could without seriously sacrificing the
accuracy of their responses. Note that this is different from the instructions
given to subjects in Experiment 2, where error rate was considered most
important. The reason for this change of focus is due primarily to the low
level of difficulty of our task and the fact that the trials were always
performed under head-coupled stereo viewing. We reasoned that measuringresponse times would be most relevant when dealing with the addition of
temporal artifacts and that error rates would not vary significantly, as
presumably a large degree of depth perception can still be obtained through
ACM Transactions on Information Systems, Vol. 11, No. 3, July 1993.

258 . Kevin W. Arthur et al.
Table II Experiment 2 Timing and Error Results
I Viewing Condition I Time (see) II % Errors )
\ 1 Picture 7.50 II 21.s I,, u2 Stereo only 8.09 l/ 14.73 HC monocular 8.66 II 3.7!1 11
4 HC binocular 9.12 II 2.7
5 HC & stereo 6.83 II 1.3
stereopsis and motion (even in high-lag conditions where the motion is not
coupled accurately with head movements). The subjects were 10 graduate
students, all of whom had some prior experience using graphics workstations.
8.2 Design
Frame rates of 30 Hz, 15 Hz, and 10 Hz and lags of O, 1, 2, 3, and 4 frame
intervals were used, making 15 conditions in total. Table III shows the total
lag times resulting from these values.
Subjects were presented with 15 blocks of 22 trials, with lag and frame rate
kept constant within blocks. The first two trials in each block were desig-
nated as practice trials to enable a subject to become familiar with the block’s
lag and frame rate. A block of 22 practice trials with moderate lag and frame
rate (15 frames per second and 233.3 msec lag) was given at the start of
the experiment. A stereo test scene was presented to each subject prior to the
experiment to verify the subject’s ability to use stereopsis to perceive depth.
8,3 Results
Figure 6 shows a plot of average response times for each of the 15 experiment
conditions. The horizontal axis measures the total lag time, and the points
are marked according to the different frame rates. Response time was found
to be exponential with respect to total lag, and ranged from 3.14 to 4.16
seconds. On average, subjects responded incorrectly in 3.4% of the trials. The
distribution of errors across conditions showed no distinguishable pattern.
An analysis was performed to compare the effect of lag over frame rate.
Three models were tested using linear regression on the 15 averaged points.
Model 1: log time = Cl + C2 x Lag
Model 2: log time = Cl + C2 x FrameInterval
Model 3: log time = (21 + C2 X Lag + C3 X FrameInterual
The effectiveness of the regression fit to the data can be measured from the
coefficient of determination r z, which measures the fraction of the variance
which is accounted for by the regression model. The r 2 values for the three
models are as follows.
Model 1: rz = 0.50
Mode12: r2 = 0.45
Mode13: rz = 0.57
The best-fit regression line for Model 1 is plotted in Figure 6.
ACM Transactions on Information Systems, Vol. 11, No 3, July 1993

Fish Tank Virtual Worlds . 259
Table 111, Experiment 3 Conditions (all times in msec)
Frame Rate Tracker Lag
FR (Hz) Frame time Base Lag # frames Lag Total Lag
30 33.3 50.0 0 0.0 50.0
30 33.3 50.0 1 33.3 83.3
30 33.3 50.0 2 66.6 116.6
30 33.3 50.0 3 100.0 150.0
30 33.3 50.0 4 133.3 183.3
15 66.6 100.0 0 0.0 100.0
15 66.6 100.0 1 66.6 166.6
15 66.6 100.0 2 133.3 233.3
15 66.6 100.0 3 200.0 300.0
15 66.6 100.0 4 233.3 333,3
10 100.0 150.0 0 0.0 150.0
10 100.0 150.0 1 100.0 250.0
10 100.0 150.0 2 200.0 350.0
10 100.0 150.0 3 300.0 450.0
10 100.0 150.0 4 400.0 550.0
Results from Experiment 3
5
48 -30 fps ~lsfps +
46 lofps n
Lag model – --
44
g 42❑ .-u -
. .~ .-
;4
+. . -
u 3.8g
-.~ ‘“o
❑
a..---”
360 ---
2-0,
34 +e e
+32
0
30 100 200 300 400 500 600
Total Lag (msec)
Fig. 6. Plot of response time versus total lag for Experiment 3. Each point corresponds to anexperimental condition with a particular lag and frame rate (see Table III). The line is the bestfit to the linear regression model involving total lag only.
9. DISCUSSION
The results of the experiment suggest a number of conclusions including
evidence of subjective user preference, differences in objective task perfor-
mance, and definite effects due to spatial and temporal artifacts.
ACM Transactions on Information Systems, Vol. 11, No. 3, July 1993

260 . Kevin W. Arthur et al,
9.1 User Preference
The strong preferences expressed in Experiment 1 by most subjects for
head-coupled viewing over stereo viewing and the enthusiastic response of
viewers to the concept of head-coupled display suggest that applications
which involve viewing 3D scenes on graphics workstations may benefit
significantly from the addition of head-tracking hardware and software. The
apparent inconsistency of subjects preferring head-coupled nonstereo over
head-coupled stereo is probably due to the slight ghosting which was visible
in the stereo display because of slow phosphor decay.
9.2 3D Task Performance
Experiment 2 provides objective evidence that head-coupled stereo can aid
users in the perception of a complex 3D object. Here the evidence shows that
both head coupling and stereo contribute to performance, although head
coupling helps to a much larger extent.
Given that our error rates for head coupling were near zero it is difficult to
tell the extent of the performance increase with head coupling and stereo
combined, because the error rate cannot fall much further. To obtain a better
measure of the value of head-coupled stereo over head coupling alone would
require making the task more difficult, or taking a different measure of
performance which is not bounded as error rate was for our task.
Overall, the error rates obtained are lower than those obtained by
Sollenberger and Milgram [ 1991], but the pattern is strikingly similar despite
the differences in the stimulus trees, the viewing conditions, and the
experimental protocols. Both our study and the study of Sollenberger and
Milgram found motion to be more important than stereo, even though their
motion was simple rotation of the object whereas ours resulted from head
coupling. Both studies found combined motion and stereo to be more effective
than either in isolation.
It can be argued that the improvements seen with head coupling in the
tree-tracing task are not due to head coupling as such, but rather to
the motion-induced depth [Wallach and O’Connell 1953]. Our current evi-
dence does not counter this objection. However, it is likely that the image
motion produced by dynamic head-coupled perspective is less distracting than
techniques such as rocking the scene back and forth about a vertical axis,
which is commonly done in commercial molecular-modeling and volume
visualization packages.
In the results from Experiment 3, the best response times are approxi-
mately half of the best response times for Experiment 2. This discrepancy is
likely due to two factors. The subjects were given slightly different instruc-
tions for Experiment 3 because response time was more important than error
rate. In Experiment 2, subjects may have been more careful to mini-
mize errors at the expense of response time. This is supported by the fact
that in Experiment 2 with head-coupled stereo the average error rate was
1.3%; in Experiment 3 this grew to 3.47. on average, with no distinguishable
pattern between the low- and high-lag conditions.
ACM TransactIons on Infm-mat,on Systems, Vol 11, No 3, July 1993

Fish Tank Virtual Worlds . 261
9.3 Spatial and Temporal Accuracy
The results from Experiment 3 suggest some interesting conclusions regard-
ing the effects of lag and frame rate on the performance of 3D tasks.
The three regression models provide an indication of the relative effects of
lag and frame rate, The third regression model which incorporates both lag
and frame rate accounts for a large portion of the variance ( r 2 = 0.57), as
expected. The fact that the model only accounts for 57’% of the variance is
likely due to the random nature of the selection of trees, resulting in a wide
range of difficulty among trials.
Model 1, which involves lag only, accounts for more of the variance than
does Model 2, which involves frame rate only (for Model 1, r2 = 0.50, and for
Model 2, r 2 = 0.45). The values suggest that a large part of the variance is
attributable to lag alone and that lag is likely a more important factor than
frame rate.
Given the data describing performance fall-off as lag increases, it is useful
to obtain some measure of what level of lag becomes prohibitive (for simpli-
city we will consider only lag here and not frame rate). Specifically we would
like to know the lag value which makes performance under head coupling
worse than the performance would be without head coupling at all. We can
compare the results from Experiments 2 and 3 to obtain an approximate lag
cut-off value, by finding a point on the regression line in Figure 6 where
response time is the same as for the static-viewing condition.
The analysis becomes more complicated because our range of response
times for Experiment 3 was lower than that for Experiment 2 due to the
differing instructions given to subjects, as was discussed earlier. In Experi-
ment 2 we found a best-case response time of 6.83 seconds, whereas in
Experiment 3 under the same conditions the response time was 3.25 seconds,
which is a factor of 2.10 less. The Experiment 2 average response time for
static viewing was 7.50 sec. If we scale this by the same factor of 2.10, we find
that it corresponds to a response time of 3.58 seconds under the conditions of
Experiment 3. From the plot of the first regression model (Figure 6), this
corresponds to a total lag of210 msec. This suggests that for tasks similar to
the tree-tracing task, lag above 210 msec will result in worse performance, in
terms of response time, than static viewing.
The error rates for Experiment 3 remained low over all conditions, averag-
ing to 3.470, in contrast to Experiment 2 where the number of errors rose
significantly in the nonhead-coupled conditions. This suggests that even in
the presence of large lags and low frame rates, head coupling provides someperformance improvement. This is not surprising, however, because the
effects are likely due to depth from motion; while we do not have the data to
verify this, it is likely that the performance is similar to what it would be if
the scene were moving independent of the user, even without head-coupled
viewing.
Systems that use predictive methods such as Kalman filtering must make
a compromise between the size of the prediction interval and noise artifacts
that become worse as this interval increases. Introducing prediction into a
ACM TransactIons on Information Systems, Vol 11, No 3. July 1993.

262 . Kevin W, Arthur et al.
system will effectively flatten out the low-lag portion of the curve in Figure 6,
and hence there will be a cut-off point beyond which the lag becomes
unacceptable because of the filtering artifacts.
9.4 Applications
Our results regarding the tree-tracing task should be applicable to other
tasks that require tracing of lines in 3-space. Sollenberger and Milgram
[1991] used this task to investigate how doctors looking at 3D brain scan
images could trace the paths of blood vessels. Similar tasks arise in molecular
modeling and in the domain of software engineering where vve may wish to
trace object dependencies between software modules represented as networks
in 3D space [Fairchild et al. 1988; Robertson et al. 1991].
10. FUTURE WORK
The studies reported in this paper are part of an on-going investigation of
factors affecting human performance on 3D graphics workstations. A number
of interesting questions remain.
10.1 Combining Head Coupling with Motion Control
In our evaluation of the effectiveness of head-coupled stereo displays we have
used scenes that are stable in space. In the past, applications have used
yoked or automatic rotation of the scene to provide depth cues. Head-coupled
perspective provides a related effect which is arguably more natural because
we are accustomed to moving our head to obtain better views of scenes.
However, it is not clear whether this argument applies to all scenes. In
particular, when looking at a small object we are more likely to rotate the
object that move our head about the object if we want to see the object’s sides.
One interesting possibility is to combine the techniques of motion with
head-coupled perspective. One could have the scene rotate about its center,
with the axis and direction of rotation defined in a counteractive way by the
observer’s head motion, and so obtain a more complete view of the object than
possible with head-coupled perspective alone. We have implemented this
technique, but have not conducted any formal studies of its effectiveness.
10.2 Spatial and Temporal Accuracy
Another area requiring further study from a human factors standpoint is to
determine what level of spatial registration is sufficient for effective perform-
ance and how registration errors affect the accuracy of depth judgments.
Our study of the effects of lag and frame rates provides useful guidelines
for employing fish tank VR in applications. The effects of temporal artifacts
in immersion displays likely have similar characteristics, but one would
expect the effects to be more extreme due to the wide field of view provided to
the eyes.
We have dealt only with the artifacts present when tracking head position
and orientation. Presumably, inaccuracies in tracking hand position will also
degrade performance, but it is difficult to predict what the effect of two or
more lags in a VR system will be.
ACM Transactions on Information Systems, Vol. 11, No 3, July 1993

Fish Tank Virtual Worlds . 263
In Experiment 3, two of the ten subjects reported slight dizziness after-
wards. This is surprising because there is little sense of immersion in fish
tank VR; one would expect much more significant problems in immersion VR.
Motion sickness is a serious problem for VR interfaces and requires careful
study with experimental subjects who are experienced in recognizing the
symptoms.
10.3 Auxiliary 3D Cues
In our experiments, we have been concerned primarily with the depth cues
provided by head-coupled perspective and stereoscope. Comparisons of these
techniques with other computer graphics methods for depth cueing are
important because efficiency trade-offs must be made when implementing
real-time 3D graphics applications. Possible studies include conducting exper-
iments to compare human perception of wire frame objects and shaded
objects, and objects with and without specular highlights, both with and
without head-coupled perspective.
ACKNOWLEDGMENTS
The authors are indebted to Michael Deering of Sun Microsystems for com-
ments on early versions of the experiments and on the history of fish tank
virtual worlds. The reference to the Krell holographic display is due to him.
William Chernoff of Shooting Star Technology (Burnaby, British Columbia)
provided advice on using the ADL-1 head tracker. We would also like to
thank the referees for their valuable comments which aided in clarifying the
presentation and in particular for comments regarding the optics in head-
mounted displays. A preliminary account of Experiments 1 and 2 was pre-
sented at the INTERCHI ’93 conference [Ware et al. 1993].
REFERENCES
ATHERTON, P. R., ANII CAPORAEL, L. R. 1985. A subjective judgment study of polygon based
curved surface imagery. In Proceedings of CHI ’85, ACM, New York, 27–34.BAECKER, R. M. 1979. Digital video display systems and dynamic graphics. In Proceedings of
SIGGRAPH ’79. Comput. Graph. 13, 2 (Aug.), 48-56.BLANCHARD,C., BURGESS,S., HARVILL,Y., LANIER,J., LM~Oj A,, OBERMAN,M., ANDTEITEL, M.
1990. Reality built for two: A virtual reality tool. In Proceedings of the 1992 ACM Sympo-
sium on Znteractiue 3D Graphzcs. Comput. Graph., 35–36.
BROOKS, F. P., JR. 1986, Walkthrough—A dynamic graphics system for simulating virtual
buildings. In Proceedings of the 1986 ACM Workshop on Interactive 3D Graphics. Con~put.
Graph., 9–21.
CARLBOM, I., AND PACIOREK, J. 1978. Planar geometric projections and viewing transforma-
tions. ACM Comput. Suru. 10, (Dec.), 465–502.CHUNG, J. C. 1992. A comparison of head-tracked and non-head-tracked steering modes in the
targeting of radmtherapy treatment beams. In Proceedings of the 1992 ACM Symposium on
Interactzue 3D Graphics. Comput. Graph., 193-196.
CODELLA, C., JALILI, R., KOVED, L., LEWIS, J. B., LING, D. T., LIPSCOMB) J. S., RABENHORST, D. A.,
WANG, C. P., NORTON, A., SWEENEY, P., AND TURK, G. 1992. Interactive simulation in a
multi-person virtual world. In Proceedings of CHI ’92. ACM, New York, 329–334.DEERINC+,M. 1992. High resolution virtual reality. In Proceedings of SIGGRAPH ’92. Comput.
Graph. 26, 2 (July), 195-202.
ACM Transactions on Information Systems, VO1 11, NO 3. JUIY 1993

264 . Kevin W, Arthur et al,
DIAMOND, R., WYNN, A., THOMSEN, K., AND TURNER, J. 1982. Three-dimensional perception for
one-eyed guys. In Computatlonul Crystallography. Oxford, Clarendon Press.
ELLIS, S. R. 1991, Nature and origins of vn-tual environments: A bibliographic essay Comput.
Syst. Eng. 2, 4, 321-347,
ELLIS, S. R,, KAISER, M K,, AND GRLTNWALD, A. J , EDS. 1991. Pzcforzal Cornmunzcatzon In
Virtual and Real Enulronments Taylor and FrancIs.
FAIRCHU,n, K M., POLTROCK, E. E., AND FURN.4S, G. W. 1988, SemNet: Three-dimensional
graphic representations for large knowledge bases, In C’ognztz we Sczence and Its ApplLcatLons
for Hz,man-Computer Interaction. Lawrence Erelbaum, Hillsdale, N. J., 201-233.
FISHMi, S S. 1982 Viewpoint dependent imaging: An interactive stereoscopic display, InProcessing and Dwplay of Three-Dzmenslonal Data. Proceedings of SPIE, vol. 367, SPIE,
41-45.
FISHEIt, S. S., MCGRMWY, M , HCTMPHMES, J,, AND RoBINwrT, W. 1986 Vmtual envmonment
display system. In Proceedings of the 1986 ACM Workshop on I?Lteractl Le 3D Graphzcs,
Comput. Graph,, 9-21.
FOLEY, J. D., AND VAN Dw1, A. 1982. Fundamentals of Interactive Computer GraphLcs.
Addison-Wesley, Reading, Mass
FOLEY, J, D., v.m Dmr, A., FEINER, S. K., AND HUGHES, J, F, 1990 Computer GraphLcs:
PrzncLples and Practzce The Systems Programming Series. Addison-Wesley, Reading, Mass,
FRRmMANN, M , STARNICR, T., AND PENTLAND, A. 1992 Device synchromzatlon using an optimal
linear filter, In Proceedings of the 19.92 ACM SymposLum on InteractLLe 3D Graphzcs. Comput.
Graph., 57-62.
HOWARD, I. P , AND Hmmmuv, T. 1989 Circular vection as a function of the rela’uve sizes,distances and positions of two competmg visual displays, Perception 18, 5, 657-665.
HOWLETT, E M. 1990 Wide angle orthostereo. In Stereoscopic Displays and Applications. In
Proc. of SPIE
Lmivc+, J., SHAW, C., ME GREEN, M, 1991. On temporal-spatial reahsm in the vu-tual reabty
enwronment. In Proceedings of ACM UIST ’91. ACM, New York, 19–25.
MACXENZIE, I. S., ANI) WARE, C 1993. Lag as a determinant of human performance in
interactive systems, In Proceedj ngs of INTERCHI ’93 Conference O?L Human Factors zn
CompL~tzng Systems, ACM, New York.
MEYRR, G, W., RUSHMEIER, H. E,, COHEN, M. F., GREENBERG, D. P., AND TORRANCE, K. E 1986.
An experimental evaluation of computer graphics imagery, ACM TralLs, Comput. Graph. 5, 1
(Jan ), 30-50.
MCKENNA, M. 1992. Interactive wewpomt control and three-dimensional operations. In Pro-
ceedings of the 1992 ACM Symposzurn on Interaetile 3D Graphics. Comput. Graph , 53–56
NEWMAN, W. M., AND SIWOULL, R F. 1979. PrlncLples of InteracttLe CompLlter Graphzcs 2nded, McGraw-Hall, New York.
NEWMAN, W. M . AND SpROULL, R F. 1972. Fu?Ldamentals of InteractLue Graphics, McGraw-Hill,New York
ROBERrSON, G. G., MACTIINLAY, J. D., AND CARD, S. K. 1991. Cone trees: Animated 3D visual-
izations of hierarcblcal reformation. In Proceedz ngs of CHI ’91. ACM, New York, 189– 194.
RORINETT, W., AND ROLLAND, J, P 1992. A computational model for the stereoscopic optics of abead-mounted display. Presence 1, 1,45-62,
SCH.ACHT~R,B. J., ED. 1983, Computer Image Generation, John Wiley and Sons, New York
SH~w, C., LI~NQ, J., GREEN, M., AND SCN, Y 1993. Decoupled simulation m virtual reality with
the MR toolklt. ACM Trans. Inf Syst. This issue.
SCN.L~NBERGER,R. L., AND MIL~RAM, P, 1991. A comparative study of rotational and stereo-scopic computer graphic depth cues. In Proceedings of the Human Factors Soczety 35th
Annual Meetzng. Human Factors Society, San Francisco, Calif,, 1452-1456,SLTTHERLAND, I. 1968. A head-mounted three dimensional display. In Proccedzngs of the Fall
Joznt Computer Confere~~ce. AFIPS Conference Proceedings, vol. 33 AFIPS, Arlington, Vs.,757-764.
V~NOLI~, D., AND WILLIAiWS, L. 1990. Virtual integral holography, In Extracting MeanL7Lg
from Complex Data: Processing, Display, ZnteractLon. Proceedings of SPIE, vol. 1259. SPIE,99-105.
ACM Transactmns on Informatmn Systems, Vol 11, No 3, July 1993,

Fish Tank Virtual Worlds . 265
WALLACH, H., AND OCONNELL, D. H. 1953. The kinetic depth effect. J. Exper. Psychol. 45,
205-217.
WANGEI?, L. 1992. The effect of shadow quality on the perception of spatial relationships in
computer generated images. In Proceedings of the 1992 ACM Symposium on Interactive 3D
Graphics. t20mput. Graph., 39-42.
WANGER, L. R., FERWERDA, J. A., AND GREENBER~, D.P. 1992. Perceiving spatial relationships
in computer-generated images. IEEE G’omput. Graph. Appl. 12, 3 (May), 44–59.
WAIW, C., AND OSBORNE, S. 1990. Exploration and virtual camera control in virtual three
dimensional environments, In Proceedings of the 1990 ACM Sbvmposium on Interactive 3D
Graphzcs. Comput.Graph .24,2,175-183.
WARE, C., ARTHUR, K. W., AND BOOTH, K.S. 1993. Fish tank virtual reahty. In Proceedings of
INTERCHI ’93 Conference on Human Factors in Computing Systems. ACM, New York, 37-42.
Received November 1992; revised April 1993; accepted April 1993
ACM Transactions on Information Systems, Vol. 11, No. 3. JUIY 1993