european union & world food programme
TRANSCRIPT

European Union & World Food Programme
Fighting Hunger Together
Baseline Food Security Survey in
Five Provinces of Central Mindanao
World Food Programme, Philippines April 2013

Baseline Food Survey: Central Mindanao | April 2013
1
Acknowledgments
This survey was coordinated by WFP, with funding support from European Union (EU), under ‘EU – Aid
to Uprooted People’, with enumerators mobilized through Department of Social Welfare and
Development (DSWD), the Provincial Project Management Office in North Cotabato (PMO), Provincial
Task Force in Sultan Kudarat and Community and Family Services International (CFSI). WFP Country
Office extends its appreciation to all who put their efforts in undertaking this survey.

Baseline Food Survey: Central Mindanao | April 2013
2
Contents
Acknowledgments ................................................................................................................................................... 1
Acronyms Used in the Document...................................................................................................................... 3
List of Tables ............................................................................................................................................................. 4
List of Figures ........................................................................................................................................................... 5
Executive Summary ............................................................................................................................................... 7
Background and Context .................................................................................................................................... 10
Methodology of the Baseline Survey ............................................................................................................. 12
Sampling ................................................................................................................................................................ 13
Data Management ................................................................................................................................................ 13
Strengths and Limitations of the Survey ........................................................................................................... 14
Findings of the Household Assessment ........................................................................................................ 15
Demographics......................................................................................................................................................... 15
Displacements ....................................................................................................................................................... 16
School aged children ............................................................................................................................................ 18
Ethnic composition .............................................................................................................................................. 20
Health Status and Facility Uses .......................................................................................................................... 20
Housing and Facilities .......................................................................................................................................... 22
Household Assets, Productive Assets and Access to Credit .................................................................. 25
Household Assets ................................................................................................................................................. 25
Debt incurred by households .............................................................................................................................. 26
Market access ........................................................................................................................................................ 28
Livestock ownership ............................................................................................................................................. 30
Livelihood Income Sources ............................................................................................................................... 32
Access to land ........................................................................................................................................................ 34
Expenditure ............................................................................................................................................................. 36
Food Sources and Consumption ...................................................................................................................... 37
Food consumption level ....................................................................................................................................... 37
Food sources ......................................................................................................................................................... 38
Coping Mechnisms ............................................................................................................................................... 39
Disasters and shocks faced by households ................................................................................................. 41
Assistance and Needs .......................................................................................................................................... 42
Household priorities ............................................................................................................................................. 45
Awareness of ‘Framework Agreement’ on the Bangsamoro ................................................................. 46
Appendix1 Findings of Community Assessment ...................................................................................... 47

Baseline Food Survey: Central Mindanao | April 2013
3
Acronyms Used in the Document
ARMM Autonomous Region in Muslim Mindanao
BJE Bangsamoro Judicial Entity
CFSI Community and Family Services International
DSWD Department of Social Welfare and Development
EFSA Emergency Food Security Assessment
EU European Union
FCS Food Consumption Score
FFA Food for Assets
IDP internally displaced person
KIIs key informant interviews
MILF Moro Islamic Liberation Front
NPE new autonomous political entity
PMO Provincial Management Office
PPS proportional to the population size
WFP World Food Programme

Baseline Food Survey: Central Mindanao | April 2013
4
List of Tables
Table No. Page
1 Population Estimate (2013) of the surveyed areas and sample allocation 14
2 Ownership of farm animals and comparison within a year ago 30
3 Major income and livelihood (summary of multiple responses) 32
4 Average income per month 33
5 Average land accessible to households 35
6 Production per hectare (only for those having access to land) 35
7 Expenditure by source and items 36
8 Experiences of disasters and their effects 41
9 Persons with special needs (sum in assessed barangays) 47
10 Barangay was affected by natural and manmade disasters 48
11 Main types of food available that are consumed, sources, and quality as compared
to normal
53
12 Projects counted from WFP assistance in 2012 (funded by EU, Multilateral
donations, DSWD, etc.)
57
13 Projects reported by the community in the assessed barangays 58

Baseline Food Survey: Central Mindanao | April 2013
5
List of Figures Figure No. Page
1 Gender of heads of households 15
2 Highest-level of education attained by household head 16
3 Type of school household head attended 16
4 Household category 17
5 Current status of ever displaced households 17
6 Number of times households displaced since June 2008 18
7 Length of stay at current location 18
8 Intention to relocate 19
9 Reasons for relocation 19
10 Percentage of households with children of elementary school age 19
11 School age children attending school 19
12 Reasons for children not attending school 20
13 Ethnic groups in Central Mindanao 20
14 Health facility visited 21
15 Treatment sought during sickness 21
16 Type of roof top material 22
17 Type of outer wall material 22
18 Tenure status of house and lot 23
19 Type of toilet facility 24
20 Main source of drinking water 24
21 Household owned assets 25
22 Per cent of households owning assets 25
23 Number of household assets 26
24 Per cent of household and number of assets owned 26
25 Current debt incurred by households 27
26 Sources of credit 27
27 Spending of credit money 28
28 Number of times household took credit to purchase food 28
29 Access to market 29
30 Market days 29
31 Distance to market and cost of transport 30
32 Households owning farm animals 31
33 Members contributing to household income 33
34 Reason for not contributing to household income 34
35 Proportion of total household income 34

Baseline Food Survey: Central Mindanao | April 2013
6
36 Access to farming land 34
37 Land tenure 35
38 Food consumption levels 37
39 Food consumption levels by household type 37
40 Sources of food consumed in seven days 38
41 Level of food stock 39
42 Number of meals usually taken per day 39
43 Coping mechanisms used in the past month 40
44 Major disasters in last one year 41
45 Decrease or loss of income or asset caused by disaster 41
46 Proportion of households assisted in the last 12 months by type of food assistance 42
47 Proportion if households assisted in the last 12 months by type of food assistance 42
48 Preferred modes of assistance 43
49 Reason for preferred modes of assistance 43
50 Intended cash use when it is the mode of assistance 43
51 Experience with remittance companies (sending or receiving money) 44
52 Priority needs of households 45
53 Awareness of the Framework Agreement on the Bangsamoro 46
54 Reasons for additional displacement when communities were displaced multiple
times
48
55 Cause of new IDP arrivals in the past six months 49
56 Main livelihood activities (household info) 49
57 Percentage engaged in different livelihoods (community info) 50
58 Community settlement locations 50
59 Percentage of community access to natural resources 50
60 Agriculture production systems 51
61 Fish production systems 51
62 Availability and adequacy of community resources and facilities after arrival of IDPs 51
63 Wealth groups 52
64 Per cent of communities without enough food most of the year 52
65 Access to market compared to normal 54
66 Hazards affecting access to food and income (rank) 54
67 Type and frequency of disasters 55
68 Peak rice production calendar 55
69 Peak corn production calendar 56
70 Peak sale of crops and livestock 56
71 Peak calendar for some events 56

Baseline Food Survey: Central Mindanao | April 2013
7
Executive Summary
A baseline survey was undertaken in five provinces of Central Mindanao namely, Maguindanao, Lanao
Del Sur, Lanao Del Norte, Sultan Kudarat and North Cotabato from 20 February - 2 March 2013. The
main objective of this survey was to create baseline indicators for projects under the “EU Aid to Uprooted
People- Enhancing the Resilience of Internally Displaced Persons in Central Mindanao by Strengthening
Livelihoods” programme. The baseline survey also fulfils requirements for monitoring changes in food
security and other relevant indicators so that year to year comparison would be possible.
The key focus of the baseline survey is to understand the current food security and livelihood situation of
the population. Information on demographics, displacements and current status, access to education,
health status, housing and facilities, household and productive assets, access to credit, livelihoods and
income, expenditure, food consumption and sources of food, disaster and coping mechanisms, assistance
and needs were collected. The survey looked at past interventions and future preferences of the
households to guide how to deliver assistance in subsequent programs and also examined the awareness
of households about the Framework Agreement on the Bangsamoro. The survey also captured the status
of WFP assisted community projects in previous years. This helps identifying which types of projects
sustained, guiding follow-up and planning for new projects within the framework of the current EU
support.
The survey was designed such that statistically representative sample was drawn from the five provinces.
Two stage cluster sampling was used to draw samples from a list of barangays to give estimates at 95 per
cent confidence interval for each province. A list of barangays for sampling was established from the
census list of barangays as well as previously assisted barangays. In the first stage, the primary sampling
units (barangays) were selected using a method called proportional to the population size (PPS). The two
most vulnerable provinces of Lanao Del Sur and Maguindanao were covered with a larger sample size
while the three other provinces were covered by a moderate sample size, in a manner that enables results
to be reported at the provincial level. The ultimate sample size was 1,620 households and was organised
by taking 108 clusters with 15 households per cluster. The data collection was undertaken by seven teams
of five persons (a team leader and four enumerators) in order to cover 1,620 household level and 108
community level interviews. Eventually, 1,619 household and 109 community key informant responses
were achieved.
About 37 per cent of households are headed by women, while 63 per cent are headed by men and the
mean age of the head of household was found to be 43 years. The average household size is about six
persons per household. The highest household size was observed in Lanao Del Sur with about eight
persons. Nearly four in five heads of households have attended some form of school.

Baseline Food Survey: Central Mindanao | April 2013
8
About 21 per cent of households indicated they were displaced once or more since the 2008 armed
conflict in Mindanao. Half of the households interviewed indicated they lived at the survey location all of
their lives (i.e. were never displaced); 35 per cent indicated they lived in the current location for over a
year and five per cent indicated they lived in the current location for 12 months or less.
Households in the surveyed provinces are composed of nine ethnic groups; the four major ones are
Maranao, Maguindanon, Cebuano and Ilonggo. The indigenous population is estimated to be 5.7 per cent.
About 86 per cent of households borrowed money to purchase food (or purchase food on credit).
Moreover, the majority of households (82 per cent) are currently in debt. Most of the households spend
the borrowed money to purchase food (79 per cent); very few households spend borrowed money on
health care (7 per cent), to purchase agricultural input or livestock (2 per cent), and for other expenses (2
per cent). The other expenses include education, loan repayment, non-food household needs, start-up
capital for livelihood, etc.
Households listed alternative livelihood and income sources. Accordingly, combined livelihood and
income source groups (from the multiple responses) were identified. The dominant combined livelihood
and income sources include: crop farming and gardening (55 per cent), daily common labourer (21 per
cent), wholesale and retail trade (18 per cent), and transportation, storage and communication services
(10 per cent).
Food consumption score (FCS) is a proxy indicator of household food security levels. FCS is a composite
score that takes into account the frequency of consumption of various food groups and their relative
importance in a household’s diet (diversity and weight). Scores are categorized into poor, borderline, and
acceptable consumption. Overall, in the five provinces, one in every five households was found to have
poor food consumption (19 per cent) and over a quarter of the households have borderline food
consumption (27 per cent). The overall food consumption level indicates that 54 per cent of households
have acceptable food consumption. The results show that three provinces of Lanao Del Notre, Lanao Del
Sur and Maguindanao have a significant proportion of households in the poor and borderline food
consumption levels. Further, by looking at the food consumption levels by the type of household, the
following pattern was observed: IDPs are the worst off (36 per cent poor 25 per cent borderline), followed
by returnees (20 per cent poor and 30 per cent borderline) and then the resettled (21 per cent poor and 28
per cent borderline). Those never displaced are slightly better off in their level of food consumption (18
per cent poor and 26 per cent borderline).
In the 30 days before the survey, households spent approximately PHP7, 393 on a host of needs including
PHP1, 921 cash and Php 801 credit on food items. Php1, 554 was used to pay debt, followed by expenses
on education and health. During shortages of food or cash to buy food, households use cheaper and less
preferred food commodities nearly every day (42 per cent), borrow money or rely on friends’ support once

Baseline Food Survey: Central Mindanao | April 2013
9
in a while (51 per cent), limit proportions of meals (43 per cent), restrict adults’ consumption in favour of
children (35 per cent), once in a while reduce the number of meals in a day (32 per cent), and once in a
while skip meals (17 per cent).
If they were given a choice, majority of the households choose cash as the preferred modality of assistance
(51 per cent), followed by combined food and cash (29 per cent), and food alone (20 per cent). If they
receive cash, households reported that they would invest in improving their livelihood. Three household
priorities stood out: food takes the lead (39 per cent) and this is as high as 48 per cent in Lanao Del Norte,
followed by cash (36 per cent), then housing materials and shelter.
When asked about the Framework Agreement, 57 per cent indicated that they were not aware compared
to 43 per cent that were.
The community survey tried to account for projects that existed in the community prior to the survey that
is in line with Food for Asset accomplished projects. The survey found out that these assets exist in
around 55 of the surveyed barangays (51 per cent).

Baseline Food Survey: Central Mindanao | April 2013
10
Background and Context
Mindanao, situated in the southern Philippines, is the second largest group of islands in the country. It
consists of multi ethnic populations including Muslims and Christians. Moro people, who consist of
various ethnic groups including Maguindanaoan, Maranao, Tausug, Iranon, among others, occupy a
significant portion of the western central and western part of the islands. Specifically, the provinces of
Maguindanao, Sultan Kudarat, North Cotabato, Lanao Del Norte and Lanao Del Sur as well as the island
provinces off the Zamboanga Peninsula namely Basilan, Sulu and Tawi-tawi, are all largely Moro-
populated.
Armed conflict between the Moro Separatist Groups and the Government troops had caused major
insecurity and population displacements in different parts of the island since the 1960s. In July 2008,
there had been a breakthrough in the peace process with the Moro Islamic Liberation Front (MILF) when
a Memorandum of Agreement (MoA) established an autonomous Moro homeland called the “Bangsamoro
Judicial Entity” (BJE) which mirrors the Moro people’s ancestral domain. The MoA, however, attracted
strong public opinion and was eventually declared unconstitutional by the Supreme Court. The response
of MILF combatants was a large-scale attack in Cotabato and Lanao Del Norte provinces which led to the
displacement of approximately 600,000 people.
Aside from armed conflict, natural disasters have also affected Mindanao, increasing the number of IDPs
and worsening the already squalid living conditions of the displaced. In addition to all of these challenges,
“rido” or clan wars plague some municipalities in these provinces. The 2009 “Maguindanao Massacre”
occurred in Ampatuan, Maguindanao killing fifty-seven civilians including thirty journalists. Through the
years, the natural disaster, in addition, was a challenge causing displacement and destruction of
properties and livelihoods, which kept the vulnerability at its highest. In August 2012, armed conflict
erupted between the BIFM and AFP, in relation to the peace talks that have been going on in earlier
months to resolve the political problems.
Incidents of armed conflicts hopefully do not recur because in late 2012, a Framework Agreement on the
Bangsamoro was reached between the Government of the Philippines (GPH), and the Moro Islamic
Liberation Front (MILF). This framework of agreement in brief describes that a new autonomous political
entity (NPE) called Bangsamoro shall be established to replace the current Autonomous Region in
Muslim Mindanao (ARMM). There will be concurrent powers shared by the Central Government and the
Bangsamoro Government, while the arrangement progressively foresees the Central Government will
have reserved powers and the Bangsamoro Government shall have its exclusive powers which will be
realised in 2016.
According to the National Statistical Coordination Board, the 2009 official poverty statistics issued in
February 2011 indicated the ARMM region consistently posted the highest poverty incidence among

Baseline Food Survey: Central Mindanao | April 2013
11
families since 2003. Poverty incidence numbers increased from 25.0 per cent in 2003 to 36.5 per cent in
2006 and again rose to 38.1 per cent in 2009.
A survey was undertaken in November and December of 2010 by the World Bank and World Food
Program on the general population. The findings of that survey indicated important insights of the
dimensions of conflict and displacements and economic impacts, and it provided Government as well as
the humanitarian community with essential estimates of the magnitude of the vulnerability in the conflict
affected areas. The survey results became the bases of programming of sustained recovery and
development humanitarian interventions. The major focus was the ARMM region encompassing the
provinces of Maguindanao and Lanao Del Sur provinces among others, where the effect of the past
conflict had severe impact. Lanao Del Norte (LDN), Sultan Kudarat, and North Cotabato were also
impacted but to a lesser extent.
To assess the situation from time to time, however, other stand-alone or joint assessments were
conducted to direct planning of interventions by the humanitarian communities working in Mindanao. A
significant source of information that is being cited is also the result of a survey conducted by WFP
January 2010, Emergency Food Security Assessment (EFSA). The primary objective of that assessment
was to provide update on the situation of IDPs in evacuation camps and examine the status of returnees
and the resettled in terms of food security, livelihoods and their coping practices.

Baseline Food Survey: Central Mindanao | April 2013
12
Methodology of the Baseline Survey
The main objective of this baseline survey was to create baseline indicators for projects under the “EU Aid
to Uprooted People - Enhancing the Resilience of Internally Displaced Persons in Central Mindanao by
Strengthening Livelihoods projects”. The baseline survey also fulfils requirements for monitoring changes
in food security and other relevant indicators so that year to year comparison would be possible. The key
focus of the baseline survey is therefore to understand the current (at the time of the survey) situation of
the population in Maguindanao, Lanao Del Sur, Lanao Del Norte, Sultan Kudarat and North Cotabato. It
collected information on demographics, displacements and current status, access to education, health
status, housing and facilities, household & productive assets, access to credit, livelihoods and income,
expenditure, food consumption and sources of food, disaster and coping mechanisms, assistance and
needs; awareness of households about the Framework Agreement on the Bangsamoro. The survey also
tried to capture, through community discussions, the condition of WFP assisted community projects in
the past years.
The information sought through the community questionnaire in the sampled barangays also included
demographic information, community information, vulnerability to food insecurity, food availability
(types, quantities, sources and quality of food commodities), seasonal calendar, hazards and responses. In
addition, questions pertaining to the EU assistance set targets were included. The achievement to these
targets will be the end results after the program intervention in 2014, but questions were included to
understand the level of such indicators at the beginning of the assistance program by taking stalk of
existing accomplishments by communities that were also supported by food for asset programs in the
past.
The population in these provinces in 2013 is approximately 5,197,719. WFP has been assisting the most
vulnerable communities since 2006. Since 2012 WFP assisted 977,112 beneficiaries through different
modes of assistance in the five provinces. One of the major forms of assistance is the Food for Asset also
supported by the European Union fund and targets communities affected by conflict under the project
“EU Aid to Uprooted People- Enhancing the Resilience of Internally Displaced Persons in Central
Mindanao by Strengthening Livelihoods projects”.
The survey was undertaken by WFP in line with WFP’s Food and Nutrition Security Conceptual
Framework. The sample was designed in such a way that the two most vulnerable provinces of Lanao Del
Sur and Maguindanao were covered with a larger sample while the three other provinces covered a
moderate size sample such that results would be usable at the provincial level.

Baseline Food Survey: Central Mindanao | April 2013
13
Sampling
The survey was designed such that statistically representative sample was drawn from the five provinces.
Within each province, a two stage cluster sample was drawn from a list of barangays to give estimates at
95 per cent confidence interval for each province. A list of barangays for sampling was established from
census barangays and from previously assisted barangays and the selection was made from this list. In the
first stage, the primary sampling units, the barangays, are selected with a method called proportional to
the population size (PPS). The two most vulnerable provinces of Lanao Del Sur and Maguindanao were
covered with a larger sample size while the three other provinces were covered by a moderate sample size,
nevertheless, results would be usable at the provincial level. The estimated sample size was 1,620
households and organised by taking 108 clusters x 15 households per cluster. The data collection was
undertaken from 20 February - 2 March 2013, where seven teams of five persons (a team leader and four
enumerators) was fielded in order to cover 1,620 household and 108 community level interviews and
ultimately 1,619 responses were achieved.
The baseline survey data collection was organised in such a way that field data collection took a maximum
of ten days for each team. Two teams in Iligan for Lanao Del Sur and Lanao Del Norte, and three teams in
Magunidanao, North Cotabato and Sultan Kudarat were fielded. The field staffs was trained for two days,
one day in classroom to understand the objectives, protocols, questionnaires, and sampling and interview
techniques; and on the second day, hands-on practical exercises were done in nearby villages. The final
draft of the questionnaire was thoroughly discussed and practiced to ensure that the enumerators and
team leaders understood the questions to avoid bias in administering the questionnaire. Team leaders
were given additional training and guidelines about their roles and responsibilities which included
ensuring adherence to the household selection protocols ensuring that all questionnaires were completed
appropriately and consistently. The team leaders were also assigned with the responsibility of sampling
households and conducting key informant interviews at the community level. Overall some 70
municipalities were covered. Community Family and Services International (CFSI), Department of Social
welfare and Development (DSWD) and the Provincial Project Management Office (PMO) staff also
participated in the field work in a few areas.
Data Management
A Microsoft Access database was created with data entry platform and used to capture the collected data.
Training was provided to 10 data encoders and they completed data entry in five days. The database was
reviewed for inconsistencies and errors. All data captured was exported into SPSS and EXCEL for final
analyses. Data entry platform, data cleaning and analyse were undertaken by WFP.

Baseline Food Survey: Central Mindanao | April 2013
14
Table 1 Population estimate (2013) of the surveyed areas and sample allocation
Province Estimated Population- 2013 Sampled Clusters Sampled Households
Lanao del Norte 952,293 15 225
Lanao del Sur 1,067,214 31 465
Maguindanao 1,137,707 32 480
North Cotabato 1,260,226 15 225
Sultan Kudarat 780,281 15 225
Total 5,197,719 108 1620
Source: National Statistics Office 2010 –estimate projected for 2013 using annual growth rate by the authors.
Strengths and Limitations of the Survey
The assessment teams have not encountered major obstacles during field work. However, after the
selection of the first set of clusters, it was revealed that some clusters were inaccessible due to difficulty
for data collection or security reasons. In such cases alternative replacement clusters were selected. Where
full municipalities were considered inaccessible due to insecurity, the sampling frame also excluded these
municipalities. It was also noted that in some distant locations teams described it was a challenge to
complete 15 sets of household questionnaires and a community interview in a day due to distance to the
clusters and between the selected households.
The estimates provided by province are subject to use with caution as the sample size for some
desegregation may not be sufficient to reliably portray the statistics. Disaggregated results in the report
are provided as indicative of surveyed variables because sample observations in some cross classifications
may not be sufficient to provide completely reliable results. The interpretation of and use of such results
should be given due caution by users.
Baseline Food Survey: Central Mindanao | April 2013
15
Findings of the Household Assessment Demographics
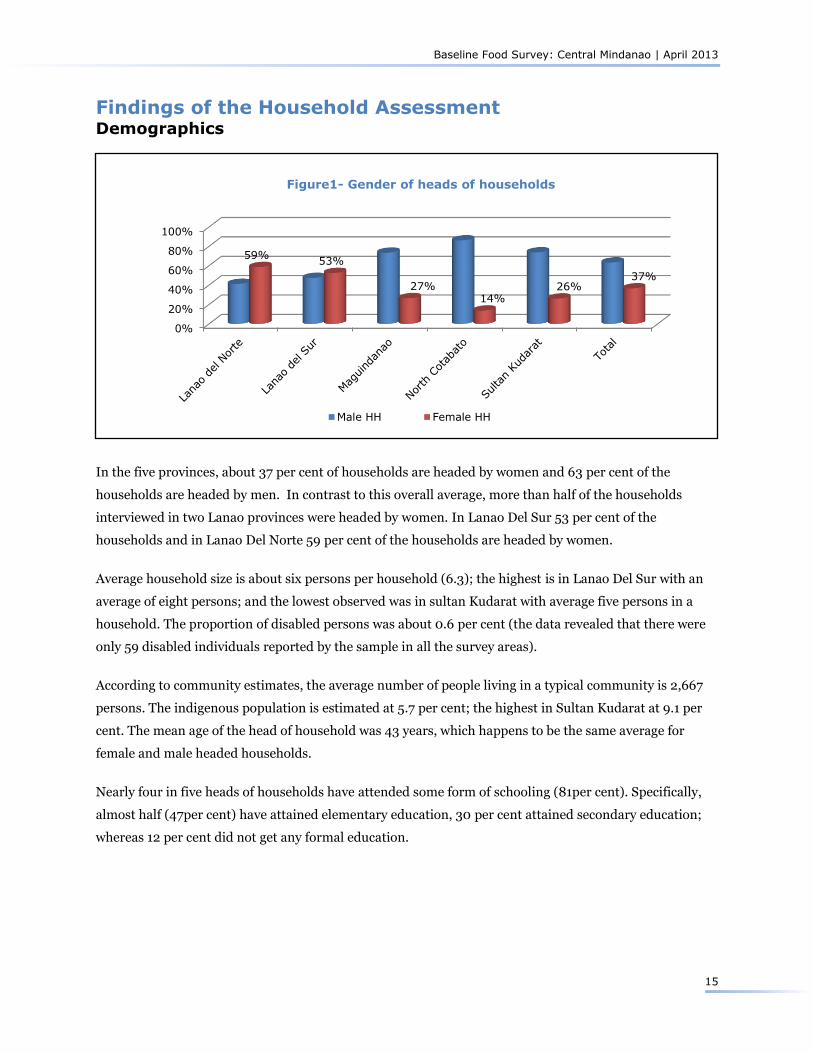
In the five provinces, about 37 per cent of households are headed by women and 63 per cent of the
households are headed by men. In contrast to this overall average, more than half of the households
interviewed in two Lanao provinces were headed by women. In Lanao Del Sur 53 per cent of the
households and in Lanao Del Norte 59 per cent of the households are headed by women.
Average household size is about six persons per household (6.3); the highest is in Lanao Del Sur with an
average of eight persons; and the lowest observed was in sultan Kudarat with average five persons in a
household. The proportion of disabled persons was about 0.6 per cent (the data revealed that there were
only 59 disabled individuals reported by the sample in all the survey areas).
According to community estimates, the average number of people living in a typical community is 2,667
persons. The indigenous population is estimated at 5.7 per cent; the highest in Sultan Kudarat at 9.1 per
cent. The mean age of the head of household was 43 years, which happens to be the same average for
female and male headed households.
Nearly four in five heads of households have attended some form of schooling (81per cent). Specifically,
almost half (47per cent) have attained elementary education, 30 per cent attained secondary education;
whereas 12 per cent did not get any formal education.
0%
20%
40%
60%
80%
100%
59% 53%
27% 14%
26% 37%
Figure1- Gender of heads of households
Male HH Female HH

Baseline Food Survey: Central Mindanao | April 2013
16
Displacements
Currently (at the time of the survey), 69 per cent of households indicated they were never displaced, 16
per cent are returnees, 12 per cent are resettled. IDPs are estimated between 2 per cent and 3.7 per cent
(information from household data could not classify one per cent to any status; however, community level
information indicated IDPs at about 3.7 per cent). The highest proportion of returnees was observed in
Maguindanao, the highest resettled in North Cotabato while the highest IDP was observed in
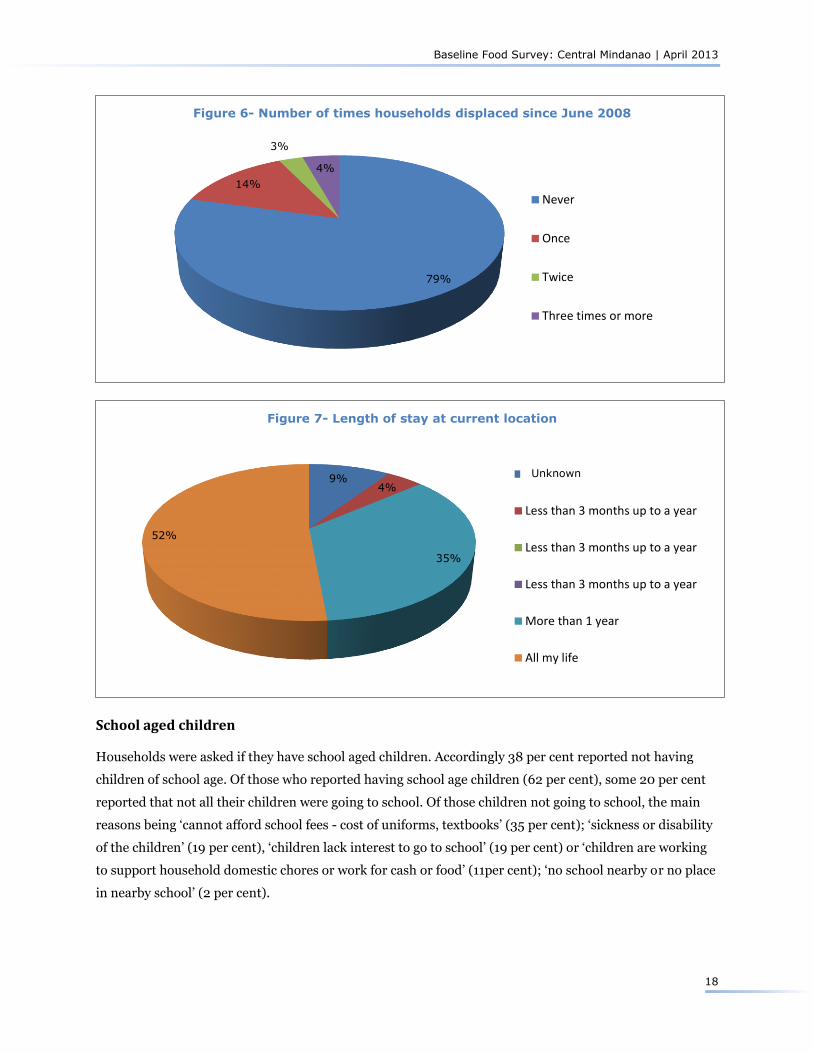
Maguindanao. About 21 per cent of households indicated they were displaced once or more since the
2008 armed conflict in Mindanao.
In addition, half of the households interviewed indicated they lived at the survey location all of their lives
(i.e. they were never displaced); 35 per cent indicated they lived in the current location for over a year and
another five per cent indicated they lived in the current location for 12 months or less (these were new or
12%
47%
30%
2%
9%
Figure 2-Highest level of education attained by household head
None Elementary Secondary Vocational College
19%
16%
65%
Figure3-Type of school household head attended
None Madrasa/Arabic English medium

Baseline Food Survey: Central Mindanao | April 2013
17
recent arrivals). In contrast, data collected in EFSA 2010 indicated that 45.1 per cent were returnees, 41.1
per cent IDPs, and 13.7 per cent resettled households, which is different from that of the current survey
result.
The survey indicated some 29 per cent moved to the current location on voluntary bases while two per
cent indicated they moved involuntarily and four per cent moved for other reasons such as household was
a native of the current location. In response to the question, “Was your movement facilitated?” only 12 per
cent indicated that their movement was facilitated; the majority indicated that their movement was not
facilitated.
When asked if the household intends to move away from the current location in the near future, some 10
per cent indicated that they want to move, and their reasons were to seek livelihood opportunities and get
access to land (18 per cent); for security reasons (3 per cent) and other reasons (8 per cent), including
reunion with family and unspecified reasons.
1% 2%
12%
16%
69%
Figure 4-Household category
Unknown
IDP
Resettled
Returnee
Never displaced
0%
20%
40%
60%
80%
100%
Lanao delNorte
Lanao del Sur Maguindanao North Cotabato Sultan Kudarat
10% 12%
25% 17%
7%
Figure 5-Current status of ever displaced households
IDP Resettled Returnee
Baseline Food Survey: Central Mindanao | April 2013
18
School aged children
Households were asked if they have school aged children. Accordingly 38 per cent reported not having
children of school age. Of those who reported having school age children (62 per cent), some 20 per cent
reported that not all their children were going to school. Of those children not going to school, the main
reasons being ‘cannot afford school fees - cost of uniforms, textbooks’ (35 per cent); ‘sickness or disability
of the children’ (19 per cent), ‘children lack interest to go to school’ (19 per cent) or ‘children are working
to support household domestic chores or work for cash or food’ (11per cent); ‘no school nearby or no place
in nearby school’ (2 per cent).
79%
14%
3%
4%
Figure 6- Number of times households displaced since June 2008
Never
Once
Twice
Three times or more
9% 4%
35%
52%
Figure 7- Length of stay at current location
Unkn
Less than 3 months up to a year
Less than 3 months up to a year
Less than 3 months up to a year
More than 1 year
All my life
Unknown

Baseline Food Survey: Central Mindanao | April 2013
19
5%
1%
9%
85%
Figure 8-Intention to relocate
Response unknown
Yes, within 12 months
Yes, within 12 months
Yes, within 12 months
Yes, do not k the time
Not at all
9% 3%
7%
81%
Figure 9- Reasons for relocation
To seek livelihood opportunities
Security reasons
Other(Acces land /family Reunion)
No response
38%
62%
Figure 10-Percentage of households
with children of elementary school age
No Yes
80%
20%
Figure-11-School age children
attending school
Yes, all Yes, not all

Baseline Food Survey: Central Mindanao | April 2013
20
Ethnic composition
Households in the surveyed provinces were composed of nine ethnic groups; the four major ones are
Maranao, Maguindanon, Cebuano and Ilonggo among others and are presented as follows.
Health Status and Facility Uses
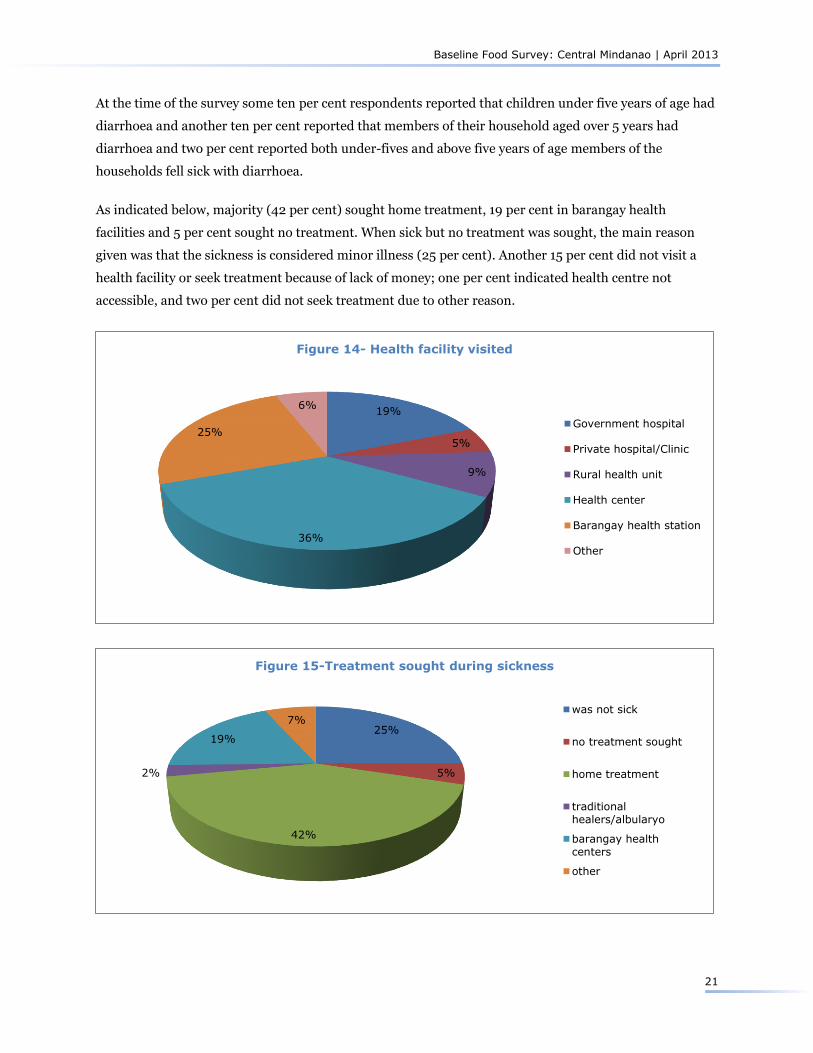
The majority in the five provinces visit health centre (36 per cent), government hospital (19 per cent)
barangay health station (25 per cent) and rural health unit (9 per cent). On average it takes one hour to
walk to the indicated health facility, however in North Cotabato it takes almost two hours and in Lanao
Del Sur about an hour and a quarter while in Sultan Kudarat it takes about half hour.
19%
35%
2%
11%
19%
0% 14%
Figure 12- Reason for children not attending school
Sickness/disability
Cannot afford (school fees, uniforms,textbooks)
No school nearby or no place in nearbyschool
Working to support household (domesticchores, work for cash or food)
Not interested in school
Schools not functioning
Other reasons
0% 20% 40% 60% 80% 100%
Lanao del Norte
Lanao del Sur
Maguindanao
North Cotabato
Sultan Kudarat
Five Provinces
Figure 13- Ethnic groups in Central Mindanao
Maranao
Cebuano
Boholano
Iranun
Ilonggo
Ilocano
Blaan
Maguindanaon
Tausug
Teduray
Manobo
Baseline Food Survey: Central Mindanao | April 2013
21
At the time of the survey some ten per cent respondents reported that children under five years of age had
diarrhoea and another ten per cent reported that members of their household aged over 5 years had
diarrhoea and two per cent reported both under-fives and above five years of age members of the
households fell sick with diarrhoea.
As indicated below, majority (42 per cent) sought home treatment, 19 per cent in barangay health
facilities and 5 per cent sought no treatment. When sick but no treatment was sought, the main reason
given was that the sickness is considered minor illness (25 per cent). Another 15 per cent did not visit a
health facility or seek treatment because of lack of money; one per cent indicated health centre not
accessible, and two per cent did not seek treatment due to other reason.
19%
5%
9%
36%
25%
6%
Figure 14- Health facility visited
Government hospital
Private hospital/Clinic
Rural health unit
Health center
Barangay health station
Other
25%
5%
42%
2%
19%
7%
Figure 15-Treatment sought during sickness
was not sick
no treatment sought
home treatment
traditionalhealers/albularyo
barangay healthcenters
other
Baseline Food Survey: Central Mindanao | April 2013
22
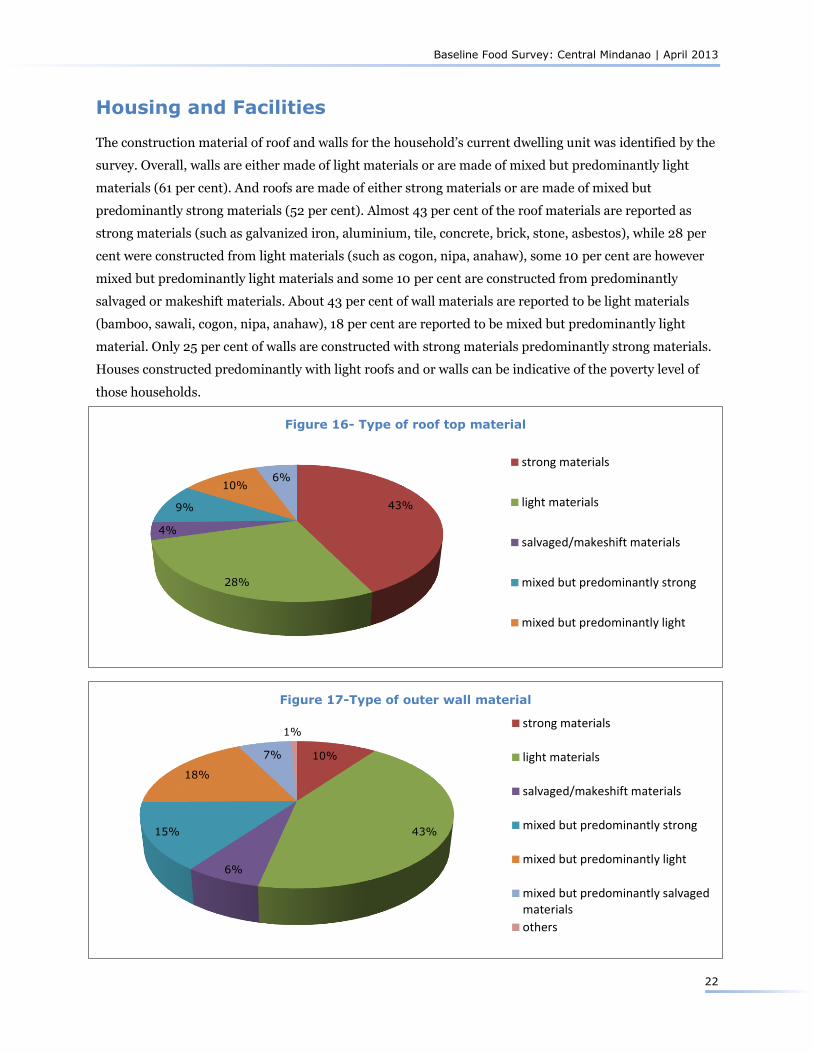
Housing and Facilities The construction material of roof and walls for the household’s current dwelling unit was identified by the
survey. Overall, walls are either made of light materials or are made of mixed but predominantly light
materials (61 per cent). And roofs are made of either strong materials or are made of mixed but
predominantly strong materials (52 per cent). Almost 43 per cent of the roof materials are reported as
strong materials (such as galvanized iron, aluminium, tile, concrete, brick, stone, asbestos), while 28 per
cent were constructed from light materials (such as cogon, nipa, anahaw), some 10 per cent are however
mixed but predominantly light materials and some 10 per cent are constructed from predominantly
salvaged or makeshift materials. About 43 per cent of wall materials are reported to be light materials
(bamboo, sawali, cogon, nipa, anahaw), 18 per cent are reported to be mixed but predominantly light
material. Only 25 per cent of walls are constructed with strong materials predominantly strong materials.
Houses constructed predominantly with light roofs and or walls can be indicative of the poverty level of
those households.
43%
28%
4%
9%
10% 6%
Figure 16- Type of roof top material
strong materials
light materials
salvaged/makeshift materials
mixed but predominantly strong
mixed but predominantly light
10%
43%
6%
15%
18%
7%
1%
Figure 17-Type of outer wall material
strong materials
light materials
salvaged/makeshift materials
mixed but predominantly strong
mixed but predominantly light
mixed but predominantly salvagedmaterials
others

Baseline Food Survey: Central Mindanao | April 2013
23
When respondents were asked about the tenure status of their homes and residential land, nearly half (47
per cent) reported the dwelling they live in could be categorized as owned or owner like possession, 37 per
cent live in own house rent-free lot with consent of owner and 11 per cent live in rent-free house and lot
with consent of owner and some 6 per cent reported other forms of tenure.
Types of toilet facility for the households are reported as follows; Water sealed/flush toilet (26 per cent),
closed pit (25 per cent ), open pit (17 per cent ), no toilet or use field, bush or river side (29 per cent) and
other types (4per cent ). The type of toilet used by households can be another indicator to identify the
level of poverty as well as the health and hygiene situation of populations.
Regarding source of cooking fuel, 95 per cent of households reported that they are using wood, charcoal or
coconut husk, two per cent are using LPG , another two per cent are using electricity and one per cent uses
either kerosene or other fuel. The type of cooking fuel used by households can also be another indicator to
identify the level of poverty.
The main source of drinking water is obtained from a shared pipe or hand pump to 27 per cent
households, followed by shared community faucet water system (24 per cent) and from either a spring,
river, stream, lake, pond or dam (22 per cent), some stated that they obtained water from a dug well (10
per cent) and from own or community faucet water system (8 per cent). It was also noted that distance to
these water sources was on the average, 10 minutes’ walk away from the household. It takes 15 minutes to
walk to the water source in Maguindanao, and about eight minutes’ walk away in the other provinces.
When asked whether the households treat the water available to the household’s consumption, nine out of
ten (89 per cent) reported that they do not treat the water, six per cent boil to treat the water, four per
cent treat their water by filtering, and one per cent uses chemical or other mechanisms to treat water.
47%
1% 2%
37%
2% 11%
Figure 18-Tenure status of house and lot
owned or owner like possession
rented house/room
own house but rented lot
own house, rent free lot withconsent of owner
own house, rent free lot withoutconsent of owner
rent free house and lot withconsent of owner

Baseline Food Survey: Central Mindanao | April 2013
24
26%
25% 16%
29%
4%
Figure 19-Type of toilet facility
water sealed/flush toilet
closed pit
open pit
no toilet/field/bush/river side
other
8%
24%
6%
27%
10%
22%
3%
Figure 20-Main source of drinking water
own faucet, community watersystem
shared faucet, community watersystem
own use tubed/piped well
shared tubed/piped well/handpump
dug well
spring/river/stream/pond/lake/dam
other

Baseline Food Survey: Central Mindanao | April 2013
25
Household Assets, Productive Assets and Access to Credit
Household Assets
About 13 per cent of households own at least one household asset during the survey; this proportion was
about 11 per cent a year ago. Ownership of some specific assets such as mobile phone has increased since
a year ago. Majority of households own cellular phones (32 per cent) and this has increased from 28 per
cent a year ago, 22 per cent currently own television compared to 23 per cent a year ago; radio cassette
owned by 14 per cent compared to 16 per cent a year ago; 6 per cent own motorcycle or tricycle compared
to 6 per cent a year ago.
0%
20%
40%
60%
80%
100%
87%
13%
89%
11%
Figure 21- Household owned assets
Current-No Asset Current-Have asset A year ago-No Asset A year ago-Have asset
0%10%20%30%40%50%60%70%80%90%
100%
Figure 22-Per cent of households owning assets
Current A year ago

Baseline Food Survey: Central Mindanao | April 2013
26
Debt incurred by households
When asked “do you borrow money to purchase food or do you purchase food on credit?” 86 per cent
responded affirmatively. Regarding debt burden, only 17 per cent indicated that they are not currently
indebted while majority of households (82 per cent) are currently indebted i.e. owe debt that ranges from
less than 1,000 Php to over 10,000 Php, specifically, over 19 per cent of households indicated they owe
-
0.5
1.0
1.5
2.0
2.5
3.0
3.5
Lanao delNorte
Lanao del Sur Maguindanao NorthCotabato
SultanKudarat
Total
2 2
2
3 3
2
Figure 23-Number of household assets
Hh Asets Current Hh Asets a year ago
0% 20% 40% 60% 80% 100%
Owns No Asset
Own 1 - 6 Items
Owns over 9 Items
Owns No Asset
Own 1 - 6 Items
Owns over 9 Items
Curr
ent
A Y
ear
Ago
19%
78%
67%
18%
79%
65%
Figure 24-Per cent of household and number of assets owned
Lanao del Norte Lanao del Sur Maguindanao North Cotabato Sultan Kudarat

Baseline Food Survey: Central Mindanao | April 2013
27
more than 10,000 Php. As indicated by the data, few (1.2 per cent) were highly indebted up to 100,000
Php. The debt money was mainly borrowed from relatives and friends (33 per cent), from charities, NGOs,
LGUs, bank or cooperatives (4 per cent) and a significant proportion get it from the local lender or pawn
shops (10 per cent). It was also noted that 33 per cent either did not indicate the sources of borrowing or
do not have access to credit.
17%
18%
31%
14%
19%
1%
Figure 25-Current debt incurred by households
No
Yes <1,000 peso
Yes 1,000-5,000 peso
Yes 5,000-10,000 peso
>10,000 peso
other
4%
53%
33%
10%
Figure 26-Sources of credit
Bank, cooeratives, charities,NGO/LGU
Relatives/friends
No responses,do not borrow orhave no access
Local lender/pawn shop
Baseline Food Survey: Central Mindanao | April 2013
28
Some 11 per cent did not respond to the question posed to respondents to find out how often they use
credit or borrow money to purchase food in the last one month. Over half of the households (52 per cent)
indicated that they borrowed two to four times. Only 37 per cent borrowed once.
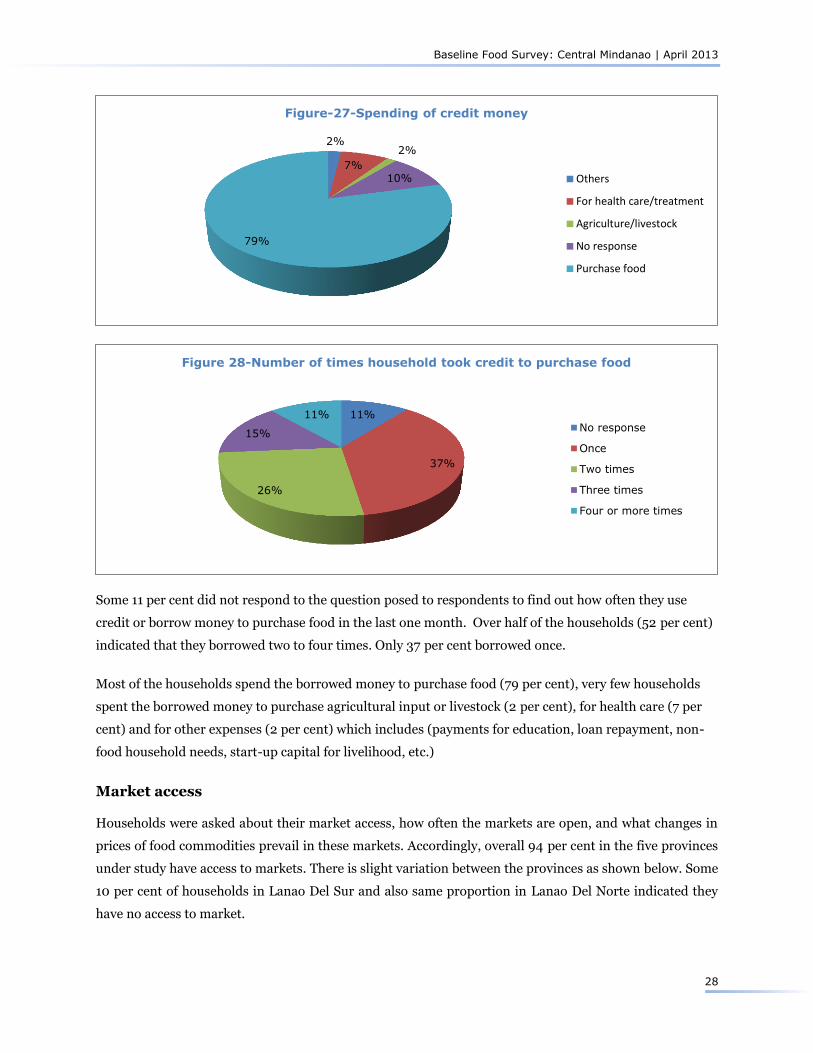
Most of the households spend the borrowed money to purchase food (79 per cent), very few households
spent the borrowed money to purchase agricultural input or livestock (2 per cent), for health care (7 per
cent) and for other expenses (2 per cent) which includes (payments for education, loan repayment, non-
food household needs, start-up capital for livelihood, etc.)
Market access
Households were asked about their market access, how often the markets are open, and what changes in
prices of food commodities prevail in these markets. Accordingly, overall 94 per cent in the five provinces
under study have access to markets. There is slight variation between the provinces as shown below. Some
10 per cent of households in Lanao Del Sur and also same proportion in Lanao Del Norte indicated they
have no access to market.
2%
7%
2%
10%
79%
Figure-27-Spending of credit money
Others
For health care/treatment
Agriculture/livestock
No response
Purchase food
11%
37%
26%
15%
11%
Figure 28-Number of times household took credit to purchase food
No response
Once
Two times
Three times
Four or more times

Baseline Food Survey: Central Mindanao | April 2013
29
It was reported that 78 per cent of respondents indicated that the markets are open daily, 10 per cent of
the markets open weekly, nine per cent open very frequently although not daily. There are also places
where there are weekly markets, presumably these are in addition to small daily markets, and where one
can avail of non-food items such clothes, tools, livestock, manufactured products that households buy
infrequently. The weekly market is the only available market outlet available especially in interior
barangays. From general understanding one usually finds at least one sari-sari (small village retail shops)
in most barangays, though its capacity of providing essential households need are not assured.
Overall markets are one hour walk away on average. The longest walking time to market takes an hour
and forty-five minutes in Lanao Del Norte, while it takes about half an hour walking to a market in Sultan
Kudarat. Other than walking, households also use available transportation means to access the market.
The two ways cost of transport was on average some 58 Php and highest in Lanao Del Sur is 76 Php.
0%
20%
40%
60%
80%
100%
Lanao del Norte Lanao del Sur Maguindanao North Cotabato Sultan Kudarat
90% 90% 96% 98% 98%
Figure 29-Access to market
No Yes
0
0.2
0.4
0.6
0.8
1
Lanao del Norte Lanao del Sur Maguindanao North Cotabato Sultan Kudarat
83% 78%
82%
69% 76%
Figure 30- Market days
No Response Daily 2 to 5 days per week Weekly

Baseline Food Survey: Central Mindanao | April 2013
30
Current rice prices (survey was conducted in February 2013) as compared to same time last year are
reported to be higher (68 per cent), much higher (9 per cent), no change (14 per cent), lower (5 per cent),
and no response (3 per cent).
Livestock ownership
The survey covered 1,619 households, however not many households own farm animals as was observed
from the data, especially the larger animals. Cows or goats are owned by some eight per cent of
households compared to six per cent a year ago. Carabaos are owned by seven per cent of the households.
Nine per cent own pigs compared to six per cent a year ago. Some 57 per cent of households own chicken,
ducks and geese which show an improvement from a year ago. Generally more households own farm
animals this year than a year ago. This is only true for households reporting any type of animals, the
current year per cent of households increased but animal per household decreased.
Thus, number of animals per reporting household decreased for most animal types. The number of
animals per reporting household is shown in the table below.
Table 2 Ownership of farm animals and comparison with a year ago
Farm Animal Reporting Households (per cent)
For those who own
Animals per
Household (average number)
A year ago Current A year ago Current
Cows bullocks 6% 8% 3.14 1.56
Carabaos Buffaloes 7% 7% 2.32 1.55
Goats 6% 8% 2.34 2.33
Sheep 0% 1% 2.57 2.42
Chicken ducks gees 38% 57% 8.12 7.30
Horses 3% 5% 1.78 1.59
Pig 6% 9% 2.06 1.55
Other (cat, dog and dove) 4% 5% 1.77 2.21
0
50
100
150
Lanao del
Norte
Lanao del Sur North
Cotabato
Maguindanao Sultan
Kudarat
All
106 84
71
47 36
67 58
Figure 31-Distance to market and cost of transport
Distance to market walking minutes Cost in pesos- using transport Time in Minutes -using transport

Baseline Food Survey: Central Mindanao | April 2013
31
0%
20%
40%
60%
80%
100%
Does not ownanimals
Ownsanimals
Did not ownanimals
Ownedanimals
Current A year Ago
87%
13%
91%
9%
Figure 32-Households owning farm animals

Baseline Food Survey: Central Mindanao | April 2013
32
Livelihood Income Sources Households were asked “what are your household’s current main livelihoods activities”. In response,
households listed alternative income sources. Accordingly combined livelihood and income source groups
(on the multiple responses) were identified. Dominant combined livelihood and income sources include
crop farming and gardening (55 per cent), wholesale and retail trade (18 per cent), daily common labourer
(21 per cent), and transportation, storage and communication services (10 per cent).
Table 3 Major income and livelihood (summary of multiple responses)
Livelihood /income sources Lanao del Norte
Lanao del Sur
Maguindanao North Cotabato
Sultan Kudarat
Total
Products from crop farming and gardening
49% 54% 57% 62% 52% 55%
Daily/common labourer 18% 7% 13% 54% 36% 21%
Wholesale and retail trade 13% 20% 15% 20% 22% 18%
Transportation, storage and communication services
6% 8% 16% 9% 9% 10%
Pension, government allowances 5% 16% 4% 15% 6% 9%
Fishing 8% 7% 13% 0% 9% 8%
Forestry and hunting 8% 2% 13% 1% 1% 6%
Skilled salaried employment 9% 7% 3% 2% 5% 5%
Unskilled salaried employment 11% 2% 4% 4% 9% 5%
Construction/skilled labour 8% 2% 6% 2% 3% 4%
Livestock and poultry raising 1% 1% 4% 4% 5% 3%
Manufacturing/handicraft 4% 2% 3% 0% 2% 3%
Remittances 3% 2% 4% 2% 4% 3%
Mining and quarrying 1% 4% 1% 0% 0% 2%
Activities not elsewhere classified 8% 16% 8% 7% 4% 10%
As indicated, the households listed alternative income sources (first, second, third and fourth) indicating
also the proportion of their household’s income drawn from these alternative sources. The proportion of
income obtained from the first two major sources for majority of households covers all of their income.
About 79 per cent is obtained from the first income source and about 19 per cent was obtained from the
second source.
The number of household members contributing to household income is also identified. Dominantly (54
per cent) of households’ income earner is one person, in 27 per cent of the households two persons earn
the household’s income. Relatively small percentage of the households has over two persons earning
income. Seven per cent of the households have no income sources.

Baseline Food Survey: Central Mindanao | April 2013
33
When members of the household are not income earners, reason given for the non-contributing members
of the household were: underage i.e. less than fifteen years old (35 per cent ), child and elderly care (24
per cent ), studies (27 per cent ), sickness, disability, care for persons with disabilities or other reasons
account for some 13 per cent. Proportions of revenues and average income of households obtained from
varying sources are presented below.
Table 4: Average income per month (Php)
Province Average income per month (Php)
Lanao del Norte 7,909
Lanao del Sur 7,836
Maguindanao 5,740
North Cotabato 5,393
Sultan Kudarat 6,044
Total 6,637
7%
54%
27%
9%
3%
Figure 33-Members contributing to household income
None
One
Two
Three
Four or more
5%
3%
35%
21%
4%
1%
27%
4%
Figure 34- Reason for not contributing to household income
NR
Sickness/disability
Underage (<15 years old)
Child care
Elderly care
PWD care
Studies
Other
Baseline Food Survey: Central Mindanao | April 2013
34
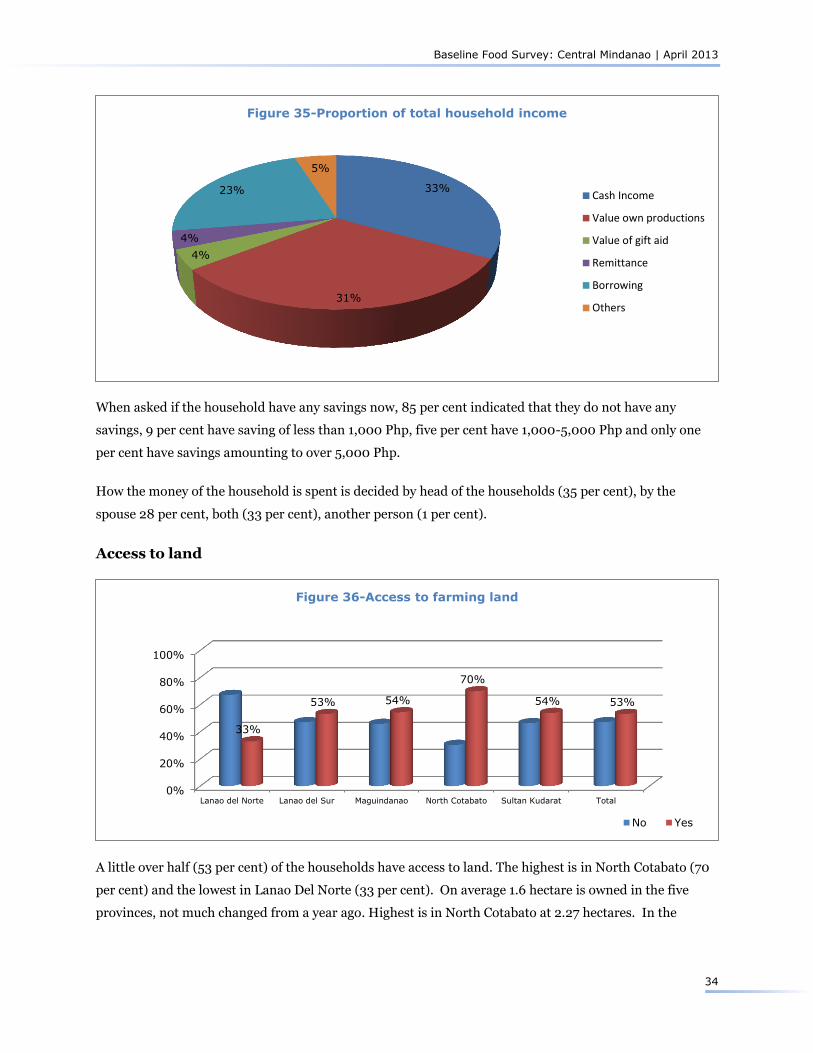
When asked if the household have any savings now, 85 per cent indicated that they do not have any
savings, 9 per cent have saving of less than 1,000 Php, five per cent have 1,000-5,000 Php and only one
per cent have savings amounting to over 5,000 Php.
How the money of the household is spent is decided by head of the households (35 per cent), by the
spouse 28 per cent, both (33 per cent), another person (1 per cent).
Access to land
A little over half (53 per cent) of the households have access to land. The highest is in North Cotabato (70
per cent) and the lowest in Lanao Del Norte (33 per cent). On average 1.6 hectare is owned in the five
provinces, not much changed from a year ago. Highest is in North Cotabato at 2.27 hectares. In the
33%
31%
4%
4%
23%
5%
Figure 35-Proportion of total household income
Cash Income
Value own productions
Value of gift aid
Remittance
Borrowing
Others
0%
20%
40%
60%
80%
100%
Lanao del Norte Lanao del Sur Maguindanao North Cotabato Sultan Kudarat Total
33%
53% 54%
70%
54% 53%
Figure 36-Access to farming land
No Yes

Baseline Food Survey: Central Mindanao | April 2013
35
current year the average land accessible to households in Lanao Del Norte, Lanao Del Sur and Sultan
Kudarat is increasing.
Table 5 Average land accessible to households
Province Land 2013 (ha) Land a year ago (ha)
Lanao del Norte 1.74 1.56
Lanao del Sur 1.20 .98
Maguindanao 1.27 1.54
North Cotabato 2.27 2.30
Sultan Kudarat 2.11 1.96
Total 1.60 1.59
The crop production information is summarised as follows: main crops include rice, corn, casava,
coconut, banana and others (mainly coffee, fruits, vegetables,root crops). (Note:information is collected in
kilograms though other units of measurement may have been reported.)
Table 6 Production per hectare (only for those having access to land)
Province Production Kg per hectare
Rice Cassava Corn Banana Coconut Other
Lanao del Norte 205 - 618 2 717 10
Lanao del Sur 1,045 409 1,010 9 52 49
Maguindanao 4,233 6 1,120 9 206 10
North Cotabato 1,820 23 965 8 11 48
Sultan Kudarat 1,492 10 1,613 71 46 38
Total 2,169 110 1,102 19 165 33
32%
43%
18%
7%
0%
Figure 37-Land tenure
Fully owned by family
Tenant (share of harvest)
Leased/borrowed/rented
Rent free
Other (cert of ownership/transfer)

Baseline Food Survey: Central Mindanao | April 2013
36
Expenditure Households were asked how much they spent on different consumables such as food, beverages, etc. On
average in the last thirty days before the survey, households spent about 7,393 Php on household needs
of which 1,921 php cash and 801 php on credit was spent on food items,1,554 Php was used to pay debt,
followed by expenses on education and helath. Note: the expenditure category ‘other’ includes baby milk,
diapers, fertilizer, seeds, gasoline and lot rental. Expenditure on consumables is presented below.
Table 7 Expenditure by source and items
Expenditure Items Cash Credit Total per cent
Food items 1,921 801 2,722 37%
Beverages 254 40 294 4%
Alcoholic beverages, tobacco, betel nut 118 6 125 2%
Cooking fuel electricity water 178 4 182 2%
Household supplies 283 20 303 4%
Cosmetics hygiene articles 78 3 82 1%
Clothing shoes and other wear 115 2 117 2%
Education 407 48 456 6%
Medical care 309 186 496 7%
Furnishing and HH equipment 24 2 27 0%
Celebrations 275 28 303 4%
Zakat and sadaka 77 1 78 1%
Housing materials 111 6 117 2%
Debt repayment 1,277 278 1,554 21%
Transportation 339 12 351 5%
Communication mobile phone load 113 1 113 2%
Other 36 38 74 1%
Total 5,915 1,478 7,393 100%

Baseline Food Survey: Central Mindanao | April 2013
37
Food Sources and Consumption
Food consumption level
Each household was asked to identify the food that it had consumed over the seven day period prior the
date of the survey. For each of the foods on the list, the number of days that the item was consumed by at
least one of members of the household was recorded. This information on diet diversity and frequency of
consumption was analysed by calculating the Food Consumption Score (FCS) and, subsequently, grouping
these scores into Food Consumption Group.
0%
10%
20%
30%
40%
50%
60%
70%
80%
90%
100%
Lanao del
Norte
Lanao del Sur Maguindanao North
Cotabato
Sultan Kudarat Total
48% 43%
53%
68% 69%
54%
Figure 38-Food cosumption levels
Poor (<=28) Bordeline (>28 - 42) Acceptebable (>42)
0%
10%
20%
30%
40%
50%
60%
70%
80%
90%
100%
IDP Resettled Returnee Unclasified Never displaced Total
36%
21% 20% 26%
18% 19%
Figure 39-Food cosumption levels by household type
Poor (<=28) Bordeline (>28 - 42) Acceptebable (>42)

Baseline Food Survey: Central Mindanao | April 2013
38
Food Consumption Scores are calculated based on the diversity of households’ consumption of eight food
groups, which is weighed according to the quality of nutrients that they bring to the diet, multiplied by the
frequency of consumption. From this score three Food Consumption Groups are created. The resulting
scores from this analysis are categorised into three groups. A score of 0-28 indicates ‘poor food
consumption’, a score over 28 and less or equal to 42 indicates ‘borderline food consumption’ and a score
greater than 42 is considered ‘acceptable food consumption’. Looking at this consumption by type of
households in the study areas the following patern was observed. IDPs are the worst of the group followed
by returnees and the resettled. The never dispalced are relatively better off in their level of food
consumption. Overall, one in every five households was found to have poor and over a quarter of the
households have borderline food consumption pattern. The result indicates that the three provinces of
Lanao Del Notre, Lanao Del Sur and Maguindanao have significant proportion of households falling in the
poor and borderline food consumption level. This finding is consistent with the World Bank-WFP joint
assessment results.
Food sources Sources of the food consumed in the seven days before the survey was also indicated by the respondents.
The majority purchased the food consumed in the seven day period (71 per cent ) followed by own
production(16 per cent ).
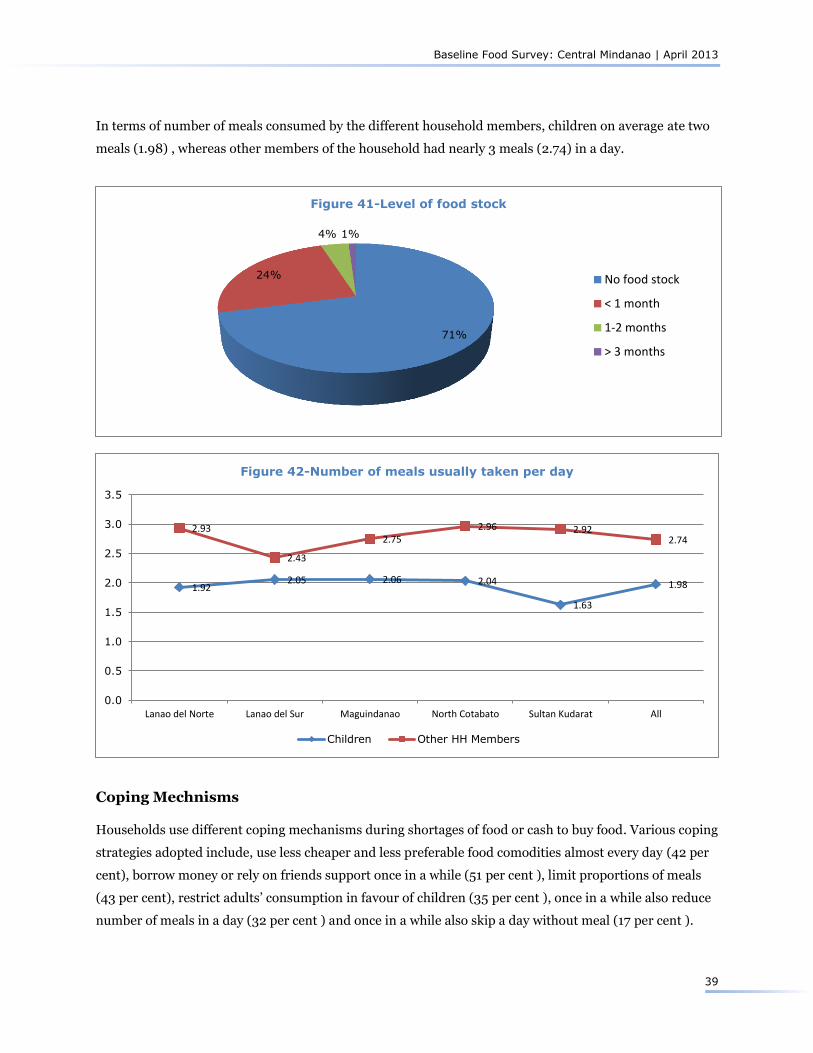
When households were asked how long the food stock they currently have lasts, it was revealed that
households do not have sufficient stocks to rely on. 71 per cent indicated they do not have any stock left
while 24 per cent indicated their stock lasts less than a month.
0%
10%
20%
30%
40%
50%
60%
70%
80%
90%
100%
Purchase Own production Others Borrowed
71%
16% 9%
5%
Figure 40-Sources of food consumed in seven days
Baseline Food Survey: Central Mindanao | April 2013
39
In terms of number of meals consumed by the different household members, children on average ate two
meals (1.98) , whereas other members of the household had nearly 3 meals (2.74) in a day.
Coping Mechnisms Households use different coping mechanisms during shortages of food or cash to buy food. Various coping
strategies adopted include, use less cheaper and less preferable food comodities almost every day (42 per
cent), borrow money or rely on friends support once in a while (51 per cent ), limit proportions of meals
(43 per cent), restrict adults’ consumption in favour of children (35 per cent ), once in a while also reduce
number of meals in a day (32 per cent ) and once in a while also skip a day without meal (17 per cent ).
71%
24%
4% 1%
Figure 41-Level of food stock
No food stock
< 1 month
1-2 months
> 3 months
1.92 2.05 2.06 2.04
1.63
1.98
2.93
2.43
2.75 2.96 2.92
2.74
0.0
0.5
1.0
1.5
2.0
2.5
3.0
3.5
Lanao del Norte Lanao del Sur Maguindanao North Cotabato Sultan Kudarat All
Figure 42-Number of meals usually taken per day
Children Other HH Members

Baseline Food Survey: Central Mindanao | April 2013
40
0%
10%
20%
30%
40%
50%
60%
70%
80%
90%
100%
Rely on lesspreferred andless expensive
foods
Borrow foodor rely on helpfrom friend or
relative
Limit portionsizes at
mealtimes
Restrictconsumptionby adults in
order forsmall children
Reducenumber of
meals eaten in1 day
Skip dayswithout meals
24%
51% 43%
35% 32%
17%
Figure 43-Coping mechanisms used in the past month
Daily Once in a while (1-2 times/week) Pretty often (3-6 days/week)

Baseline Food Survey: Central Mindanao | April 2013
41
Disasters and shocks faced by households
Respondents were asked about the main problems or disasters that they have faced in the past year prior
to the date of survey. Effects of the disasters on household income and asset is described by the
respondents themselves. When there is a disaster or shock its effects are obvious on the income or asset
reduction (e.g. livestock, cash savings) as depicted in the charts. Major disasters/shocks reported are
floods, loss/lack of employment, high food prices or food shortage and human disease or death.
Table 8 Experiences of disasters and their effects
Did the disaster cause a decrease in your household’s ability to produce or purchase enough food to eat for a period of time?
Response Lanao del Norte
Lanao del Sur
Maguindanao North Cotabato
Sultan Kudarat
Total
Yes 96% 96% 99% 99% 96% 97%
Don't know 4% 4% 1% 1% 4% 3%
Total 11% 37% 26% 13% 13% 100%
Has the household recovered from the decrease in income or assets or both from the disasters?
Not recovered at all 24% 41% 57% 12% 11% 35%
Partially recovered 57% 47% 39% 67% 68% 51%
Completely recovered
18% 12% 4% 20% 22% 13%
Total 11% 37% 26% 13% 13% 100%
5%
Flood/ landslide, etc.
24%
17% 18%
10%
12%
Human disease/ death
14%
Figure 44-Major disasters in last one year
Crop Pest
Flood/landslide, etc.
High prices/food shortage
Loss/lack employment
No disaster
Other
Human disease/death
48%
17%
31%
4%
Figure 45-Decrease or loss of income or asset caused by disaster
Income and in-kind receipts
Assets
Both income and assets
No change

Baseline Food Survey: Central Mindanao | April 2013
42
Assistance and Needs
About 37 per cent of the households in the surveyed areas were assisted with food in the past year. The
type of assitance is shown below.
The following questions were posed to the households: ‘if you were to be given assistance, what mode do
you prefer?’ and ‘why did you choose this mode of assistance?’. Majority of the households chose cash to
be the best modality of assistance (51 per cent ), followed by combination of food and cash (29 per cent),
and food alone (20 per cent ).
0%
10%
20%
30%
40%
50%
60%
70%
80%
90%
100%
No Yes GFD Schoolfeeding
Food forAssets
Sup.feeding
Others
Were you assited? If yes, Assitance Type
63%
37% 41%
28%
16% 13%
3%
Figure 46-Proportion of households assisted in the last 12 months by
type of food assistance
0%10%20%30%40%50%60%70%80%90%
100%
No Yes Money
allowances
Medical
services
Others
(cash for
work, 4 Ps,
etc.)
Education Agricultural
assistance
Was there other additional
assistance
If Yes, Assitance Type
73%
27% 38%
27% 17% 16%
2%
Figure 47-Proportion of households who received other type of external
assistance beside food assistance in the last 12 months by type of assistance

Baseline Food Survey: Central Mindanao | April 2013
43
Households were asked if they were given cash assistance, what will be the first thing they will do with it.
Households indicated that they would make some investments to improve their livelihoods. This was
attested by 65 per cent of the respondents, while 18 per cent will buy food to feed their families, 11 per
cent will improve their shelter, 11 per cent will use it to cover expenses in education or health and four per
cent will use it for debt repayment. Please note that, in contrast, the current expenditure pattern indicates
that the two most predominent expenses as reported by the households are food and debt repayment.
51%
20%
29%
Figure 48-Preferred modes of assistance
Cash Food Cash and food
35%
48%
5% 6% 6%
Figure 49- Reason for preferred modes of assistance
Food
Imprv. Livelihood
Debt repayment
Shelter/education/medical
Other
18%
Improve Livelihood 65%
4% 11%
2%
Figure 50- Intented cash use when it is the mode of assistance
Food
Imprv. Livelihood
Debt repayment
Shelter/education/medical
Other

Baseline Food Survey: Central Mindanao | April 2013
44
Households were also asked on their experience on remittance practice. The procedure of sending or
receiving money was also inquired if it was ardous. About 33 per cent have had the experience and the
process of sending receiving money was easy to 32 per cent but not for 69 percent.
0%
20%
40%
60%
80%
100%
No Yes No Yes
Ever try sending receiving money If Yes,is the process ofsending receiving easy
68%
32%
69%
31%
Figure 51-Experience with remittance companies (sending or receiving
money)

Baseline Food Survey: Central Mindanao | April 2013
45
Household priorities Households were asked to indicate their priorities. Based on expressed preferences, three priorities stood
out as presented in the chart below. Food takes the lead (39 per cent) and this is as high as 48 per cent in
Lanao Del Norte, followed by cash (36 per cent ).
0%
10%
20%
30%
40%
50%
60%
70%
80%
90%
100%
Lanao del Norte Lanao del Sur Maguindanao North Cotabato Sultan Kudarat Total
48%
38% 38% 43%
31%
39%
Figure 52 - Priority needs of households
Food Cash Housing materials/shelter

Baseline Food Survey: Central Mindanao | April 2013
46
Awareness of ‘Framework Agreement’ on the Bangsamoro
A question was posed to the households whether they are aware of the Framework Agreement on the
Bangsamoro, and if they are aware how they understand it. In response, 57 per cent indicated that they
are not aware of it. Of those who are aware (43 per cent ), different understandings were summarised as
follows.
0%
10%
20%
30%
40%
50%
60%
70%
80%
90%
100%
No Yes ReplacingARMM
Separatefrom
central
Undercentralwith
autonomy
Territorywiderthan
ARMM
Others
Aware of FAB What about FAB-B-Gov
57%
43%
15%
39%
8% 4%
35%
Figure 53-Awareness of the Framework Agreement on the
Bangsamoro

Baseline Food Survey: Central Mindanao | April 2013
47
Appendix1
Findings of Community Assessment
Methodology
As indicated, in addition to the household interview, community level data was also collected by this
survey. The community survey was designed to collect community level information in the sample areas.
The information was also collected from the sample communities that were selected for household
interview. The data were gathered using key informant interviews (KIIs). The interviews were conducted
by team supervisors at the barangay level. In all, 109 KIIs were carried out.
Demographic information
Information summarised from the community assessment indicated that there are persons that need
special attention. These included persons with severe disability, mental illness, severe distress without
any family member and support, grandparent-headed households, households headed by chronically ill
persons as well as female-headed households, adolescent children-headed households, young and
pregnant women, children and adults with disabilities who cannot leave their houses without assistance
Persons who might need special attention, i.e. vulnerable individuals (total within the assessed
communities) is presented as follows
Table 9 persons with special needs (sum in assessed barangays)
Province Lanao del Norte
Lanao del Sur
Maguindanao North Cotabato
Sultan Kudarat
Total
Persons with severe disability without any family member
1 47 99 1 1 149
Persons with mental illness without any family member
1 38 94 1 4 138
Persons with severe distress without any family member
- 10 13 - 1 24
Elderly persons without any family member 8 58 1,391 4 25 1,486
Pregnant women less than16 years of age 12 41 160 47 94 354
Pregnant women 16-19 years of age 41 90 212 187 155 685
Pregnant women over 20 years of age 13 165 499 365 266 1308
Grandparent-headed households 41 195 1,136 516 119 2,007
Chronically ill person headed households 2 25 57 37 73 194
Female-headed households 138 395 1,641 1,162 462 3,798
Adolescent children-headed households - 222 1,227 75 14 1,538
Children and adults with disabilities who cannot leave their houses without
assistance
24 16 408 6 65 519
Persons w other needs 35 1 22 663 33 754
Total persons living in assessed communities (sum from the sample)
30,729 58,120 97,385 43,522 60,961 290,717

Baseline Food Survey: Central Mindanao | April 2013
48
Displacements
Multiple displacements have been reported since as far back as 2000 and even in 2013. Summary to the
question “was your barangay affected by natural disasters” is presented in the following table:
Table 10 Barangay was affected by natural and manmade disasters
Barangay affected by
When was it affected
Did you evacuate (per cent with ‘Yes’ response)
How many persons evacuated (total in sample)
For how long did you evacuate (average months)
Natural Disaster Multiple times between 2000 and 2013
40% 4,827 3.1
Armed Conflict Multiple times between 2000 and 2013
35% 12,971 4.7
Rido Multiple times between 2000 and 2013
13% 762 3.9
Other Multiple times between 2000 and 2013
12% 150 0.1
In addition, when communities were asked the question “is your community currently at risk of
displacement?”, 17 per cent responded affirmatively. Of those at risk, the dominant fear was floods (64 per
cent). Based on the data provided during community assessment, the number of people presently affected
totalled 11,534 persons. In response to another question “have there been new IDP arrivals in the past 6
month”, 15 per cent responded in affirmation. IDPs have also been in their community for an average of 6
months (minimum 1 month and maximum of 60 months).
The major reasons for those who responded regarding arrival of new IDPs to these communities was due
to rido (17per cent), armed conflict (8 per cent), flood/landslide (67 per cent) and others (8 per cent).
28%
8% 64%
Figure 54- Reason for additional displacement when communities were
displaced multiple times
Armed conflict Big waves or strong winds flood
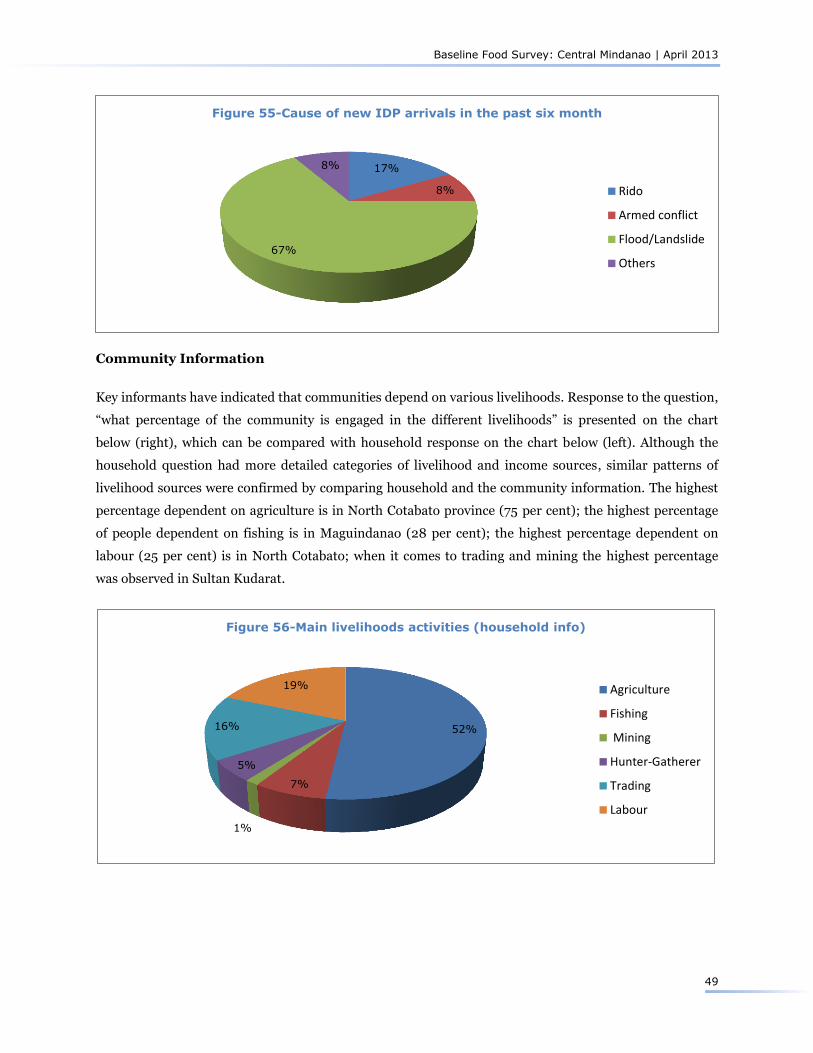
Baseline Food Survey: Central Mindanao | April 2013
49
Community Information
Key informants have indicated that communities depend on various livelihoods. Response to the question,
“what percentage of the community is engaged in the different livelihoods” is presented on the chart
below (right), which can be compared with household response on the chart below (left). Although the
household question had more detailed categories of livelihood and income sources, similar patterns of
livelihood sources were confirmed by comparing household and the community information. The highest
percentage dependent on agriculture is in North Cotabato province (75 per cent); the highest percentage
of people dependent on fishing is in Maguindanao (28 per cent); the highest percentage dependent on
labour (25 per cent) is in North Cotabato; when it comes to trading and mining the highest percentage
was observed in Sultan Kudarat.
17%
8%
67%
8%
Figure 55-Cause of new IDP arrivals in the past six month
Rido
Armed conflict
Flood/Landslide
Others
52%
7%
1%
5%
16%
19%
Figure 56-Main livelihoods activities (household info)
Agriculture
Fishing
Mining
Hunter-Gatherer
Trading
Labour
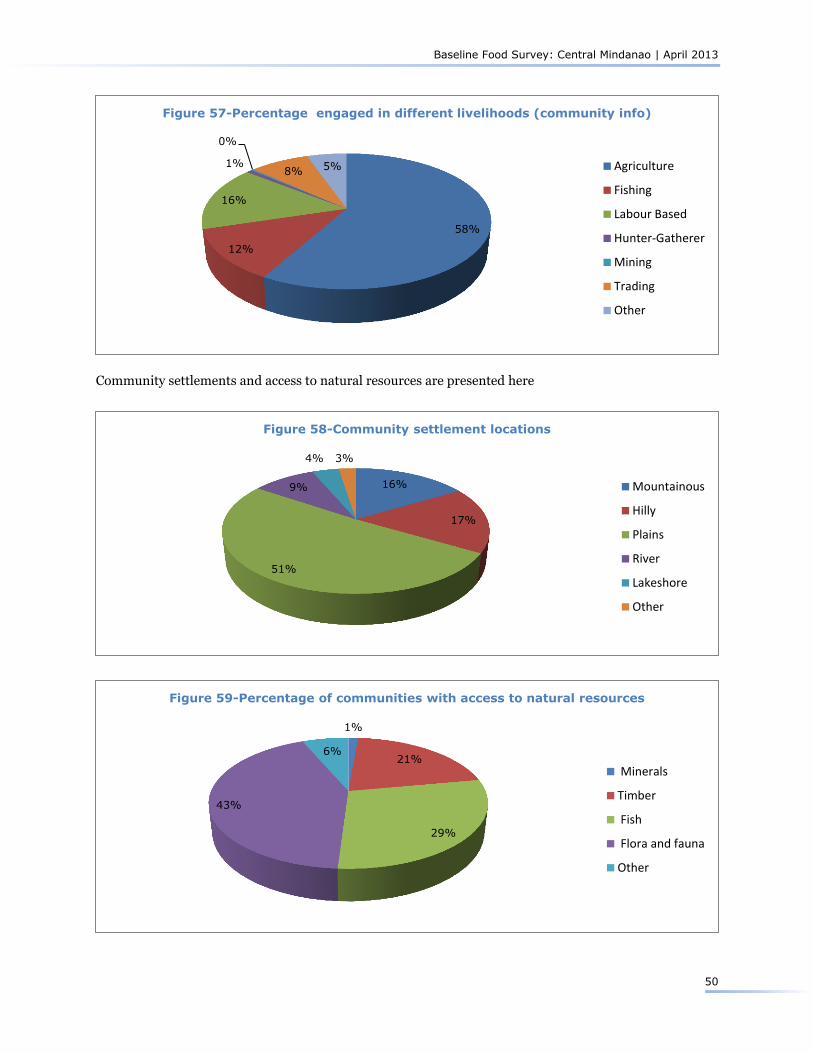
Baseline Food Survey: Central Mindanao | April 2013
50
Community settlements and access to natural resources are presented here
58%
12%
16%
1%
0%
8% 5%
Figure 57-Percentage engaged in different livelihoods (community info)
Agriculture
Fishing
Labour Based
Hunter-Gatherer
Mining
Trading
Other
16%
17%
51%
9%
4% 3%
Figure 58-Community settlement locations
Mountainous
Hilly
Plains
River
Lakeshore
Other
1%
21%
29%
43%
6%
Figure 59-Percentage of communities with access to natural resources
Minerals
Timber
Fish
Flora and fauna
Other

Baseline Food Survey: Central Mindanao | April 2013
51
Communities use different production systems
When asked ‘what is the state of availability and adequacy of the following community resources and
facilities?’, the communities stressed on inadequate resources, especially when they have to share existing
community facilities and resources with visitors, displaced - as shown below.
28%
15%
6%
13% 11%
17%
10%
Figure 60-Agriculture production systems
Rainfed agriculture
Irrigated agriculture
Surplus production
Deficit production
Hand traction
22%
16%
35%
5%
11% 5% 6%
Figure 61- Fish production systems
Sea
Lake
River
Pond
Offshore
0%
10%
20%
30%
40%
50%
60%
70%
80%
90%
100%
Cookin
g fuel
Education
Food
Health fac
Land for
farm
ing
Shelter
Toilet
fac
Wate
r sourc
es
Cookin
g fuel
Education
Food
Health fac
Land for
farm
ing
Shelter
Toilet
fac
Wate
r sourc
es
Before After
10%
20%
31% 37%
16% 24%
38%
18%
37%
17%
59%
32%
43%
53%
39% 42%
Figure 62-Availability and adequacy of community resources and
facilities after arrival of IDPs
Community resources and facilities not adequate

Baseline Food Survey: Central Mindanao | April 2013
52
Vulnerability to Food Insecurity and Poverty
The community identified the members in four wealth categories, namely very poor, poor, slightly better
off and better off or OK. Accordingly, the data indicated that majority of the households are categorised as
poor or very poor (78 per cent).
Per cent of community without enough food most of the year are presented in the following chart
0% 20% 40% 60% 80% 100%
Lanao del Norte
Lanao del Sur
Maguindanao
North Cotabato
Sultan Kudarat
Total
45%
36%
32%
37%
35%
Figure 63-Wealth groups
Very Poor Poor Slightly Better Off Better Off or OK
0%
10%
20%
30%
40%
50%
60%
70%
80%
90%
100%
Lanao d
el N
ort
e
Lanao d
el Sur
Maguin
danao
Nort
h C
ota
bato
Sultan K
udara
t
All P
rovin
ces
Lanao d
el N
ort
e
Lanao d
el Sur
Maguin
danao
Nort
h C
ota
bato
Sultan K
udara
t
% within provinces % between provinces
0%
69%
28%
8%
65%
42%
0%
60%
18%
4%
19%
Figure 64-Per cent of communities without enough food most of the
year

Baseline Food Survey: Central Mindanao | April 2013
53
Food availability (Types, quantities, sources and quality of food commodities)
Food available for consumption, its sources, quality and prices as compared to normal was collected.
Accordingly, rice and some major food items are available or readily available in most of the communities.
There were not a lot of complaints about the quality of the food items. However, prices of rice, corn,
beans, fish and meats have reportedly increased in 79 per cent of the communities. Food items consumed
by households in the sample communities were dominantly obtained from market followed by own
production; for rice 85 per cent from market and 14 per cent from own production. The table below shows
selected food commodities.
Access to market to some 20 per cent of communities was rated as bad or difficult. This could be because
of roads blocked due to landslides; road deterioration, washed away bridges and flooding, or even
distance to the nearest market. Without further probing, it is difficult to know why market access is rated
bad by one fifth of the communities.
Table 11 Main types of food available that are consumed, sources and quality as compared to normal
Cat Response Rice Corn (milled)
Roots/Tubers Beans Fish Meat (all)
Vegetables
Availability Available/readily available
81% 36% 59% 61% 80% 43% 83%
Occasionally available 14% 24% 28% 26% 7% 15% 10%
Very rare/rare/not available
6% 37% 14% 12% 13% 40% 6%
NR 0% 4% 0% 2% 0% 2% 0%
Prices Decreased 1% 2% 4% 2% 2% 2% 2%
Stable 20% 39% 55% 30% 21% 20% 50%
Increased 79% 51% 38% 64% 77% 77% 44%
NR 0% 7% 4% 4% 0% 1% 5%
Quality Good/fair 96% 90% 96% 94% 95% 96% 98%
Poor 4% 5% 4% 3% 5% 4% 2%
NR 0% 6% 0% 4% 0% 0% 0%
Source Own Production 14% 32% 61% 26% 20% 5% 67%
Market Shops 85% 59% 37% 72% 79% 93% 33%
Relatives/Friends 0% 0% 1% 0% 1% 2% 0%
Relief Food 1% 0% 0% 0% 0% 0% 0%
NR 0% 9% 2% 3% 0% 1% 0%

Baseline Food Survey: Central Mindanao | April 2013
54
Hazards and responses strategies
Natural hazards and disasters are frequent in Central Mindanao. The community ranked hazards based
on their experience from 1 to 10; accordingly, heavy rainfall stood first, followed by armed conflict and
rido and the least is drought hazard. The indicated hazards are also expressed by the frequency of
occurrence. Most frequent with annual occurrence are landslides, rido, livestock disease and strong
winds.
8%
21%
55%
16%
Figure 65-Access to market compared to normal
NR
Bad
Normal
Very good
Figure 66-Hazards affecting access to food and income (rank)

Baseline Food Survey: Central Mindanao | April 2013
55
Seasonal calendar of activities reported by communities
The key informants were asked to indicate the months in which various activities take place in the
community. The frequency of each month’s response is the basis for the following analyses. As depicted in
the charts, rice land preparation reaches its peak in February; planting occurs in March and harvest in
August and with another minor peak also in November. Corn planting reaches its height in April and
March, peak harvest in April-May and July-August. The peak of household’s food purchase is from May-
July, expenditure reaches its peak in June. This time is also difficult time for labourers. The peak of rice
sale is August and September, August for corn, June for livestock and April for coconut. The peak food
crises are reported to occur in February and March.
0%
10%
20%
30%
40%
50%
60%
70%
80%
90%
100%
Landslide Livestockdiseases
Others (hevyrain, brown
out,etc)
Rido Strong winds
68% 62%
75%
39%
66%
Figure 67-Type and frequency of disasters
Twice a year Every year Every two years Every three years
Every five years Every ten+ years Four+ times a year
0
5
10
15
20
25
30
Jan Feb Mar Apr May Jun Jul Aug Sep Oct Nov Dec
Figure 68-Peak rice production calander
Harvest Land Prep Planting

Baseline Food Survey: Central Mindanao | April 2013
56
Community Projects
Questions were posed to the key informants in the community survey to list the community programs that
have taken place in the past. The key informants described the type of projects, number of participants,
0
5
10
15
20
25
30
Jan Feb Mar Apr May Jun Jul Aug Sep Oct Nov Dec
Figure 69-Peak corn production calander
Harvest Land Prep Planting
0
5
10
15
20
25
30
Jan Feb Mar Apr May Jun Jul Aug Sep Oct Nov Dec
Figure 70- Peak sale of crops and livestock
Livestock Rice Corn Coconut
0
10
20
30
40
50
60
70
80
Jan Feb Mar Apr May Jun Jul Aug Sep Oct Nov Dec
Figure 71-Peak calander for some events
Food crisis HH food purchase Access for farm labor Expenditures
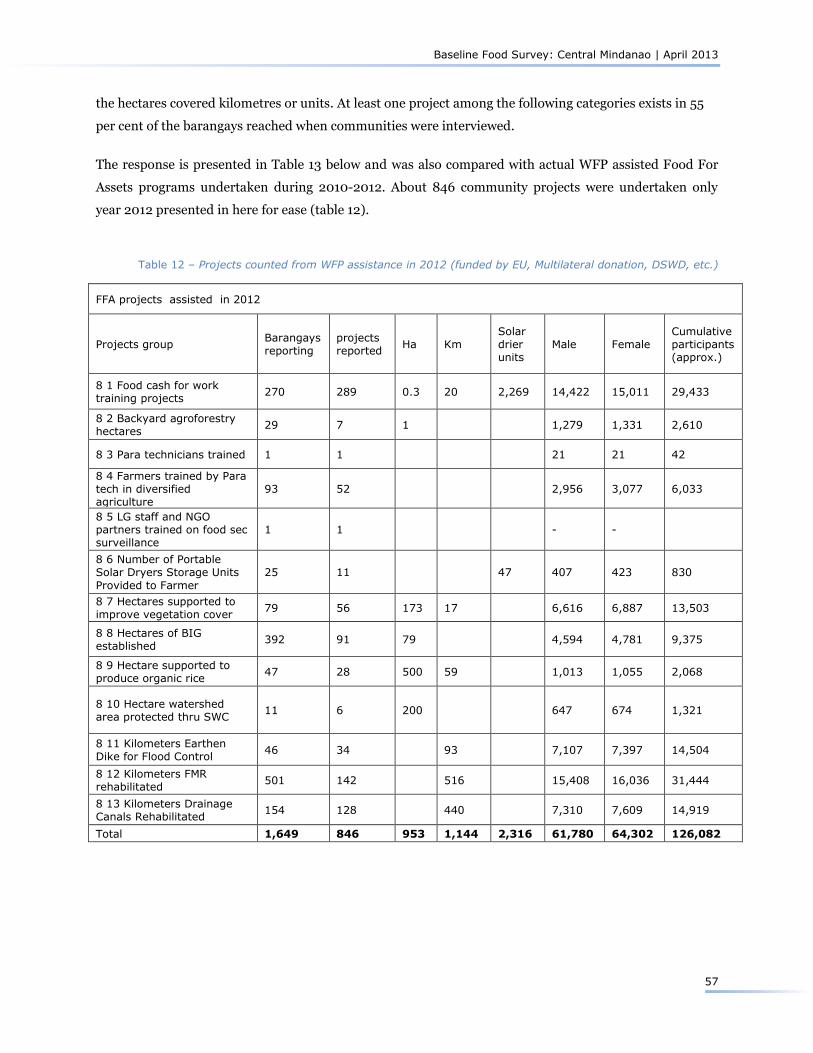
Baseline Food Survey: Central Mindanao | April 2013
57
the hectares covered kilometres or units. At least one project among the following categories exists in 55
per cent of the barangays reached when communities were interviewed.
The response is presented in Table 13 below and was also compared with actual WFP assisted Food For
Assets programs undertaken during 2010-2012. About 846 community projects were undertaken only
year 2012 presented in here for ease (table 12).
Table 12 – Projects counted from WFP assistance in 2012 (funded by EU, Multilateral donation, DSWD, etc.)
FFA projects assisted in 2012
Projects group Barangays reporting
projects reported
Ha Km Solar drier units
Male Female Cumulative participants (approx.)
8 1 Food cash for work training projects
270 289 0.3 20 2,269 14,422 15,011 29,433
8 2 Backyard agroforestry hectares
29 7 1 1,279 1,331 2,610
8 3 Para technicians trained 1 1 21 21 42
8 4 Farmers trained by Para tech in diversified agriculture
93 52 2,956 3,077 6,033
8 5 LG staff and NGO partners trained on food sec surveillance
1 1 - -
8 6 Number of Portable Solar Dryers Storage Units
Provided to Farmer
25 11 47 407 423 830
8 7 Hectares supported to improve vegetation cover
79 56 173 17 6,616 6,887 13,503
8 8 Hectares of BIG established
392 91 79 4,594 4,781 9,375
8 9 Hectare supported to produce organic rice
47 28 500 59 1,013 1,055 2,068
8 10 Hectare watershed area protected thru SWC
11 6 200 647 674 1,321
8 11 Kilometers Earthen Dike for Flood Control
46 34 93 7,107 7,397 14,504
8 12 Kilometers FMR rehabilitated
501 142 516 15,408 16,036 31,444
8 13 Kilometers Drainage Canals Rehabilitated
154 128 440 7,310 7,609 14,919
Total 1,649 846 953 1,144 2,316 61,780 64,302 126,082

Baseline Food Survey: Central Mindanao | April 2013
58
Table 13 Projects reported by the community in the assessed barangays
Project categories Source: sample: - projects reported in the assessed barangays only
No of barangays reporting
No of projects reported
Ha Km Solar drier units
Men Women Participants
8 1 Food cash for work training projects
37 137 9,920 4,292 14,212
8 2 Backyard agroforestry hectares
10 10 104 430 155 585
8 3 Para technicians trained 7 7 60 60
8 4 Farmers trained by Para technician in diversified
agriculture
7 7 128 1 129
8 5 LG staff and NGO partners trained on food sec surveillance
2 2 21 15 36
8 6 Number of Portable Solar Dryers Storage Units Provided to Farmer
4 4 16 25 25 50
8 7 Hectares supported to improve vegetation cover
2 2 44 52 30 82
8 8 Hectares of BIG established
14 14 40 731 2,348 3,079
8 9 Hectare supported to produce organic rice
2 2 43 324 324
8 10 Hectare watershed area protected thru SWC
3 3 34 152 50 202
8 11 Kilometers Earthen Dike for Flood Control
10 10 26 2,075 30 2,105
8 12 Kilometers FMR rehabilitated
22 22 144 4,555 639 5,194
8 13 Kilometers Drainage Canals Rehabilitated
24 24 94 4,984 1,460 6,444
Total 55 244 265 264 16 23,457 9,045 32,502
BIG= Bio Intensive Gardens; SWC= Soil and Water Conservation activities; FMR= Farm to Market Roads