european socio-economic classification validation conference portuguese statistical office lisbon,...
TRANSCRIPT

European Socio-Economic Classification European Socio-Economic Classification Validation ConferenceValidation Conference
Portuguese Statistical Office Portuguese Statistical Office
Lisbon, 19-20 January 2006 Lisbon, 19-20 January 2006
Unemployment risks in four Unemployment risks in four European countries: an attempt European countries: an attempt of testing the construct validityof testing the construct validity
of the ESeC schemeof the ESeC scheme
Antonio Schizzerotto, Roberta Barone & Antonio Schizzerotto, Roberta Barone & Laura ArosioLaura Arosio
University of Milano BicoccaUniversity of Milano BicoccaItalyItaly

Aims of the studyAims of the study• Testing the construct validity of the ESeC
classification, by means of a comparative analysis aimed at detecting the variations across four EU-15 countries in the risks of unemployment experienced by incumbents of occupations belonging to different ESeC classes.
• Checking whether in the case of Italy different versions of Isco88.com- i.e. 2, 3 and 4 digit versions- affect the estimated disparities between ESeC classes in the risk of unemployment

Four EU countriesFour EU countries• Denmark, as a representative of countries
where the State playes an important role in the functioning of the whole society
• Germany and Italy, as representatives of countries where family has a crucial position in the institutional arrangements of the society
• United Kingdom, as a representative of countries that attribute great importance to the market in the workings of the society
Three hypotheses to be Three hypotheses to be testedtested
• ESeC is a valid social scheme• The disparities between ESeC classes in the
risk of unemployment should follow the same general pattern between countries that posses a market economy
• Despite this basic similarity, as a consequence of different institutional arrangements and labour market regulations across countries, one should observe between countries dissimilarities in unemployment risks displayed by each ESeC class.
Data sourcesData sources• Waves from 1994 to 2001 of the
European Community Households Panel (ECHP)
• Waves 1997, 1999 and 2001 of Ilfi (Italian Households Longitudinal Study)
MethodsMethods
• Poisson regression of unemployment incident rates ratios
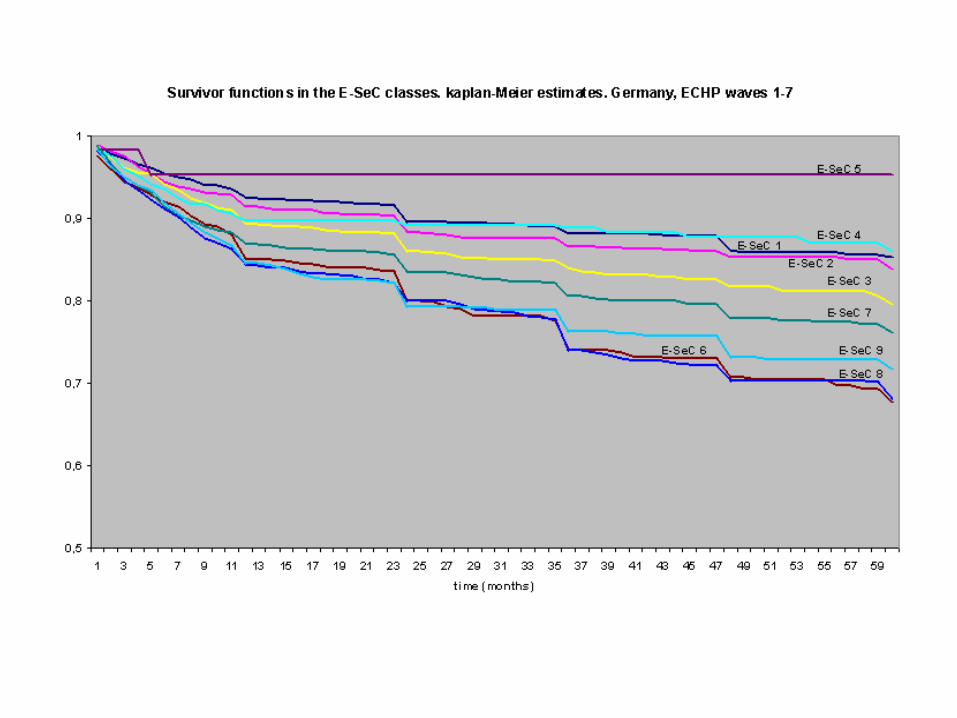
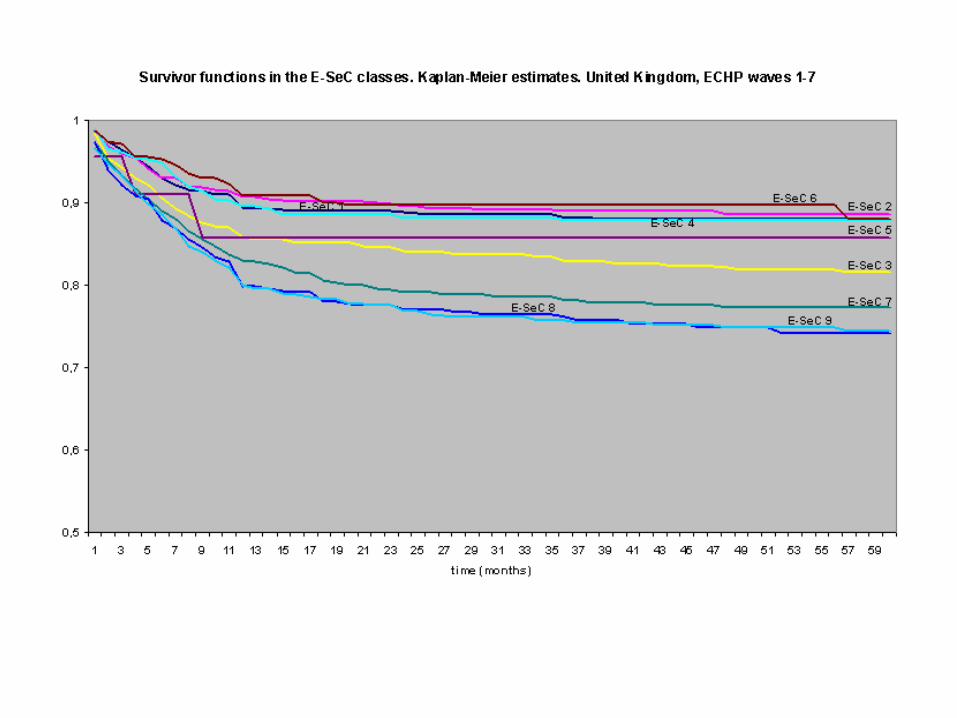
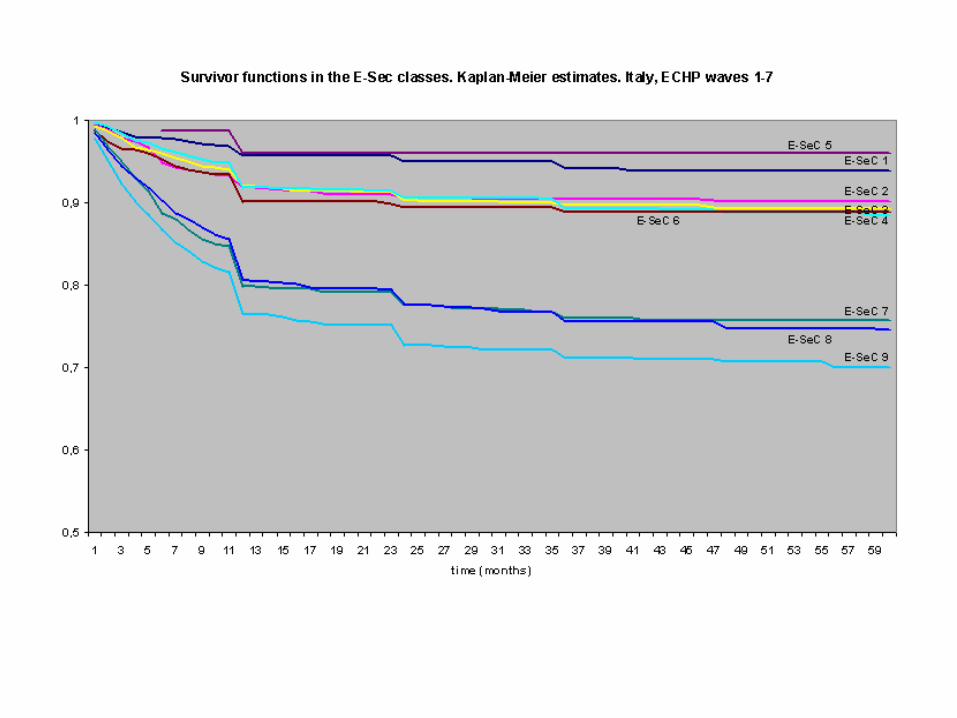
• Survivor functions in employment by ESeC classes

ESeC classes and risks of ESeC classes and risks of unemploymentunemployment
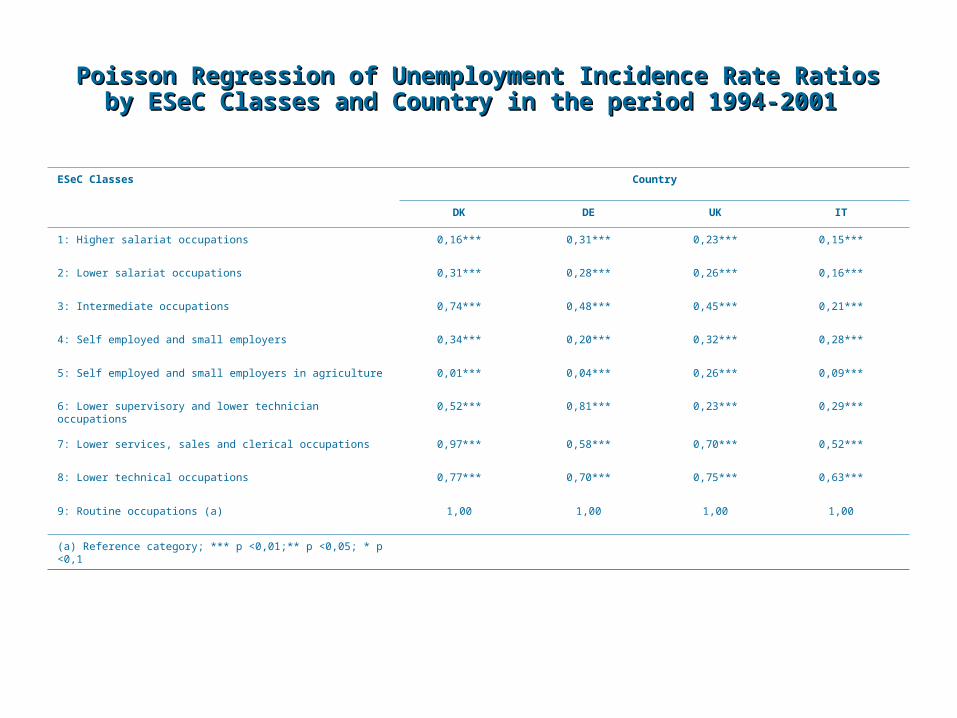
ESeC Classes Country
DK DE UK IT
1: Higher salariat occupations 0,16*** 0,31*** 0,23*** 0,15***
2: Lower salariat occupations 0,31*** 0,28*** 0,26*** 0,16***
3: Intermediate occupations 0,74*** 0,48*** 0,45*** 0,21***
4: Self employed and small employers 0,34*** 0,20*** 0,32*** 0,28***
5: Self employed and small employers in agriculture 0,01*** 0,04*** 0,26*** 0,09***
6: Lower supervisory and lower technician occupations 0,52*** 0,81*** 0,23*** 0,29***
7: Lower services, sales and clerical occupations 0,97*** 0,58*** 0,70*** 0,52***
8: Lower technical occupations 0,77*** 0,70*** 0,75*** 0,63***
9: Routine occupations (a) 1,00 1,00 1,00 1,00
(a) Reference category; *** p <0,01;** p <0,05; * p <0,1
Poisson Regression of Unemployment Incidence Rate Ratios Poisson Regression of Unemployment Incidence Rate Ratios by ESeC Classes and Country in the period 1994-2001 by ESeC Classes and Country in the period 1994-2001
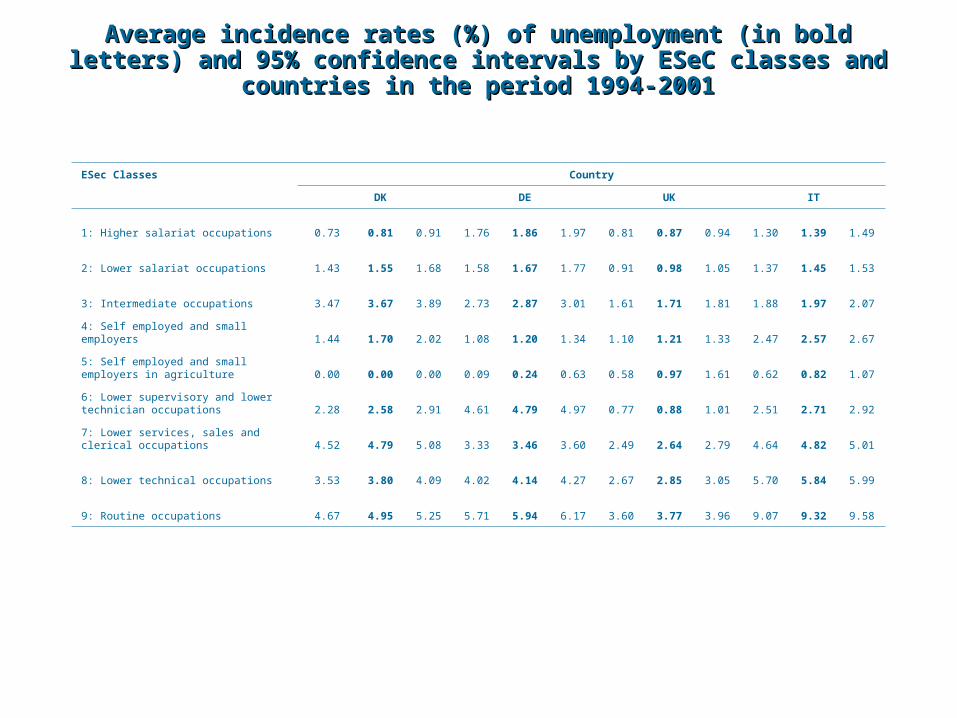
ESec Classes Country
DK DE UK IT
1: Higher salariat occupations 0.73 0.81 0.91 1.76 1.86 1.97 0.81 0.87 0.94 1.30 1.39 1.49
2: Lower salariat occupations 1.43 1.55 1.68 1.58 1.67 1.77 0.91 0.98 1.05 1.37 1.45 1.53
3: Intermediate occupations 3.47 3.67 3.89 2.73 2.87 3.01 1.61 1.71 1.81 1.88 1.97 2.07
4: Self employed and small employers 1.44 1.70 2.02 1.08 1.20 1.34 1.10 1.21 1.33 2.47 2.57 2.67
5: Self employed and small employers in agriculture 0.00 0.00 0.00 0.09 0.24 0.63 0.58 0.97 1.61 0.62 0.82 1.07
6: Lower supervisory and lower technician occupations 2.28 2.58 2.91 4.61 4.79 4.97 0.77 0.88 1.01 2.51 2.71 2.92
7: Lower services, sales and clerical occupations 4.52 4.79 5.08 3.33 3.46 3.60 2.49 2.64 2.79 4.64 4.82 5.01
8: Lower technical occupations 3.53 3.80 4.09 4.02 4.14 4.27 2.67 2.85 3.05 5.70 5.84 5.99
9: Routine occupations 4.67 4.95 5.25 5.71 5.94 6.17 3.60 3.77 3.96 9.07 9.32 9.58
Average incidence rates (%) of unemployment (in bold Average incidence rates (%) of unemployment (in bold letters) and 95% confidence intervals by ESeC classes and letters) and 95% confidence intervals by ESeC classes and
countries in the period 1994-2001countries in the period 1994-2001

Poisson regression of unemployment incidence rate ratios Poisson regression of unemployment incidence rate ratios by ESeC classes and country controlling for gender, age, by ESeC classes and country controlling for gender, age,
level of education and marital status. ECHP waves 1-7level of education and marital status. ECHP waves 1-7
Covariates Country
DK DE UK IT
ESec classes
1: Higher salariat occupations 0.19*** 0,40*** 0.30*** 0.26***
2: Lower salariat occupations 0.31*** 0,33*** 0.32*** 0.25***
3: Intermediate occupations 0.66*** 0,54*** 0.53*** 0.28***
4: Self employed and small employers 0.40*** 0,24*** 0.39*** 0.36***
5: Self employed and small employers in agriculture 0.10*** 0,04*** 0.30*** 0.13***
6: Lower supervisory and lower technician occupations 0.57*** 1,00 0.24*** 0.34***
7: Lower services. sales and clerical occupations 0.82*** 0,66*** 0.77*** 0.54***
8: Lower technical occupations 0.92 0,91*** 0.68*** 0.58***
9: Routine occupations (a) 1.00 1,00 1.00 1.00
Gender
Men 0.58*** 0,74*** 1.46*** 0.88***
Women (a) 1.00 1,00 1.00 1.00
Age 0.99* 0,95*** 0.93*** 0.93***
Age squared 1.00* 1,00*** 1.00*** 1.00***
Education
Tertiary 0.90** 0,82*** 0.81*** 0.50***
Higher secondary 0.87*** 0,90*** 0.85*** 0.71***
Below higher secondary (a) 1.00 1,00 1.00 1.00
Civil status
Married 0.69*** 0,77*** 0.53*** 0.61***
Separated or divorced 0.88** 1,05 0.94** 0.50***
Unmarried (a) 1.00 1,00 1.00 1.00
Pseudo R squared 0.0735 0.0589 0.0855 0.1328
(a) Reference category
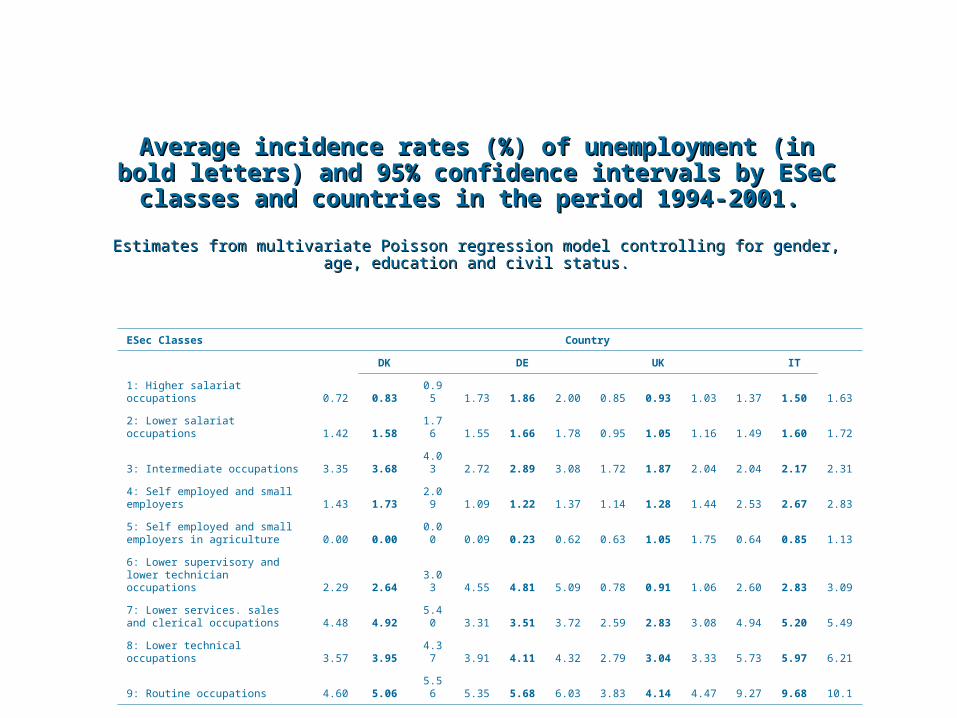
Average incidence rates (%) of unemployment (in Average incidence rates (%) of unemployment (in bold letters) and 95% confidence intervals by ESeC bold letters) and 95% confidence intervals by ESeC
classes and countries in the period 1994-2001. classes and countries in the period 1994-2001.
Estimates from multivariate Poisson regression model controlling for gender, age, Estimates from multivariate Poisson regression model controlling for gender, age, education and civil status.education and civil status.
ESec Classes Country
DK DE UK IT
1: Higher salariat occupations 0.72 0.83 0.95 1.73 1.86 2.00 0.85 0.93 1.03 1.37 1.50 1.63
2: Lower salariat occupations 1.42 1.58 1.76 1.55 1.66 1.78 0.95 1.05 1.16 1.49 1.60 1.72
3: Intermediate occupations 3.35 3.68 4.03 2.72 2.89 3.08 1.72 1.87 2.04 2.04 2.17 2.31
4: Self employed and small employers 1.43 1.73 2.09 1.09 1.22 1.37 1.14 1.28 1.44 2.53 2.67 2.83
5: Self employed and small employers in agriculture 0.00 0.00 0.00 0.09 0.23 0.62 0.63 1.05 1.75 0.64 0.85 1.13
6: Lower supervisory and lower technician occupations 2.29 2.64 3.03 4.55 4.81 5.09 0.78 0.91 1.06 2.60 2.83 3.09
7: Lower services. sales and clerical occupations 4.48 4.92 5.40 3.31 3.51 3.72 2.59 2.83 3.08 4.94 5.20 5.49
8: Lower technical occupations 3.57 3.95 4.37 3.91 4.11 4.32 2.79 3.04 3.33 5.73 5.97 6.21
9: Routine occupations 4.60 5.06 5.56 5.35 5.68 6.03 3.83 4.14 4.47 9.27 9.68 10.1

ESeC classes and the ESeC classes and the duration of employment duration of employment
episodesepisodes
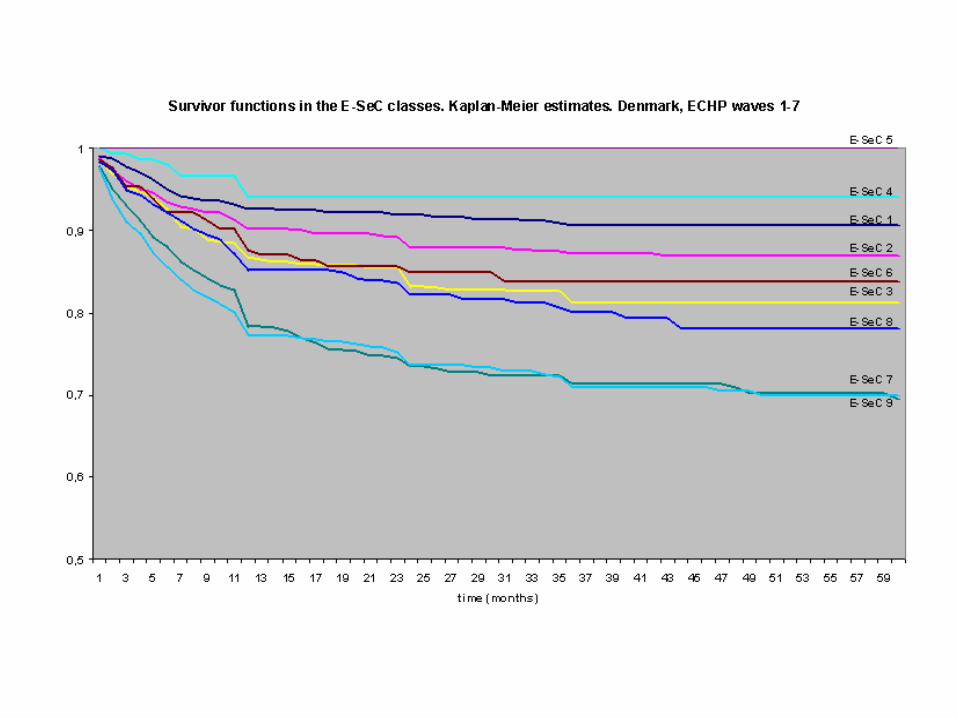
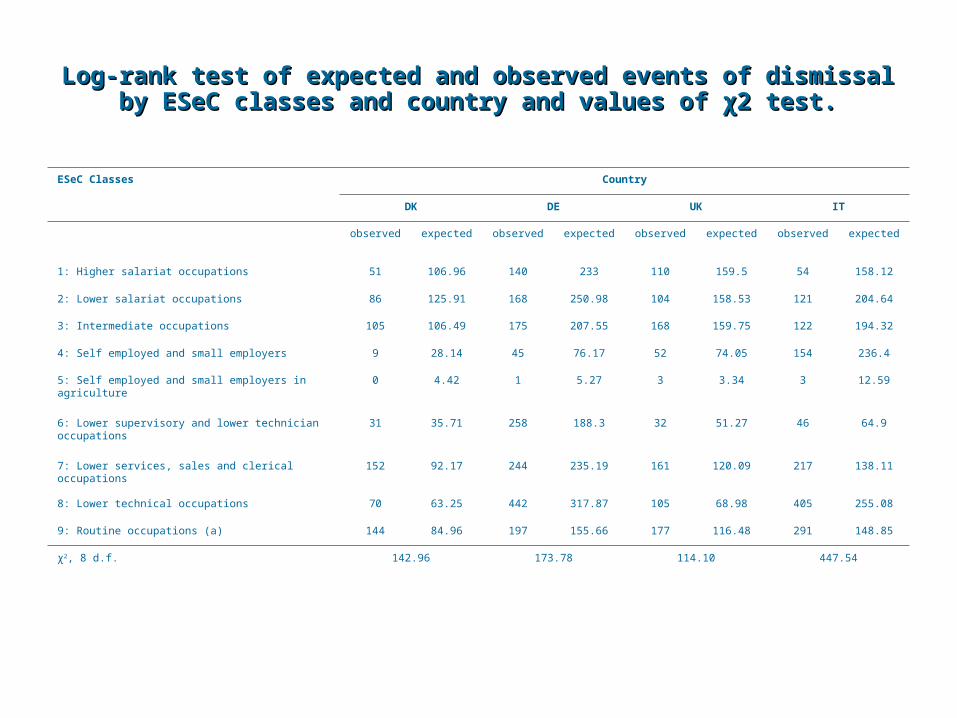
Log-rank test of expected and observed events of dismissal Log-rank test of expected and observed events of dismissal by ESeC classes and country and values of χ2 test.by ESeC classes and country and values of χ2 test.
ESeC Classes Country
DK DE UK IT
observed expected observed expected observed expected observed expected
1: Higher salariat occupations 51 106.96 140 233 110 159.5 54 158.12
2: Lower salariat occupations 86 125.91 168 250.98 104 158.53 121 204.64
3: Intermediate occupations 105 106.49 175 207.55 168 159.75 122 194.32
4: Self employed and small employers 9 28.14 45 76.17 52 74.05 154 236.4
5: Self employed and small employers in agriculture
0 4.42 1 5.27 3 3.34 3 12.59
6: Lower supervisory and lower technician occupations
31 35.71 258 188.3 32 51.27 46 64.9
7: Lower services, sales and clerical occupations 152 92.17 244 235.19 161 120.09 217 138.11
8: Lower technical occupations 70 63.25 442 317.87 105 68.98 405 255.08
9: Routine occupations (a) 144 84.96 197 155.66 177 116.48 291 148.85
χ2, 8 d.f. 142.96 173.78 114.10 447.54
The validity of ESeC The validity of ESeC class scheme and Isco 88 class scheme and Isco 88 com versions according com versions according
to Ilfi datato Ilfi data
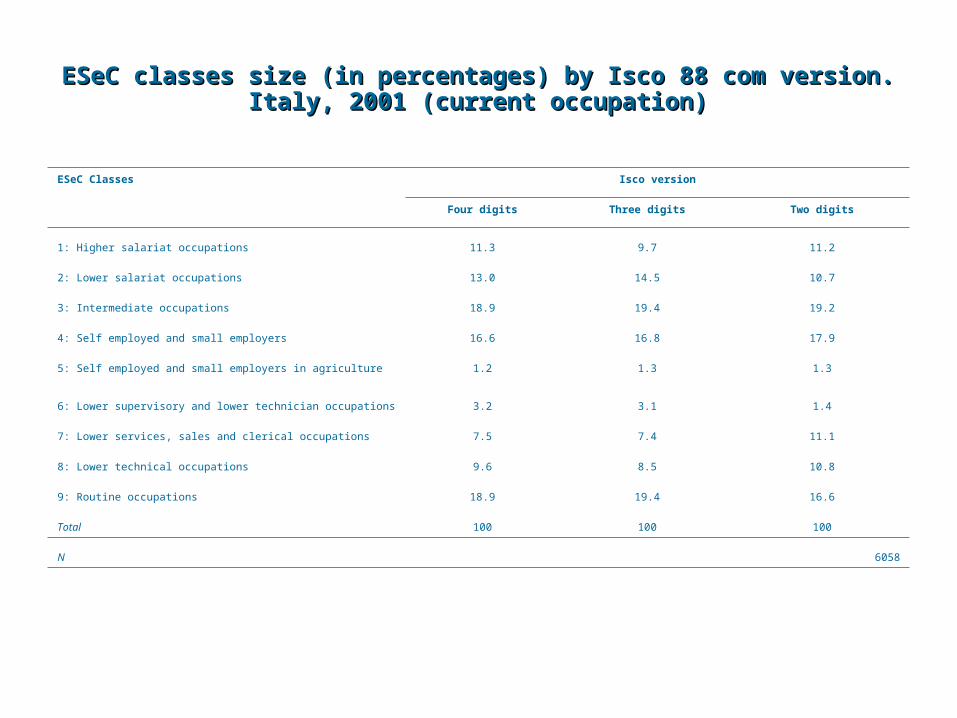
ESeC classes size (in percentages) by Isco 88 com version. ESeC classes size (in percentages) by Isco 88 com version. Italy, 2001 (current occupation)Italy, 2001 (current occupation)
ESeC Classes Isco version
Four digits Three digits Two digits
1: Higher salariat occupations 11.3 9.7 11.2
2: Lower salariat occupations 13.0 14.5 10.7
3: Intermediate occupations 18.9 19.4 19.2
4: Self employed and small employers 16.6 16.8 17.9
5: Self employed and small employers in agriculture 1.2 1.3 1.3
6: Lower supervisory and lower technician occupations 3.2 3.1 1.4
7: Lower services, sales and clerical occupations 7.5 7.4 11.1
8: Lower technical occupations 9.6 8.5 10.8
9: Routine occupations 18.9 19.4 16.6
Total 100 100 100
N 6058
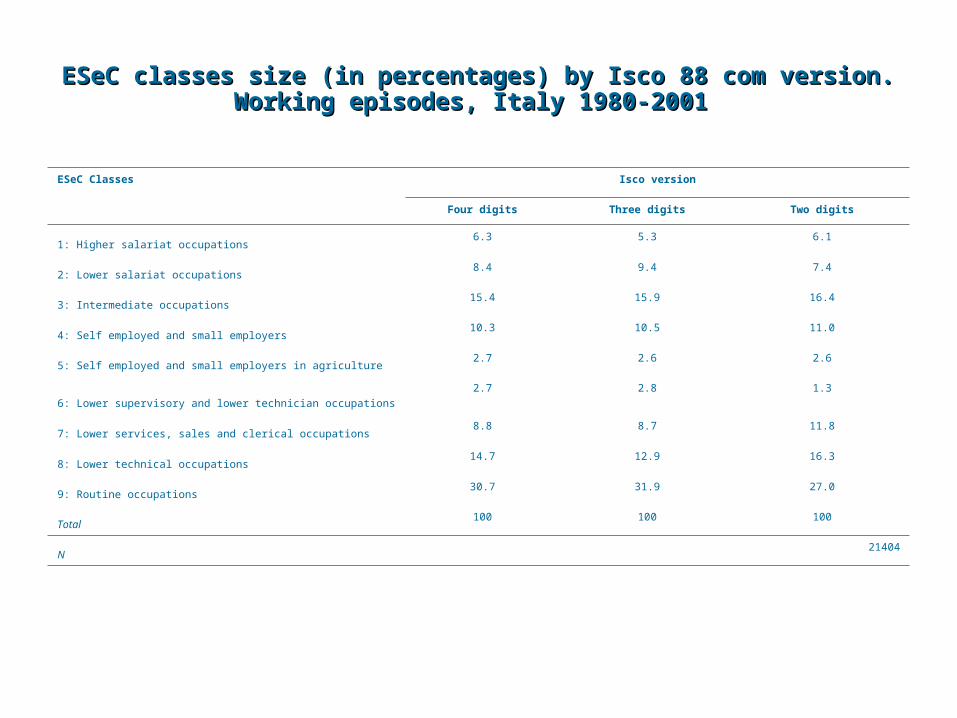
ESeC classes size (in percentages) by Isco 88 com version. ESeC classes size (in percentages) by Isco 88 com version. Working episodes, Italy 1980-2001 Working episodes, Italy 1980-2001
ESeC Classes Isco version
Four digits Three digits Two digits
1: Higher salariat occupations6.3 5.3 6.1
2: Lower salariat occupations8.4 9.4 7.4
3: Intermediate occupations15.4 15.9 16.4
4: Self employed and small employers10.3 10.5 11.0
5: Self employed and small employers in agriculture2.7 2.6 2.6
6: Lower supervisory and lower technician occupations2.7 2.8 1.3
7: Lower services, sales and clerical occupations8.8 8.7 11.8
8: Lower technical occupations14.7 12.9 16.3
9: Routine occupations30.7 31.9 27.0
Total100 100 100
N21404
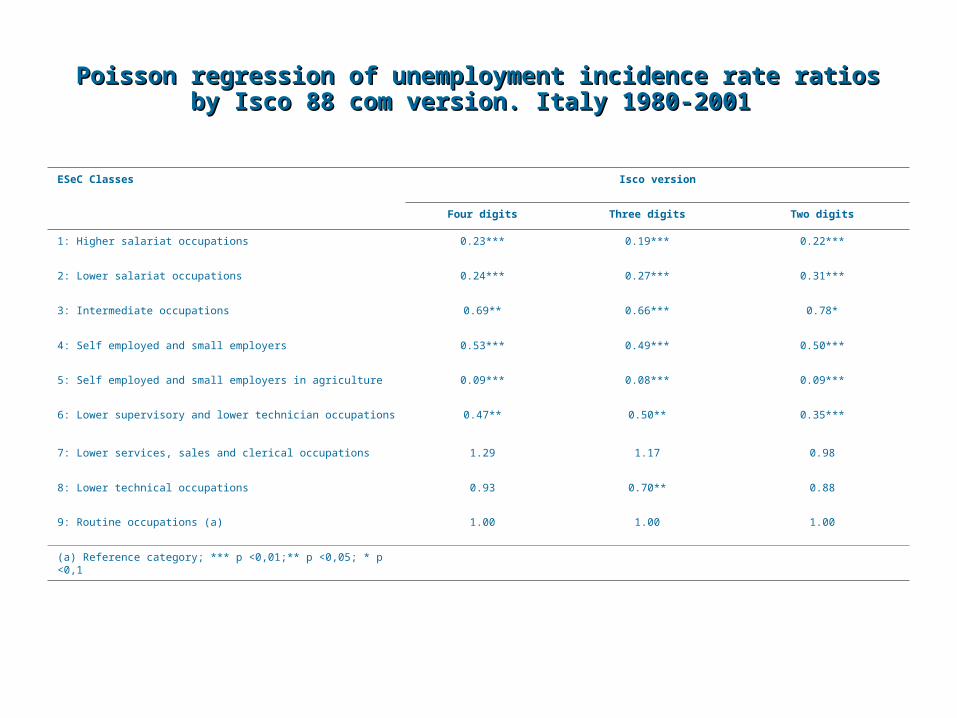
Poisson regression of unemployment incidence rate ratios by Poisson regression of unemployment incidence rate ratios by Isco 88 com version. Italy 1980-2001 Isco 88 com version. Italy 1980-2001
ESeC Classes Isco version
Four digits Three digits Two digits
1: Higher salariat occupations 0.23*** 0.19*** 0.22***
2: Lower salariat occupations 0.24*** 0.27*** 0.31***
3: Intermediate occupations 0.69** 0.66*** 0.78*
4: Self employed and small employers 0.53*** 0.49*** 0.50***
5: Self employed and small employers in agriculture 0.09*** 0.08*** 0.09***
6: Lower supervisory and lower technician occupations 0.47** 0.50** 0.35***
7: Lower services, sales and clerical occupations 1.29 1.17 0.98
8: Lower technical occupations 0.93 0.70** 0.88
9: Routine occupations (a) 1.00 1.00 1.00
(a) Reference category; *** p <0,01;** p <0,05; * p <0,1
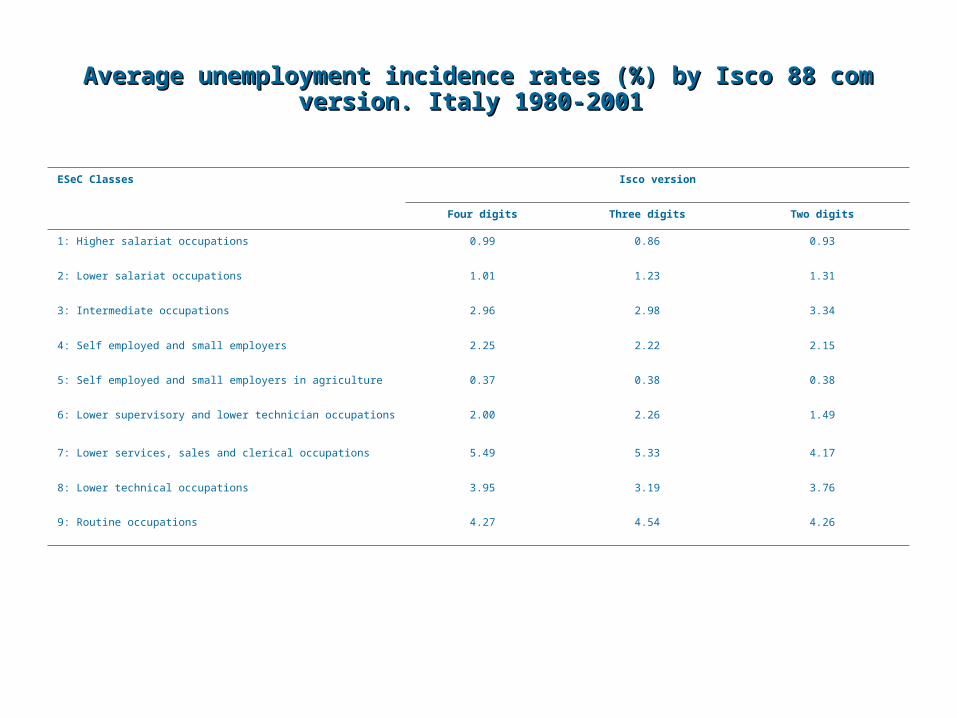
Average unemployment incidence rates (%) by Isco 88 com Average unemployment incidence rates (%) by Isco 88 com version. Italy 1980-2001 version. Italy 1980-2001
ESeC Classes Isco version
Four digits Three digits Two digits
1: Higher salariat occupations 0.99 0.86 0.93
2: Lower salariat occupations 1.01 1.23 1.31
3: Intermediate occupations 2.96 2.98 3.34
4: Self employed and small employers 2.25 2.22 2.15
5: Self employed and small employers in agriculture 0.37 0.38 0.38
6: Lower supervisory and lower technician occupations 2.00 2.26 1.49
7: Lower services, sales and clerical occupations 5.49 5.33 4.17
8: Lower technical occupations 3.95 3.19 3.76
9: Routine occupations 4.27 4.54 4.26
Employment relations and Employment relations and level of social desirability of level of social desirability of
ESeC classes according to ILFI ESeC classes according to ILFI datadata
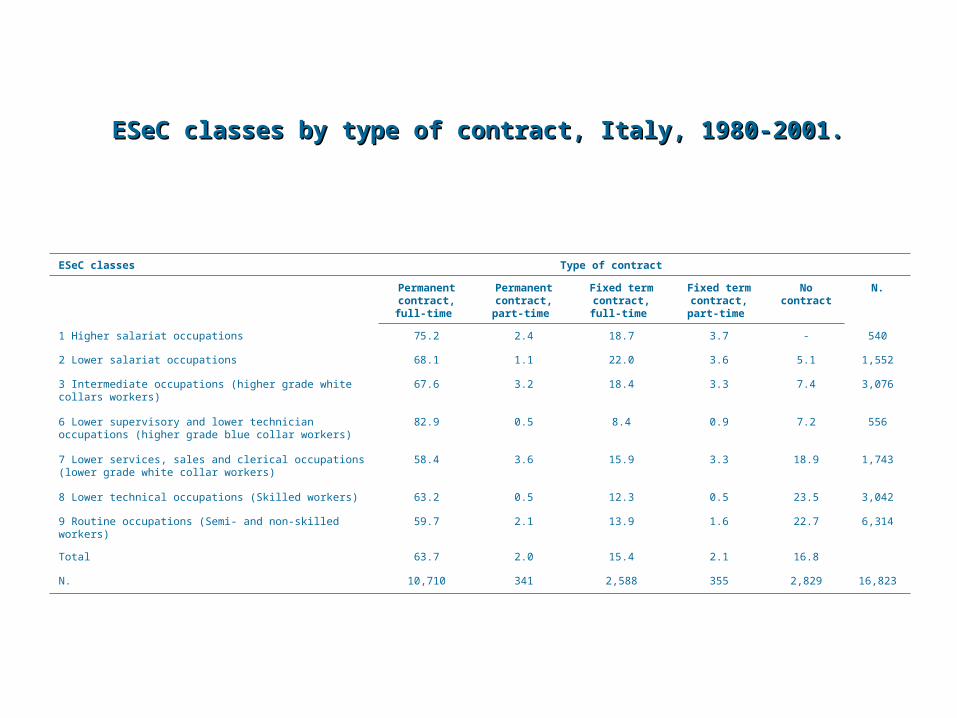
ESeC classes by type of contract, Italy, 1980-2001.ESeC classes by type of contract, Italy, 1980-2001.
ESeC classes Type of contract
Permanent contract, full-time
Permanent contract, part-time
Fixed term contract, full-time
Fixed term contract, part-time
No contract
N.
1 Higher salariat occupations 75.2 2.4 18.7 3.7 - 540
2 Lower salariat occupations 68.1 1.1 22.0 3.6 5.1 1,552
3 Intermediate occupations (higher grade white collars workers)
67.6 3.2 18.4 3.3 7.4 3,076
6 Lower supervisory and lower technician occupations (higher grade blue collar workers)
82.9 0.5 8.4 0.9 7.2 556
7 Lower services, sales and clerical occupations (lower grade white collar workers)
58.4 3.6 15.9 3.3 18.9 1,743
8 Lower technical occupations (Skilled workers) 63.2 0.5 12.3 0.5 23.5 3,042
9 Routine occupations (Semi- and non-skilled workers) 59.7 2.1 13.9 1.6 22.7 6,314
Total 63.7 2.0 15.4 2.1 16.8
N. 10,710 341 2,588 355 2,829 16,823
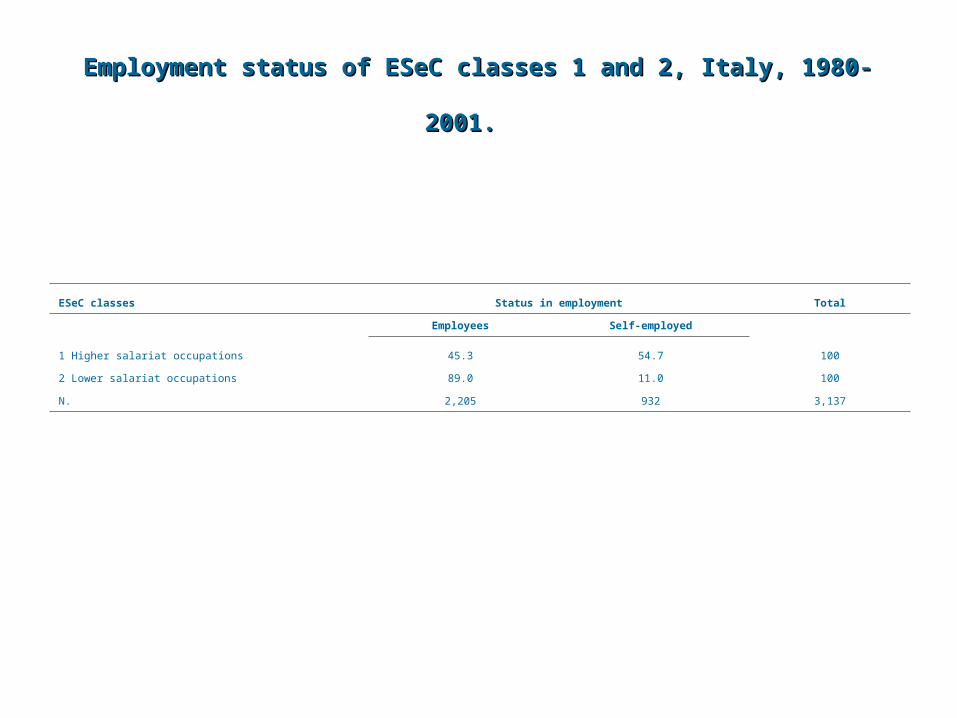
Employment status of ESeC classes 1 and 2, Italy, 1980-2001.Employment status of ESeC classes 1 and 2, Italy, 1980-2001.
ESeC classes Status in employment Total
Employees Self-employed
1 Higher salariat occupations 45.3 54.7 100
2 Lower salariat occupations 89.0 11.0 100
N. 2,205 932 3,137
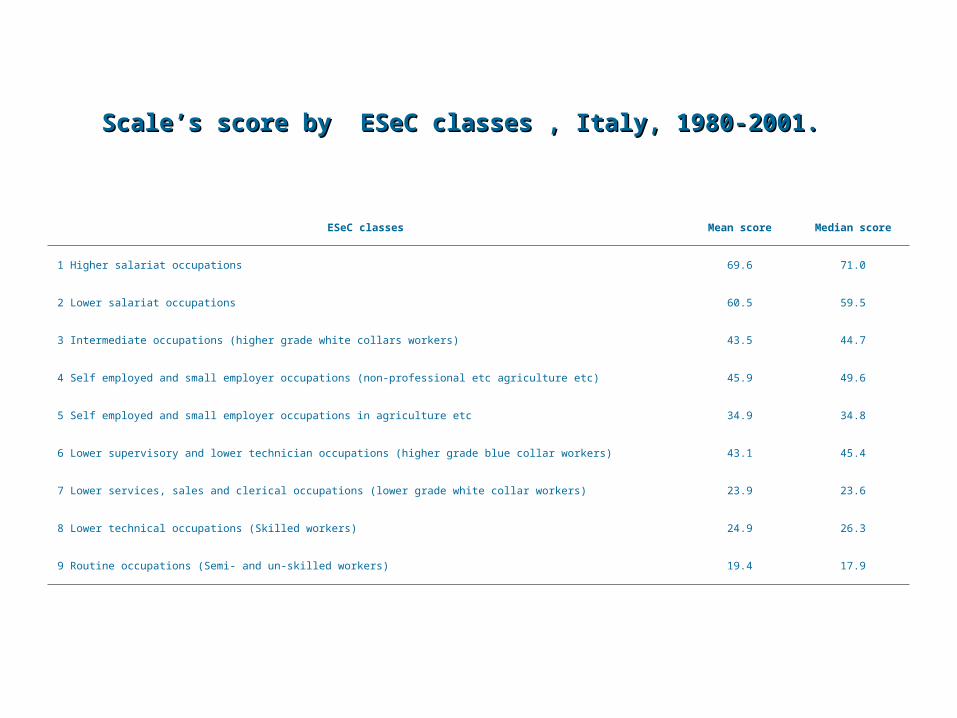
Scale’s score by ESeC classes Scale’s score by ESeC classes , Italy, 1980-2001., Italy, 1980-2001.
ESeC classes Mean score Median score
1 Higher salariat occupations 69.6 71.0
2 Lower salariat occupations 60.5 59.5
3 Intermediate occupations (higher grade white collars workers) 43.5 44.7
4 Self employed and small employer occupations (non-professional etc agriculture etc) 45.9 49.6
5 Self employed and small employer occupations in agriculture etc 34.9 34.8
6 Lower supervisory and lower technician occupations (higher grade blue collar workers) 43.1 45.4
7 Lower services, sales and clerical occupations (lower grade white collar workers) 23.9 23.6
8 Lower technical occupations (Skilled workers) 24.9 26.3
9 Routine occupations (Semi- and un-skilled workers) 19.4 17.9