euro and equity risk premiums - cesfd.org.cn antoniou/has... · 1 has the euro reduced currency and...
TRANSCRIPT

1
Has the Euro reduced Currency and Equity Market Risk Premiums?
Antonios Antoniou*, Olasupo Olusi, Krishna Paudyal
Centre for Empirical Research in Finance, Durham Business School, University of Durham, Mill Hill Lane, Durham DH1 3LB, United Kingdom
Abstract
Exchange rates arrangements aim at suppressing uncertainty attached to currency
fluctuations hence a reduction in systematic risks. This paper analyzes the behaviour of risk
premiums in major equity markets, following the introduction of the euro. Using a multifactor
asset pricing model, we find exchange rate risk premium in the largest eurozone markets
(Germany and France) rose sharply after 1999, unlike in the ‘smaller’ markets (Italy and the
Netherlands). Total equity risk premium declined in the eurozone markets except Germany. It
appears the euro encouraged systematic risk reduction in the smaller eurozone markets at the
expense of their larger partners. This challenges an important rationale for the euro.
JEL Classification: E44, F31, G12
Keywords: Equity Market Premium, Asset Pricing, the APT, Exchange rates risk.
* Corresponding author. Tel.: +44 191 334 5290; Fax; +44 191 334 5201
E-mail address: [email protected]
2
1. Introduction
The much-anticipated Economic and Monetary Union (EMU) became a reality
in January 1999, significantly altering the currency landscape of Europe. On the
continent, the EMU project is largely seen as a tool for political integration. Sidelining
political motives, the European Commission (EC) views the EMU as a tool for
fostering economic stability given some member states’ experiences that high levels
of inflation, public deficits, and high long-term interest rates distort business decisions
and expectations, deter investment thereby slowing down economic growth. A key
feature of the EMU is the euro − the single European currency, which the EC claims
would be beneficial to participating member nations by eliminating the exchange rate
uncertainty faced by firms within the eurozone and the costs of protecting against
foreign exchange risks. From an economic perspective therefore, dividends of the
EMU should be the reduction in systematic (market) risks, and exchange rate risks1 in
particular, amongst others.
The objective of this study is to empirically evaluate the extent to which
participating nations have thus far ‘benefited’ from their EMU membership following
the EC’s claims on its (EMU) economic potential. In particular, given that the EMU
and its single currency are now in place; have both currency risk and equity market
risk premia (hence the equity cost of capital) in Eurozone countries reduced, as
suggested by the EC? Analysis of the euro-era behaviour of currency and total equity
market risk premia will enhance literature by shedding more light on the economic
implications of monetary union on member states’ equity markets, enabling
prospective participants to make informed decisions on any potential membership of
the EMU bandwagon.
The pursuit of the objective provides another opportunity to analyse the link
between macroeconomic factors and stock returns,2 focusing on whether or not the
exchange rate is a priced risk factor in equity markets – an issue confronted in a
1 The implications of exchange rate arrangements on currency risks and total equity market risk premia have been empirically assessed in the literature. For instance, evidence in Antoniou et al (1998a) suggest that there was an initial decline in the UK’s currency risk and total equity market risk premia following the entry of the Sterling into the European Monetary Systems Exchange Rate Mechanism (EMS/ERM) in October 1990. 2 The empirical relevance of macroeconomic factors to equity returns is hugely contested in the literature. While some studies (e.g. Chan et al, 1998) suggest that macroeconomic factors make a poor showing, others (e.g. Flannery and Protopapadakis, 2002) provide recent evidence that macroeconomic variables do influence aggregate stock returns.
3
number of studies, with mixed evidence.3 We employ the Arbitrage Pricing Theory
(APT) of Ross (1976) to model equity returns. This allows us to specify and
empirically test whether exchange rate, alongside other key factors of EMU interests
(e.g. inflation, interest rates, and money supply),4 is viewed as a potential source of
systematic risk by equity market participants, and if it is, to also analyse its behaviour
before and after the introduction of the single currency. We focus on the equity
markets of France, Germany, Italy, and the Netherlands – the largest and most
developed stock markets in the EMU, representing about 75 percent of the total EMU
market capitalisation. We also include two non-euro markets: the UK, and the USA.
Given the UK’s membership of the European Union (EU) but not the EMU, analysis
of the euro-era behaviour of UK currency and total equity market risk premiums
should be interesting. Since the newly-created euro is largely expected to challenge
the US dollar’s central role in the world’s foreign exchange markets,5 an investigation
of the behaviour of the dollar currency premium is necessary to facilitate some
comparisons.6
To anticipate some of the results, the exchange rate risk premium is
significantly priced in five of the six equity markets. Recursive estimations reveal that
there is an increase in the exchange rate risk premium in the larger eurozone markets
of France and Germany after the introduction of the euro. However, unlike Germany,
there is a reduction in the equity market premium of France. The exchange rate and
equity market risk premiums in the “smaller” markets – Italy and the Netherlands,
appear to have reduced or stabilized considerably post-euro launch. Results for the
UK show a decline in both exchange rate and equity market risk premiums over the
period. Whilst the US exchange rate risk premium rises post-1999, the equity market
premium is more or less unchanged.
3 For instance, Jorion (1991) finds that exchange rates risk is not priced in US equity markets. Others studies like Vassalou (2000) and Priestley & Ødegaard (2004) suggest that exchange rate risks are priced. 4 The ECB sets euro zone interest rates, manages the euro currency, and provides a definition for price stability (defined as a year-on-year increase in the Harmonised Index of Consumer Prices (HICP) for the euro area of below 2%), thus market expectations on exchange rates, interest rates, money supply, and inflation within the eurozone should be directly affected. 5 See Kenen (2002). 6 Note also that the EC expects the eurozone’s major trading partners to benefit, though to a lesser extent, from the adoption of the euro (See Commission of European Communities, 1992). Transaction costs of dealing in multiple European exchange rates and costs of hedging against unfavourable currency movements should reduce for non-EMU firms.
4
The rest of the chapter is organised as follows. Section 2 briefly analyses the
rationale for the EMU and its common currency. Section 3 illustrates the Arbitrage
Pricing Theory (APT) and estimation technique. Section 4 discusses the
macroeconomic and financial variables used in the study. Section 5 briefly discusses
the data used. Section 6 presents and discusses the empirical results, and Section 6
concludes the paper.
2. EMU and Economic Stability.
The rationale for the single European currency is one of the most rigorously debated
issues in European history. The question remains: is the EMU a political project − in
which case the euro currency is a means to attaining an end of political integration, or
is it an economic project? The Rome Treaty of 1957 called for the ‘ever-closer union
of the people of Europe’. German Chancellor Helmut Kohl, a leading advocate of the
EMU, noted in a speech to the council of Europe in September 1995 that “we want the
political unification of Europe. If there is no monetary union, there cannot be a
political union.....” Wim Duisenberg, pioneer President of the European Central Bank
(ECB) also notes that “the process of monetary union goes hand in hand, must go
hand in hand, with political integration and ultimately political union. EMU is, and
always was meant to be, a stepping stone on the way to a united Europe” (Leach,
1999, p. 34)
Regardless, the EC has tried to justify the EMU and its single currency using,
inter alia, the theory of Optimum Currency Area (OCA) which postulates that subject
to certain economic criteria,7 a currency union would be beneficial to participating
member nations. Thus in essence, the economic objectives of the EMU are: efficiency
and stability.
Given that fluctuation of exchange rates causes uncertainty among companies,
the EC believes that suppression of exchange rate variability will brighten business
climate considerably resulting in about 5 percent rise in the community income due to
impetus in investment brought about by eliminating exchange rate risk.8 Furthermore,
7 Some of these are the criteria proposed in the original optimum currency area literature, such as labour and capital mobility (Mundell, 1961), openness (McKinnon, 1963), and product diversification (Kennen, 1969). Others, more recently emphasized, have to do with the relative magnitude and synchronization of country-specific business cycle shocks (Eichengreen, 1992). 8 See Commission of European Communities (1992).
5
the EC suggests that a single currency also eliminates transaction costs associated
with converting one European currency to another, such that cost savings may vary
from 0.1 to 0.2 percent of GDP in large countries, and 1 percent of GDP for small,
open, and less developed states. Moreover, a single currency may reduce inflation
given price stability and stable interest rates brought about by common monetary
policy. As may be expected, monetary union is not without its costs. There is a loss of
national control over economy arising from the loss of control of three key
macroeconomic tools, namely: monetary policy, exchange rates, and fiscal policy,
thus resulting in limited tools for absorbing country-specific macroeconomic
disturbances. As a result, the effects of domestic shocks on the economies of other
member states may be more prominent under the EMU than under a floating exchange
rate regime.
It is also important to discuss the EMU rationale with respect to the various
interests of the eurozone countries. One of the biggest challenges that confronted
Italian monetary authorities in the 20th century was how to tackle the spiralling
inflation that characterised the economy, badly affecting the value of the Italian Lira
such that by the end of the 1970s, Italians had become used to counting their money in
thousands and millions. Various measures, beginning with Mussolini’s “Battle of the
Lira” which fixed the Lira to the British Pound in the 1920s, restrictive monetary
policy and price controls of the 1960s, and membership of the European Monetary
System (EMS) in the late 1970s, all failed to bring inflation under control. Moreover,
Italy’s political instability (often resulting in a lack of coherent economic policies),
corruption, and mismanagement of public funds9 did not help the situation. With such
a rocky monetary history, it is perhaps unsurprising that Italians were far and away the
most enthusiastic of the eurozone populations for the single currency with 83 percent
in favour.
Klaster and Knot (2002) describes the Dutch economy as “a small open
economy that attaches great value to stable exchange rates” – (p. 509). The Dutch
economy is vulnerable to international economic shocks due to a relatively small
manufacturing sector dependent on imported materials and an economy based on
foreign trade. In line with the quest for exchange rate stability, the Netherlands −
home to the world’s oldest regular stock market, the Amsterdam Stock Exchange,
9 See Miccio (1998).

6
very closely linked the Dutch Guilder to the low-inflation Deutsche Mark – the
currency of its largest trading partner, in the run-up to the single currency.10 In fact,
Berk (2002) observes that since 1983, the Netherlands has formed a de facto monetary
union with Germany.
Eichengreen (1994) observed that since Germany is the largest economy in
Europe, and the least susceptible to inflationary pressures, Germany of all EC states
had the least reason to be attracted to the EMU. “However, its support for the
Maastricht Treaty, according to popular view, is that it offered to trade monetary
union, for which it had little intrinsic desire, for an expanded foreign policy role
within the context of an EC defence policy” – (Eichengreen 1994, p.2). France, the
second largest economy in the EMU, combines modern capitalist methods with
extensive, but declining government control and interaction in key sectors of the
economy. Though France had experiences of high inflation and unemployment rates
over the last two decades, politics may also have significantly influenced its
membership of the EMU. Eichengreen (1994) reiterates that the memory of two
devastating wars between Germany and France plays a non-negligible role in the
desire for monetary union between the two countries.
Thus in general, one may suggest that the motives of the larger countries of
France and Germany for EMU membership may be more political than economic in
nature, whereas the reverse is the case for the smaller countries of Italy and the
Netherlands. Irrespective of motives, it is widely expected that the EMU and its single
currency, would bring economic stability and hence reduce risk premiums in all
participating economies, as mentioned earlier.
3. Methodology.
It has been suggested11 that the strict fiscal discipline associated with the Maastricht
Treaty and the Stability and Growth Pact under the EMU agreement may be
responsible for any reduction in the volatility of euro area stock markets, rather than
the elimination of exchange rate risks. As a result, the APT of Ross (1976), which
allows multiple returns-generating factors (i.e. there are K multiple factors that
10 In fact, the Dutch Guilder was the only currency which maintained its fluctuation bands with the DM when all other EMS currencies widened the band to +/- 15% in August 1993. 11 See, for instance, Morana and Beltrati (2002).
7
represent the systematic risks in the economy), is employed. The APT model should
therefore enable the ‘culprits’ of any change in the equity market risk premium to be
more easily identified.
The APT is depicted in the following relationship:
( ) δ ,t k k t tE= + +R R B u (1)
( ) 0λ ι + B λ , N k kE =R (2)
where Rt is an N vector of security returns, δkt is a k vector of realizations of the
common macroeconomic factors at time t, Bk is an N × K matrix of betas (sensitivities
of returns to the factors), ut is an N vector of residual error terms, E(R) is an N vector
of expected returns, λ0 is the return on the risk free asset, ιN is an N vector of ones and
λk is a k vector of prices of risk.
We treat the APT as a system of non-linear seemingly unrelated regression
(NLSUR) which allows the joint estimation of the risk premium and the factor
sensitivities and impose the crucial cross-equation pricing restriction that the prices of
risk are the same for all assets, i.e. the price of the jth factor, λj, is that same for each
asset.12 Substituting Eq. (2) into Eq. (1) and stacking the equations for the N
securities to give:
( ){ }'0λ λ ι δ ,t N T − = ⊗ ⊗ + + R I B u (3)
where R is an NT × 1 vector of security returns, λ is a K × 1 vector of prices of risk, δ
is a T × K matrix of observations on the K factors, B is an NK × 1 vector of
sensitivities, IN is an N × N identity matrix and ⊗ is the Kronecker product operator.
The NLSUR estimators solve the following minimization problem:
12 See also McElroy and Burmeister (1988). The APT restriction is shown in the comparison of the restricted version:
0λ ( ) ,
t N K K Ktλ δ− ι = + +R B u derived from equations (1) and (2), and an unrestricted linear
factor model: 0λ
t N K KtA δ− ι = + +R B u , where A is a vector of constants. As shown in
McElroy & Burmeister (1988) and Antoniou et al (1998a), the non-linear cross-equation pricing
restriction: A = BK λK can be easily tested by a likelihood ratio-type test.

8
' 1
λ
,m in T,
Λ
− ∑ ⊗ u
B
u I u (4)
where u is derived from equation (1), and 1 ∧
−∑ u is the estimated residual covariance
matrix from estimating equation (3).
4. The factors
The APT does not prespecify the macroeconomic factors that may carry risk premia,
such that there is a possibility of including a wide variety of factors in estimating an
APT model. A number of studies (e.g. Chen et al, 1986) base their choice of factors
on the present value model of share prices which states that any factors that affect
future dividends, which ultimately depend on future cashflows and the discount rate,
will affect stock prices, and will therefore carry a risk premium.
Our candidate factors for risk premia in the equity markets (listed in Table 1)
are largely based on theory and empirical evidence in previous studies summarised
below. Following Priestley (1996), we apply Kalman-filtering technique to
decompose ‘news’ items (unanticipated changes) in the macroeconomic series.13
(Insert Table 1 here)
Chen et al (1986) notes that the term structure of interest rates and default risk
are a direct measure of risk aversion implicit in pricing with the former being a proxy
for the business cycle, and the latter the overall business risk. The effect of these two
factors on equity returns is also documented in Fama and French (1993) and Campbell
(1987). The relationship between inflation and stock returns is well grounded in
economic theory. The Fisher Hypothesis states that nominal asset returns move one-
for-one with expected inflation, such that expected real returns are independent of
expected inflation. Using principal-agent analysis, Jovanovic and Ueda (1998) finds
that unexpected inflation shifts real income from firms (the principals) to workers (the
agents), and thereby lowers stock returns.
Adler & Dumas (1984) suggests that the exposure of stock returns to
unanticipated movements in exchange rates derives from translation exposure, 13 Details of the model used to generate the factors can be found in Appendix A.

9
transaction exposure, and, operating exposure, reflecting the responsiveness of the
price and cost competitiveness of firms to fluctuations in currency values. Bailey et al
(2003) found that commodity prices explain a greater fraction of stock return
behaviour than currency related factors. Moreover, findings in Kia (2003) suggest that
the volatility of the growth of commodity prices is a factor in equity return volatility
in the US and Canadian markets. Retail sales are a major indicator of consumer
spending trends. Rapach (2001) shows that aggregate consumer spending has an
important effect on real stock prices in conformity to the present value equity
valuation model. Strong retail sales are favourable for the stock market, particularly
retail stocks but sluggish retail sales could lead to a bearish stock market. The
discounted cash flow valuation model states that stock prices reflect investors’
expectations about future real economic variables, such as corporate earnings, or its
aggregate proxy – industrial production.14 Jones and Kaul (1996) find evidence that
oil shocks in post-war period lead to changes in aggregate cashflow and stock prices.
Rapach (2001) notes that money supply shocks explain about a third of the variability
in real stock prices at shorter horizons. Conover et al (1999) also suggests that a
restrictive monetary environment serves as bad news as it is generally associated with
higher future interest rates and decreases in the level of economic activity.
Evidence in Patro et al (2002) suggests that currency risks in stock markets of
sixteen OECD countries are affected by imports, exports, and tax revenues. Given our
interests in exchange rate risks, we include information on these three factors in our
APT model to reduce the potential of any ‘spurious’ exchange rate risks. However,
Puffer (1995) finds that exports and imports ‘news’ account for about two percent of
the variation in the stock indexes on the announcement days.15 Large trade deficit
announcement yields expectations of larger trade deficits in future months and thus
financial markets respond significantly to trade announcements since they affect
expectations of future current account deficits through the higher future interest
payments on foreign debt. Geske and Roll (1983) notes that government principal
revenues are personal and corporate taxes, such that when stock prices increase or
decrease in response to anticipated changes in economic conditions, personal and
corporate income moves in the same direction, inducing a similar change in
government tax revenues. Evidence in Flannery and Protopapadakis (2002) suggests
14 See Choi et al (1999). 15 Puffer (1995) notes that this is separate from the variations caused by currency movements.

10
that housing starts and unemployment rates (amongst others) are potential priced
factors in stock markets.
Antoniou et al (1998a) suggests that if there are any factors omitted from those
discussed above, but are priced then their effect should feed through the market
portfolio as proxied by the market index.16 Moreover, Ferson and Harvey (1991) finds
that the risk premium associated with a stock market index captures the largest
component of the predictable variation in stock returns. Our interest in the behaviour
of the equity market risk premium mandates the inclusion of an equation for the
excess return on the market portfolio of the nature:
0 1 1 1,λ (λ δ ) ,Mt t K K K t tR u− − −− = + +B (5)
where RMt is the return on the market portfolio at time t, B is a 1 × K – 1 vector of
sensitivities of the returns on the market to the factors, λ is a K – 1 vector of prices of
risk and δ is a K – 1 vector of observations on the factors at time t. µ is an error term.
However, since we are also interested in the effects of the market portfolio on the
return of individual securities (in which case the return on market portfolio is
exogenous and appears on the right hand side), a non-linear three stage least square
(NL3SLS) technique is used to estimate our APT model, in light of Burmeister and
McElroy (1988),17 rather than NLSUR.18 In this case, the estimators of B and λ are
those that solve:
{ }' 1 ' 1 '
λ
( ) ,m i n,
Z Z Z Z Λ
− − ∑ ⊗ u
B
u u (6)
16 The findings of King et al (1994) that national stock markets are driven by unobserved rather than observed international factors adds weight to the inclusion of the market portfolio as a factor. 17 According to Burmeister and McElroy (1988), the return on market portfolio may be treated as endogenous i.e. on the left-hand side, enabling a generalisation of the APT to allow for unobserved factors which are proxied by individual securities not included in the sample. 18Three-stage least squares requires three steps: first-stage regressions to get predicted values for the endogenous regressors (instrumental variables, which are uncorrelated with the error term, are used as regressors to model the predicted values); a two-stage least-squares step to obtain parameter estimates (using the predicted values of the regressors) and to get residuals to estimate the cross-equation correlation matrix; and the final estimation step, which accounts for cross-equation correlation of the errors. In essence, NL3SLS combines the N2SLS and NLSUR methods to take into account both simultaneous equation bias and cross-equation correlation of the errors. See Gallant (1987) for more details on NL3SLS.

11
where Z is a matrix of instrumental variables. As suggested in Amemiya (1977) and
Antoniou et al (1998a), current and squared values of the exogenous variables are
specified as instrumental variables, and the market return is instrumented using the
fitted and square fitted values from a regression of excess returns on the market
portfolio on the other factors.
5. Data
To estimate the APT model in Italy, France, Germany, the Netherlands, the United
Kingdom, and the United States, we use country-specific monthly data on the
macroeconomic and financial variables described above from January 1980 to
December 2004 (300 observations). Unless otherwise indicated, all macroeconomic
data are collected from Datastream. Unexpected Inflation is πt − Εt-1(πt), where π is
the change in the log of the Consumer Price Index (CPI).19 Change in Expected
Inflation is calculated as Εt(πt+1) − Εt-1(πt), where π is as defined above. The Term
Structure of interest rates is defined as the difference between the yield on Long-term
Government Bonds (10-year maturity) and the Treasury Bill rate. Default Risk is the
difference between the yield on corporate bonds and the yield on long-term (10-years
maturity) government bonds.20 Commodity Prices is the log of market price index of
primary commodities obtained from the International Financial Statistics (IFS).
Exchange Rate is the log of the nominal trade-weighted index (IFS computed) for
each country. Real Industrial Production is the log of the industrial production
deflated by the Producer Price Index (PPI). Real Retail Sales is the log of retail sales
deflated by the CPI. Real Money Supply is the log of M1 deflated by the Consumer
Price Index (CPI). Real Imports and Real Exports are the logs of Imports and Exports
(both denominated in domestic currency) respectively, deflated by the CPI. Real Tax
Revenue data is based on total tax (personal, income, capital gains, etc) collected by
19 For the UK, π is defined as change in the log of the Retail Price Index (RPI) of all-items i.e. RPI in the UK is comparable to CPI elsewhere. 20 For all countries, data on default risk is obtained from the Economist.
12
the central government in each country,21 deflated by the CPI. Data on housing
starts,22 oil prices, and unemployment rates are also included in the model.
The return on datastream-calculated market indices for each of the six
countries is used as return on market portfolio.23 We exclude returns data of
companies in the financial sector. We only select firms with returns data from January
1980 to December 2004.24 Returns data on securities for each country were obtained
as follows: France (56 companies listed on the SBF-250 index), Germany (104
companies listed on the CDAXGEN index), the Netherlands (55 companies listed on
the Amsterdam All-Share Index), the USA (153 companies listed on the S&P 500
index), the UK (141 companies listed on the FTSE All-Share Index), and Italy25 (76
companies listed on the Milan Stock Exchange). The Treasury Bill rate (1-month)26 is
transformed and used to calculate the monthly risk-free rate used in excess returns
computations.
6. Empirical Results.
We estimate the APT model and present the priced factors27 in each equity market,
and also results of tests of the APT cross-equation restrictions i.e. that the price of risk
for the jth factor, λj, is the same for each asset (Table 2).
21 For instance, tax revenue data in the UK is the Central Government consolidated fund: Inland Revenue receipts. A proxy - Government revenue, is used for the US market. Due to data unavailability, we exclude tax or government revenue from the APT systems of Germany, the Netherlands and France. 22 Housing starts data are unavailable for Italy, the Netherlands, and Germany, over the analysis period and are not included in their respective APT systems. 23 The use of Datastream indices allows for market return uniformity across countries in the study. Note that the Datastream market index used here is value-weighted (inclusive of dividend). 24 This raises the issue of survivorship bias which may result in conservative prices of risk (see Antoniou et al, 1998b). However, the solution of forming and rebalancing portfolios is criticised by Clare and Thomas (1994), who finds that the method of constructing portfolios may affect the number and type of priced factors found significant. Moreover, Antoniou et al (1998b) finds evidence of common priced factors (with similar sign and magnitude) in two equal subsets of 138 UK equity returns, thus giving some support to the APT requirement that prices of risk be the same across the subsets of assets. 25 Due to the very small number of Italian firms that had useable data for this period, we start our APT analysis for Italy in 1986, such that the 76 companies selected in Italy are those that had data from January 1986. 26 The Netherland Interbank Rate is used to compute the country’s risk-free rate, due to unavailability of treasury bills data. 27 We sequentially delete insignificant factors to arrive at the “correct” model in similar fashion as Antoniou et al (1998a).
13
(Insert Table 2 here)
Before we discuss results in Table 2, we apply some robustness tests. We evaluate
each factor28 by itself following the argument in Chan et al (1998) that the procedure
of selecting the most important factors in a multivariate framework would have
pitfalls given that factors may be highly correlated and sample specific. Chan et al
(1998) notes “when we take the variables one at a time, it is possible that a factor may
appear to be unimportant by itself but it may assume a more prominent role when
evaluated jointly with others. We would treat a factor that behaves in such a manner
as suspect…” - p.161. The results from this step suggest that all factors listed in Table
2 are ‘individually’ priced.29
The APT model described in equations (1) to (6) may fail to identify a factor
candidate whose effect switches sign and averages close to zero over time, or is
occasionally important (see Flannery & Protopapadakis, 2002). Given this possibility
of time-varying effects of macroeconomic conditions on equity prices, we estimate a
GARCH model of stock market returns, where realised returns and their conditional
volatility depend on the macroeconomic innovations listed in Table 1. We add lagged
conditional variables to a standard GARCH (1, 1) in similar fashion as Flannery and
Protopapadakis (2002). The model, estimated by maximum likelihood, is:
( )1 5
1
[ δ ] ,t t - 1 t k k t tk
r E r uβ=
= + +∑ (7)
( )0 1
,t - 1 t t
E r r−
= + Ψ X (8)
(0 ,1 ),t t t t
u h , IN ε ε= ∼ (9)
0,
2
t 1 t - 1 t - 1h r + h + uρ= (10)
where
rt = the realised market return on day t,
Et-1(rt) = the (possibly time-varying) expected return for day t,
δkt = k vector of unanticipated observations on the k macroeconomic risk factors,
28 This process involves the estimation of a single-factor APT model. 29 In addition, we find that the factors that are not listed in Table 2 are not ‘individually’ priced.
14
βkt = the average sensitivity of the market return to unanticipated changes in the kth
factor,
r0 = a constant return,
Xt-1 = a vector of conditioning variables. The four conditioning variables used here are
similar to those used in Flannery and Protopapadakis (2002). They are lagged
three-month Treasury bill rate, default premium and term structure (as defined
earlier), and the own stock return.
ht = the conditional standard deviation of the error term ut.
Results from the GARCH model estimated for each market (also indicated in
Table 2) suggest that stock market returns are significantly (at ten percent level)
sensitive to most of the priced factors in all markets.30 In fact, only priced factors
identified in the APT system significantly affect stock market returns in the
Netherlands.
Tests of the APT pricing restrictions give a good idea of whether the APT is
likely to be valid as a reduction of a more general linear factor model. The APT
pricing restriction is easily accepted in all six markets (Table 2), suggesting that the
APT seems to provide an adequate description of the behaviour of the excess returns
of the assets used in the analysis. We also report the adjusted-R2 to assess the ability
of priced factors to explain the return generating process. Given the subjectivity of
individual shares to noise, our model appears to perform well, explaining more than
half of the excess returns-generating process in all markets, up to 80% in Italy.31 This
finding supports evidence in Aleati et al (2000) that the influential role of size and
book-to-market equity factors in explaining average stock returns, as suggested by
Fama and French (1993), is secondary to that of macroeconomic factors, i.e.
macroeconomic factor models like the APT outperform the three-factor model of
Fama and French (1993) in explaining Italian equity returns. The overall evidence
suggests that the APT, as an empirical model of variations in equity returns, warrants
further attention in European markets.
30 There are a few exceptions though. For example, Germany’s stock market returns is not significantly sensitive to oil price ‘news’ which is priced, but is sensitive to unemployment innovations which is not priced. See Table 2 for other countries. 31 Moreover, the fact that the return on market portfolio is not priced in any of the six markets (see Table 2) suggests that no significant national and, even more importantly, international factors are omitted thus providing evidence that accounting for macroeconomic factors reduces the impact of the overall stock market index on individual shares as noted in Chen et al (1986).
15
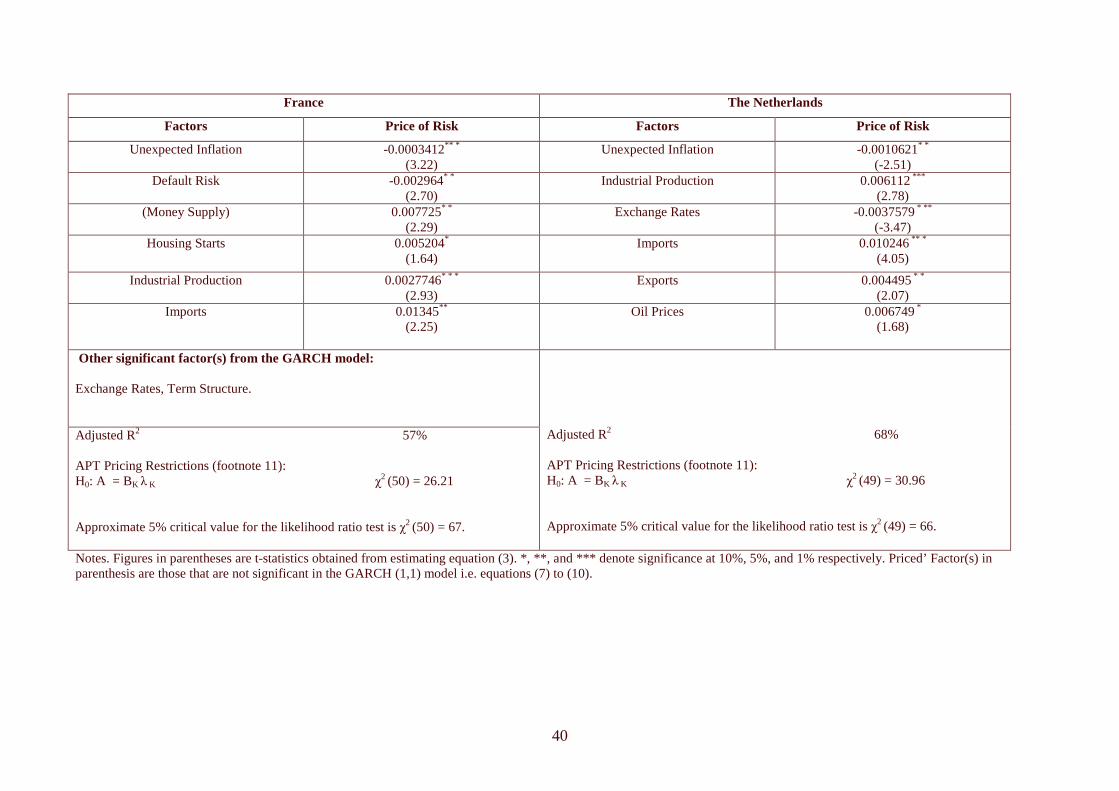
From Table 2, inflation appears to be the only priced factor common to all
markets, in line with Adler and Dumas (1983) which suggests the presence of
inflation risk premiums in equities of all countries. Exchange rate is a priced factor in
Germany, the UK, Italy, USA, and the Netherlands. In France, the price of exchange
rates risk appears to be insignificant, in line with previous empirical findings.32
In answering our main research question, we analyse the behaviour of the
exchange rate risk premium for each equity market before and after the introduction
of the euro. We estimate the APT model (including only significantly priced factors)
recursively from January 1989 to December 2004.33 We include exchange rates in the
APT system of France.34 The recursive estimation therefore permits an analysis of the
total equity market risk premia (hence the cost of equity capital) over the period. We
calculate, for the market portfolio, the risk premium for each individual factor (bmkt λ
kt) and the equity market premium as a whole (∑ bmkt λ kt).
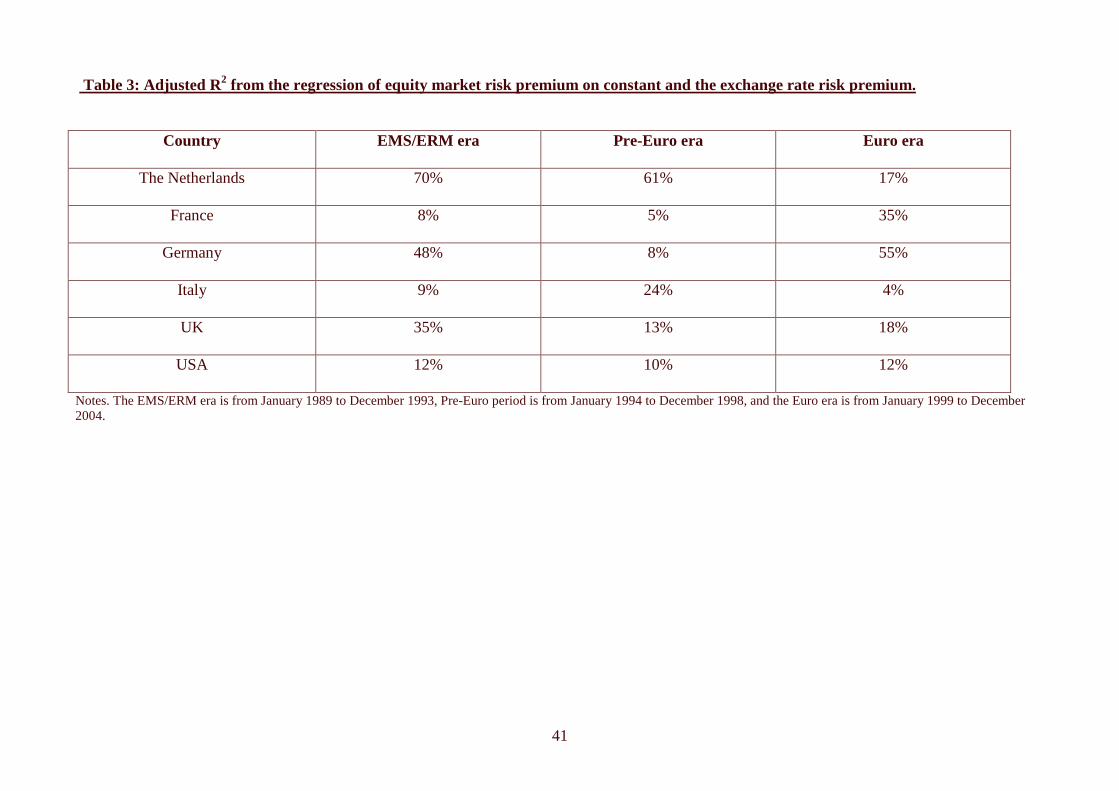
The results for the exchange rates risk premium and the equity market
premium are presented in Figures 1 to 6.35 To determine the extent to which the
exchange rates risk premium contributed to the behaviour of the total equity market
premium before and after the introduction of the euro, we regress the change (first
differences) in the equity market risk premium on a constant and the change in
exchange rate risk premium. We carry out the regressions over three sub periods: the
EMS/ERM era (1989 – 1993), Pre-Euro era (1994 – 1998), and Euro era (1999 –
2004). The results are presented in Table 3.
(Insert Table 3 here)
32 See for instance Vassalou (2000) which uses three GMM-based International CAPM models to test exchange rate risks over the period 1973 to 1990. However, the introduction of the euro may have achieved its desired effects of currency risk elimination in France. To investigate this possibility, we estimate the APT model over two periods for France: pre-Euro era (i.e. pre-1999), and Euro era (1999 – 2004). Ironically, the result shows that exchange rate risk price was insignificant pre-Euro, but becomes significant in the euro era. 33 Using data from January 1980 to January 1989, we estimate the model to obtain the first estimates of the parameters. We then add one observation (February 1989), obtaining another set of parameter estimates, repeating this procedure to the end of the sample (December 2004), in similar fashion as Antoniou et al (1998a). We therefore obtained 192 point estimates of factor risk premia from this procedure. 34 In line with our objectives, this is necessary since exchange rates risk price is significant after the introduction of the euro. 35 Note that the estimated equity market premiums are presented as annualised percentages to aid analysis and comparisons.

16
Table 3 shows that in France and Germany, the susceptibility of the total
equity market risk premium to changes in exchange rate risk premium increased
significantly after the introduction of the euro, whereas in the Netherlands and Italy, it
has significantly reduced – almost negligible in the latter country. The exchange rate
premium exerts considerable influence on the UK total equity market premium,
especially during the EMS/ERM era, consistent with the findings in Antoniou et al
(1998a). Given the low impact of currency risks on the US equity market, our result
mirrors De Santis & Gerard (1998).36 We commence with a discussion of the
behaviours of exchange rates risk and total equity market premiums in the six
markets, as depicted in Figures 1 to 6.
6.1 France and Germany.
Figure 1a confirms that the exchange rate risk premium in France was very low and
relatively insignificant before the introduction of the euro. A general downward trend
in the total equity market risk premium (Figure 1b) is very noticeable over the entire
estimation period. During the EMS/ERM, the equity market behaved erratically, often
coinciding with major events of political and economic significance, especially those
potentially affecting monetary cooperation within the European Economic
Community (EEC). For instance, the collapse of the Berlin Wall in November 1989
and the general anxiety that characterised planned German Re-unification coincides
with sharp rises in the equity market premium. The premium also fell sharply in
December 1991 and November 1992 coinciding with the Maastricht Treaty
Agreement (a key stage in the EMU process) and the aftermath of the EMS/ERM
crisis of 1992, respectively. Since the commencement of both the independence of the
Banque de France (the French central bank) and stage two of the EMU37 in January
1994, there has been a steady downturn in the equity market premium.
(Insert Figures 1a and 1b here)
36 De Santis and Gerard (1998) estimates and tests an ICAPM using parsimonious multivariate GARCH processes over the period 1973 to 1994, finding that with the exception of the US the premium of bearing currency risk often represents a significant fraction of the total equity premium in Germany, Japan, and the UK. 37 Stage Two of the EMU involved the establishment of the European Monetary Institute (EMI), the forerunner of the European central Bank (ECB), and the enforcement of the European Economic Agreement (EEA) under the Maastricht Treaty.

17
The German exchange rate risk premium (Figure 2a) was relatively stable
prior to the introduction of the euro. Since Germany has the strongest economy in
Europe, it had the least reasons for a monetary union. Bond & Najand (2002) notes
that German citizens were uneasy about giving up their known, low inflation currency
for an unknown and untested single currency such that good news on the proposed
single currency implied bad news for the Deutsche Mark. This appears to be the case,
initially. For instance, the sharp rises in the exchange rate and total equity market risk
premiums in March 1989 and February 1992 coincide with the announcement of the
acceptance of the Delors Proposal38 and the signing of the Maastricht Treaty
respectively.
(Insert Figures 2a and 2b here)
However, following the commencement of the European Economic Area
(EEA) in January 1994, a downward trend in the exchange rate risk premium
(reaching an all time low following the electronic euro launch in January 1999) is
noticeable. The equity market premium also fell until 1997, the year of Asian
financial crisis, market tensions resulting from the disagreement between the
Bundesbank and the German government over plans to revalue gold reserves in
anticipation of the EMU, and EU enlargement plans.
After the introduction of the euro, Table 3 suggests that over a third of the
changes in equity market risk premium in France and Germany are due to the changes
in the currency risk premiums. The announcements of continuing strong growth in the
USA and optimistic earnings growth forecasts for US businesses in the third quarter
of 1999 resulted in increased markets interests towards the US. Despite a bright
economic outlook for the euro area economies announced by the ECB at about the
same time, investors focused on the US market, causing a decline in the euro. The
unabated rise in the exchange rate risk premiums (Figures 1a and 2a) from September
1999 to the first quarter of 2000 suggests the ‘europhoria’ that prevailed since the
introduction of the euro was over. The ECB President’s criticism of German
38 In March 1989, The European Free Trade Association (EFTA) announced its cooperation with the European Commision (EC) to remove trade barriers and create the ‘European Economic Space’, the forerunner to the European Economic Area, as proposed by EC President Jacques Delors.
18
economic policy39 on December 3, 1999 is widely believed to be partly responsible
for the fall of the euro below the dollar parity for the first time and announcements of
weaker-than-expected growth rate in Germany by the Bundesbank in January 2000
accelerated euro weaknesses as the premiums reflect. The uncertainty with the euro
also caused financial outflows that affected the whole euro area.
In general, the premiums associated with exchange rate risks in France and
Germany are larger and more volatile after the introduction of the euro. However,
there is a difference in the behaviour of the total equity market premiums of France
and Germany after the euro launch. While the total equity market premium of France
continues to fall (except in the last and first quarters of 1999 and 2000 respectively,
and the second and first halves of 2002 and 2003 respectively), that of Germany
shows an upward, more-volatile trend. The economic outlook and investment appeal
of France, due to low inflationary pressure and high growth figures following the euro
launch, improved substantially.40 In sharp contrast, the upward trend in the equity
market premium of Germany does not only reflect a higher currency risk but also
general uncertainty and economic growth crisis and a weak corporate propensity to
invest in Germany41 over the period.42
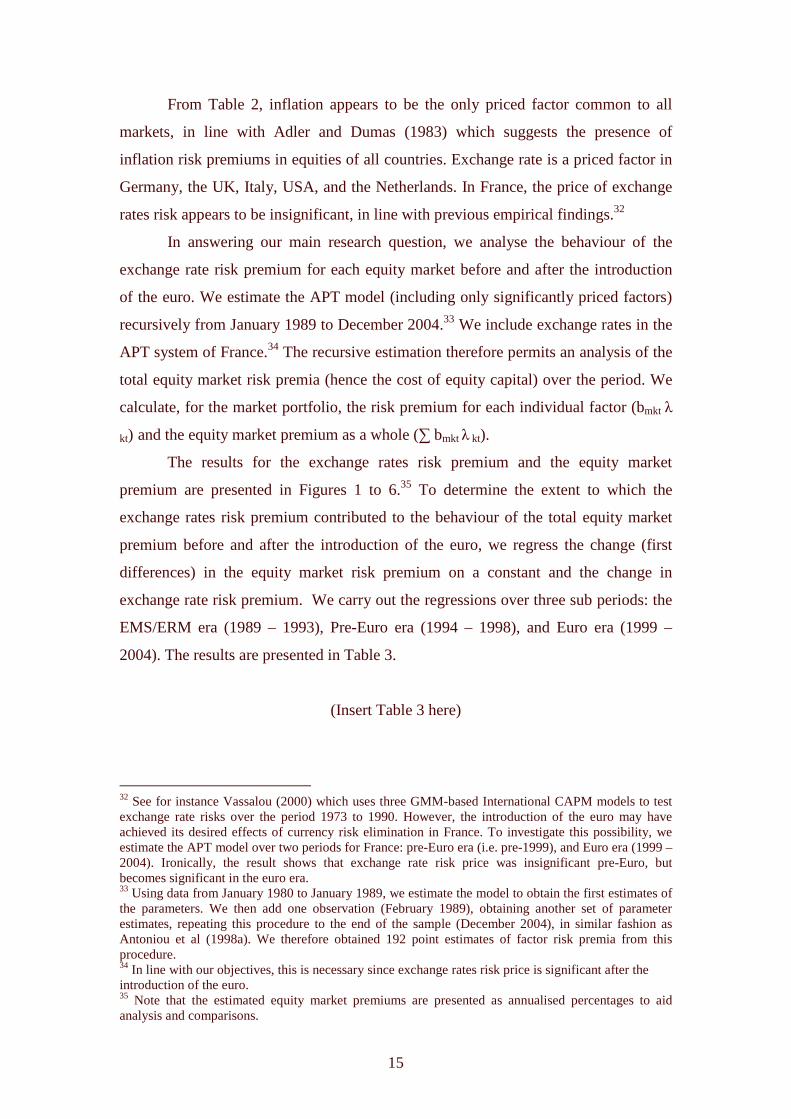
6.2 Italy
The behaviour of the exchange rate risk premium (see Figure 3a) in Italy over the
period43 highlights the effects of managed exchange rate regimes on the Italian Lira.
Apart from the sharp rise around the German reunification period, the stability of the
exchange rate risk premium and even the total equity market premium (see Figure 3b)
is noticeable during the ERM era.
39 Wim Duisberg criticised the German government for trying to rescue the construction group Phillip Holzman saying such actions are not in line with the EMU objective of an increasing market driven economy. 40 See Trichet (2003) and Noyer (2004). Note however that the French economy experienced weak growth and a deterioration in external trade over 2003/2004. 41 See Deutsche Bundesbank (2004). 42 Our results are similar to findings in previous works. For instance, using a Markov-switching three-regime model to analyse the effects of the EMU on the volatility of daily stock market returns in Germany, Italy, Spain, and France from January 1988 to December 2000, Morana and Beltrati (2002) find that the volatility of the French equity market has reduced relative to the volatility of equity markets in Germany, the UK, and the USA. 43 We start the recursive estimation for Italy from January 1990, to allow for degrees of freedom. This date also coincides with the commencement of Italy’s membership of the EMS/ERM.
19
(Insert Figures 3a and 3b here)
After the EMS crisis of September 1992 which saw the exit of the Lira from
the EMS/ERM, both premiums rose and become more volatile. As observed in
Fornari et al (1999) and Bond and Najand (2002), it appears that good news on the
single currency causes an appreciation of the Lira. The fall in the exchange rate
premium from January 1994 coincides with the commencement of the EEA and the
sharp rise in both exchange rate and equity market premiums in February 1997
coincides with the EC’s report suggesting that Italy may not be ready for the EMU
due to its failure to meet the debt ratio criteria,44 coupled with sharp dollar
appreciations following US interest rate hikes, prompting G7 intervention. The sharp
rise in the exchange rate premium in March 1998 probably reflects market concerns
arising from French and German opposition to Italy’s membership of the single
currency, ahead of the convergence report. The EC’s recommendation of Italy for
EMU membership may have restored confidence as shown by the sharp drop in the
exchange rate premium in April 1998. Since the May 1998 announcement of Italy’s
EMU membership, the exchange rate risk premium appears to have stabilised
considerably although an upward trend is noticeable over 2003/2004. Italy’s equity
market risk premium has been moving downwards since Italy’s membership of the
EMU was announced. However, the evidence in Table 3 downplays the role of the
euro in the declining market premium. Although Italy’s economy did not perform
strongly over the period, inflation improved considerably from pre-euro levels,45 in
line with previous evidence.46 Our findings therefore support claims in Garfalo (2005)
that “for Italy…low inflation rates characterise periods during which some form of
exchange rate peg is adopted, while high inflation rates are typical of more flexible
exchange rate regimes” – p. 31.
44 See Hooper (1997). 45 Although not presented here, a graph of the estimated unexpected inflation premium for Italy shows a substantial fall in the premium after the euro launch. Details are available from authors. See also Banca D’Italia (2004) for further evidence. 46 Morana and Beltrati (2002) suggest that the most likely reason for the reduction in volatility of the Italian stock market is the stabilisation of economic fundamentals and not the elimination of exchange rate risk.

20
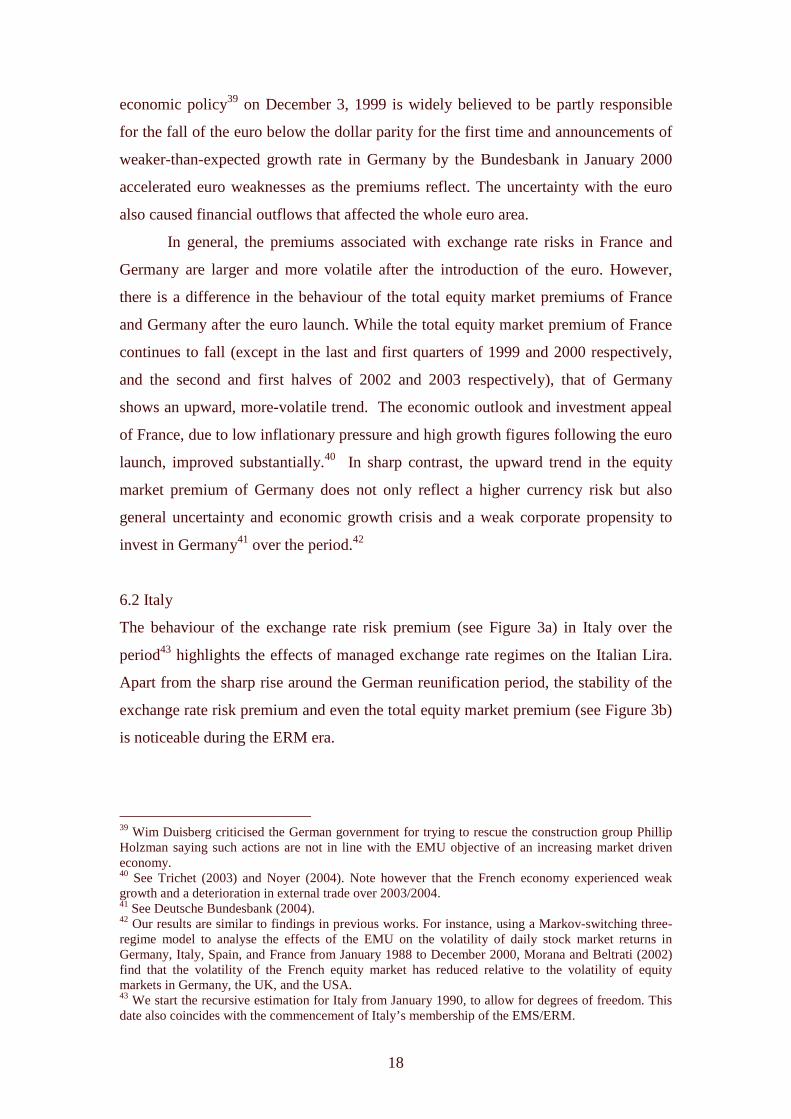
6.3 The Netherlands
Figures 4a and 4b show that exchange rate risk and total equity market premiums in
the Netherlands declined rapidly during the EMS/ERM until mid-1992, with the
exchange rate premium having a significant effect on the equity market premium (see
Table 3).
(Insert Figures 4a and 4b here)
Given Dutch interests in stabilizing exchange rates, good news (bad news) on
the European single currency appears to coincide with a reduction (increase) in the
exchange rate premium. For instance, sharp rises in both exchange rates and equity
premiums in the fourth quarter of 1996 coincides with general market concerns over
to the admission and re-admission of the Finnish Markka and the volatile Italian Lira
into the EMS in October and November of 1996 respectively. Again, the sharp fall in
the exchange rate risk premium (also in the equity market premium) in March 1997
coincides with the announcement of the EC report that the Netherlands is one of five
countries that satisfied all the convergence criteria.47 Figure 4a shows a continuous
fall in the exchange rate risk premium for most of the period following the
introduction of the euro in January 1999, such that the premium is well below its pre-
euro era level. This fall, however, had a modest impact on the equity market premium
(Figure 4b) which declined slightly. This slight decline, in comparison with the
exchange rate risk premium, may not be unconnected to the Dutch inflation rate
which remained one of the highest within the eurozone, a poor economic outlook due
to lower-than-expected domestic demand, and the economic situation of Germany
which exacerbated declining exports.48
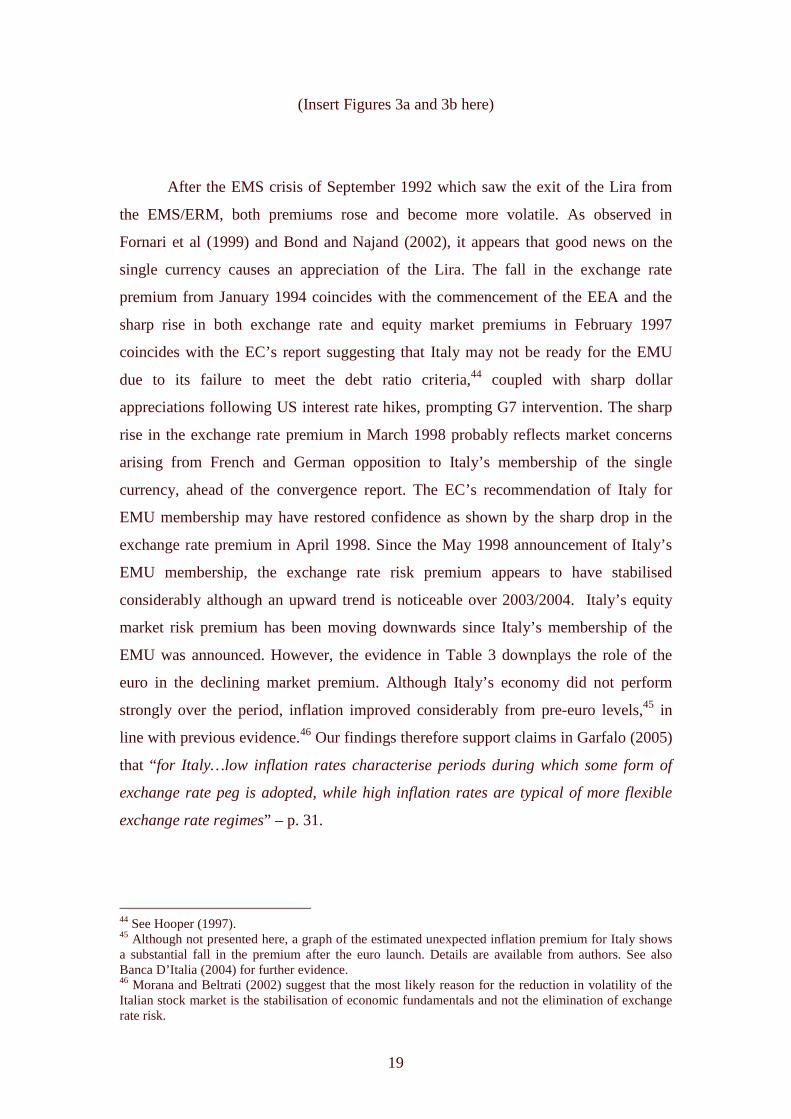
6.4 The UK
How did the premiums in the non-euro countries behave? Figures 5a and 5b show
that the movement in both exchange rate risk and total equity market premiums are
similar to that observed in Antoniou et al (1998a): sharp rises following the
47 See Hooper (1997). 48 See De Nederlandsche Bank (2004).
21
announcement of UK ERM membership from October 1990, and the subsequent
decline until December 1991.
(Insert Figures 5a and 5b here)
Following the sharp drop which coincided with the aftermath of the EMS
crisis that saw the exit of the Pound Sterling from the ERM, both exchange rate risk
and total equity market premiums stabilised considerably until the summer of 1997
(Asian Financial Crisis), and in the run-up to the single currency (especially the
second half of 1998 when the UK sterling depreciated sharply in anticipation of a
strong euro). The January 1999 speech by the Governor of the Bank of England49 on
the prospective weakness of the euro appears to have bolstered market confidence as
reflected by the large decline in the exchange rate premium in January 1999. Apart
from sharp hikes in the June 2002 and the second and third quarters of 2003,50 the
equity market premium, and to a lesser extent, the exchange rate risk premium fell
almost unabatedly as markets were gradually attracted to UK equities after increased
UK growth trend relative to the euro area.
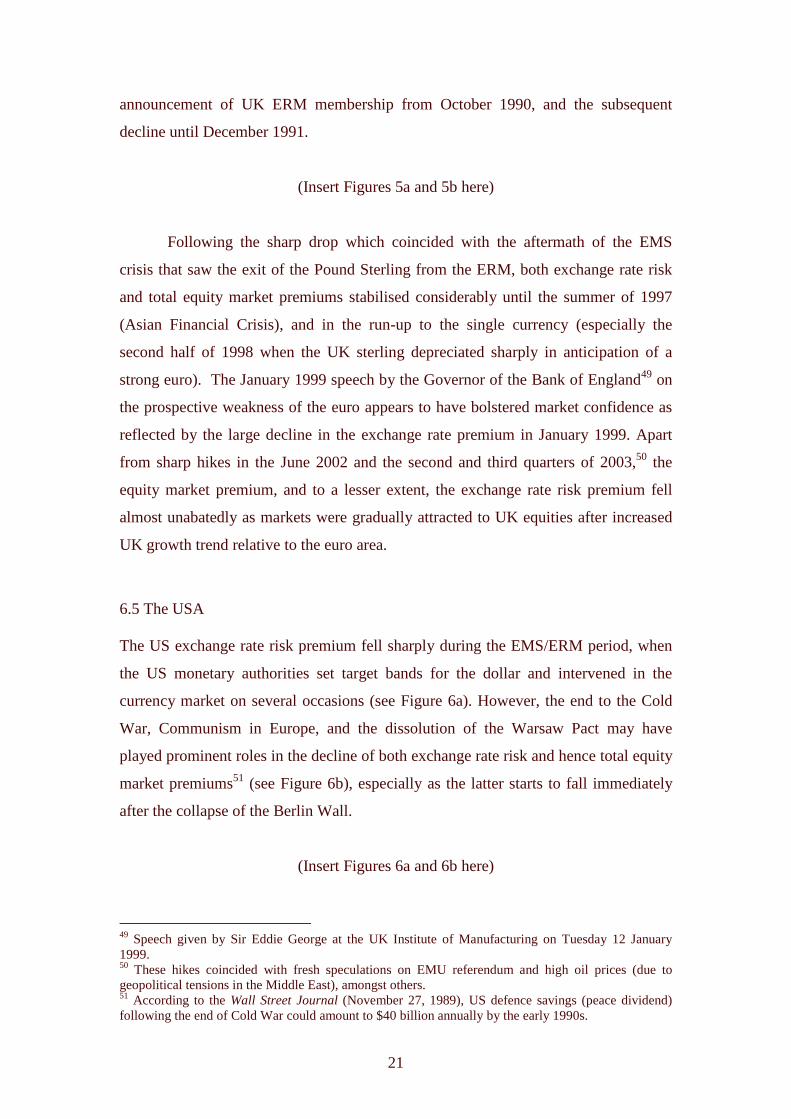
6.5 The USA
The US exchange rate risk premium fell sharply during the EMS/ERM period, when
the US monetary authorities set target bands for the dollar and intervened in the
currency market on several occasions (see Figure 6a). However, the end to the Cold
War, Communism in Europe, and the dissolution of the Warsaw Pact may have
played prominent roles in the decline of both exchange rate risk and hence total equity
market premiums51 (see Figure 6b), especially as the latter starts to fall immediately
after the collapse of the Berlin Wall.
(Insert Figures 6a and 6b here)
49 Speech given by Sir Eddie George at the UK Institute of Manufacturing on Tuesday 12 January 1999. 50 These hikes coincided with fresh speculations on EMU referendum and high oil prices (due to geopolitical tensions in the Middle East), amongst others. 51 According to the Wall Street Journal (November 27, 1989), US defence savings (peace dividend) following the end of Cold War could amount to $40 billion annually by the early 1990s.
22
However, the US equity market premium rose unabatedly after the end of the Gulf
War in February 1991 until 1994. The evidence also shows that sharp rises in both
exchange rates and equity market risk premiums coincide with that start of the single
EU market and the enforcement of the Maastricht Treaty in January and November
1993 respectively. Perhaps US markets react negatively to the union of European
markets. Since 1999, there has been an increasing trend in the exchange rate risk
premium52 whereas the market risk premium does not show any noticeable trend.
7. Conclusion
The null hypothesis that exchange rates risk is priced in most equity markets
examined here cannot be rejected. The performance of our APT model also suggests
that movements in macroeconomic factors do affect equity returns, contrary to some
previous work.
Our evidence does not support the notion that a single European currency will
suppress exchange rates risks, as anticipated by the EC. Currency risk within the
eurozone may have been eliminated but these countries trade with the rest of the
world as well hence their risks fluctuate with the volatility in the exchange rate of
euro vis-à-vis major currencies. It appears that the exchange rate risk premium in
larger equity markets of the euro area (France and Germany) has not only increased
but has become more volatile since the introduction of the euro in January 1999. On
the contrary, evidence suggest that the ‘smaller’ economies - Italy and the
Netherlands, have benefited from membership of the euro bandwagon, as they appear
to do during managed currency regimes. The stability in the currency risk premium
following the mid-1998 announcement of Italy’s membership of the EMU is very
apparent, as is the decline in that of the Netherlands in the euro-era.
With the exception of Germany, total equity market risk premiums in France,
Italy and the Netherlands have reduced since the introduction of the euro. However,
our evidence suggests that macroeconomic factors other than exchange rates are
largely responsible for the fall in the equity market premiums. For instance, the fall in
52 We find that the volatility (measured by standard deviation) of the trade-weighted index of the US Dollar (monthly) over the period January 1989 to December 1999 (4.65) nearly doubled from January 1999 to 2004 (8.22). Therefore, the post-1999 rise in the US currency premium may not be surprising.

23
Italian market premium is due largely to the stabilizing effects of the EMU on Italy’s
long-term ‘economic nemesis’ – inflation.
In general, it appears that the larger countries, which seem to have more
political than economic motives for monetary union in Europe, have not benefited
immensely from their EMU membership especially when exchange rate risks are
considered. Whereas the smaller countries, which appear to have genuine economic
motives for EMU membership, have benefited considerably.
Evidence also shows significant decline in the equity market premium, and to
a lesser extent, the exchange rate risk premium in the UK. In light of this recent
performance and the EMU experiences of large countries like Germany and France
(so far), an equity market participant may not advocate the UK’s membership of the
EMU.
24
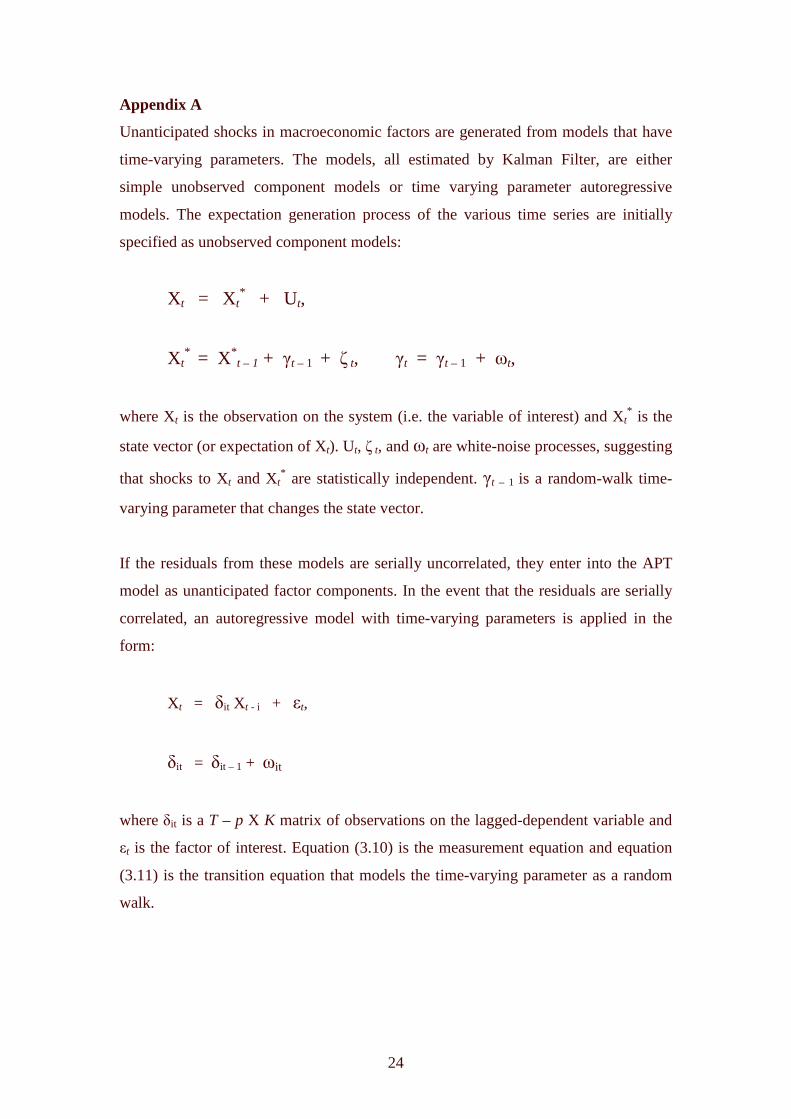
Appendix A
Unanticipated shocks in macroeconomic factors are generated from models that have
time-varying parameters. The models, all estimated by Kalman Filter, are either
simple unobserved component models or time varying parameter autoregressive
models. The expectation generation process of the various time series are initially
specified as unobserved component models:
Xt = Xt* + Ut,
Xt* = X*
t – 1 + γt – 1 + ζ t, γt = γt – 1 + ωt,
where Xt is the observation on the system (i.e. the variable of interest) and Xt* is the
state vector (or expectation of Xt). Ut, ζ t, and ωt are white-noise processes, suggesting
that shocks to Xt and Xt* are statistically independent. γt – 1 is a random-walk time-
varying parameter that changes the state vector.
If the residuals from these models are serially uncorrelated, they enter into the APT
model as unanticipated factor components. In the event that the residuals are serially
correlated, an autoregressive model with time-varying parameters is applied in the
form:
Xt = δit Xt - i + εt,
δit = δit – 1 + ωit
where δit is a T – p X K matrix of observations on the lagged-dependent variable and
εt is the factor of interest. Equation (3.10) is the measurement equation and equation
(3.11) is the transition equation that models the time-varying parameter as a random
walk.

25
References
Adler, M., Dumas B., 1984. Exposure to currency risk: Definition and Measurement.
Financial Management 13, 41 – 50.
Aleati, A., Gottardo, P., Murgia, M., 2000. The Pricing of Italian Equity Returns.
Economic Notes 29 (2), 153 – 177.
Amemiya, T., 1977. The Maximum Likelihood and the Non-linear three staged least
squares estimator in the general nonlinear simultaneous equation model. Eco-
nometrica 45, 955 – 968.
Antoniou, A., Garrett, I., Priestley, R.., 1998a. Calculating the equity cost of capital
using the APT: the impact of the ERM. Journal of International Money and
Finance 17, 949 – 965.
Antoniou, A., Garrett, I., and Priestley, R.., 1998b. Macroeconomic variables as com-
mon pervasive risk factors and the empirical content of the arbitrage pricing
theory, Journal of Empirical Finance 5 (3), 221-240.
Bailey, W., Mao, C., Zhong, R., 2003. Exchange rate regimes and stock return volati-
lity: some evidence from Asia’s Silver Era, Journal of Economics and Busi-
ness 55 (5), 557 – 584.
Berk, J. M., 2002. Old Lessons and New Challenges. Speech to the conference on
economic policy directions in the OECD countries: analysing the experiences.
Warsaw, March 21 – 22.
Bond, C., Najand, N., 2002. Volatility Changes in European currency exchange rates
due to EMS announcements. Global Finance Journal 13, 93 – 108.
Burmeister, E., McElroy, M., 1988. Joint estimation of factor sensitivities and risk
premia for the Arbitrage Pricing Theory. Journal of Finance 43, 721 – 735.
Campbell, J. Y., 1987. Stock returns and the term structure. Journal of Financial Eco-
nomics 18 (2), 73-399.
Chan, K. C., Karceski, J., Lakonishok, J., 1998. The Risk and Return from Factor.
Journal of Financial and Quantitative Analysis 33 (2), 159 – 188.
Chen, N-F., Roll, R., Ross, S., 1986. Economic Forces and the Stock Market. Journal
of Business 59 (3), 383 – 403.
Clare, A. C, Thomas, S.H., 1994. Macroeconomic Factors, the APT and the UK Stock
Market. Journal of Business, Finance, and Accounting 21, 309 – 330.

26
Commission of the European Communities, 1992. Twelve Countries One Money One
Market: 12 Key Points about European Monetary Union (EMU). Briefing
Series 5. Commission of the European Communities.
Conover, M. C., Jensen, G. R., Johnson, R., 1999. Monetary Environment and Inter-
national Stock Returns. Journal of Banking and Finance 23, 1357 – 1381.
De Santis, G., and Gerard, B., 1998. How big is the premium for currency risk? Jour-
nal of Financial Economics 49, 375 – 412.
Deutsche Bundesbank., 2004. Deutsche Bundesbank Annual Report 2003. Deutsche
Bundesbank.
De Nederlandsche., 2004. De Netherlandsche Bank Annual Report 2003. De Nether-
landsche Bank.
Eichengreen, B., 1992. Should the Maastricht Treaty be saved? Princeton Studies in
International Finance 74.
Eichengreen, B, 1994. International Monetary Arrangements for the 21st Century. The
Brookings Institution, Washington DC.
Fama, E. F, French, K., 1993. Common risk factors in the returns on stocks and bonds
Journal of Financial Economics 33 (1), 3 – 56.
Ferson, W. E, Harvey C. R. (1991). The Variation of Economic Risk Premiums. Jour-
nal of Political Economy 99 (2), 385 – 415.
Flannery, M. J., Protopapadakis, A. A., 2002. Macroeconomic Factors Do Influence
Aggregate Stock Returns. The Review of Financial Studies 15 (3), 751 – 782.
Fornari, F, Monticelli, C, Pericoli, M., Tivegna, M., 1999. The Impact of News on the
the exchange rate of the Lira and long-term interest rates. Temi di Discussione
358, Bank of Italy.
Gallant, A.R., 1987. Nonlinear Statistical Models. J. Wiley & Sons Inc, New York.
Garfalo, P, 2005. Exchange Rate Regimes and Economic Performance: the Italian Ex-
perience. Quaderni dell Ufficio Ricercho Storicho 10, Bank of Italy.
Geske, R, Roll, R, 1983. The Fiscal and Monetary linkage between Stock Returns and
Inflation. Journal of Finance 38 (1), 1 – 33.
Hooper, J., 1997. Italy Pins it hopes on EMU: special report on the EMU. The Guard-
ian, April 26 1997, UK.
Jones, C. M., Kaul, G., 1996. Oil and the Stock Market. Journal of Finance 51(2), 463
– 491.
27
Jorion, P, 1991. The pricing of exchange risk in the stock market. Journal of Financial
and Quantitative Analysis 26, 363 – 376.
Jovanovic, B., Ueda, M., 1998. Stock Returns and Inflation in a Principal-Agent Eco-
nomy. Journal of Economic Theory 82 (1), 223 – 247.
Kenen, P. B., 1969. The theory of Optimum Currency Areas: an eclectic view. In:
Mundell, R.A., Swoboda, A. K. (Eds.), Monetary Problems of the
International Economy, University of Chicago press, Chicago, 41 – 59.
Kenen, P. B, 2002. The euro versus the dollar: will there be a struggle for dominance?
Panel, Annual Meeting, American Economic Association, Atlanta.
Kia, A, 2003. Rational Speculations and Equity Volatility as a measure of ex ante risk
Global Finance Journal 14 (2), 135 – 157.
King, D. M, Sentana, E., Wadwhoni, S., 1994. Volatility and links between National
Stock Markets. Econometrica 62, 901 – 938.
Klaster, M. A, Knot, K. H, 2002. Towards an econometric target zone model with en-
dogenous devaluation risk for a small open economy. Economic Modelling 19
(4), 509 – 529.
Leach, G, 1999. The UK and the Euro - better out than in? IOD Research Paper. Insti-
tute of Directors, UK.
McElroy, M. B., Burmeister, E., 1988. Arbitrage Pricing Theory as a restricted non-
linear multivariate regression model: ITNLSUR estimates. Journal of Business
Economics and Statistics 6, 29 – 42.
McKinnon, R. I., 1963. Optimum Currency Areas. American Economic Review 56,
717 – 725.
Miccio, V., 1998. EMU and Italy: An opportunity to Reform. Social Sciences 410.
Morana, C., Beltratti, A., 2002. The effects of the introduction of the euro on the vol-
atility of European stock markets. Journal of Banking and Finance 26, 2047 -
2064.
Mundell, R. A., 1961. A Theory of Optimum Currency Areas. American Economic
Review 56, 717 – 725.
Noyer, C., 2004. 2003 Annual Report to the President of the Republic and Parliament.
Banque De France.
Patro, D. K., Wald, J. K, Wu, Y., 2002. Explaining exchange rate risks in world stock
markets: A panel approach. Journal of Banking and Finance 26, 1951 – 1972.

28
Priestley, R., 1996. The arbitrage pricing theory, macroeconomic and financial factors
and expectations generating processes, Journal of Banking & Finance 20 (5),
869-890.
Priestley, R, Ødegaard, B., 2005. Exchange Rate Regimes and the prices of Exchange
Rate Risk Economic Letters 82, 181 – 188.
Puffer, M. K, 1995. Measurement of the unexpected US trade deficit. Journal of Inter-
national Money and Finance 14 (2), 247- 273.
Rapach, P. E., 2001. Macro Shocks and Real Stock Prices. Journal of Economics and
Business 53, 5 – 26.
Ross, S. A, 1976. The Arbitrage theory of capital asset pricing. Journal of Economic
Theory 13, 341 – 360.
Trichet, J-C., 2003. 2002. Annual Report to the President of the Republic and Parlia-
ment. Banque De France.
Vassalou, M., 2000. Exchange rate and foreign inflation risk premiums in global
equity returns. Journal of International Money & Finance 19, 433 – 470.

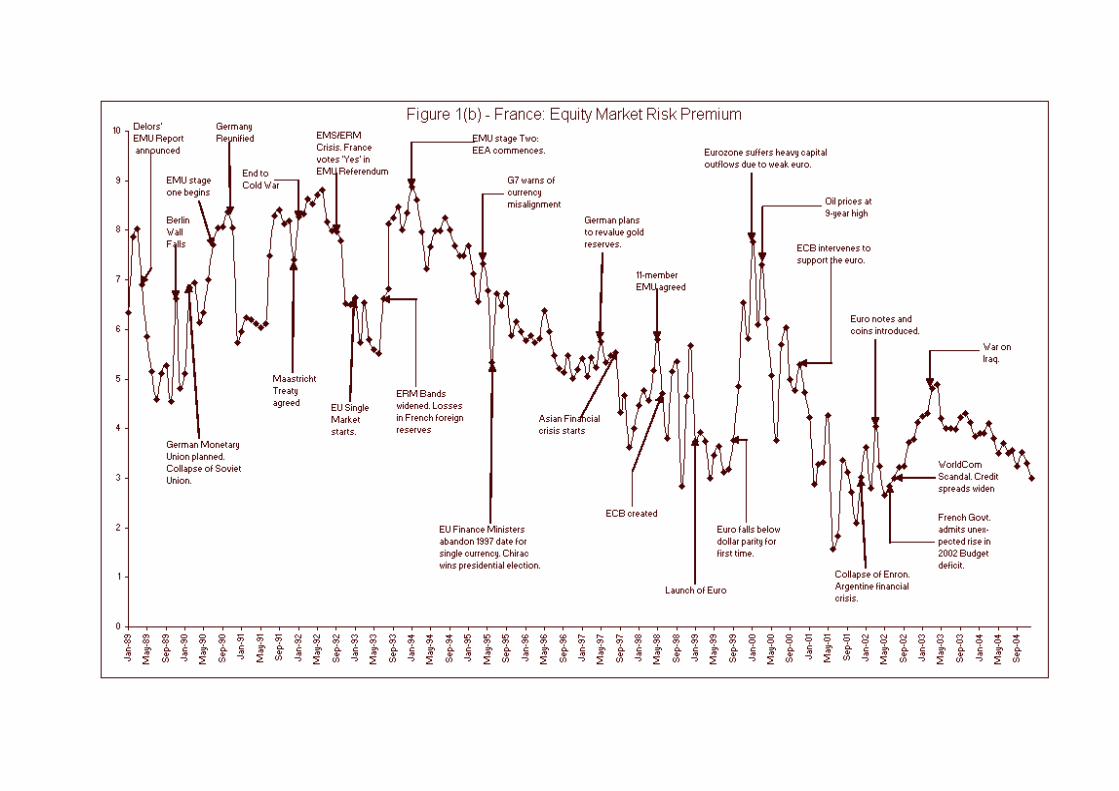
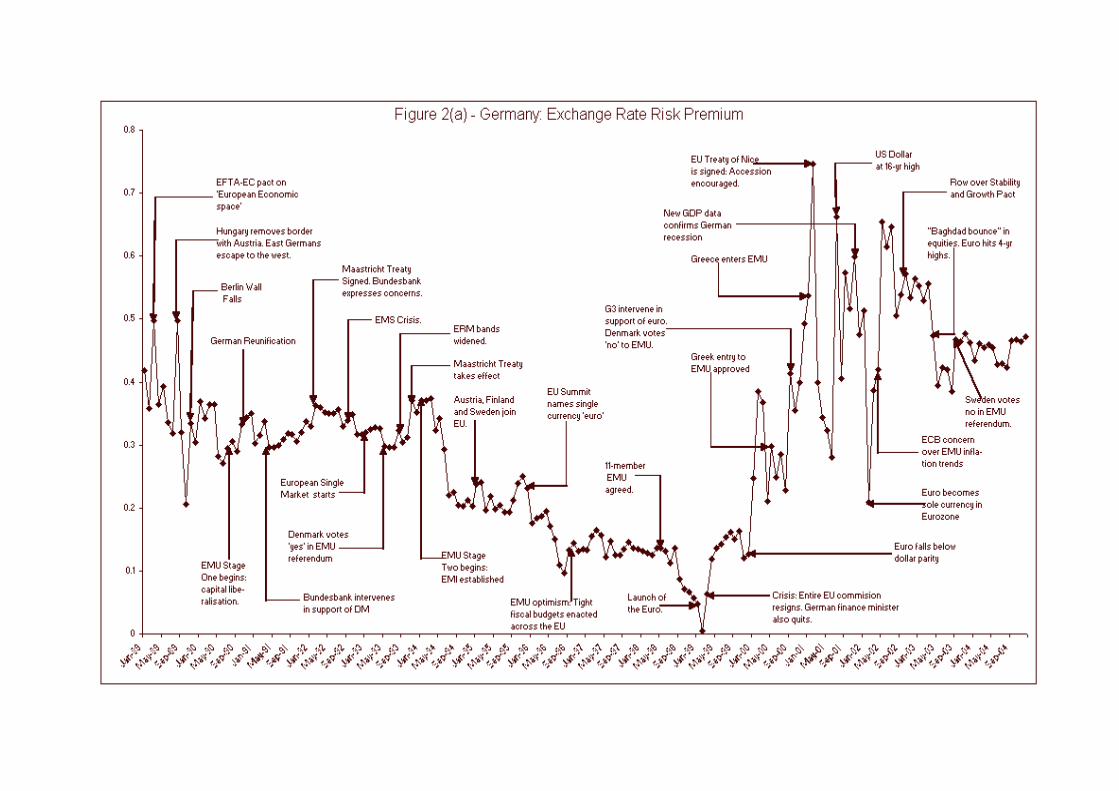
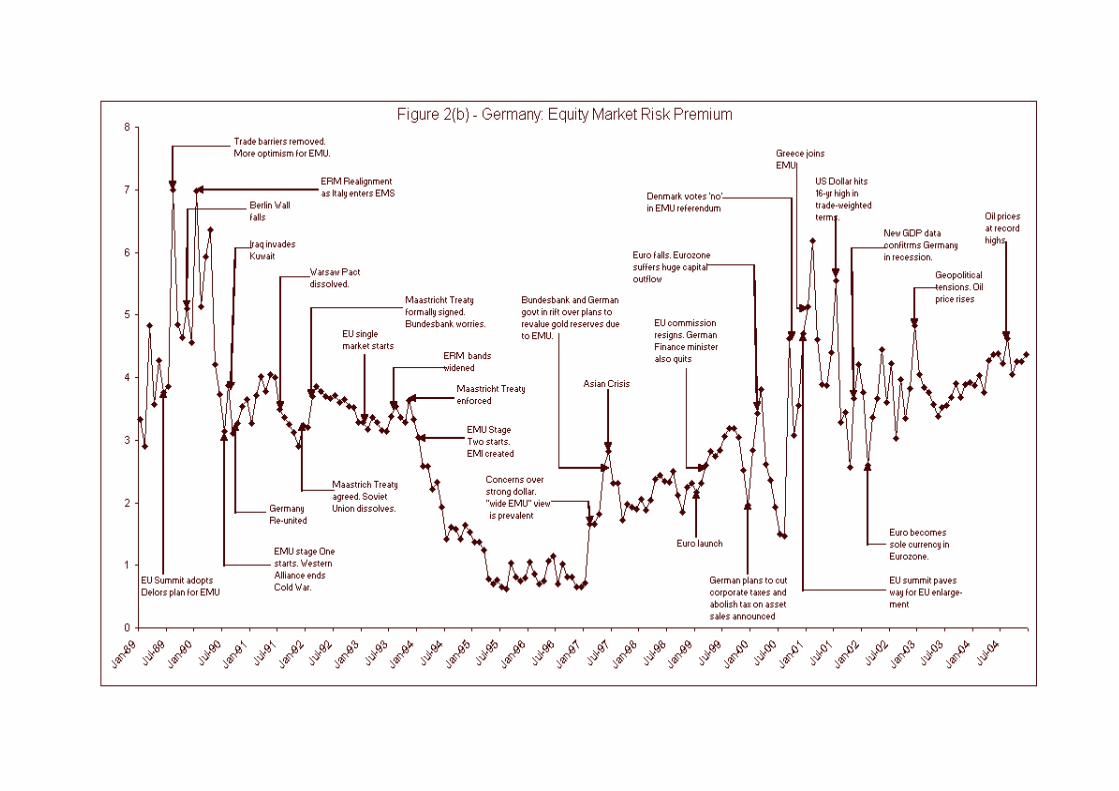
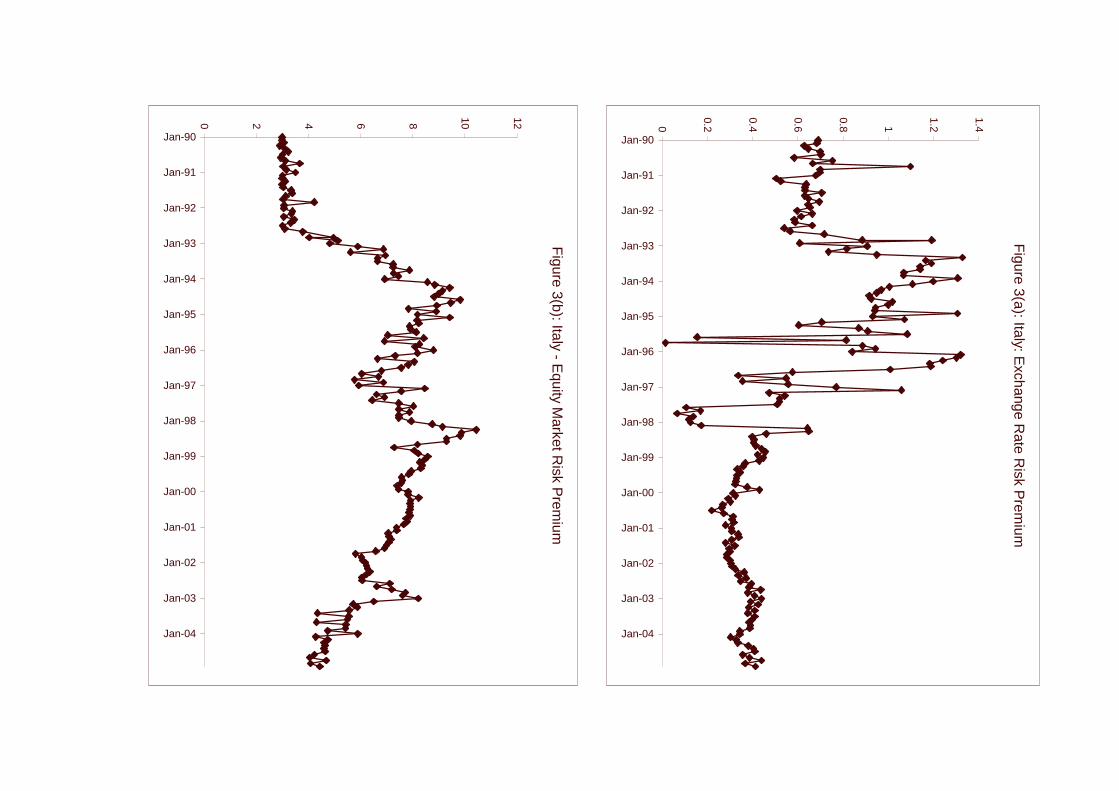
Figure 3(a): Italy: E
xchange Rate R
isk Prem
ium
0
0.2
0.4
0.6
0.8 1
1.2
1.4Jan-90
Jan-91
Jan-92
Jan-93
Jan-94
Jan-95
Jan-96
Jan-97
Jan-98
Jan-99
Jan-00
Jan-01
Jan-02
Jan-03
Jan-04
Figure 3(b): Italy - E
quity Market R
isk Prem
ium
0 2 4 6 8 10 12
Jan-90
Jan-91
Jan-92
Jan-93
Jan-94
Jan-95
Jan-96
Jan-97
Jan-98
Jan-99
Jan-00
Jan-01
Jan-02
Jan-03
Jan-04

Figure 4(a): T
he Netherlands - E
xchange Rate R
isk Prem
ium
-0.5 0
0.5 1
1.5 2
2.5 3
3.5 4Jan-89
Jan-90
Jan-91
Jan-92
Jan-93
Jan-94
Jan-95
Jan-96
Jan-97
Jan-98
Jan-99
Jan-00
Jan-01
Jan-02
Jan-03
Jan-04
Figure 4(b): T
he Netherlands - E
quity Market R
isk Prem
ium
0 2 4 6 8 10 12 14
Jan-89
Jan-90
Jan-91
Jan-92
Jan-93
Jan-94
Jan-95
Jan-96
Jan-97
Jan-98
Jan-99
Jan-00
Jan-01
Jan-02
Jan-03
Jan-04
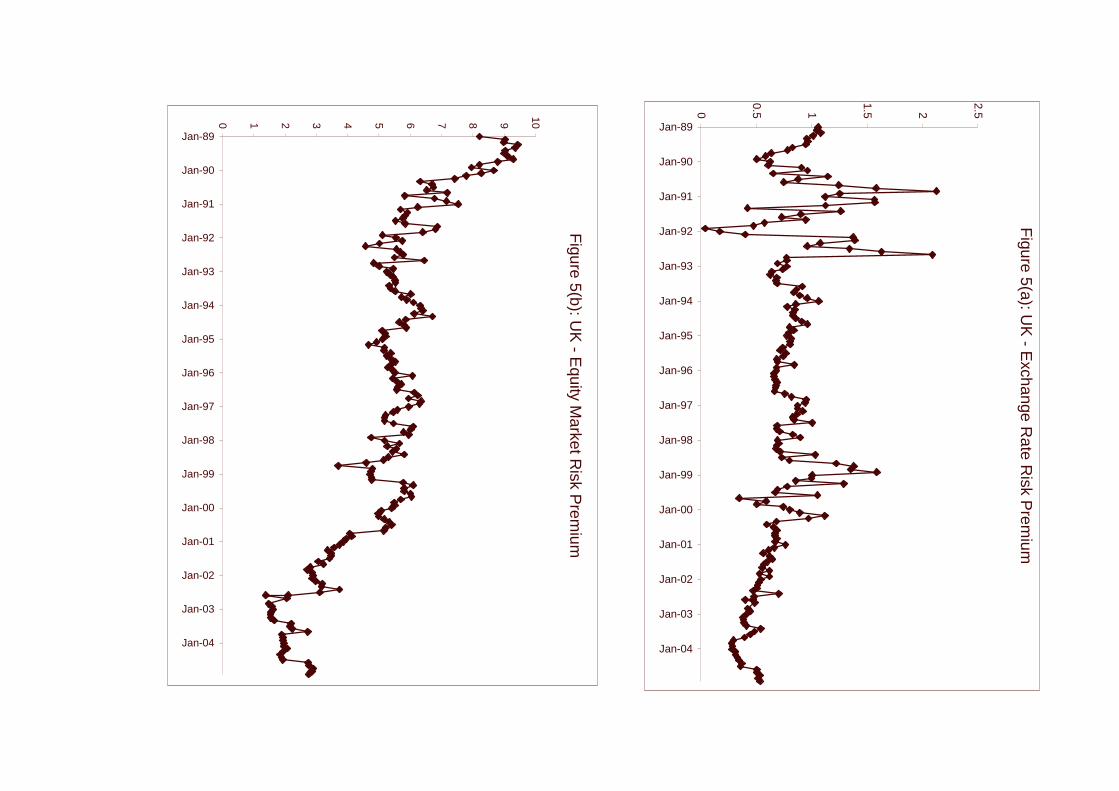
Figure 5(a): U
K - E
xchange Rate R
isk Prem
ium
0
0.5 1
1.5 2
2.5Jan-89
Jan-90
Jan-91
Jan-92
Jan-93
Jan-94
Jan-95
Jan-96
Jan-97
Jan-98
Jan-99
Jan-00
Jan-01
Jan-02
Jan-03
Jan-04
Figure 5(b): U
K - E
quity Market R
isk Prem
ium
0 1 2 3 4 5 6 7 8 9 10
Jan-89
Jan-90
Jan-91
Jan-92
Jan-93
Jan-94
Jan-95
Jan-96
Jan-97
Jan-98
Jan-99
Jan-00
Jan-01
Jan-02
Jan-03
Jan-04

Figure 6(a): U
SA
- Exchange R
ate Risk P
remium
0
0.1
0.2
0.3
0.4
0.5
0.6
0.7
0.8
0.9 1Jan-89
Jan-90
Jan-91
Jan-92
Jan-93
Jan-94
Jan-95
Jan-96
Jan-97
Jan-98
Jan-99
Jan-00
Jan-01
Jan-02
Jan-03
Jan-04
Figure 6(b): U
SA
- Equity M
arket Risk P
remium
0 1 2 3 4 5 6
Jan-89
Jan-90
Jan-91
Jan-92
Jan-93
Jan-94
Jan-95
Jan-96
Jan-97
Jan-98
Jan-99
Jan-00
Jan-01
Jan-02
Jan-03
Jan-04

37
Table 1: Macroeconomic and Financial factors used.
Factor Macroeconomic / Financial variable
ƒ1 (λ1) Returns on Market Portfolio
ƒ2 (λ2) Changes in Expected Inflation
ƒ3 (λ3) Unexpected Inflation
ƒ4 (λ4) Unanticipated shocks to the Exchange Rate
ƒ5 (λ5) Unanticipated shocks to the Term structure of Interest Rates
ƒ6 (λ6) Unanticipated shocks to Default Risk
ƒ7 (λ7) Unanticipated shocks to Real Industrial Production
ƒ8 (λ8) Unanticipated shocks to Real Retail Sales
ƒ9 (λ9) Unanticipated shocks to Real Money Supply
ƒ10 (λ10) Unanticipated shocks to Oil Prices
ƒ11 (λ11) Unanticipated shocks to Government Tax Revenue
ƒ12 (λ12) Unanticipated shocks to Unemployment Rates
ƒ13 (λ13) Unanticipated shocks to Housing Starts
ƒ14 (λ14) Unanticipated shocks to Real Exports
ƒ15 (λ15) Unanticipated shocks to Real Imports
ƒ16 (λ16) Unanticipated shocks to Commodity Prices.
Notes: Information to compute default risk is obtained from the Economist. Data on other factors is
sourced from Datastream. The sample period is from January 1980 to December 2004. The method of
deriving unanticipated shocks to the factors is described in Appendix A.

38
Table 2: Estimated prices of risk and tests of APT pricing restriction from January 1980 to December 2004.
Notes. Figures in parentheses are t-statistics obtained from estimating equation (3). *, **, and *** denote significance at 10%, 5%, and 1% respectively. ‘Priced’ Factor(s) in parenthesis are those that are not significant in the GARCH (1,1) model i.e. equations (7) to (10).
Germany United Kingdom
Factors Price of Risk Factors Price of Risk
Change in Expected Inflation
0.00996*
(0.09) Exchange Rates -0.0034411***
(-3.14) Exchange Rates -0.0032735 * *
(-1.98) Term Structure -0.005819***
(-4.11) Default Risk 0.0056772***
(3.08) Default Risk -0.0030054***
(-2.91) Retail Sales -0.0070962* * *
(-3.45) Change in Expected Inflation -0.0033169* *
(-2.51) Money Supply -0.0061975* **
(-3.43) Tax Revenue -0.0080668* **
(-5.76) (Oil Prices) 0.006290* * *
(3.68) (Unemployment Rate) -0.0040082* **
(-3.13) Exports -0.0059183* * *
(-3.35) Money Supply -0.002554 * **
(-2.94) Imports 0.0073832* **
(3.58) Exports -0.00187* * *
(-5.25)
Other significant factor(s) from the GARCH model: Unemployment Rates.
Oil Prices 0.0040394*** (-3.76)
Adjusted R2 69% APT Pricing Restrictions (footnote 11): H0: A = BK λ K χ2
(96) = 59.34 Approximate 5% critical value for the likelihood ratio test is χ2
(96) = 120.
Adjusted R2 61% APT Pricing Restrictions (footnote 11): H0: A = BK λ K χ2
(132) = 114.30 Approximate 5% critical value for the likelihood ratio test is χ2
(132) ≈ 160.

39
Italy United States
Factors Price of Risk Factors Price of Risk
Exchange Rates -0.007923* *
(-2.19) Changes in Expected Inflation -0.00013 ** *
(-4.01) Default Risk 0.003654* *
(2.35) Unexpected Inflation 0.000405 * *
(3.13) Tax Revenue 0.003995***
(2.98) Exchange Rates 0.0041397* * *
(5.25) Retail Sales -0.0083064* * *
(-3.62) (Default Risk) 0.001075 *
(1.610) Exports -0.0026361* * *
(-2.81) Money Supply 0.00146986 * *
(2.01) (Unemployment Rate) -0.0038906 ** *
(-2.97) Retail Sales 0.001683 * *
(2.52) Unexpected Inflation
0.001434***
(2.42) (Government Revenue) 0.002044* * *
(3.03) Housing Starts 0.003105* * *
(3.64) Other significant factor(s) from the GARCH model: Money Supply Term Structure -0.002687***
(-3.58)
Other significant factor(s) from the GARCH model: Exports
Adjusted R2 80% APT Pricing Restrictions (footnote 11): H0: A = BK λ K χ2
(69) = 30.96
Approximate 5% critical value for the likelihood ratio test is χ2 (69) = 90.
Adjusted R2 57% APT Pricing Restrictions (footnote 11): H0: A = BK λ K χ2
(144) = 126.47
Approximate 5% critical value for the likelihood ratio test is χ2 (144) = 172
Notes. Figures in parentheses are t-statistics obtained from estimating equation (3). *, **, and *** denote significance at 10%, 5%, and 1% respectively. ‘Priced’ Factor(s) in parenthesis are those that are not significant in the GARCH (1,1) model i.e. equations (7) to (10).
40
France The Netherlands
Factors Price of Risk Factors Price of Risk
Unexpected Inflation -0.0003412** *
(3.22) Unexpected Inflation -0.0010621* *
(-2.51) Default Risk -0.002964* *
(2.70) Industrial Production 0.006112 ***
(2.78) (Money Supply) 0.007725* *
(2.29) Exchange Rates -0.0037579 * **
(-3.47) Housing Starts 0.005204*
(1.64) Imports 0.010246 ** *
(4.05)
Industrial Production 0.0027746* * * (2.93)
Exports 0.004495 * * (2.07)
Imports 0.01345** (2.25)
Oil Prices 0.006749 * (1.68)
Other significant factor(s) from the GARCH model: Exchange Rates, Term Structure.
Adjusted R2 57% APT Pricing Restrictions (footnote 11): H0: A = BK λ K χ2
(50) = 26.21 Approximate 5% critical value for the likelihood ratio test is χ2
(50) = 67.
Adjusted R2 68% APT Pricing Restrictions (footnote 11): H0: A = BK λ K χ2
(49) = 30.96 Approximate 5% critical value for the likelihood ratio test is χ2
(49) = 66.
Notes. Figures in parentheses are t-statistics obtained from estimating equation (3). *, **, and *** denote significance at 10%, 5%, and 1% respectively. Priced’ Factor(s) in parenthesis are those that are not significant in the GARCH (1,1) model i.e. equations (7) to (10).
41
Table 3: Adjusted R2 from the regression of equity market risk premium on constant and the exchange rate risk premium.
Country EMS/ERM era Pre-Euro era Euro era
The Netherlands 70% 61% 17%
France 8% 5% 35%
Germany 48% 8% 55%
Italy 9% 24% 4%
UK 35% 13% 18%
USA 12% 10% 12%
Notes. The EMS/ERM era is from January 1989 to December 1993, Pre-Euro period is from January 1994 to December 1998, and the Euro era is from January 1999 to December 2004.