eu participant report feedback 2015-2016 · 1) tilastollisen tarkastelun taustoja: • vertailua...
TRANSCRIPT

EU Participant Report feedback 2015-2016
Sofia Lähdeniemi & Kiira Noponen
1) Tilastollisen tarkastelun taustoja:• Vertailua edelliseen raportoituun sopimuskauteen ei tehty, koska 2014-datan osalta vielä
suurtra vaihtelua EUSurveyn palautusasteessa
• Lisäksi komission tarjoaman datan käsiteltävyys paranatunut loppuraporttien 2014 ja 2015 välillä huomattavasti
• 2014-aineiston tarkastelu antoi arvokasta tietoa, mutta vuosisarjaa kansallisestialamme tehdä vasta 2015 EUSurvey-datan osalta.
• Yksivuotiset vs. kaksivuotiset sopimukset vaikuttavat saapuvan liikkujadataan
• Eri vaihtoehtojen yhdistäminen; esim. good vs. very good vaihtelee komission koonneissa
• Valmiiksi tuotetussa komission datassa ei ole aina aukottoman selvää, mitävaihtoehtoja/kenttiä on yhdistetty
• Datan käsitttely on nykyisessä muodossaan aikaavievää, pohdimme mielekkäintätoteutustapaa…
2
2) Tilastollisen tarkastelun taustat:• Perustuu 2015-2016 sopimuskaudella täytettyihin osallistujaraportteihin
• Bigdata on kerätty MT+ / osittain verrattu korkeakoulujen loppuraporteista generoituun tietoon
• Korkeakoulut paremmuusjärjestykseen ”very good/very satisfied” %-osuuksien mukaan
• Liikkuvuumäärät vaihtelevat korkeakouluittain
• Koko ohjelmahallinnosta esitettävät tilastot perustuvat EACEAn QlickView –järjestelmään, johon on koottu eri tietokannoista tietoa (MT+, E+ Link, Eusurveys)
3
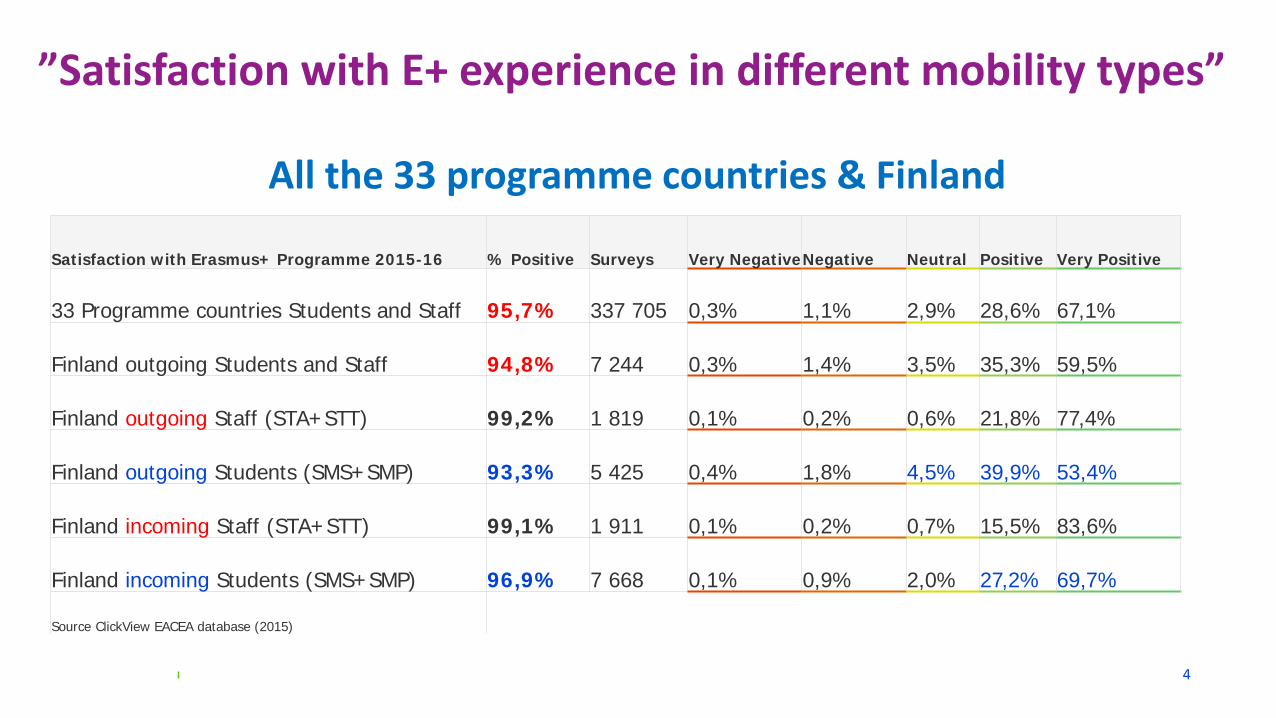
”Satisfaction with E+ experience in different mobility types”
All the 33 programme countries & Finland
Satisfaction with Erasmus+ Programme 2015-16 % Positive Surveys Very NegativeNegative Neutral Positive Very Positive
33 Programme countries Students and Staff 95,7% 337 705 0,3% 1,1% 2,9% 28,6% 67,1%
Finland outgoing Students and Staff 94,8% 7 244 0,3% 1,4% 3,5% 35,3% 59,5%
Finland outgoing Staff (STA+STT) 99,2% 1 819 0,1% 0,2% 0,6% 21,8% 77,4%
Finland outgoing Students (SMS+SMP) 93,3% 5 425 0,4% 1,8% 4,5% 39,9% 53,4%
Finland incoming Staff (STA+STT) 99,1% 1 911 0,1% 0,2% 0,7% 15,5% 83,6%
Finland incoming Students (SMS+SMP) 96,9% 7 668 0,1% 0,9% 2,0% 27,2% 69,7%
Source ClickView EACEA database (2015)
4
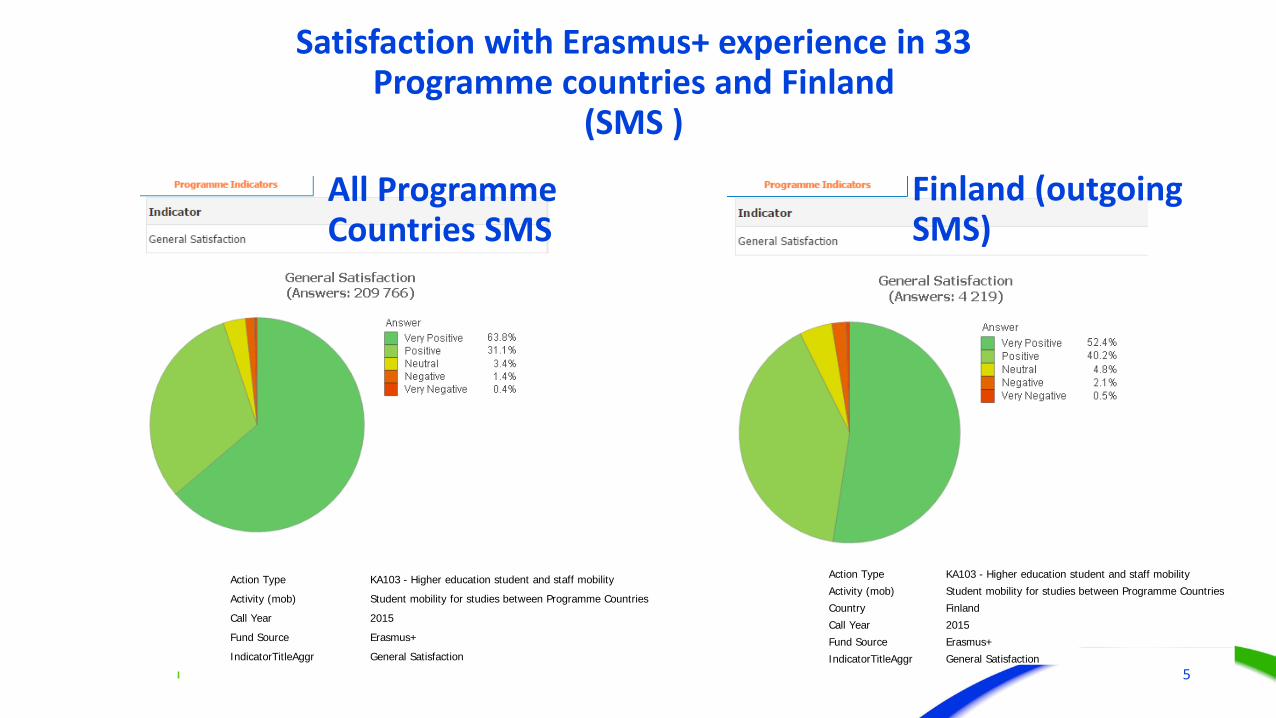
Action Type KA103 - Higher education student and staff mobilityActivity (mob) Student mobility for studies between Programme CountriesCountry FinlandCall Year 2015Fund Source Erasmus+IndicatorTitleAggr General Satisfaction
Action Type KA103 - Higher education student and staff mobilityActivity (mob) Student mobility for studies between Programme CountriesCall Year 2015Fund Source Erasmus+IndicatorTitleAggr General Satisfaction
Finland (outgoingSMS)
Satisfaction with Erasmus+ experience in 33 Programme countries and Finland
(SMS )
All ProgrammeCountries SMS
5

In Finland satisfaction with E+ experience(SMS)
52,4%40,2%
4,8%2,1% 0,5%
Finland outgoing SMS (4200 surveys)
VeryPositivePositive
Neutral
Negative
VeryNegative
70,2%
26,8%
2,0%0,9%
0,1%
Finland incoming SMS (6700 surveys)
VeryPositivePositive
Neutral
Negative
VeryNegative
6
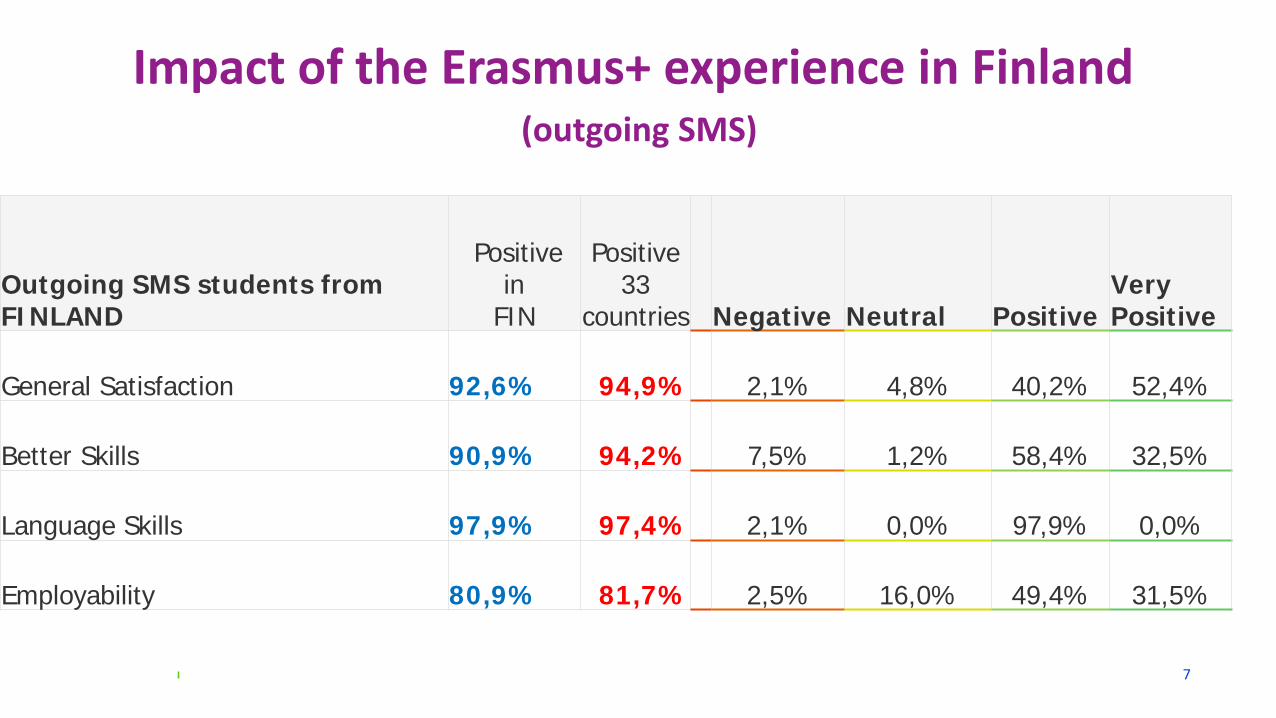
Impact of the Erasmus+ experience in Finland(outgoing SMS)
7
Outgoing SMS students from FINLAND
Positivein
FIN
Positive33
countries Negative Neutral PositiveVery Positive
General Satisfaction 92,6% 94,9% 2,1% 4,8% 40,2% 52,4%
Better Skills 90,9% 94,2% 7,5% 1,2% 58,4% 32,5%
Language Skills 97,9% 97,4% 2,1% 0,0% 97,9% 0,0%
Employability 80,9% 81,7% 2,5% 16,0% 49,4% 31,5%

Impact of Erasmus+ experience in 33 E+ Programme countries (SMS)
8
Indicator: SMS students 33 programme countries Positive Surveys
Very Negative Negative Neutral Positive
Very Positive
General Satisfaction 94,9% 209 889 0,4% 1,4% 3,4% 31,1% 63,8%
Better Skills 94,2% 209 891 0,4% 4,7% 0,7% 48,9% 45,3%
Language Skills 97,4% 179 108 0,0% 2,6% 0,0% 97,4% 0,0%
Employability 81,7% 209 891 0,6% 2,7% 14,9% 45,3% 36,4%

Satisfactionranking with the E+ experience(SMS)
Country V.Neg. Neg. Neutr. Pos. V.Pos.1Malta 0,0% 0,9% 1,4% 22,0% 75,7%
2Former Yugoslav Republic of Macedonia 0,6% 0,0% 1,3% 23,8% 74,4%3Cyprus 0,0% 0,3% 2,3% 23,4% 74,0%4Croatia 0,3% 0,5% 2,3% 23,6% 73,4%5Greece 0,3% 0,5% 2,3% 24,9% 72,1%6Bulgaria 0,3% 0,8% 2,7% 24,5% 71,6%7Slovenia 0,2% 1,4% 2,1% 25,7% 70,7%8Romania 0,2% 0,6% 2,5% 26,4% 70,3%9Italy 0,4% 1,1% 2,4% 27,2% 68,9%
10Spain 0,5% 1,1% 2,8% 27,9% 67,7%11Poland 0,3% 1,3% 2,7% 28,2% 67,4%12Slovakia 0,3% 1,0% 2,9% 28,7% 67,1%13Belgium 0,3% 1,0% 2,9% 28,8% 67,0%14Czech Republic 0,2% 1,2% 2,9% 28,7% 66,9%15France 0,3% 1,3% 2,5% 29,5% 66,5%16Portugal 0,5% 1,6% 3,4% 28,4% 66,1%17Latvia 0,5% 0,6% 2,5% 31,0% 65,5%18Austria 0,3% 1,0% 3,2% 31,4% 64,2%19Iceland 0,4% 0,9% 3,8% 31,5% 63,4%20Estonia 0,3% 1,1% 2,7% 33,6% 62,3%21Lithuania 0,4% 1,2% 4,0% 32,2% 62,2%22Netherlands 0,3% 1,4% 4,0% 33,2% 61,1%23Turkey 0,5% 1,1% 4,4% 34,3% 59,8%24Sweden 0,4% 2,1% 4,4% 33,5% 59,6%25Liechtenstein 0,0% 3,1% 3,1% 34,4% 59,4%26Hungary 0,3% 1,5% 4,0% 35,2% 58,9%27Ireland 0,9% 2,8% 5,5% 32,2% 58,6%28Germany 0,3% 1,5% 3,9% 36,7% 57,7%29Norway 0,4% 1,6% 5,8% 36,5% 55,7%30Finland 0,5% 2,1% 4,8% 40,2% 52,4%31Denmark 0,8% 2,2% 5,3% 39,2% 52,4%32United Kingdom 1,1% 3,0% 6,0% 38,3% 51,6%33Luxembourg 4,0% 6,4% 11,9% 41,5% 36,2%
9

Highest satisfaction with E+ experience (SMS)
Outgoing SMS Ingoming SMS
ARCADA 76% TAIDEYLIOPISTO
62%OAMK 63%
KARELIA 81% Taideyliopisto
78%
VAASAN AMK 80%
Best performing HEIs…
10
Outgoing students(SMS) feedback
11

Best performing HEIs……at signing Learning Agreement by all parties
before the start of the mobility (outgoing SMS)
HEIs average 80%
Kajaanin amk 97%
Arkada 94%Centria 95%
12

Best performing HEIs…
62% 56%54%
…at making information available about gradingconvertion before the mobility (outgoing SMS)
HEIs average 37%
13

…at having transparent and fair selection process for outgoing students (SMS)
86% 84%83%
Best performing HEIs…
HEIs average 74%
14

…with highest satisfaction with administrativesupport arrangements for outgoing students
(SMS)
TAIDE-YLIOPISTO
77% VAASAN YLIOPISTO 57%
ARCADA 61%
Best performing HEIs…
HEIs average 41%
15

To what extent did the Erasmus+ grant (EU funds only) cover your overall expenses related to your mobility period?
(Outgoing SMS)
42 %
43 %
12 %
3 %OUTGOING MOBILITY FOR STUDIES
0-25%
26-50%
51-75%
76-100%
16

Incoming students(SMS) feedback
17

…with most up-to-date, published and available on time and complete course catalogues (incoming SMS)
LUT 46%HANKEN 39%
TTY 46%
Best performing HEIs…
HEIs average 41%
JAMK 39%
18
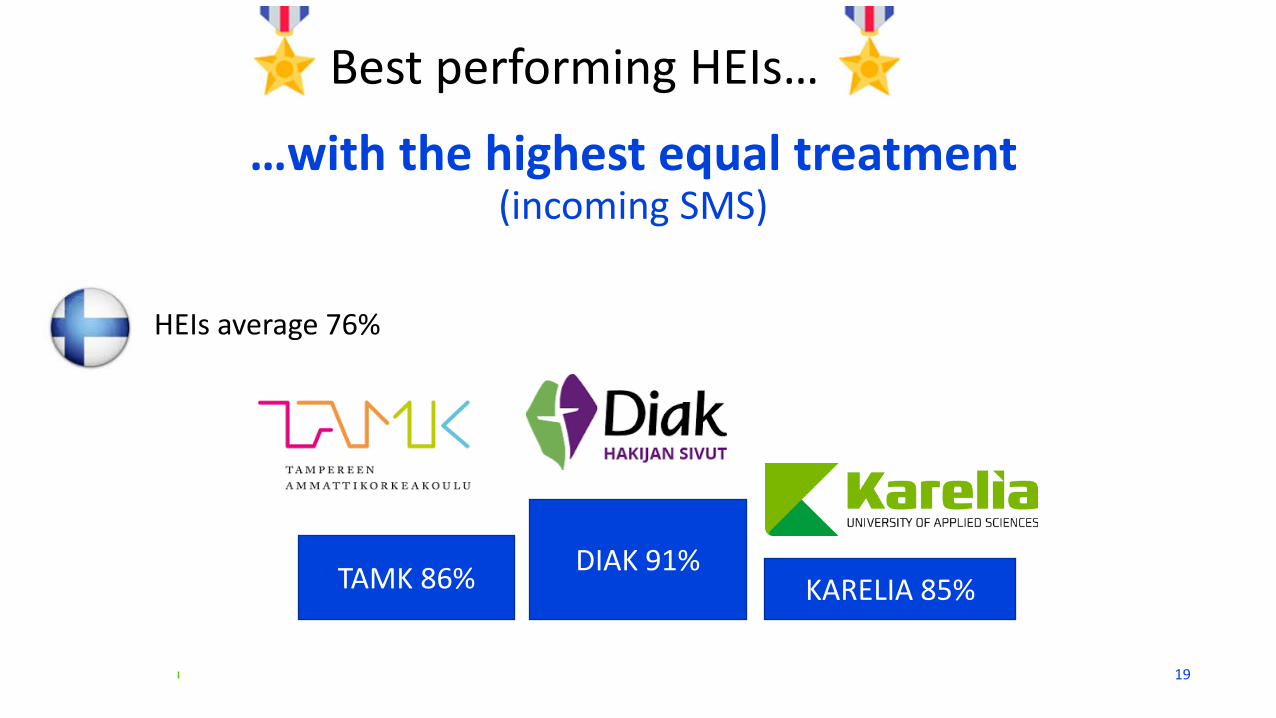
…with the highest equal treatment(incoming SMS)
DIAK 91%KARELIA 85%TAMK 86%
Best performing HEIs…
HEIs average 76%
19

…with the highest teaching quality satisfaction(incoming SMS)
TAIDEYLIOPISTO 69%
VAMK 55%JAMK 56%
Best performing HEIs…
HEIs average 40%
20
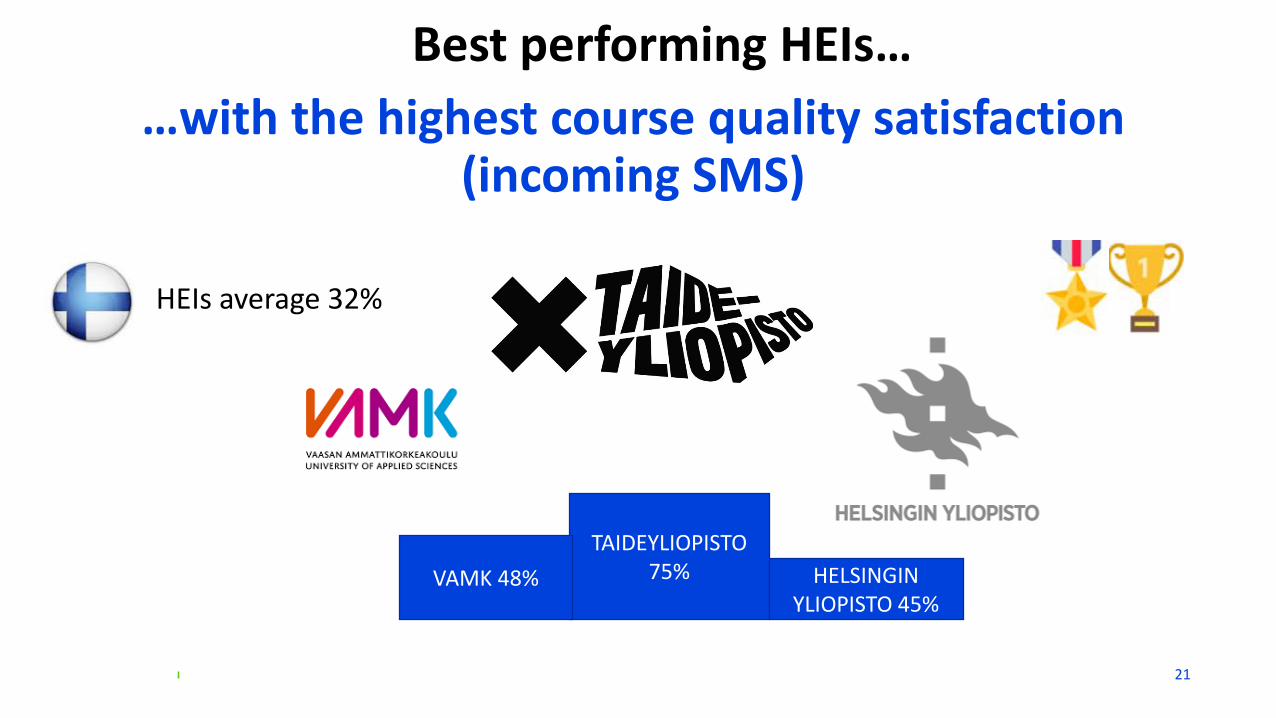
…with the highest course quality satisfaction(incoming SMS)
TAIDEYLIOPISTO 75% HELSINGIN
YLIOPISTO 45%VAMK 48%
Best performing HEIs…
HEIs average 32%
21
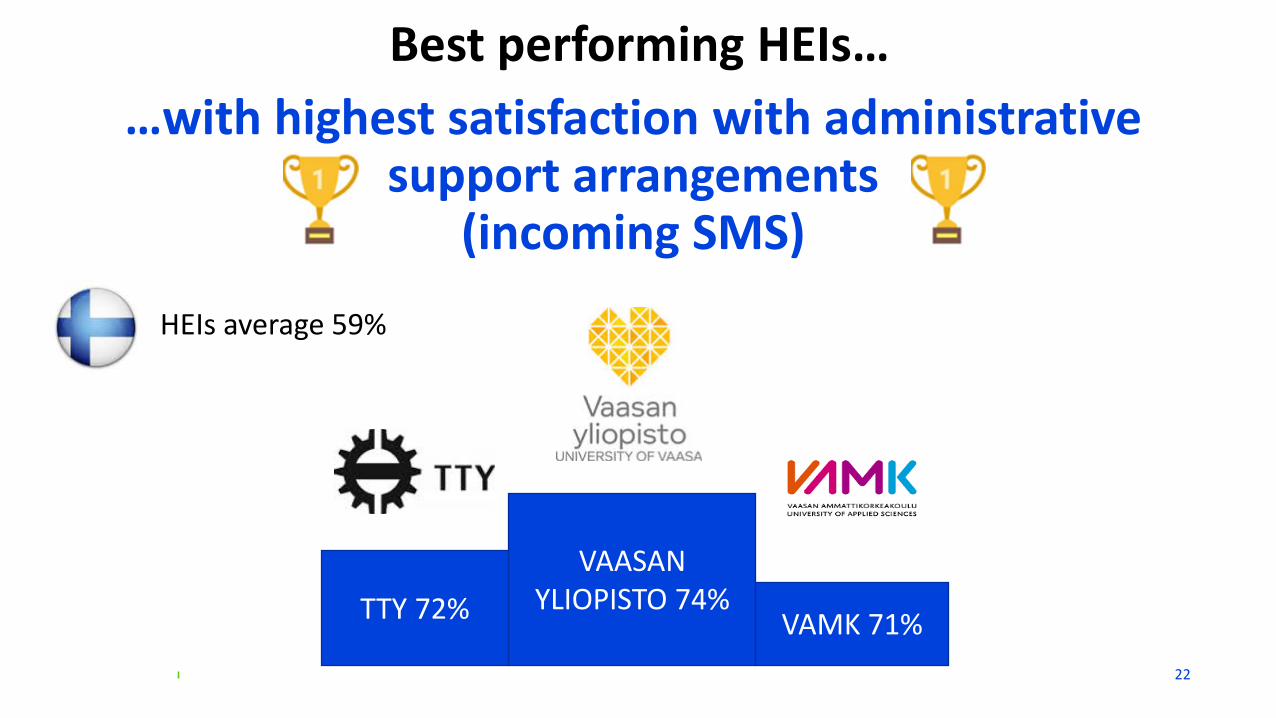
…with highest satisfaction with administrativesupport arrangements
(incoming SMS)
VAASAN YLIOPISTO 74%
VAMK 71%TTY 72%
Best performing HEIs…
HEIs average 59%
22

…Opintojen hyväksiluku “full recognition”
96%Oulun
yliopisto&
Hanken91%
TUAMK, JAMK, KYAMK
94 %Karelia, LUT
& Aalto
Best performing HEIs…
23

Kiitos!