eu climate policies by 2030 and · pdf fileeu climate policies by 2030 and beyond . jos...
TRANSCRIPT

Climate Action
EU climate policies by 2030 and beyond
Jos Delbeke
Director-General DG Climate Action - European Commission
University of Macao– 22 May 2014

Climate Action
Outline 1. International climate issues
• The road to Paris
• Emissions: global and regional
2. EU Climate Change Policy:
• EU climate action until 2020
• New Climate and Energy Framework 2030
3. Conclusions

Climate Action
Road to Paris (1): UNFCCC broadening global climate action well beyond Kyoto
• Global agreement on staying below 2°Celsius (Copenhagen/Cancun)
• Around 100 countries responsible for > 80% of global GHG emissions made concrete emission pledges (Copenhagen/Cancun), including all major economies
• Growing global action, but fragmented and diverse
3

Climate Action
Road to Paris (2): Outcomes in Warsaw
1. Progress on 2015 Agreement All Parties to prepare intended nationally determined contributions by the first quarter of 2015 by those Parties ready to do so)"; transparency and clarity
2. Enhancing pre-2020 ambition Agreed technical process, international collaborative initiatives, ratch up ambition, fora for cities and business
3. Climate finance Pathways to deliver US$100 bn; Green Climate Fund to deliver in 2014; Pledges for Adaptation Fund and REDD+

Climate Action
Road to Paris (3): Negotiator's calendar until end 2014
• 4–15 June Inter-sessional meeting, Bonn (incl. Ministerial meetings)
• 23 September Leaders' Summit, New York
• 1-12 Dec. 2014 - COP/CMP: Lima

Climate Action
6
the analytics of 2°C: global peak by 2020 and deep cuts by 2050

Climate Action
CO2 emissions - top 6 countries and the EU
CO2 emissions from fossil-fuel use and cement production in the top 6 emitting countries and the EU. Source: EDGAR 4.2FT2010
2012 emissions - US and EU combined

Climate Action
CO2 emissions per capita
CO2 emissions per capita from fossil-fuel use and cement production in the top 6 emitting countries and the EU Source: EDGAR 4.2FT2010 (1990–2010)

Climate Action
4.000
4.200
4.400
4.600
4.800
5.000
5.200
5.400
5.600
5.800
KP
BY 1990
1991
1992
1993
1994
1995
1996
1997
1998
1999
2000
2001
2002
2003
2004
2005
2006
2007
2008
2009
2010
2011
2012
2013
2014
2015
2016
2017
2018
2019
2020
Mt C
O2 e
quiv
alen
t
EU-28 +IS historic emissions EU-28 projections With Existing Measures
estimated overachievement compared to target 2013-20 Target for the 1st commitment period (2008–2012)
Target for the 2nd commitment period (2013–2020)
CP1 Kyoto Mechanisms
CP1 C.sinks
4.2 GtCO2 eq
1.3 GtCO2 eq
5.5 GtCO2 eq
Potential Overachievement CP2:
Total :
Potential Overachievement CP1:
EU climate action until 2020

Climate Action
EU cutting GHG emissions while growing the economy
GDP +45%
GHG emissions -18%

Climate Action
-20%
2084 Mt/yr Gradient: -1.74%
2010 2011 2012 2013 2014 2015 2016 2017 2018 2019 2020 2021 2022 2023 2024
Starting point: 1977 Mt in 2013
1723 Mt
Revision of linear factor until 2025 Inclusion of aviation does not affect cap for stationary installations Disclaimer: figures are only for illustration and do not take into account extended scope as from 2013
EU ETS (1)

Climate Action
12
CO2 FROM CARS

Climate Action
Investments globally increasing rapidly
33%
27%
15%
25% Europe
China
USA
Other
Share of global investment in renewable energy, 2012
10%
15%
20%
25%
30%
35%
40%
45%
2006 2007 2008 2009 2010 2011 2012
Share renewables in globally newly installed power capacity
Source: UNEP, Global trends in renewable energy investment 2013

Climate Action
Costs for Renewables:decreasing and becoming competitive
Source: Bloomberg New Energy Finance
Costs for solar energy decreased by 80% from 2008-2012 and continue (20% in 2012)
Costs for wind decreased by 29% from 2008-2012

Climate Action
EU climate action until 2020: Climate finance
• The EU has over-delivered on fast start finance pledge: €7.34 billion 2010-2012
• EU is delivering €5.5 billion for 2013; • EU budget 2014-2020 to mainstream climate
change: >20% of budget must be climate-relevant
Climate Action
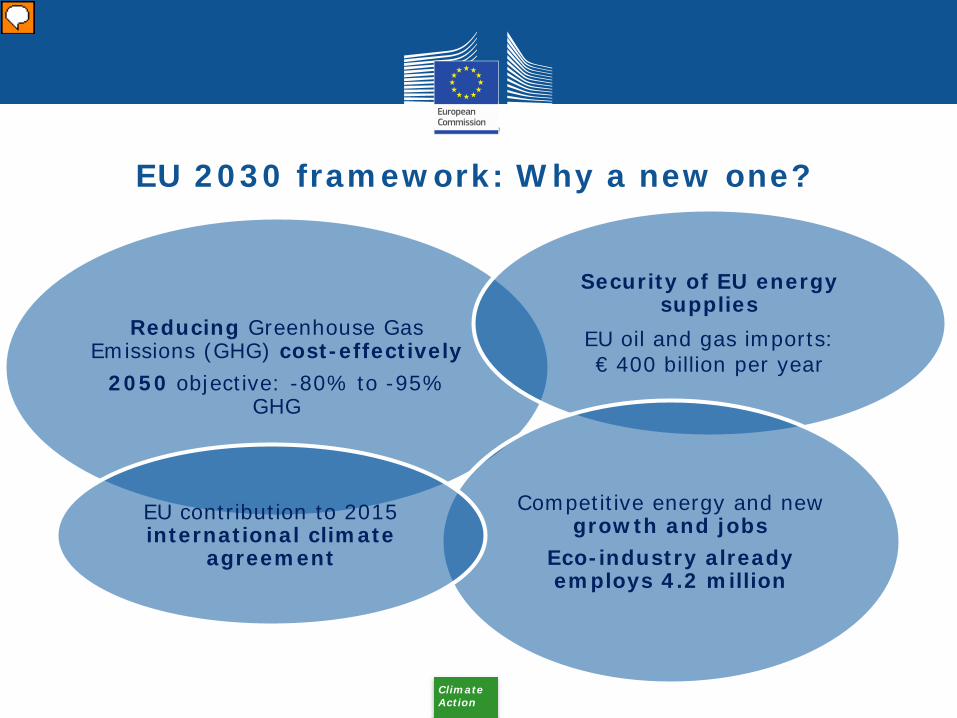
Reducing Greenhouse Gas Emissions (GHG) cost-effectively
2050 objective: -80% to -95% GHG
Security of EU energy supplies
EU oil and gas imports: € 400 billion per year
Competitive energy and new growth and jobs
Eco-industry already employs 4.2 million
EU contribution to 2015 international climate
agreement
EU 2030 framework: Why a new one?

Climate Action
A cost-efficient pathway towards 2050
additional investment: +1.5 % GDP annually on average. fuel savings over time of similar magnitude
80% domestic reduction in 2050 is feasible: • With currently
available technologies, • all economic sectors
contribute to a varying degree & pace.
0%
20%
40%
60%
80%
100%
1990 2000 2010 2020 2030 2040 20500%
20%
40%
60%
80%
100%
Current policyPower Sector
Residential & Tertiary
Non CO2 Other Sectors
Industry
Transport
Non CO2 Agriculture
17

Climate Action
EU 2030 Framework: The main components
-20 % Greenhouse
Gas Emissions
- 40 % Greenhouse
Gas Emissions
20% Renewable
Energy
20 % Energy
Efficiency
Min 27 %
Renewable Energy
Review 2014
2020
2030 New Key Indicators
New Governance system

Climate Action
Conclusions
• Science is clear • Urgent action is required – mitigation and
adaptation • Less than 20 months to Paris: Ideally, all
countries finalise domestic contributions by 1st quarter 2015.
• EU: growing its economy while reducing its emissions – until 2020 and beyond to 2030

Climate Action

Climate Action
Thank you !
http://world-you-like.europa.eu/en/