ethoxylation studies of two mole amine...
TRANSCRIPT
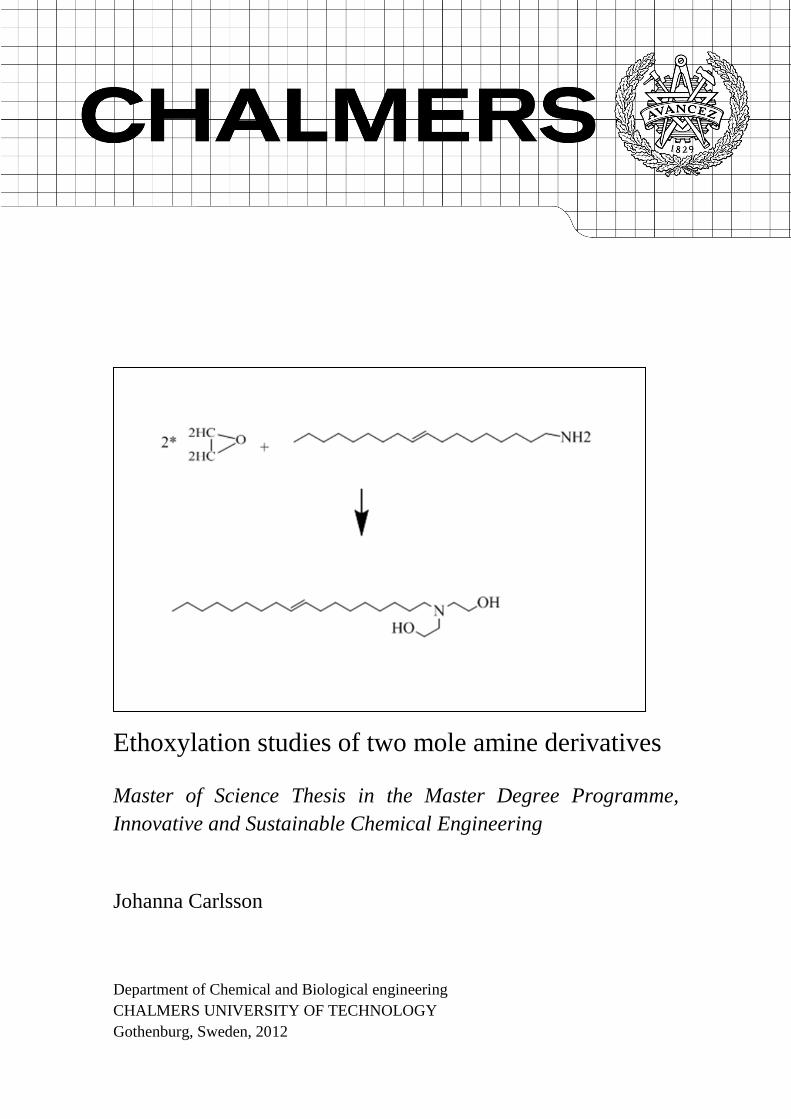
Ethoxylation studies of two mole amine derivatives
Master of Science Thesis in the Master Degree Programme,
Innovative and Sustainable Chemical Engineering
Johanna Carlsson
Department of Chemical and Biological engineering
CHALMERS UNIVERSITY OF TECHNOLOGY
Gothenburg, Sweden, 2012
Ethoxylation studies of two mole amine derivatives
Master of Science Thesis
Johanna Carlsson
Supervisor: Anders Paalberg and Hans Oskarsson
Examiner: Derek Creaser
Department of Chemical and Biological engineering
CHALMERS UNIVERSITY OF TECHNOLOGY
Gothenburg, Sweden, 2012

Ethoxylation studies of two mole amine derivatives
JOHANNA CARLSSON
©JOHANNA CARLSSON, 2012
Department of Chemical and Biological Engineering
Chalmers University of Technology
SE-412 96 Göteborg
Sweden
Telephone +46 (0)31-7721000
Göteborg, Sweden 2012
Ethoxylation studies of two mole amine derivatives
JOHANNA CARLSSON
Department of Chemical and Biological Engineering
Chalmers University of Technology
Abstract
This thesis aims to optimize the two mole ethoxylation of a fatty amine. The influence
of temperature, pressure, water and starter on the process was studied. The starter and
water was added to the process as catalysts. Trials were made in three scales, lab, pilot
and full scale.
To be able to draw conclusions from all the trials an experimental design was made in
the program MODDE. The design was made for the lab scale trials and all the
parameters were changed to be able to make a model where the interactions between the
parameters were not ignored. The design was a full factorial design were the parameters
are given a high and a low value and all the combinations are tried which led to 19 trails
being performed in lab scale. The products from these trials were analysed for
conversion, dioxane content, colour, chain elongation and ethylene oxide distribution.
The methods used for the analysis were titration, GC headspace, colour measurements
and NMR.
From the results of the lab scale trails the experiments in the pilot scale were designed.
The parameters that were investigated in the pilot scale were temperature and pressure
since it was concluded that starter and water did not have a very positive impact on the
process.
The pilot trials indicated that the temperature, 170 degrees Celsius, used in the trials
gave the best results. Dividing the feed of the ethylene oxide into two parts could also
be beneficial to the process. To do that change in full scale more pilot scale trials are
needed.
The full scale indicates that the existing settings are not optimal since the results for the
lower temperature in the full scale trials, 170 degrees Celsius, give better results. The
conclusion of the trials is that more experiments must be performed but a platform for
further investigation is created by this thesis.
Table of Contents
1. Introduction ......................................................................................................................................... 1
1.2. Purpose ............................................................................................................................................. 2
2. Background ......................................................................................................................................... 2
2.1. Surfactants .................................................................................................................................. 2
2.1.1. Anionic surfactants ................................................................................................................... 2
2.1.2. Cationic surfactants ................................................................................................................... 3
2.1.3. Zwitterionic surfactants............................................................................................................. 3
2.1.4. Non-ionic surfactants ................................................................................................................ 3
2.2. Ethylene oxide ............................................................................................................................ 4
2.3. Fatty amines ................................................................................................................................ 5
2.4. Experimental design .................................................................................................................... 6
2.5. Analytical methods ..................................................................................................................... 7
2.5.1 NMR .......................................................................................................................................... 7
2.5.2. GC ............................................................................................................................................. 7
2.5.3. Titration .................................................................................................................................... 7
2.5.4. Colour measurement ................................................................................................................. 8
2.6. Process description...................................................................................................................... 8
3. Experimental ....................................................................................................................................... 9
3.1. Experimental design .................................................................................................................... 9
3.2. Material and method ................................................................................................................. 11
3.3. Characterization of products ..................................................................................................... 12
3.3.1. Titration .................................................................................................................................. 12
3.3.2. NMR ....................................................................................................................................... 13
3.3.3 GC ............................................................................................................................................ 14
3.3.4. Colour ..................................................................................................................................... 15
4. Results and discussion ...................................................................................................................... 15
4.1. Lab scale ................................................................................................................................... 15
4.2. Pilot scale .................................................................................................................................. 22
4.3. Full scale ................................................................................................................................... 24
5. Conclusion ........................................................................................................................................ 25
6. Recommendations and further work ................................................................................................. 25
Acknowledgements .................................................................................................................................... 27
References .................................................................................................................................................. 28
Appendix .......................................................................................................................................................I
Appendix 1. ..............................................................................................................................................I
Appendix 2. ........................................................................................................................................... IV
Appendix 3. ............................................................................................................................................ V
Appendix 4. ..................................................................................................................................... XVIII
1
1. Introduction This Master thesis project has been executed at Akzo Nobel Surface Chemistry’s
research and development facility in Stenungsund, Sweden. A part of the work has also
been performed in the production site at the same location. The work has been both a
literature study and an experimental study. The work was performed over a period of
twenty weeks starting in January 2012.
Akzo Nobel Surface Chemistry AB is a world leading supplier of specialty surfactants.
They are producing anionic, non-ionic, cationic and zwitterionic surfactants that are
used in products ranging from asphalt, cleaning, and petroleum to different food
additives. This means that every day you use and consume a lot of different surfactants.
The aim of this thesis was to investigate and optimize the two mole ethoxylation of
amine derivatives. The investigation will cover both the chemistry and the process of
producing this product.
The raw materials for the investigated product are fatty amines and ethylene oxide. The
fatty amines can come from natural sources or petrochemical sources. Fatty amines are
named primary, secondary or tertiary depending on how many hydrogen atoms on the
nitrogen atom that are replaced by a carbon chain. The fatty amine used in this project is
a primary fatty amine which means that there are two hydrogen atoms on the nitrogen
that are replaced with ethylene oxide (EO). EO is produced by the petrochemical
industry and it is a very reactive compound.
The product is sold for different applications but also used as raw material for many
polyethoxylated surfactants which means that the distribution of the EO is very
important. A varied distribution of EO could lead to colouring, dioxane formation and
other changed properties which all are affecting the quality of the product.
The experimental part of this thesis has been performed in a lab scale autoclave, a pilot
plant and in the full scale process. The lab scale autoclave was a 2,5L stainless steel
reactor with a stirrer and a heating and cooling system. The reaction conditions were
altered to see how different parameters influenced the final product. The parameters that
were altered were pressure, temperature, starter and water. The starter and water were
added as initiators to the reaction. The experimental design was made in the program
MODDE and the analysis results were used by the program to make a model that can be
used to predict results for other trials within the range of the parameters.
The results from the lab scale trials were used to make a small pilot plant trial set up
which in turns were used to decide which experiments that should be performed in full
scale.

2
1.2. Purpose The purpose of this project was to investigate the influence of temperature, pressure,
starter and water on the ethoxylation of a fatty amine with the purpose of optimizing the
process. The starter is the finished product that was added to the process to shorten the
induction step in the process. To be able to do this investigation trials in lab, pilot and
full scale were performed.
This should be performed without any changes to the process set up.
2. Background To give a brief introduction to the project and the execution of the project some topics
need an introduction. These topics will be introduced in the following section of the
report.
2.1. Surfactants Surfactants, or surface active agents, are compounds that absorb at surfaces or
interfaces. The reason that these compounds are surface active is that they are
amphiphilic which means that they have a hydrophobic part, the tail, and a hydrophilic
part, the head see figure 1. This property causes the molecule to be present in two
phases. This leads to a lowering of the surface tension, or interfacial tension, which in
turns improves the possibility of creating stable emulsions. This is true since a lower
interfacial tension means that the ability to expand the interface is increased and
bubbles, drops or particles are then easier to suspend in a mixture. There are different
types of surfactants and they are classified by their head group which can be non-ionic,
anionic, cationic or zwitterionic. The tail of any surfactant normally consists of a carbon
chain (1).
Figure 1. Surfactant with a hydrophilic head and a hydrophobic tail.
2.1.1. Anionic surfactants
The anionic surfactants have a negatively charged head group that most commonly
consists of sulphate, sulphonate, carboxylate or phosphate. Anionic surfactants are the
most common surfactants used today and one of the areas where the anionic surfactants
are most used is detergents. The main reasons for using anionic surfactants are the ease
of manufacturing and the low cost of production. One common anionic surfactant, alkyl
sulphate, can be seen in figure 2 (1).
3
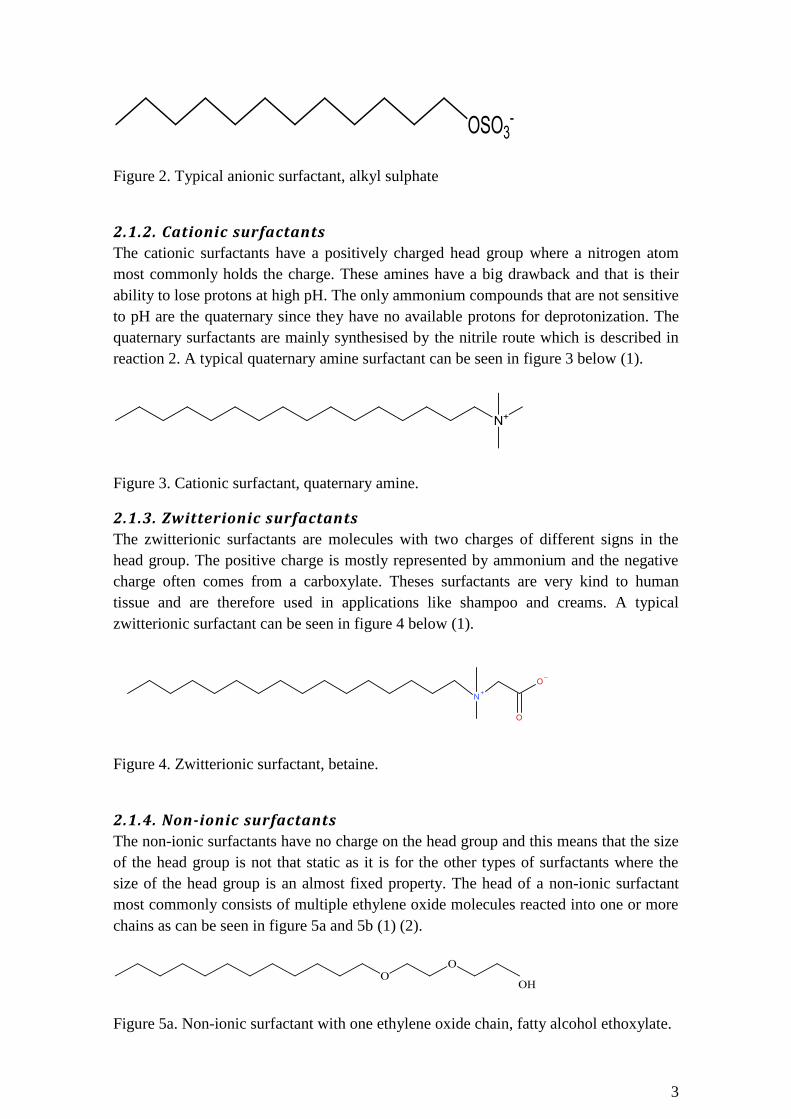
Figure 2. Typical anionic surfactant, alkyl sulphate
2.1.2. Cationic surfactants
The cationic surfactants have a positively charged head group where a nitrogen atom
most commonly holds the charge. These amines have a big drawback and that is their
ability to lose protons at high pH. The only ammonium compounds that are not sensitive
to pH are the quaternary since they have no available protons for deprotonization. The
quaternary surfactants are mainly synthesised by the nitrile route which is described in
reaction 2. A typical quaternary amine surfactant can be seen in figure 3 below (1).
Figure 3. Cationic surfactant, quaternary amine.
2.1.3. Zwitterionic surfactants
The zwitterionic surfactants are molecules with two charges of different signs in the
head group. The positive charge is mostly represented by ammonium and the negative
charge often comes from a carboxylate. Theses surfactants are very kind to human
tissue and are therefore used in applications like shampoo and creams. A typical
zwitterionic surfactant can be seen in figure 4 below (1).
Figure 4. Zwitterionic surfactant, betaine.
2.1.4. Non-ionic surfactants
The non-ionic surfactants have no charge on the head group and this means that the size
of the head group is not that static as it is for the other types of surfactants where the
size of the head group is an almost fixed property. The head of a non-ionic surfactant
most commonly consists of multiple ethylene oxide molecules reacted into one or more
chains as can be seen in figure 5a and 5b (1) (2).
Figure 5a. Non-ionic surfactant with one ethylene oxide chain, fatty alcohol ethoxylate.

4
Figure 5b. Non-ionic surfactant with two ethylene oxide chains, fatty amine ethoxylate.
The number of added ethylene oxide monomers depends on the intended use of the
surfactant and since a longer chain of ethylene oxide gives a larger hydrophilic part
these kinds of surfactants are used as solubilizers and cleansing agents (3). The
surfactant of interest in this thesis is used as an additive in polyester plastics to reduce
static electricity. To be able to form longer chains of EO on the fatty amine, a catalyst is
needed.
2.2. Ethylene oxide Ethylene oxide is an epoxide which is a compound with a three membered ring, a cyclic
ring, and is also called oxirane. Epoxides are manufactured from alkenes but they are
also found in nature where they are used as an insecticide since the epoxides react with
DNA or essential enzymes causing the insects to die since their normal functions are
prevented (4).
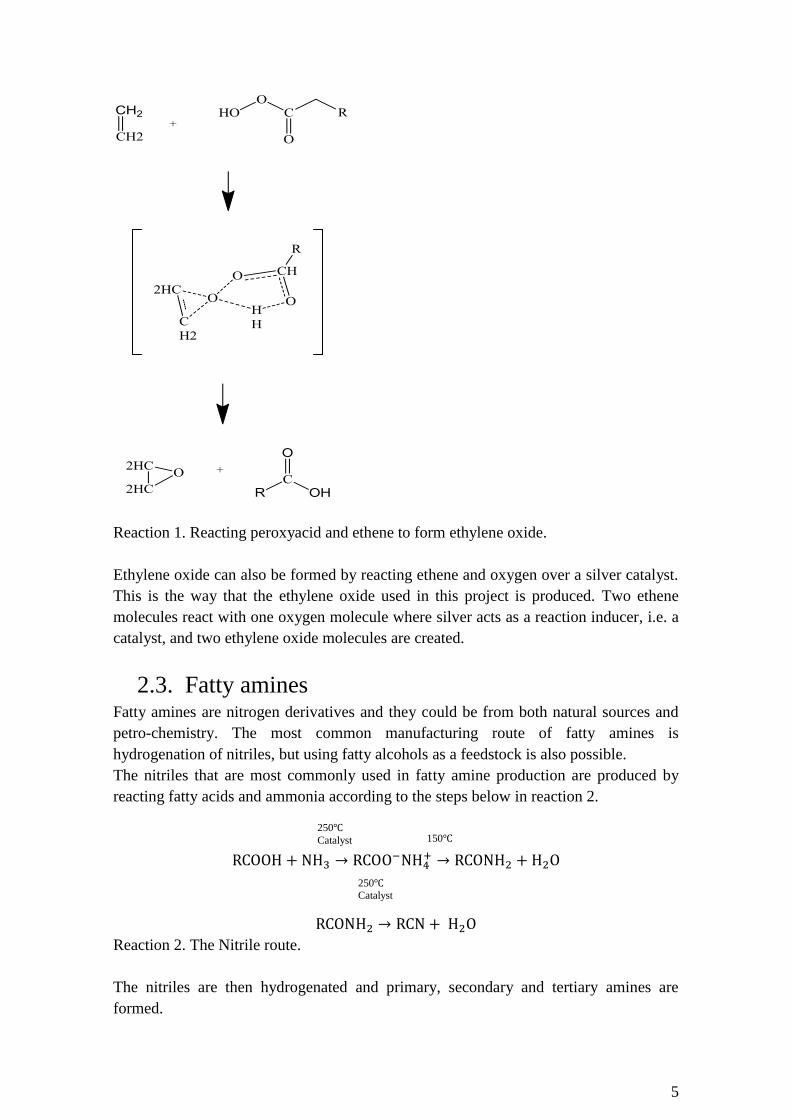
There are different ways of making an epoxide, an alkene can be reacted with oxygen
over a silver catalyst or the alkene can be reacted with a peroxyacid. The reaction with a
peroxyacid is a reaction where multiple bonds are broken and created at the same time
which is shown in reaction 1.
5
250℃
Catalyst
250℃ Catalyst 150℃
Reaction 1. Reacting peroxyacid and ethene to form ethylene oxide.
Ethylene oxide can also be formed by reacting ethene and oxygen over a silver catalyst.
This is the way that the ethylene oxide used in this project is produced. Two ethene
molecules react with one oxygen molecule where silver acts as a reaction inducer, i.e. a
catalyst, and two ethylene oxide molecules are created.
2.3. Fatty amines Fatty amines are nitrogen derivatives and they could be from both natural sources and
petro-chemistry. The most common manufacturing route of fatty amines is
hydrogenation of nitriles, but using fatty alcohols as a feedstock is also possible.
The nitriles that are most commonly used in fatty amine production are produced by
reacting fatty acids and ammonia according to the steps below in reaction 2.
Reaction 2. The Nitrile route.
The nitriles are then hydrogenated and primary, secondary and tertiary amines are
formed.
6
The carbon chains in a product can vary in length or be of a specific length but that puts
higher demands on the feedstock. To achieve a product with a narrow range in carbon
chains the fatty amine is distillated. It is very common to have carbon chains in some
specific length interval, for example C16-C18. There could also be unsaturations in the
carbon chain depending on the origin of the feedstock. When a fatty amine has coconut
oil as feedstock the degree of saturation varies, meaning that the number of
unsaturations can vary (5).
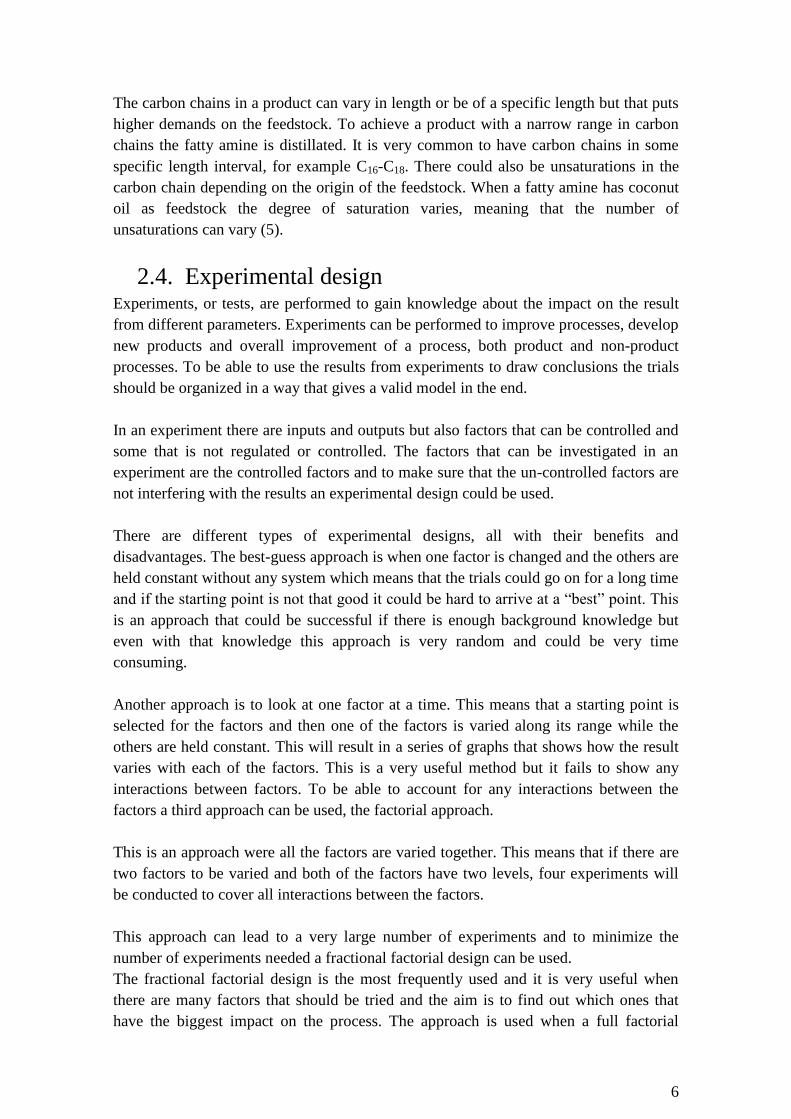
2.4. Experimental design Experiments, or tests, are performed to gain knowledge about the impact on the result
from different parameters. Experiments can be performed to improve processes, develop
new products and overall improvement of a process, both product and non-product
processes. To be able to use the results from experiments to draw conclusions the trials
should be organized in a way that gives a valid model in the end.
In an experiment there are inputs and outputs but also factors that can be controlled and
some that is not regulated or controlled. The factors that can be investigated in an
experiment are the controlled factors and to make sure that the un-controlled factors are
not interfering with the results an experimental design could be used.
There are different types of experimental designs, all with their benefits and
disadvantages. The best-guess approach is when one factor is changed and the others are
held constant without any system which means that the trials could go on for a long time
and if the starting point is not that good it could be hard to arrive at a “best” point. This
is an approach that could be successful if there is enough background knowledge but
even with that knowledge this approach is very random and could be very time
consuming.
Another approach is to look at one factor at a time. This means that a starting point is
selected for the factors and then one of the factors is varied along its range while the
others are held constant. This will result in a series of graphs that shows how the result
varies with each of the factors. This is a very useful method but it fails to show any
interactions between factors. To be able to account for any interactions between the
factors a third approach can be used, the factorial approach.
This is an approach were all the factors are varied together. This means that if there are
two factors to be varied and both of the factors have two levels, four experiments will
be conducted to cover all interactions between the factors.
This approach can lead to a very large number of experiments and to minimize the
number of experiments needed a fractional factorial design can be used.
The fractional factorial design is the most frequently used and it is very useful when
there are many factors that should be tried and the aim is to find out which ones that
have the biggest impact on the process. The approach is used when a full factorial
7
design is too time consuming or costly and the purpose is to reduce the number of
experiments without impacting the conclusions and results of the design. The drawback
with the fractional factorial design is that higher order interactions are not included in
the model (6).
2.5. Analytical methods Several analytical methods have been used to gain knowledge of the products and to be
able to draw conclusions from the trials. In the following chapter these methods will be
explained.
2.5.1 NMR
Nuclear magnetic resonance, NMR, is a property or phenomena that only some atoms
posses. The atoms that have the ability to give a NMR signal have a property called
nuclei spin which means that the nuclei acts like a magnet which is spinning around an
axis. When a compound containing atoms with this property is placed in a strong static
magnetic field during which the sample is also subjected to an electromagnetic energy
at an appropriate frequency the nuclei of the atom absorb some of the energy which
results in a unique spectrum for all compounds. The frequency of the electromagnetic
energy depends on what type of nuclei that is examined. Hydrogen and carbon (C13
) is
the most common nucleus to observe since these spectrums can give information of the
structure of most small organic compounds (7) (8).
2.5.2. GC
Gas chromatography is a separation method of a gas with multiple compounds. Often a
liquid is inserted and evaporated inside the GC but a sample could also be taken from
the headspace of gas (9). This is used when the most volatile compounds in a sample are
to be quantified. The sample container is then heated up to a specific temperature
depending on the substance to be quantified and then the sample is withdrawn from the
gas phase of the container. This is the method used in this thesis for quantifying the
dioxane in the samples. After the separation of the compounds in the gas, the
compounds are detected by different detectors to quantify and determine what
compound it is. To be able to quantify a substance a standard with a known
concentration of the specific compound of interest must be added to the sample (10).
2.5.3. Titration
Titration is a method of quantifying a compound in a solution. This is done by addition
of a titrant that interacts with the compound of interest in the solution. The interaction is
a result from mixing acid and base. When the reaction is complete the needed volume of
titrant is known and this also means that you know the concentration of the compound
in the solution if the molar stoichiometry of the reaction is known and the amount of
added sample is known. The titrant varies with the compound that is titrated and also the
way of detecting complete reaction varies. In this project an electrode was used as
detector to define the point of equilibrium and perchloricacid was used as a titrant (10).
8
2.5.4. Colour measurement
Many products have a colour specification which means that the colour must be
measured. The colour is measured by subjecting the sample to light of specific
wavelength and detecting changes in the waves that go through the sample. Colour
rarely impacts the chemistry and function of the compound but a coloured product is
hard to use in a transparent end product.
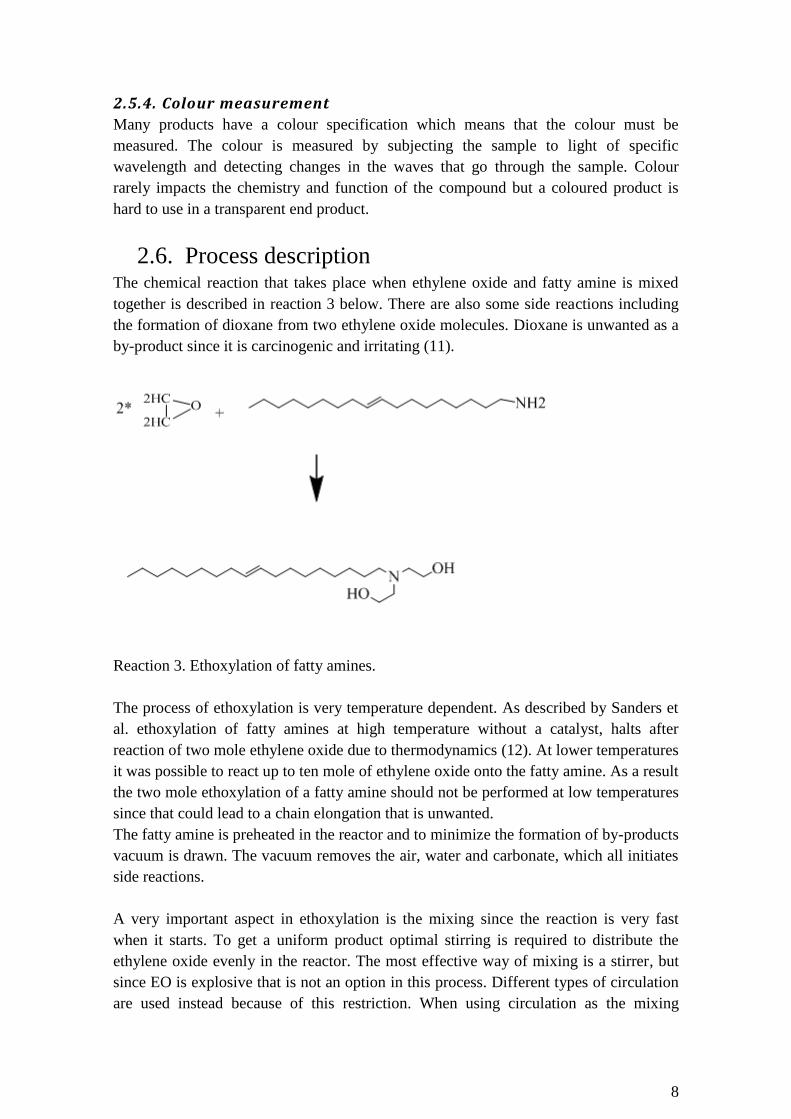
2.6. Process description The chemical reaction that takes place when ethylene oxide and fatty amine is mixed
together is described in reaction 3 below. There are also some side reactions including
the formation of dioxane from two ethylene oxide molecules. Dioxane is unwanted as a
by-product since it is carcinogenic and irritating (11).
Reaction 3. Ethoxylation of fatty amines.
The process of ethoxylation is very temperature dependent. As described by Sanders et
al. ethoxylation of fatty amines at high temperature without a catalyst, halts after
reaction of two mole ethylene oxide due to thermodynamics (12). At lower temperatures
it was possible to react up to ten mole of ethylene oxide onto the fatty amine. As a result
the two mole ethoxylation of a fatty amine should not be performed at low temperatures
since that could lead to a chain elongation that is unwanted.
The fatty amine is preheated in the reactor and to minimize the formation of by-products
vacuum is drawn. The vacuum removes the air, water and carbonate, which all initiates
side reactions.
A very important aspect in ethoxylation is the mixing since the reaction is very fast
when it starts. To get a uniform product optimal stirring is required to distribute the
ethylene oxide evenly in the reactor. The most effective way of mixing is a stirrer, but
since EO is explosive that is not an option in this process. Different types of circulation
are used instead because of this restriction. When using circulation as the mixing

9
method the distribution of ethylene oxide becomes a very important parameter in the
system.
A system where the circulated liquid is returned over the top of the reactor without any
distribution of significance the EO feed will end up in the free gas volume above the
liquid surface and only the fatty amines at the top of the reactor will be able to react. If
the feed of EO is sufficiently slow the concentration of EO in the reactor will be even
but if the feed is to fast the distribution of EO will be very uneven throughout the
reactor.
A way of improving the process system is to distribute the circulated liquid with spray
nozzles resulting in better mixing of the EO and fatty amine (13).
The reaction pressure is often a fixed variable meaning that the EO feed is regulated by
the pressure inside the reactor. This could lead to problems when the amount of raw
material fed to every batch can differ leading to differences in free volume.
3. Experimental The 2 mole ethoxylation of fatty amine is the process studied in this project and the
project has included trials in three different scales, lab, pilot and full scale. In lab scale a
rigorous experimental design was used to investigate the influence of temperature,
pressure, water and starter (14) (15). Where starter was the finished product, used as a
catalyst to shorten the induction step. The use of water has the same purpose as the use
of a starter, to reduce reaction time by shortening the induction step.
3.1. Experimental design To gain as much knowledge as possible from the series of experiments conducted, a
design of experiments was made using the program MODDE. The parameters of
interest were put into the program with the upper and lower limits specified. Then a
model is chosen and the program generates an experimental design where the trial order
is given to minimize interferences from previous trials and surroundings on the model.
The model calculated by the program after inserting the specified results of the trials can
then be used to predict the parameter settings to obtain the best possible result.
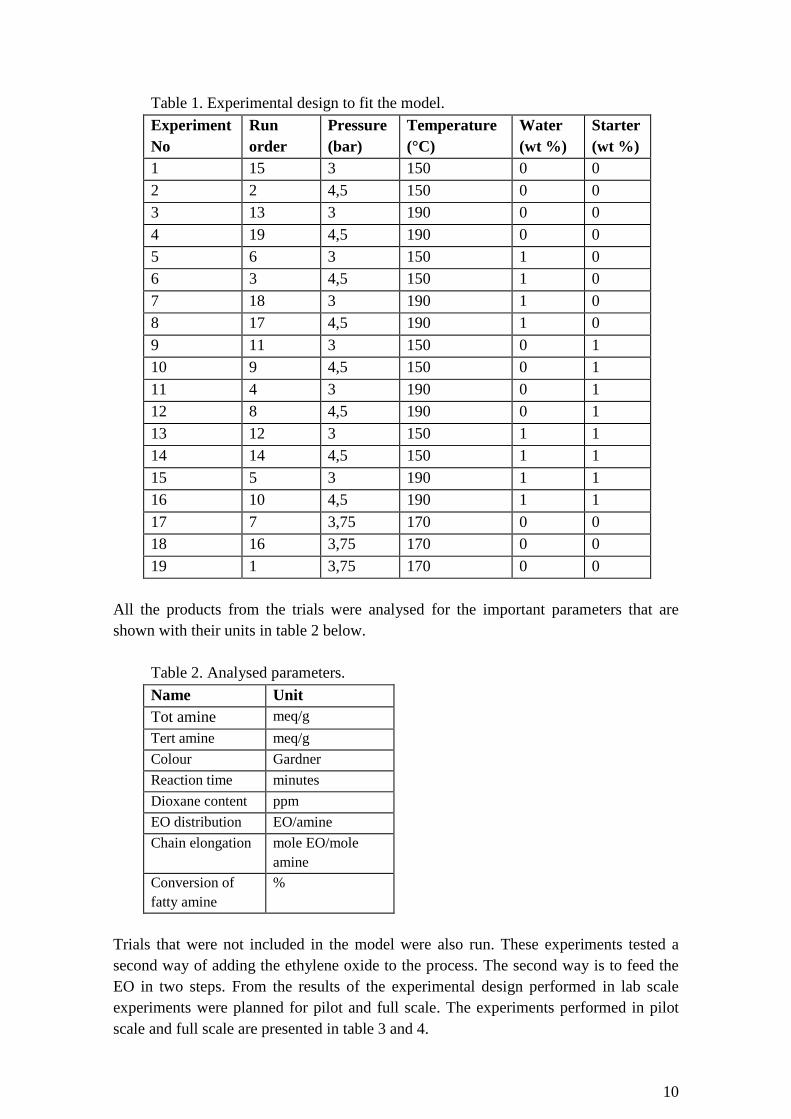
The parameters of interest in this trial were temperature, pressure, water and starter. The
experimental design can be seen in table 1. The model to which the experimental design
should be fit is a model where all interactions are taken in-to account, no replicates are
run and to be able to get a better fit three centre point trials are run.
10
Table 1. Experimental design to fit the model.
Experiment
No
Run
order
Pressure
(bar)
Temperature
(°C)
Water
(wt %)
Starter
(wt %)
1 15 3 150 0 0
2 2 4,5 150 0 0
3 13 3 190 0 0
4 19 4,5 190 0 0
5 6 3 150 1 0
6 3 4,5 150 1 0
7 18 3 190 1 0
8 17 4,5 190 1 0
9 11 3 150 0 1
10 9 4,5 150 0 1
11 4 3 190 0 1
12 8 4,5 190 0 1
13 12 3 150 1 1
14 14 4,5 150 1 1
15 5 3 190 1 1
16 10 4,5 190 1 1
17 7 3,75 170 0 0
18 16 3,75 170 0 0
19 1 3,75 170 0 0
All the products from the trials were analysed for the important parameters that are
shown with their units in table 2 below.
Table 2. Analysed parameters.
Name Unit
Tot amine meq/g
Tert amine meq/g
Colour Gardner
Reaction time minutes
Dioxane content ppm
EO distribution EO/amine
Chain elongation mole EO/mole
amine
Conversion of
fatty amine
%
Trials that were not included in the model were also run. These experiments tested a
second way of adding the ethylene oxide to the process. The second way is to feed the
EO in two steps. From the results of the experimental design performed in lab scale
experiments were planned for pilot and full scale. The experiments performed in pilot
scale and full scale are presented in table 3 and 4.

11
Table 3. Pilot experiments.
Experiment No Temperat
ure (°C)
Pressure
(bar)
1 170 4,5
2 170 3
3 (divided EO feed) 170 4,5
4 150 3
Trial number 3 was performed by dividing the EO feed into two parts. The feed of EO
was handled different, the addition of EO was not completely controlled by the pressure
in the reactor.
Table 4. Full scale trials.
Experiment No Temperature
(°C)
Pressure
(bar)
1 200 3
2 170 4,5
3 170 3
3.2. Material and method To be able to draw the best conclusion possible from all trials the amount of fatty amine
fed to the reactor is held constant in all scales. In the lab scale trials around 1100 grams
of fatty amine was fed. When the experiments were up-scaled to the pilot around 80
kilograms were fed to every trial. In the full scale experiments around 6500 kilograms
were fed to the reactor but for the third trial, raw material ran out and the feed was only
around 60 percent of the two earlier trials.
The raw materials used in all trials are a fatty amine that Akzo Nobel’s plant in Mons,
Belgium produces and the ethylene oxide is made at the plant with ethene bought from
Borealis. The fatty amine is solid at room temperature which means that melting of the
raw material was the first step of the process. Since the melting point of the fatty amine
was 30-40 °C the reactor must be preheated to prevent solidification of the raw material
in the reactor since this could clog the circulation system. This is a problem that does
not exist in the lab scale process since mixing is performed with a stirrer in that process.
The vacuum systems of the different process scales are very different. In the lab scale
water suction was used but in the bigger scales pumps are needed to be able to create
vacuum in such big vessels. In the lab and pilot scale the temperature of the reactor was
set to 60 °C and the mixing was started before the vacuum was drawn. After the first
vacuum was drawn the reactor was pressurized with nitrogen purchased from AGA. The
reactor was pressurized three times and between each time, vacuum was drawn. This
procedure was followed to evacuate all unwanted gases in the reactor. To remove water
that could be left from the rinsing of the reactor the temperature was set to 100 °C and
vacuum was drawn for half an hour.
12
In the full scale process the temperature was set to 100 °C when the fatty amine was fed
to the reactor. Vacuum was the drawn to remove water and other unwanted compounds
from the reactor. Nitrogen was used to pressurize the full scale reactor.
All the different scaled reactors are then closed when a full vacuum was achieved. The
temperature was then raised to reaction temperature and when that was achieved the
ethylene oxide was added. The systems for the ethylene oxide feed are different for the
different scales. In the lab scale an ethylene oxide cylinder was attached to the autoclave
reactor and then the EO was added to the reactor by pressure difference. The cylinder
was put on scale that measures the amount of EO that was added to the reactor.
In the pilot plant the ethylene oxide came via pipes from the production unit of EO and
the amount added to the reactor was measured by flow meters. The amount added to the
full scale reactor was measured by flow meters as well. This method was not as accurate
as the one used in the lab scale which can result in that the amount of EO fed to the
reactor was not the optimal amount but it was of sufficient accuracy to be disregarded.
The amount of EO added is calculated based on the molecular weight of the fatty amine.
To avoid over ethoxylation the mole ratio in the lab and pilot scale has been 1:1,96
which means that only 98 percent of the two moles of EO were added to the reactor. In
the full scale 100 percent of the two moles were added.
The speed of the ethylene oxide feed was controlled by the pressure in the reactor which
was set constant so that the concentration of EO was held at such a level that side
reactions were limited. When all the ethylene oxide was added to the reactor the
pressure decreases due to reactions and when the pressure stabilizes the reaction was
complete and the temperature was lowered and the product taken out.
In pilot and full scale trials only the temperature and the pressure were altered but in the
lab scale also the addition of water and starter as reaction initiators were tried. The
starter was added to the reactor together with the fatty amine and the procedure was
after that the same as was described earlier. The water was added after the closure of the
reactor and after the vacuum was drawn. After the addition of the water vacuum was
only drawn to a half bar to ensure that the water was not drawn out of the reactor.
3.3. Characterization of products The products were analyzed to be able to draw conclusions from the trials and the
results from the analysis were put in-to the experimental design in MODDE.
3.3.1. Titration
To determine how much of the fatty amine that reacted during the reaction two titrations
were made. The first titration determined how much nitrogen the product contained. For
this titration around 0.35 grams of product was weight in to a 150 ml beaker and the
product was then dissolved in 75 ml glacial acetic acid. The titrant used in this titration
was 0.1 M perchloric acid in acetic acid.

13
The result was given in meq/g (milliequivalents/gram of sample) and that result was
calculated by the amount of titrant needed to reach the equilibrium point and the amount
of sample added to the beaker.
The second titration was performed to see how much of the amine that became tertiary
in the reaction. To do that the secondary and primary amines must be shielded so that
only the tertiary amines were shown in the result. The same mass of sample was used
for this titration but to shield the primary and secondary amines the sample was
dissolved in 20 ml acetic acid anhydride and 2 ml glacial acetic acid. To let the solution
react the beaker was covered and heated at a low temperature during stirring for half an
hour. The titration was then performed in the same way as the first titration and the
same titrant was used.
To calculate the conversion of the reaction the result from the titration of tertiary amines
was divided with the total amine content.
3.3.2. NMR
When ethoxylating a fatty amine the chains can grow which means that there are more
than two ethylene oxide on every fatty amine. There is also the possibility that not both
hydrogen atoms on the amine react which leads to an under ethoxylation. Both of these
things can be seen in a NMR spectrum. The NMR that has been used in this project was
from Varian. The analysis that has been performed is an H-NMR which means that the
vibrations that are detected are the ones created by the hydrogen atoms in the molecule.
The samples were prepared by adding one or two drops of the product to an NMR tube
and then very pure chloroform from Fisher scientific was added to dissolve the product.
The tube was inserted into the NMR and a spectrum was generated. The peaks of the
spectrums were integrated and interpreted. The areas under the peaks were used to
determine the chain elongation and the ethylene oxide distribution. All the areas were
related to the CH3 group that is in the end of the carbon chain and is represented by a
peak at 1 ppm on the x-axis in the spectrum. The area of this peak was set to 30, due to
the three hydrogen atoms in that molecule. A typical curve can be seen in figure 7.

14
Figure 7. Typical NMR spectrum with interesting peaks marked..
3.3.3 GC
One of the side reactions in this process is the formation of dioxane from two ethylene
oxide molecules. To measure the amount of this by-product created in the process GC
can be used. Dioxane has a low boiling point which means that the head space method
can be used when analyzing the product. This means that the product is heated to 80 °C
which means that dioxane, unreacted EO and other volatile compounds are gasified. A
sample is then withdrawn from the gas phase in the vial. To be able to quantify the
amount of dioxane a standard is added to the sample. Each product is diluted with
different amounts of standard accordingly to table 5 below.
Table 5. Vial specifications.
Sample vial Added to
product
A 1 ml buffer
B 0.5 ml buffer
0.5 ml standard
C 0.3 ml buffer
0.7 ml standard
D 1 ml standard
One gram of product is added to each vial. The standard was made by mixing pH 7
buffer and 0.2048 g pure dioxane from Merck. The original standard was then diluted
10 times before it was added to the vials. The specifications of the GC follow in table 6.
CH3
15
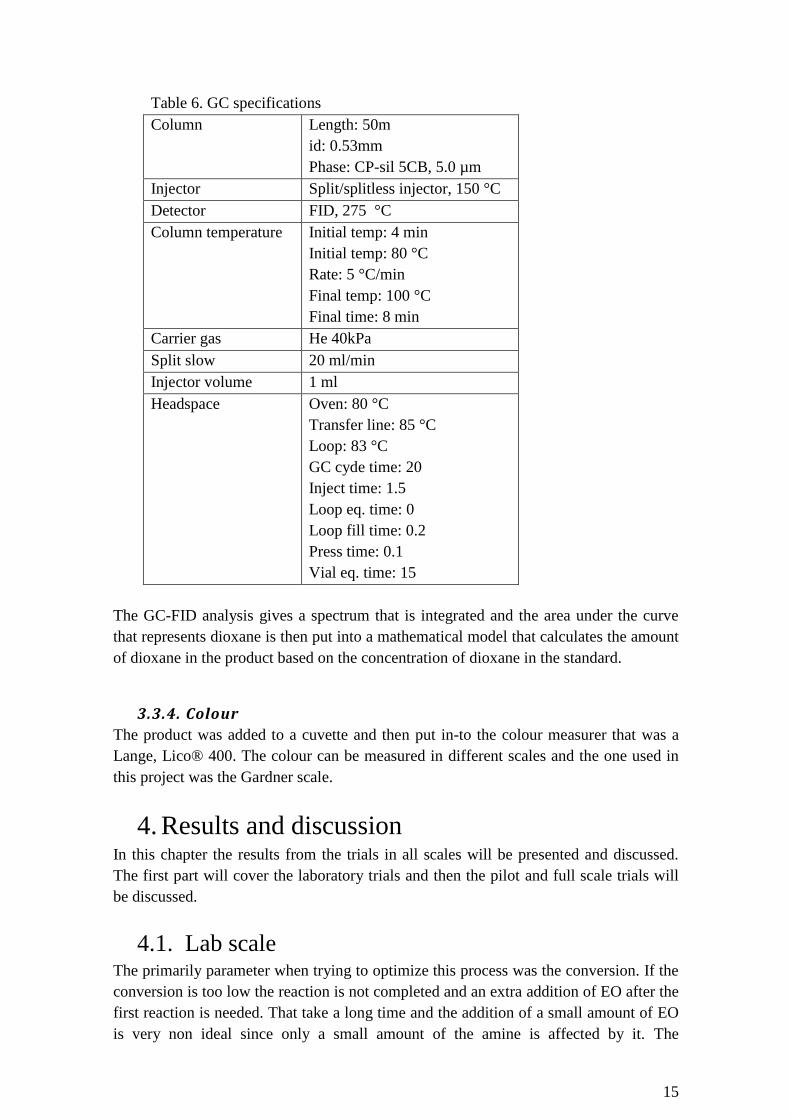
Table 6. GC specifications
Column Length: 50m
id: 0.53mm
Phase: CP-sil 5CB, 5.0 µm
Injector Split/splitless injector, 150 °C
Detector FID, 275 °C
Column temperature Initial temp: 4 min
Initial temp: 80 °C
Rate: 5 °C/min
Final temp: 100 °C
Final time: 8 min
Carrier gas He 40kPa
Split slow 20 ml/min
Injector volume 1 ml
Headspace Oven: 80 °C
Transfer line: 85 °C
Loop: 83 °C
GC cyde time: 20
Inject time: 1.5
Loop eq. time: 0
Loop fill time: 0.2
Press time: 0.1
Vial eq. time: 15
The GC-FID analysis gives a spectrum that is integrated and the area under the curve
that represents dioxane is then put into a mathematical model that calculates the amount
of dioxane in the product based on the concentration of dioxane in the standard.
3.3.4. Colour
The product was added to a cuvette and then put in-to the colour measurer that was a
Lange, Lico® 400. The colour can be measured in different scales and the one used in
this project was the Gardner scale.
4. Results and discussion In this chapter the results from the trials in all scales will be presented and discussed.
The first part will cover the laboratory trials and then the pilot and full scale trials will
be discussed.
4.1. Lab scale The primarily parameter when trying to optimize this process was the conversion. If the
conversion is too low the reaction is not completed and an extra addition of EO after the
first reaction is needed. That take a long time and the addition of a small amount of EO
is very non ideal since only a small amount of the amine is affected by it. The

16
conversion was calculated from the result of the total amine titration and the tertiary
amine titration and the results are presented below in table 7.
Table 7. Titration results.
Experiment No. Tot amine
(meq/g)
Tert amine
(meq/g)
Conversion
(%)
1 2,894 2,845 98,3
2 2,895 2,843 98,2
3 2,891 2,870 99,3
4 2,906 2,789 96,0
5 2,916 2,758 94,6
6 2,887 2,774 96,1
7 2,906 2,657 91,4
8 2,900 2,727 94,0
9 2,908 2,782 95,7
10 2,903 2,803 96,6
11 2,879 2,866 99,5
12 2,907 2,799 96,3
13 2,904 2,800 96,4
14 2,892 2,765 95,6
15 2,910 2,670 91,7
16 2,903 2,779 95,7
17 2,907 2,805 96,5
18 2,894 2,803 96,9
19 2,901 2,787 96,1
The amount of EO added to each trial was 98 percent of two moles which means that
the theoretical value of the conversion can be 98 percent maximum. The reason that
some trials have a higher value could be an error in the feed or it co due to the fact that
the amount of EO added to the process is based on a pure tertiary fatty amine. This is
not completely true since some secondary fatty amines could also be in the rawmaterial
along with impurities which are not accounted for.
The trials marked green have a very high conversion which indicates that a high
temperature and a low pressure is good for the process. The trials marked yellow are the
same trails as the ones marked green but with a lower pressure which indicates that the
pressure was an important factor.
All the trials had a colour that was lighter than the limit which means that they were all
passed in a colour perspective. What could be seen, which was also expected, was that a
higher temperature gave a lower colour. The colour results can be seen in appendix 1.
A side reaction that can be influenced by all the investigated parameters are the
formation of dioxane. To analyse the amount of dioxane in the products GC headspace
is used. The results from this analysis are shown in table 8.
17
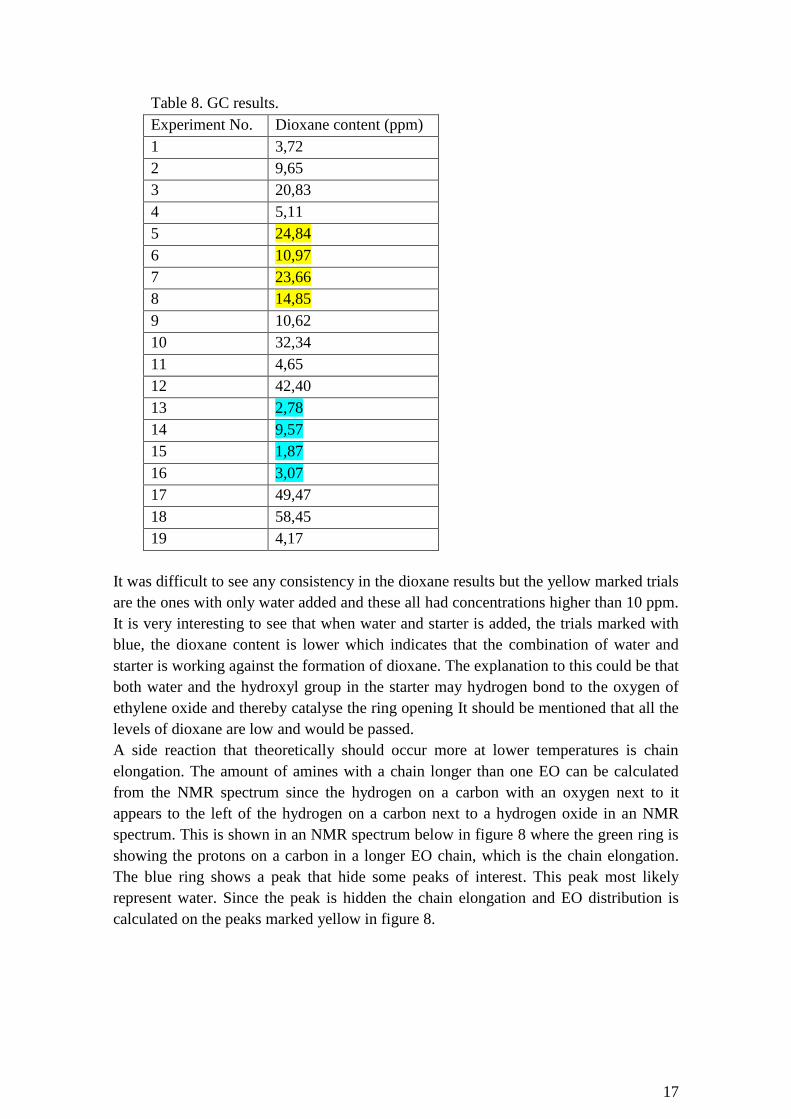
Table 8. GC results.
Experiment No. Dioxane content (ppm)
1 3,72
2 9,65
3 20,83
4 5,11
5 24,84
6 10,97
7 23,66
8 14,85
9 10,62
10 32,34
11 4,65
12 42,40
13 2,78
14 9,57
15 1,87
16 3,07
17 49,47
18 58,45
19 4,17
It was difficult to see any consistency in the dioxane results but the yellow marked trials
are the ones with only water added and these all had concentrations higher than 10 ppm.
It is very interesting to see that when water and starter is added, the trials marked with
blue, the dioxane content is lower which indicates that the combination of water and
starter is working against the formation of dioxane. The explanation to this could be that
both water and the hydroxyl group in the starter may hydrogen bond to the oxygen of
ethylene oxide and thereby catalyse the ring opening It should be mentioned that all the
levels of dioxane are low and would be passed.
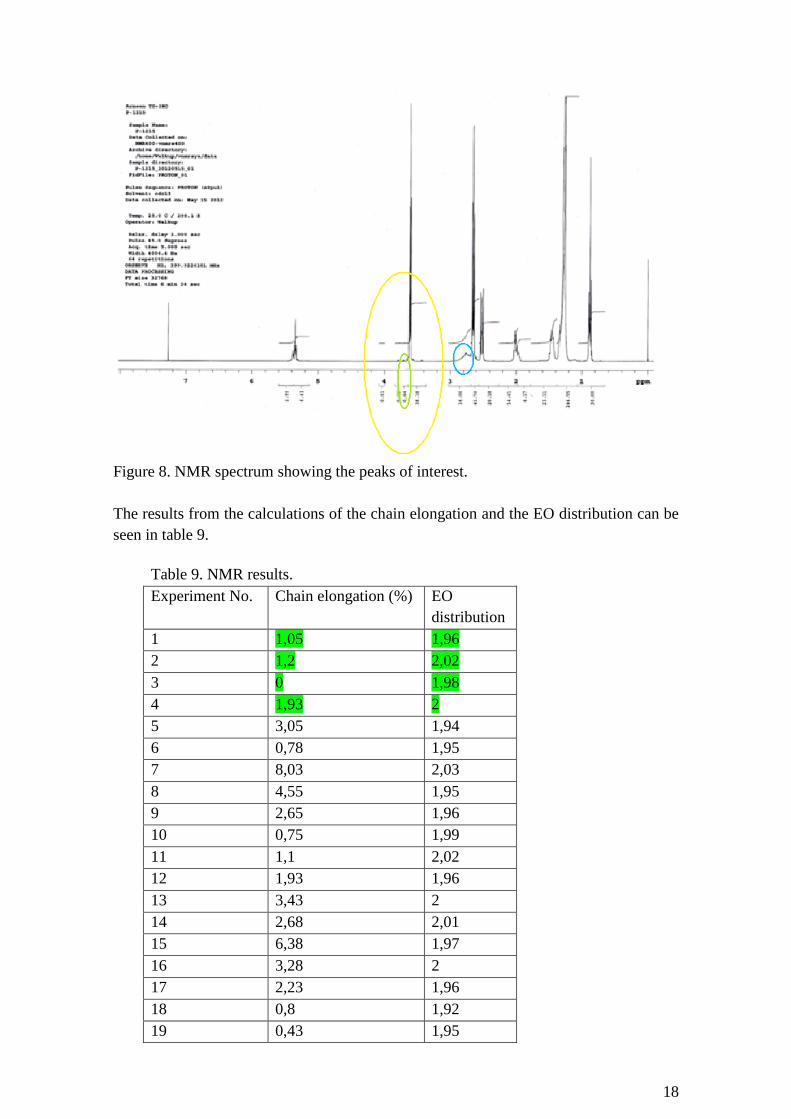
A side reaction that theoretically should occur more at lower temperatures is chain
elongation. The amount of amines with a chain longer than one EO can be calculated
from the NMR spectrum since the hydrogen on a carbon with an oxygen next to it
appears to the left of the hydrogen on a carbon next to a hydrogen oxide in an NMR
spectrum. This is shown in an NMR spectrum below in figure 8 where the green ring is
showing the protons on a carbon in a longer EO chain, which is the chain elongation.
The blue ring shows a peak that hide some peaks of interest. This peak most likely
represent water. Since the peak is hidden the chain elongation and EO distribution is
calculated on the peaks marked yellow in figure 8.
18
Figure 8. NMR spectrum showing the peaks of interest.
The results from the calculations of the chain elongation and the EO distribution can be
seen in table 9.
Table 9. NMR results.
Experiment No. Chain elongation (%) EO
distribution
1 1,05 1,96
2 1,2 2,02
3 0 1,98
4 1,93 2
5 3,05 1,94
6 0,78 1,95
7 8,03 2,03
8 4,55 1,95
9 2,65 1,96
10 0,75 1,99
11 1,1 2,02
12 1,93 1,96
13 3,43 2
14 2,68 2,01
15 6,38 1,97
16 3,28 2
17 2,23 1,96
18 0,8 1,92
19 0,43 1,95
19
It can be seen that when no starter or water is added to the process there is not much
chain elongation. It can also be seen that the EO distribution is good since every amine
has close to two EO molecules on them.
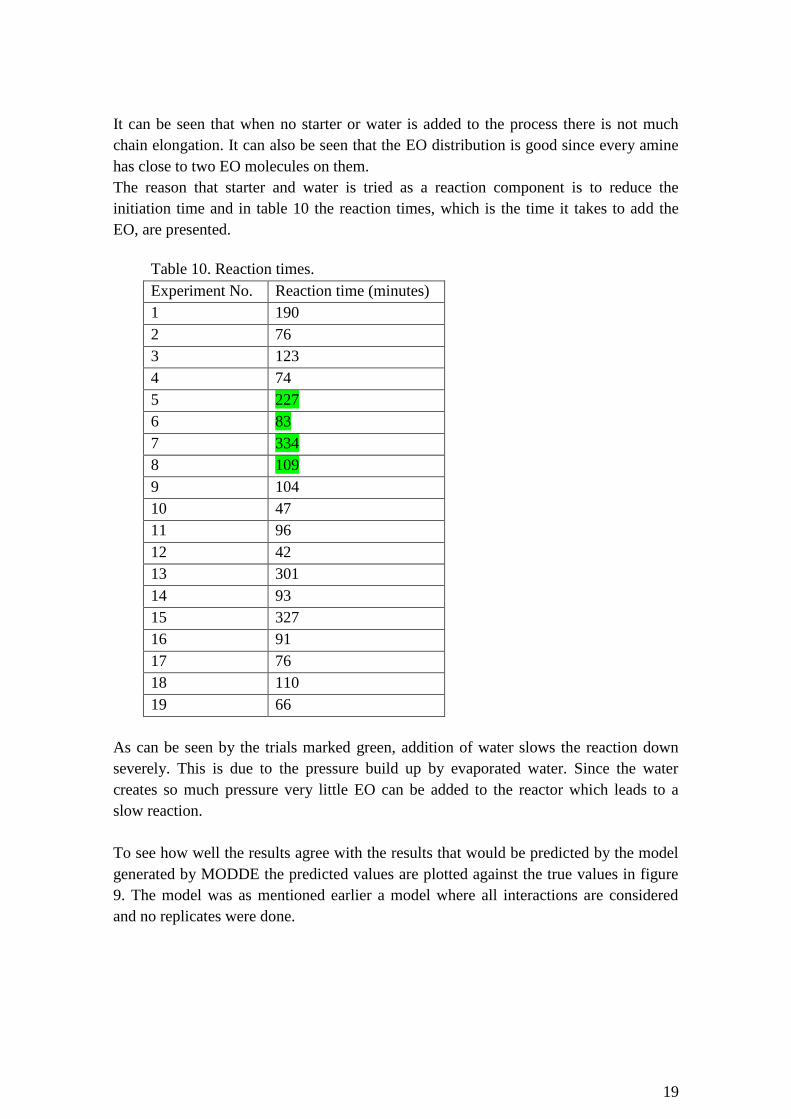
The reason that starter and water is tried as a reaction component is to reduce the
initiation time and in table 10 the reaction times, which is the time it takes to add the
EO, are presented.
Table 10. Reaction times.
Experiment No. Reaction time (minutes)
1 190
2 76
3 123
4 74
5 227
6 83
7 334
8 109
9 104
10 47
11 96
12 42
13 301
14 93
15 327
16 91
17 76
18 110
19 66
As can be seen by the trials marked green, addition of water slows the reaction down
severely. This is due to the pressure build up by evaporated water. Since the water
creates so much pressure very little EO can be added to the reactor which leads to a
slow reaction.
To see how well the results agree with the results that would be predicted by the model
generated by MODDE the predicted values are plotted against the true values in figure
9. The model was as mentioned earlier a model where all interactions are considered
and no replicates were done.
20
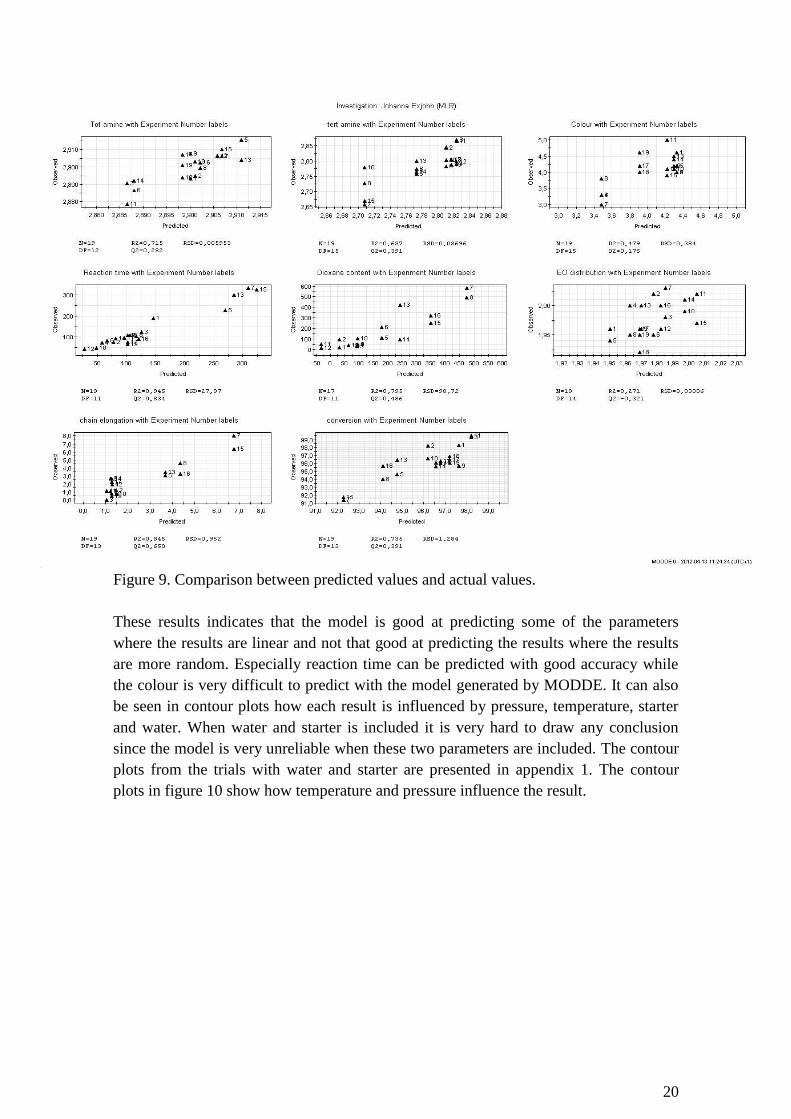
Figure 9. Comparison between predicted values and actual values.
These results indicates that the model is good at predicting some of the parameters
where the results are linear and not that good at predicting the results where the results
are more random. Especially reaction time can be predicted with good accuracy while
the colour is very difficult to predict with the model generated by MODDE. It can also
be seen in contour plots how each result is influenced by pressure, temperature, starter
and water. When water and starter is included it is very hard to draw any conclusion
since the model is very unreliable when these two parameters are included. The contour
plots from the trials with water and starter are presented in appendix 1. The contour
plots in figure 10 show how temperature and pressure influence the result.
21
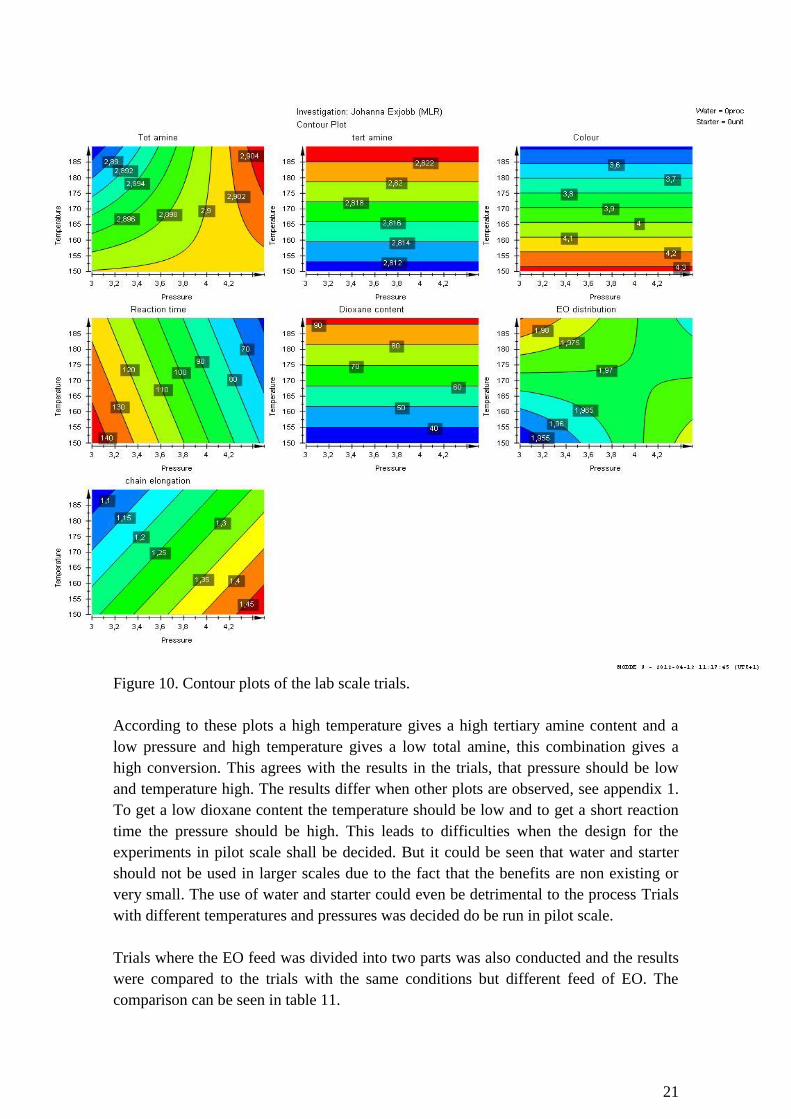
Figure 10. Contour plots of the lab scale trials.
According to these plots a high temperature gives a high tertiary amine content and a
low pressure and high temperature gives a low total amine, this combination gives a
high conversion. This agrees with the results in the trials, that pressure should be low
and temperature high. The results differ when other plots are observed, see appendix 1.
To get a low dioxane content the temperature should be low and to get a short reaction
time the pressure should be high. This leads to difficulties when the design for the
experiments in pilot scale shall be decided. But it could be seen that water and starter
should not be used in larger scales due to the fact that the benefits are non existing or
very small. The use of water and starter could even be detrimental to the process Trials
with different temperatures and pressures was decided do be run in pilot scale.
Trials where the EO feed was divided into two parts was also conducted and the results
were compared to the trials with the same conditions but different feed of EO. The
comparison can be seen in table 11.

22
Table 11. Comparison between the Swedish and American way of feeding EO.
Trial Temperature
(Celsius)
Pressure
(bar)
Tot
amin
Tert
amine
Conversion
(%)
Reaction
time
(min)
Divided
feed
170 4,5 2,895 2,829 97,7 81
One
feed
170 4,5 2,898 2,795 96,4 58
From these results it can be seen that the results for the trial with an American feed of
EO gives much better results than the trial were the EO was feed according to the
Swedish way. The drawback of the American way is the longer reaction time but if no
extra addition of EO is needed for the product to pass that could be time well spent.
The colours of the products are all low and the results are presented in appendix 2
4.2. Pilot scale When deciding which trials to perform in pilot scale water and starter were excluded but
different temperatures and pressures were tested. Unfortunately it was not possible to
test any temperatures over 170 degree Celsius due to pressure restrains in the
heatexchanger. The steam used for heating could not have a pressure above 12 bar
which meant that the maximum temperature was 175 degrees.
When comparing the pilot scale set up with the lab scale set up the most evident
difference between them is the mixing. In the lab scale almost ideal mixing is achieved
by the stirrer but in the pilot scale the mixing is far from ideal which leads to differences
between the process scales.
The same analyses were made for the products from the pilot trials and they are
presented in the same way as the lab scale results. The conversion should be lower than
the conversion in the lab scale trials due to non ideal mixing. Another parameter that
could cause lower conversion is the larger free gas volume in the pilot reactor. This
means that more EO can be added to the free volume before the set pressure is reached
and this could lead to more side reactions which lowers the conversion. The titration
results are presented in table 12 below.
Table 12. Titration results.
Experiment No. Tot amine Tert amine Conversion
1 2,909 2,758 94,81
2 2,924 2,781 95,13
3 2,915 2,773 95,11
4 2,907 2,749 94,56
From these results it is very hard to see any pattern but as mentioned above the
conversion is lower in general when compared to the lab scale trials. The indication was
however that low pressure and the American trial gave better results.

23
The dioxane content should be low since no water or starter was added and this can be
seen in table 13 and the GC spectrums are shown in appendix 3.
Table 13. GC results.
Experiment No. Dioxane content (ppm)
1 5
2 10
3 0
4 15
The results indicate that a high pressure leads to a lower dioxane content which is
contradictory since a higher pressure means more free EO in the free volume above the
fatty amine leading to more opportunities for side reactions. Although it can be seen
from table 11 that experiment number three where EO was fed in a different way leads
to very low formation of dioxane.
Since the conversion is low also the EO distribution will be low since these two
parameters are connected. The chain elongation should be low in all the experiments
since there is no water or starter that can catalyse the elongation. The NMR results can
be seen in table 14 and the spectrums are shown in appendix 4.
Table 14. NMR results.
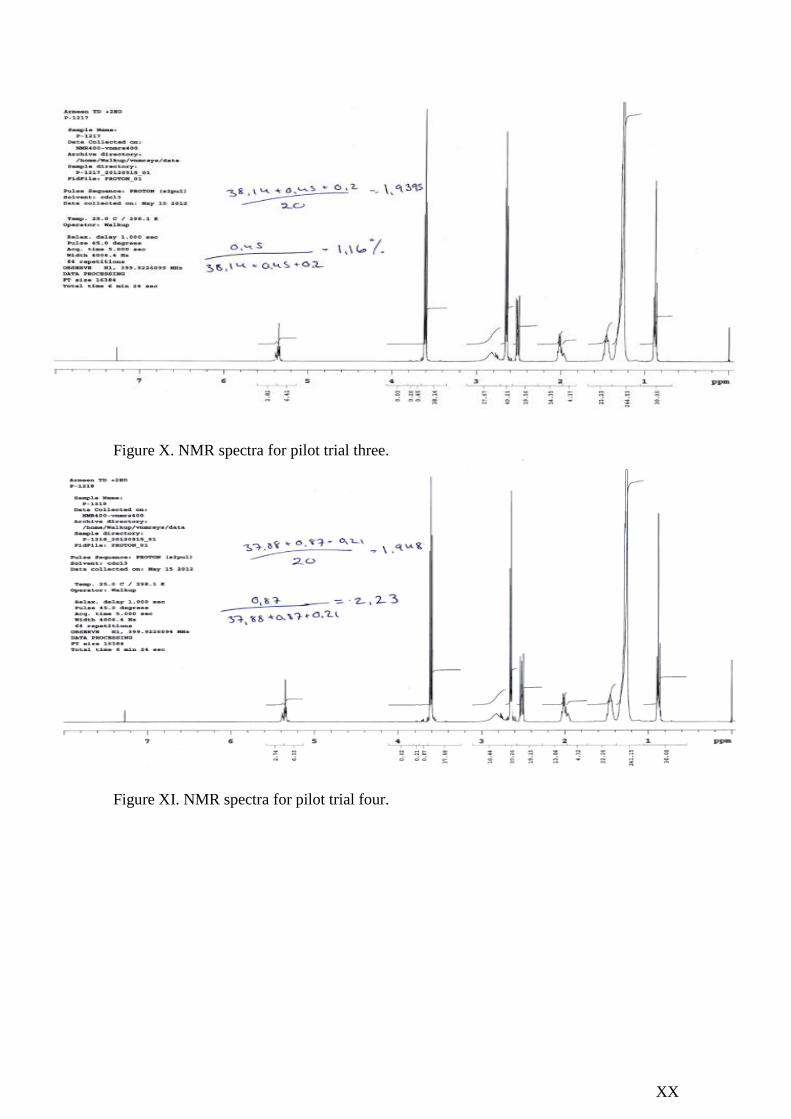
Experiment No. Chain elongation (%) EO distribution
1 2,23 1,948
2 1,16 1,940
3 1,09 1,931
4 1,14 1,94
From these results it can once again be seen that experiment number three gives a good
result, at least when it comes to chain elongation. The result for EO distribution is more
uncertain since there is a peak in the NMR spectra that cover one of the peaks, see
figure 8 earlier in the report. This leads to some uncertainties and the conversion should
be trusted before the EO distribution.
The reaction time is influenced by temperature and pressure and the time decreases with
temperature and pressure. The reaction times are presented in table 15 below.
Table 15. Reaction times in the pilot trials.
Experiment No. Reaction time (minutes)
1 46
2 65
3 66
4 94
24
With these results it can be seen that there is a drawback with experiment three and that
is the reaction time. Even though the reaction conditions are the same as experiment one
the time needed for reaction is longer. This is due to the different feed of EO.
The colour of all four trials is almost identical and well within specification, see
appendix 2.
4.3. Full scale It was hard to draw any firm conclusions from the pilot trials other than that a low
temperature was not optimal. This led to that different temperatures and pressures were
tried in full scale.
The first full scale trial was run with the actual settings that was used in the factory,
hence the high temperature. The third full scale trial could be neglected due to the fact
that only around 60 percent of the fatty amine that was supposed to be fed to the reactor
was available, although the results of trial three are presented along with the results of
trial one and two.
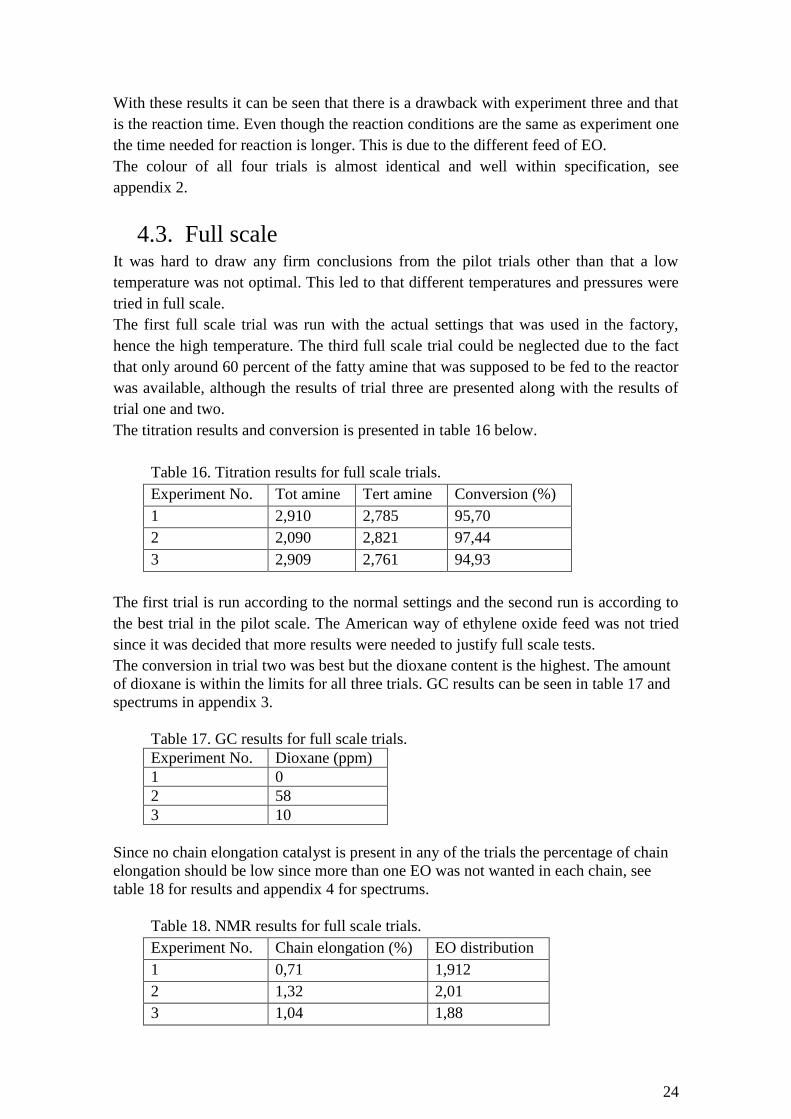
The titration results and conversion is presented in table 16 below.
Table 16. Titration results for full scale trials.
Experiment No. Tot amine Tert amine Conversion (%)
1 2,910 2,785 95,70
2 2,090 2,821 97,44
3 2,909 2,761 94,93
The first trial is run according to the normal settings and the second run is according to
the best trial in the pilot scale. The American way of ethylene oxide feed was not tried
since it was decided that more results were needed to justify full scale tests.
The conversion in trial two was best but the dioxane content is the highest. The amount
of dioxane is within the limits for all three trials. GC results can be seen in table 17 and
spectrums in appendix 3.
Table 17. GC results for full scale trials.
Experiment No. Dioxane (ppm)
1 0
2 58
3 10
Since no chain elongation catalyst is present in any of the trials the percentage of chain
elongation should be low since more than one EO was not wanted in each chain, see
table 18 for results and appendix 4 for spectrums.
Table 18. NMR results for full scale trials.
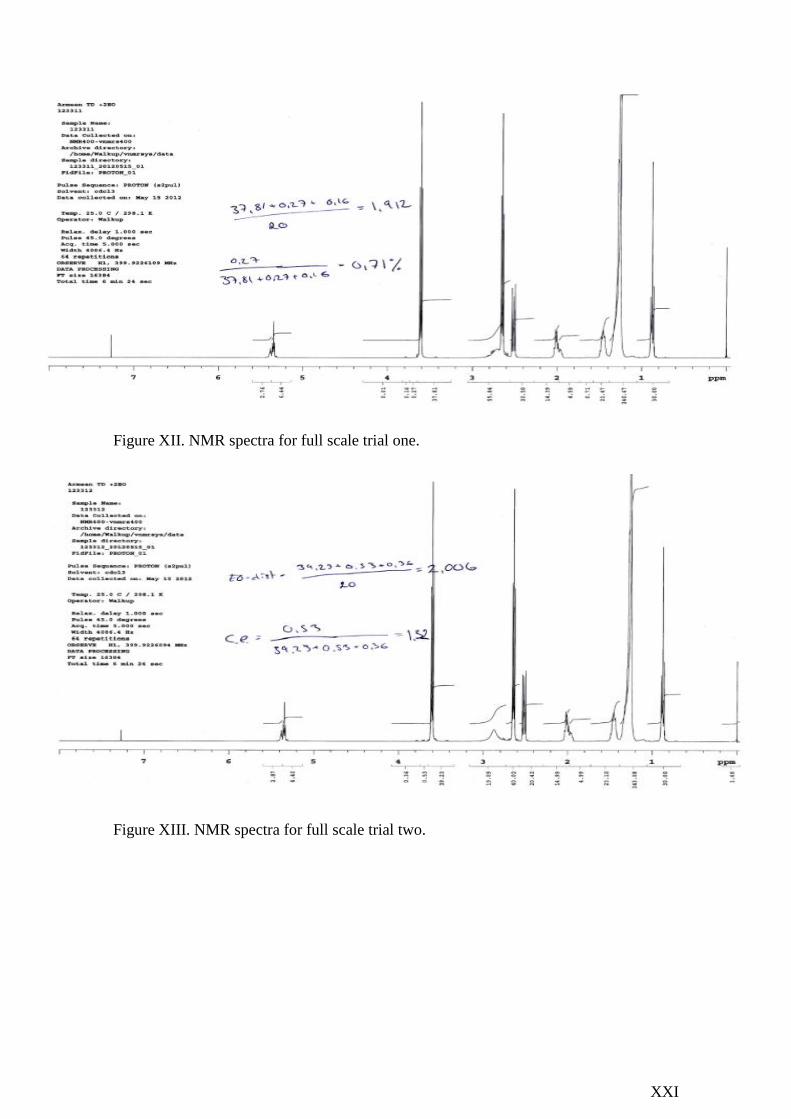
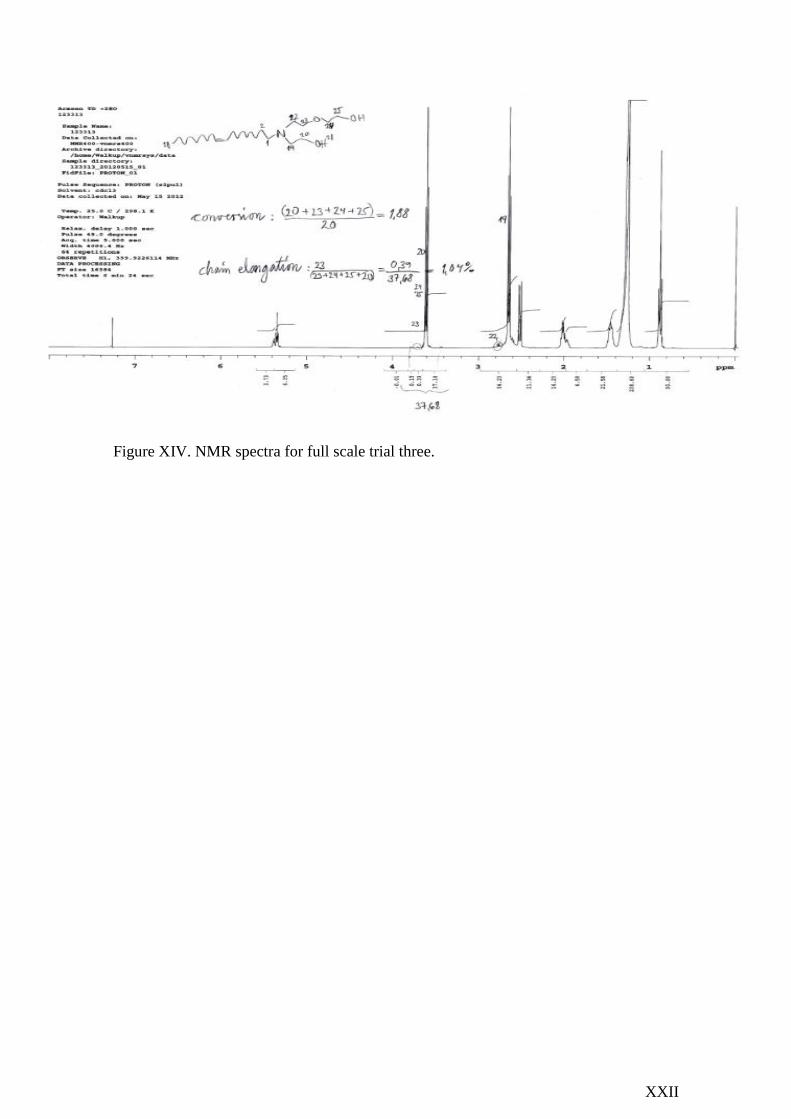
Experiment No. Chain elongation (%) EO distribution
1 0,71 1,912
2 1,32 2,01
3 1,04 1,88
25
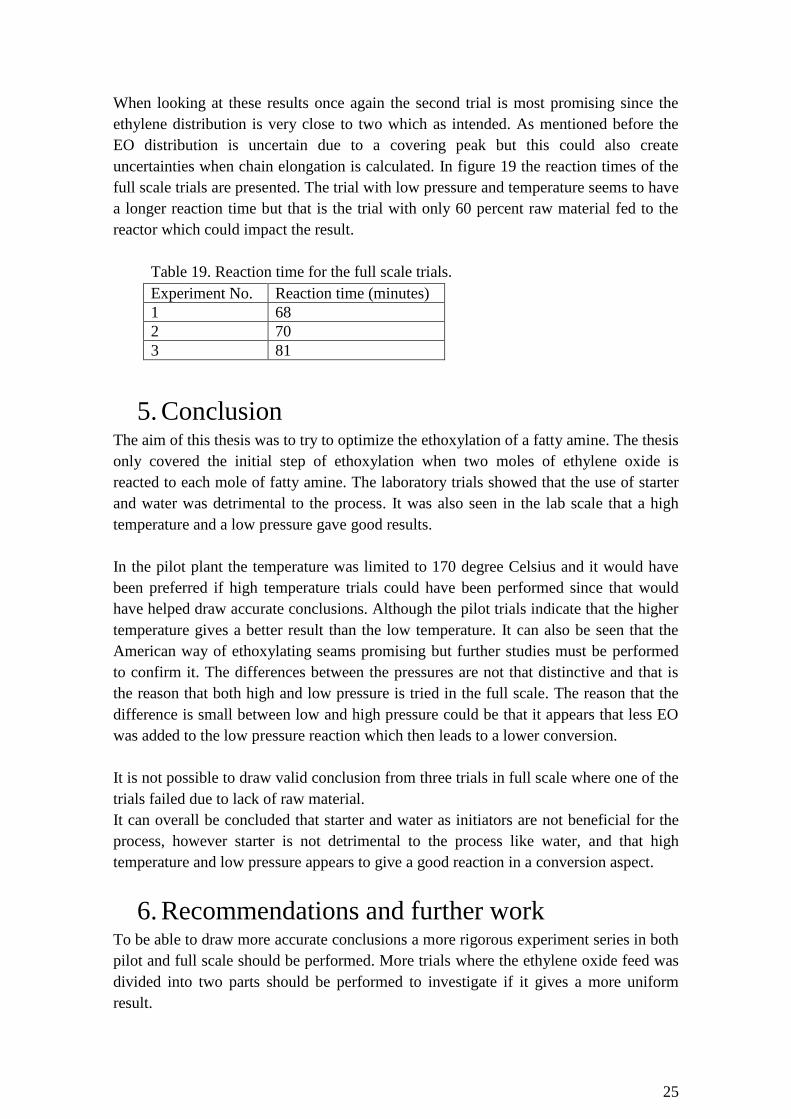
When looking at these results once again the second trial is most promising since the
ethylene distribution is very close to two which as intended. As mentioned before the
EO distribution is uncertain due to a covering peak but this could also create
uncertainties when chain elongation is calculated. In figure 19 the reaction times of the
full scale trials are presented. The trial with low pressure and temperature seems to have
a longer reaction time but that is the trial with only 60 percent raw material fed to the
reactor which could impact the result.
Table 19. Reaction time for the full scale trials.
Experiment No. Reaction time (minutes)
1 68
2 70
3 81
5. Conclusion The aim of this thesis was to try to optimize the ethoxylation of a fatty amine. The thesis
only covered the initial step of ethoxylation when two moles of ethylene oxide is
reacted to each mole of fatty amine. The laboratory trials showed that the use of starter
and water was detrimental to the process. It was also seen in the lab scale that a high
temperature and a low pressure gave good results.
In the pilot plant the temperature was limited to 170 degree Celsius and it would have
been preferred if high temperature trials could have been performed since that would
have helped draw accurate conclusions. Although the pilot trials indicate that the higher
temperature gives a better result than the low temperature. It can also be seen that the
American way of ethoxylating seams promising but further studies must be performed
to confirm it. The differences between the pressures are not that distinctive and that is
the reason that both high and low pressure is tried in the full scale. The reason that the
difference is small between low and high pressure could be that it appears that less EO
was added to the low pressure reaction which then leads to a lower conversion.
It is not possible to draw valid conclusion from three trials in full scale where one of the
trials failed due to lack of raw material.
It can overall be concluded that starter and water as initiators are not beneficial for the
process, however starter is not detrimental to the process like water, and that high
temperature and low pressure appears to give a good reaction in a conversion aspect.
6. Recommendations and further work To be able to draw more accurate conclusions a more rigorous experiment series in both
pilot and full scale should be performed. More trials where the ethylene oxide feed was
divided into two parts should be performed to investigate if it gives a more uniform
result.

26
Since the process set ups differ very much between lab scale and pilot scale it could be a
good idea to try using a starter in the pilot scale to investigate how it impacts the results
in that scale. Experiments with water present should not be tried again since the
pressure build up of the evaporated water makes the reaction very slow. Water also
leads to higher dioxane content.

27
Acknowledgements First of all I would like to thank my supervisors Anders Paalberg and Hans Oskarsson at
Akzo Nobel surface chemistry in Stenungsund for helping me design a very interesting
master thesis project. I would also like to thank them for all help and their enthusiasm
for the project.
I would like to thank Professor Derek Creaser at Chalmers for being my examinator.
All the employees at the research facility in Stenungsund, without your help this would
not have been possible. Especially thanks to Louis Schwarzmayr for helping me with
the experimental design and NMR analysis, Håkan Rahkola for all the help with GC,
Rebecka Voss for helping me with the pilot trials and Eva Gottberg-Klingskog and Bo
Mannerstedt for help with searching for information.
During this time of hard work my friends have been there for me and I thank them so
much for distracting me when needed. Especially Madeleine Parkås has been a big
support and she has encouraged me when I have felt stuck. Writing thesis together with
her has been a joy.
Last I will thank my beloved family who have always been there for me and I know
they always will be. To my love Simon, thanks for the support and patience when I have
been wrapped up in work and all the hugs when I have been so tired.
28
References
1. Holmberg, K. et al. (2003) Surfactants and polymers in aqueous solution.
Second edition. Chichester, West Sussex: John Wiley and Sons.
2. Sirovski, F. Mulyashov, S. Shvets, V. (2006) Large-scale fatty amine
ethoxylation reactor: A dynamic model. Chemical engineering journal. No. 117,
pp. 197-203
3. Elvers, B. Hawkins, S. Russey, W. (1994) Ullmann´s Encyclopedia of Industrial
Chemistry. Fifth edition. Weinheim: VCH Verlagsgesellschaft. Volume A25.
4. Wade, JR.L.G (2006) Organic Chemistry. Sixth edition. Upper saddle river:
Pearson education
5. Visek, K. (2003) Amines, Fatty. Kirk-Othmer Encyclopedia of Chemical
Technology. http://onlinelibrary.wiley.com/book/10.1002/0471238961 (2012-
01-23)
6. Montgomery, D.C. (2009) Design and analysis of experiments. Seventh edition.
Hoboken: Johan Wiley and Sons.
7. Graham Solomons, T.W. Fryhle, C.B. (2008) Organic Chemistry. Ninth edition.
Hoboken: John Wiley and Sons.
8. Lang, R.F. Parra-Diaz, D. Jacobs, D. (1999) Analysis of ethoxylated fatty
amines. Comparison of methods for the determination of molecular weight.
Journal of surfactants and detergents. Vol. 2, No. 4, pp. 503-513
9. Hreczuch, W. Szymanowski, J. (1996) Synthesis of surfactants with narrow-
range distribution of the polyoxyethylene chain. Journal of the American oil
chemists´ society. Vol. 73, No. 1, pp. 73-78
10. Harris, D.C. (2007) Quantitative Chemical Analysis. Seventh edition. New
York: W.H Freeman and Company.
11. Material safety data sheet p-Dioxane MSDS (2010)
http://www.sciencelab.com/msds.php?msdsId=9923847 (11 may 2012)
12. Sanders, H.L. et al. (1969) Ethoxylation of fatty amines. Journal of the
American oil chemists´ society. Vol. 46, No. 3, pp. 167-170
13. Serio, D.M. Tesser, R. Santacesaria, E. (2005) Comparison of different reactor
types in the manufacture of ethoxylated, propoxylated products. Industrial
Engineering Chemistry, Vol. 44, No. 25, pp. 9482-9489
14. Weibull, B. Red. (1983) Etylenoxidkemi. 26th
of October, 1st and 3
rd of
November, 1983, Stenungsund.
15. Lif, J. Bergan, L. (1997) Laboratory report, Akzo Nobel Surface Chemistry
Stenungsund. Unpublished.
I
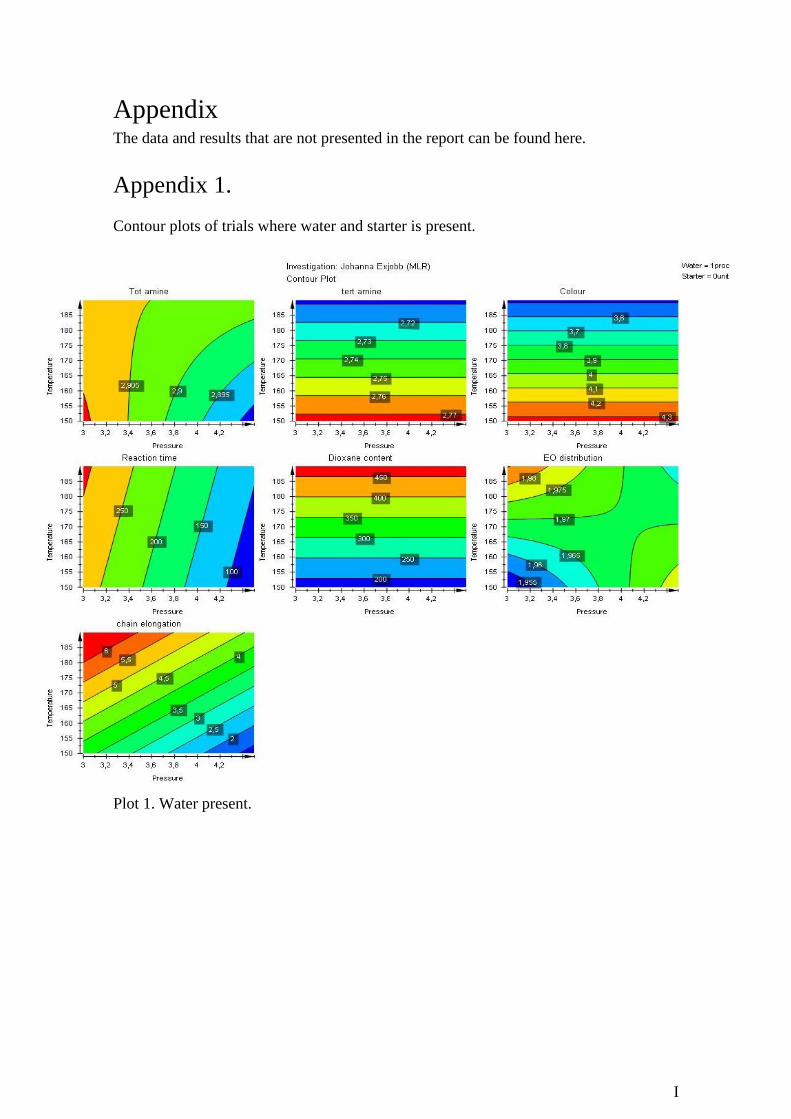
Appendix The data and results that are not presented in the report can be found here.
Appendix 1.
Contour plots of trials where water and starter is present.
Plot 1. Water present.
II
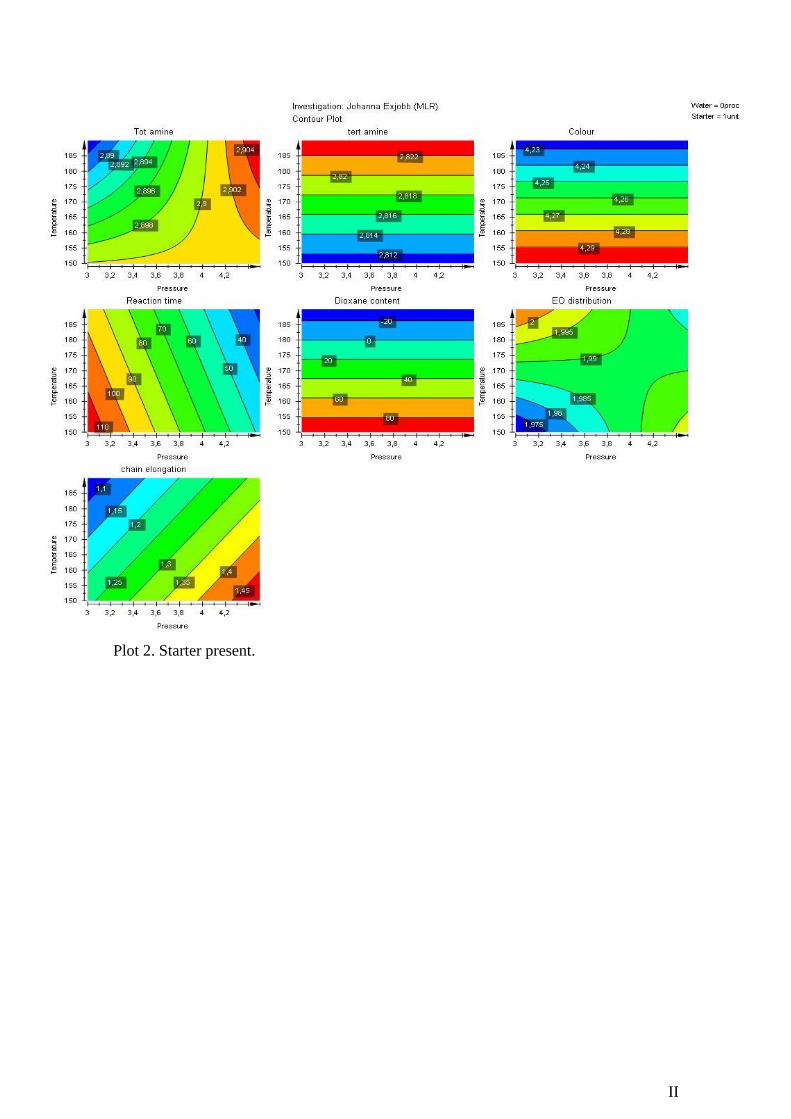
Plot 2. Starter present.

III
Plot 3. Both starter and water present.
From these plots it can be seen that the presence of water changes the plots
dramatically. The chain elongation was higher and the dioxane content as well. The
tertiary amine dropped if water was present which lead to a lower conversion and that
were the reasons that water was not tried in bigger scale.
Starter does not appear to impact the results at all which means that the addition of a
starter does not benefit the process to an extent where the extra work needed is worth it.
IV
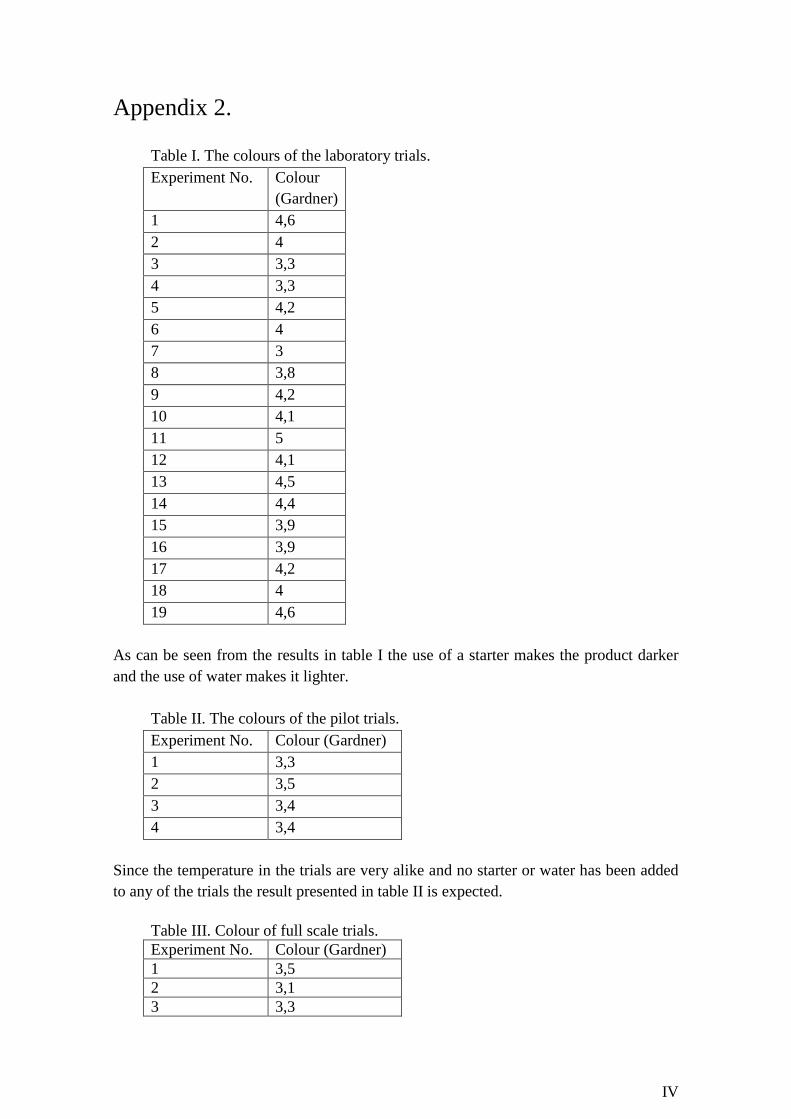
Appendix 2.
Table I. The colours of the laboratory trials.
Experiment No. Colour
(Gardner)
1 4,6
2 4
3 3,3
4 3,3
5 4,2
6 4
7 3
8 3,8
9 4,2
10 4,1
11 5
12 4,1
13 4,5
14 4,4
15 3,9
16 3,9
17 4,2
18 4
19 4,6
As can be seen from the results in table I the use of a starter makes the product darker
and the use of water makes it lighter.
Table II. The colours of the pilot trials.
Experiment No. Colour (Gardner)
1 3,3
2 3,5
3 3,4
4 3,4
Since the temperature in the trials are very alike and no starter or water has been added
to any of the trials the result presented in table II is expected.
Table III. Colour of full scale trials.
Experiment No. Colour (Gardner)
1 3,5
2 3,1
3 3,3
V
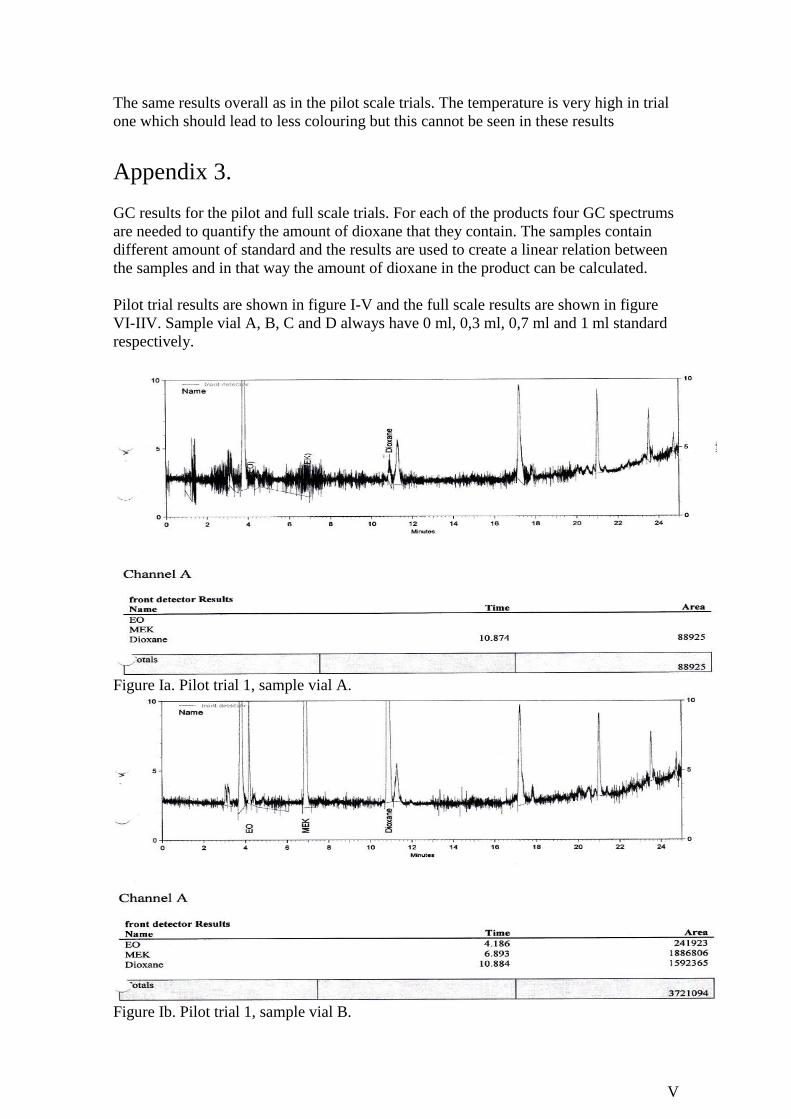
The same results overall as in the pilot scale trials. The temperature is very high in trial
one which should lead to less colouring but this cannot be seen in these results
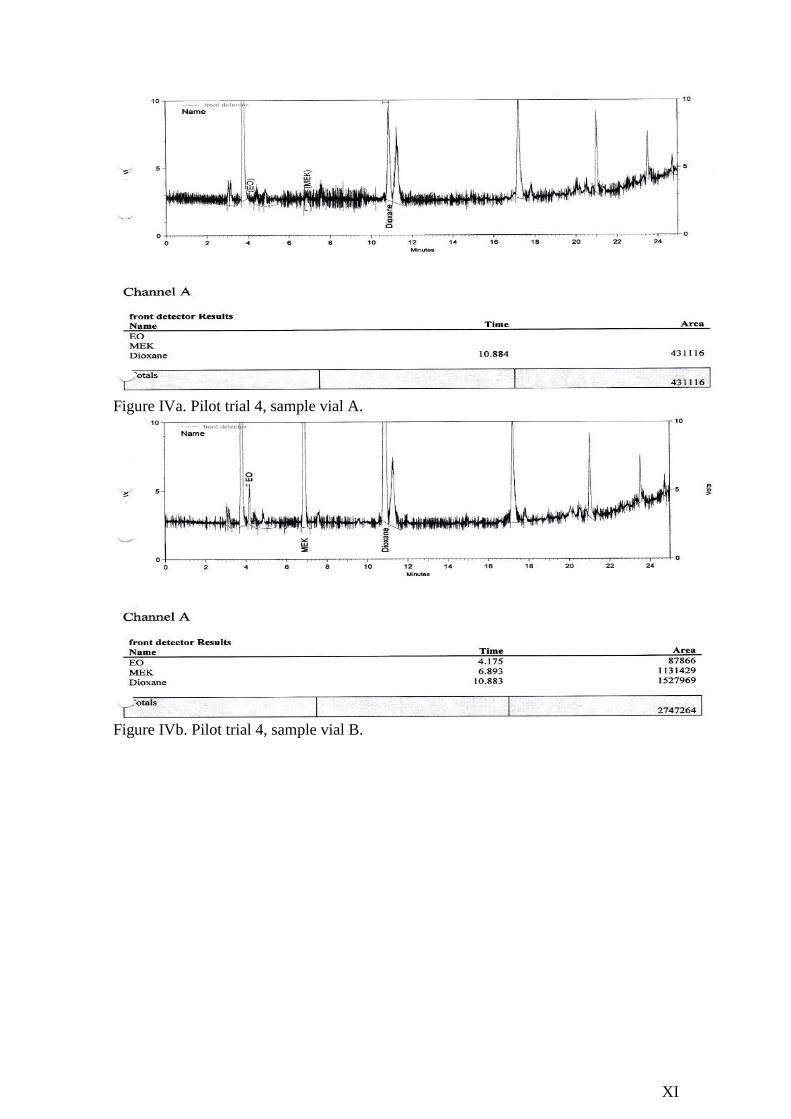
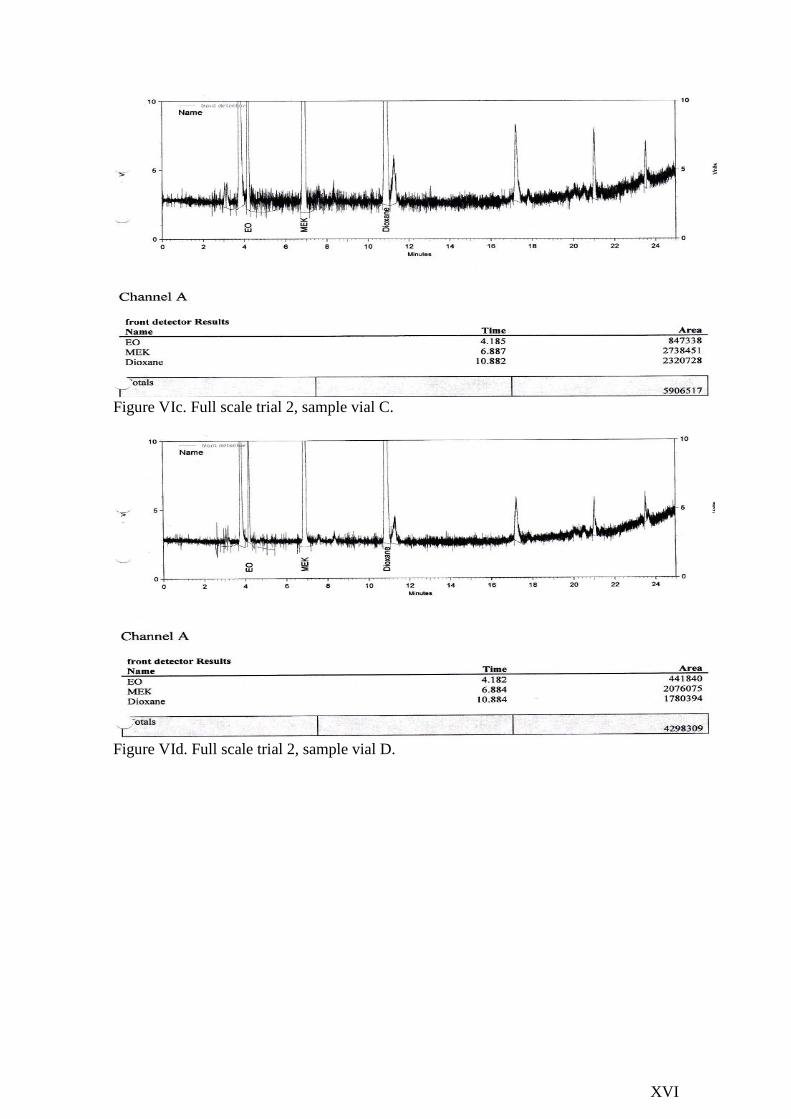
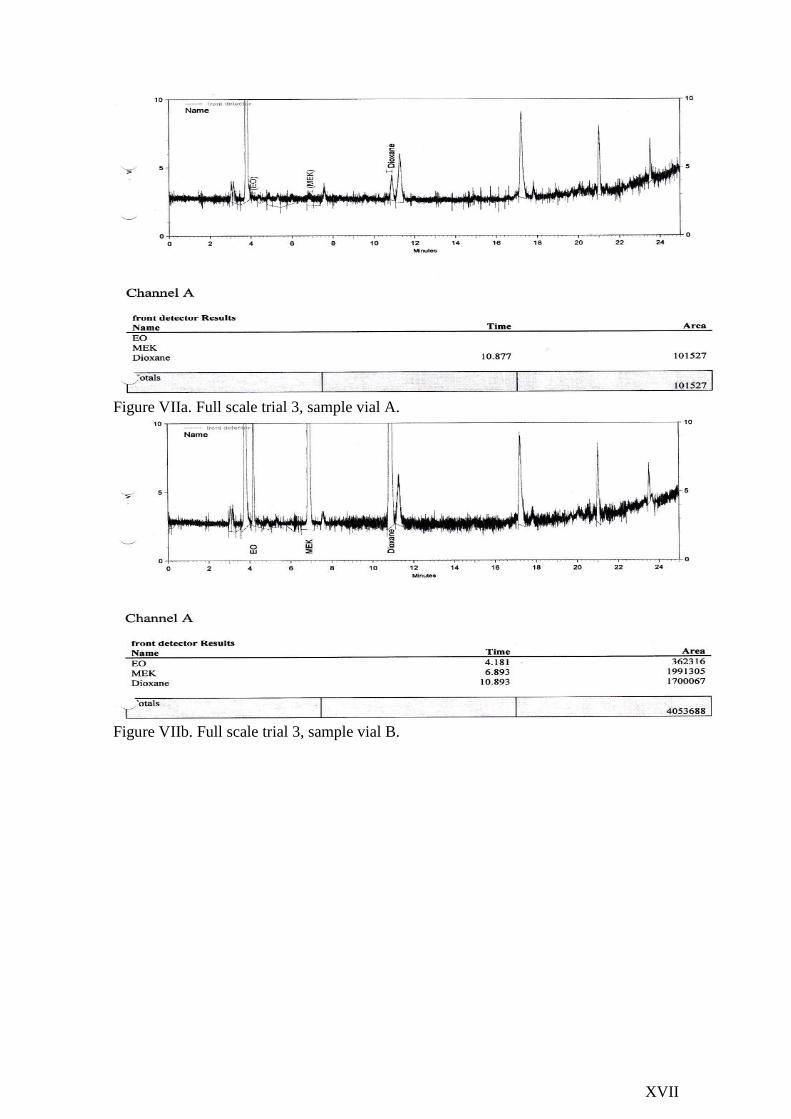
Appendix 3.
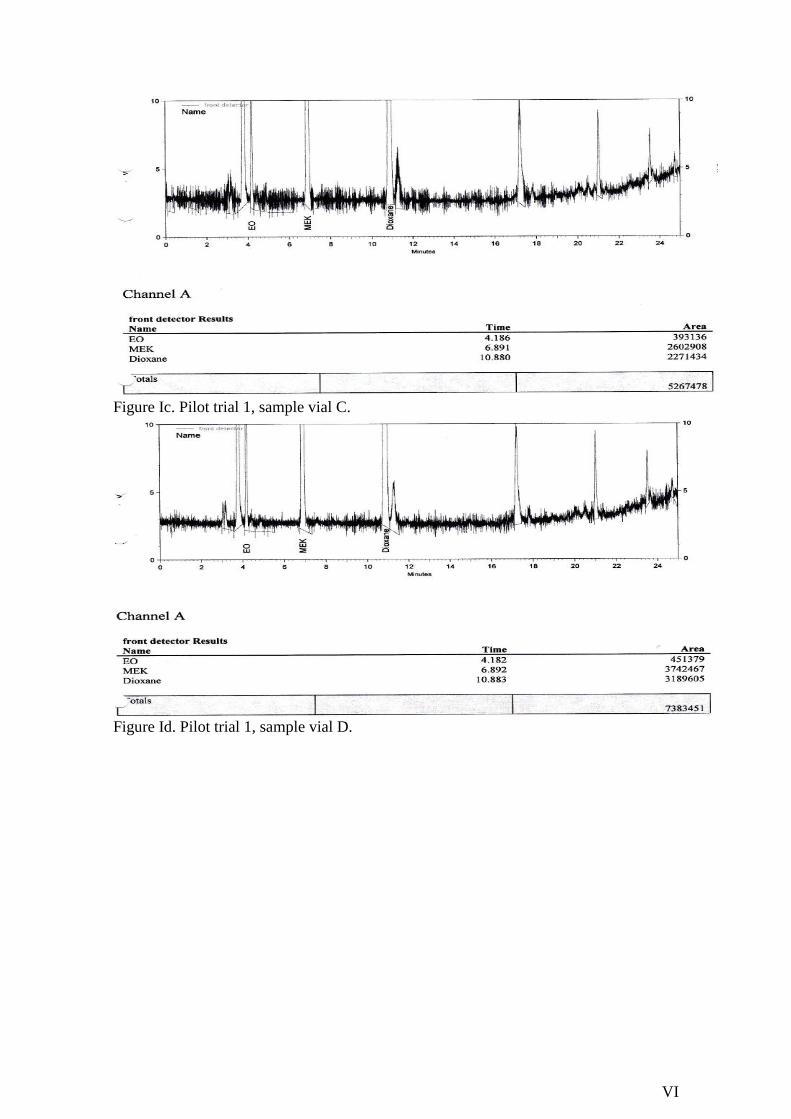
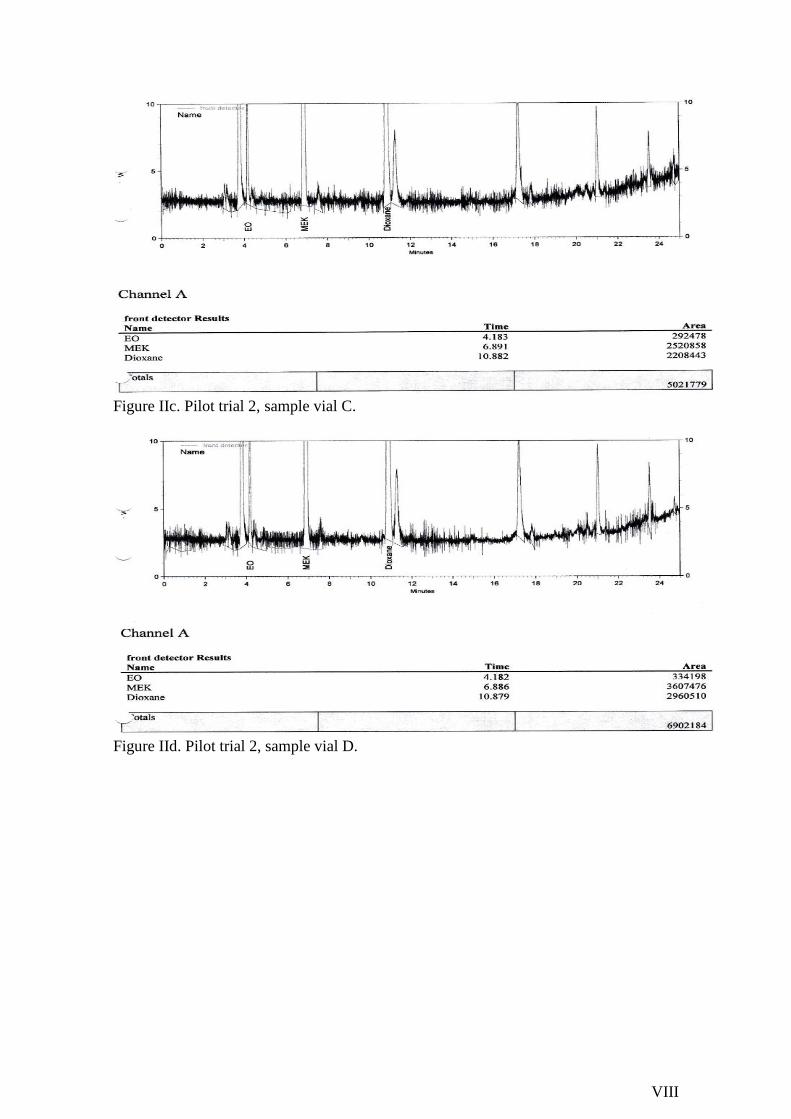
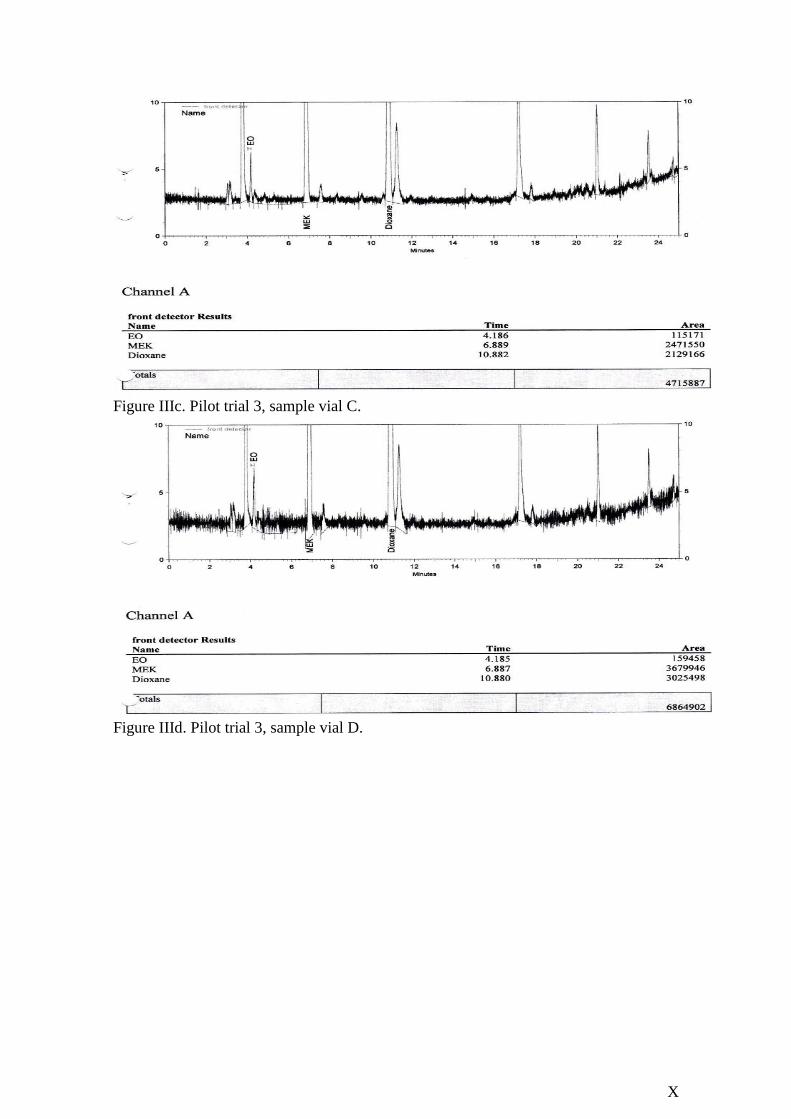
GC results for the pilot and full scale trials. For each of the products four GC spectrums
are needed to quantify the amount of dioxane that they contain. The samples contain
different amount of standard and the results are used to create a linear relation between
the samples and in that way the amount of dioxane in the product can be calculated.
Pilot trial results are shown in figure I-V and the full scale results are shown in figure
VI-IIV. Sample vial A, B, C and D always have 0 ml, 0,3 ml, 0,7 ml and 1 ml standard
respectively.
Figure Ia. Pilot trial 1, sample vial A.
Figure Ib. Pilot trial 1, sample vial B.
VI
Figure Ic. Pilot trial 1, sample vial C.
Figure Id. Pilot trial 1, sample vial D.

VII
Figure IIa. Pilot trial 2, sample vial A.
Figure IIb. Pilot trial 2, sample vial B.
VIII
Figure IIc. Pilot trial 2, sample vial C.
Figure IId. Pilot trial 2, sample vial D.

IX
Figure IIIa. Pilot trial 3, sample vial A.
Figure IIIb. Pilot trial 3, sample vial B.
X
Figure IIIc. Pilot trial 3, sample vial C.
Figure IIId. Pilot trial 3, sample vial D.
XI
Figure IVa. Pilot trial 4, sample vial A.
Figure IVb. Pilot trial 4, sample vial B.
XII
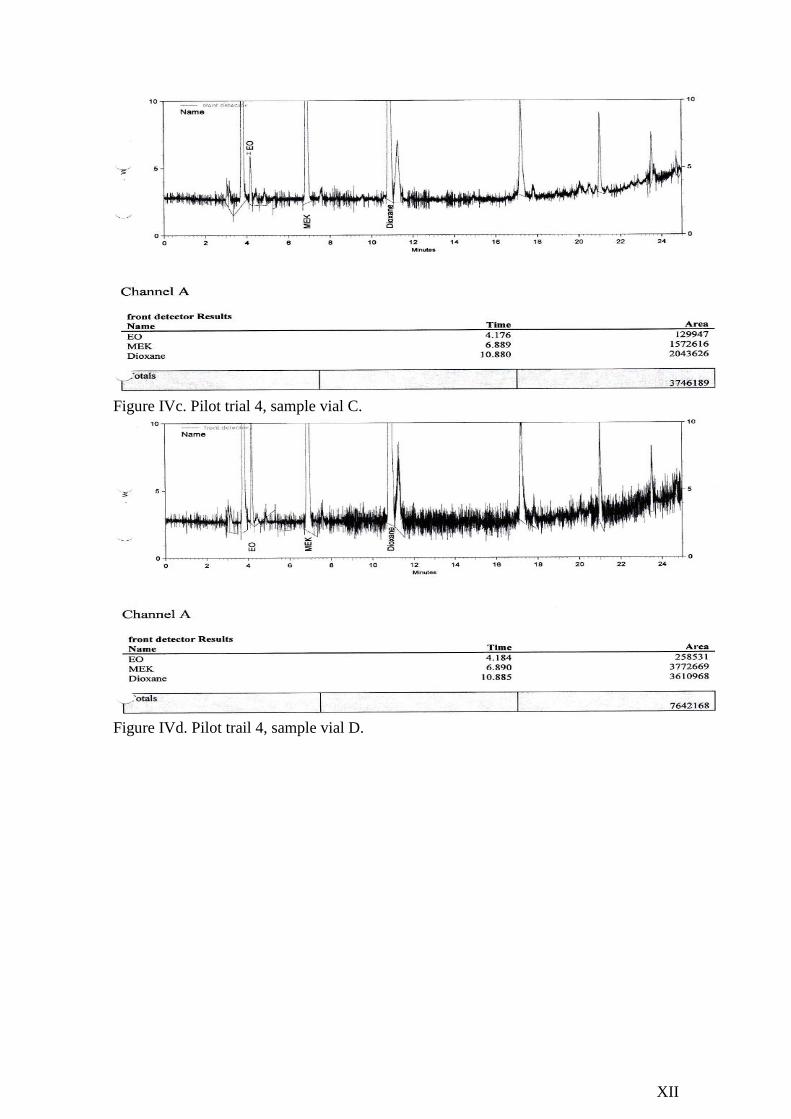
Figure IVc. Pilot trial 4, sample vial C.
Figure IVd. Pilot trail 4, sample vial D.
XIII
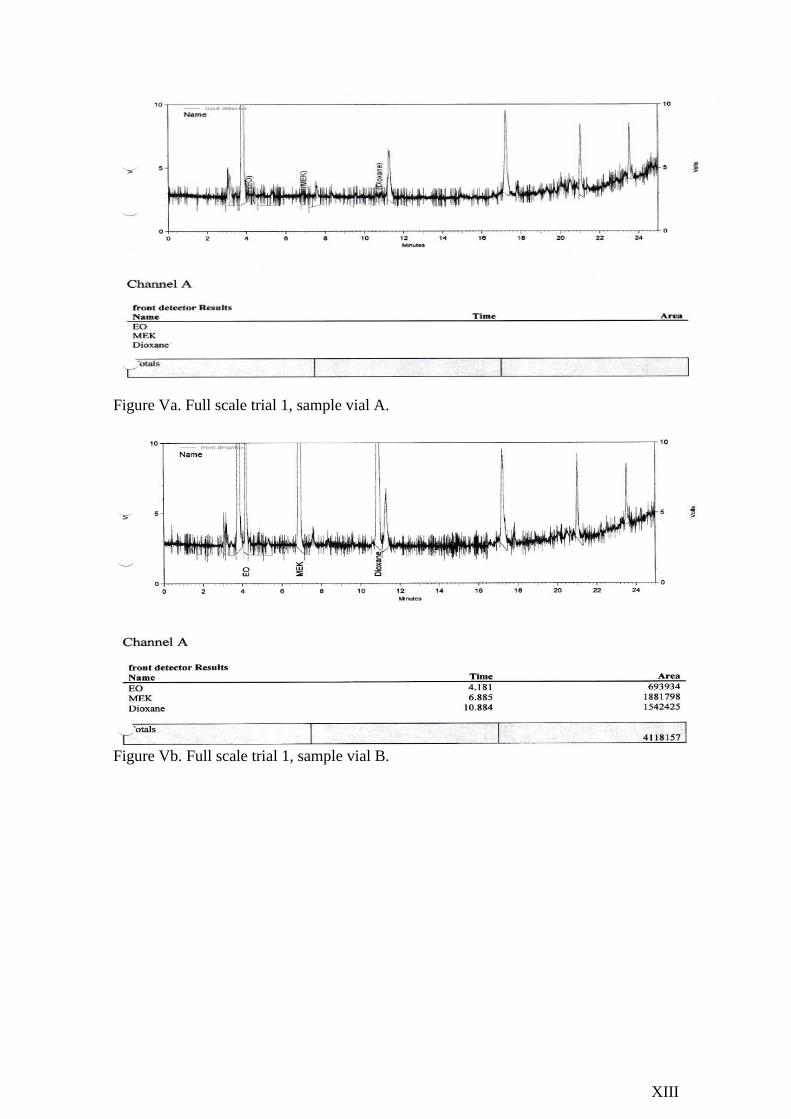
Figure Va. Full scale trial 1, sample vial A.
Figure Vb. Full scale trial 1, sample vial B.
XIV
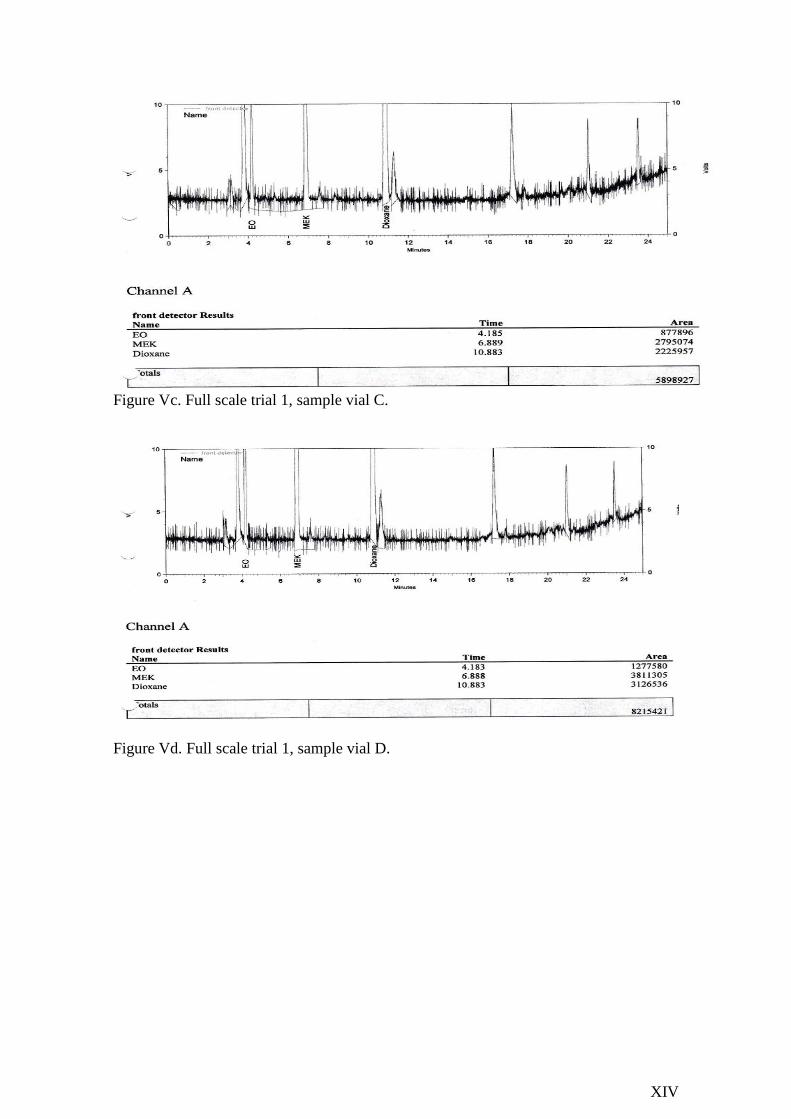
Figure Vc. Full scale trial 1, sample vial C.
Figure Vd. Full scale trial 1, sample vial D.

XV
Figure VIa. Full scale trial 2, sample vial A.
Figure VIb. Full scale trial 2, sample vial B.
XVI
Figure VIc. Full scale trial 2, sample vial C.
Figure VId. Full scale trial 2, sample vial D.
XVII
Figure VIIa. Full scale trial 3, sample vial A.
Figure VIIb. Full scale trial 3, sample vial B.
XVIII
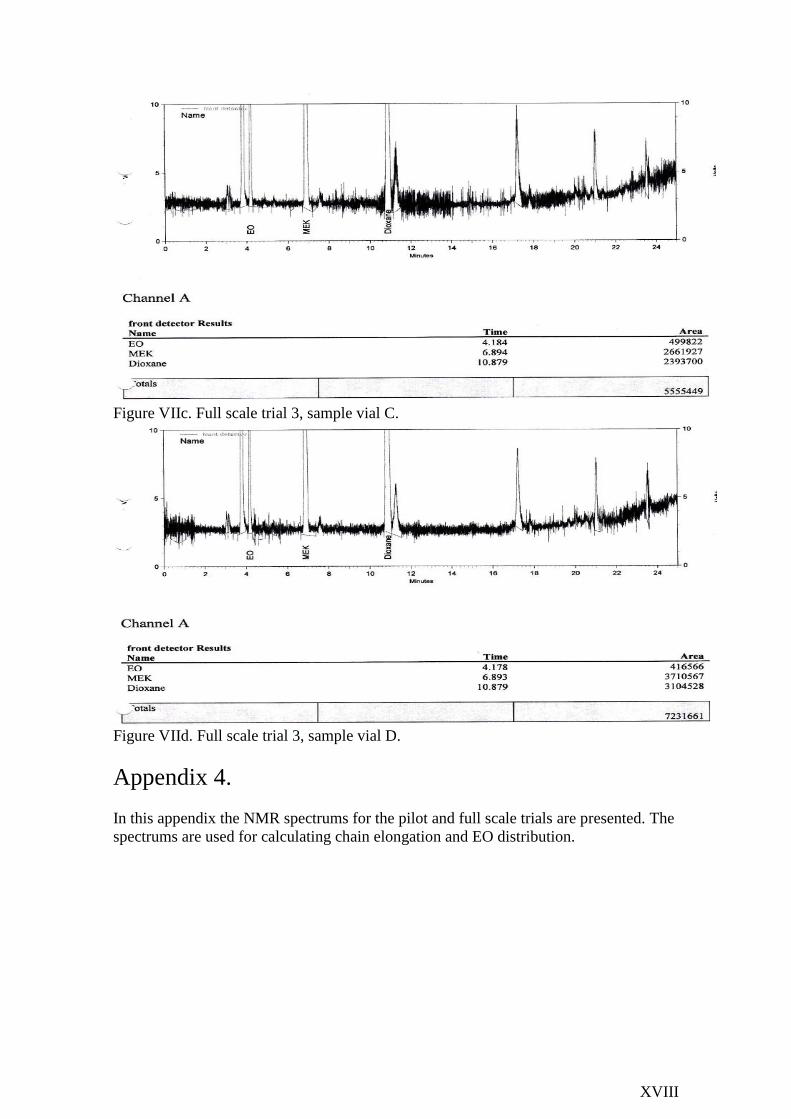
Figure VIIc. Full scale trial 3, sample vial C.
Figure VIId. Full scale trial 3, sample vial D.
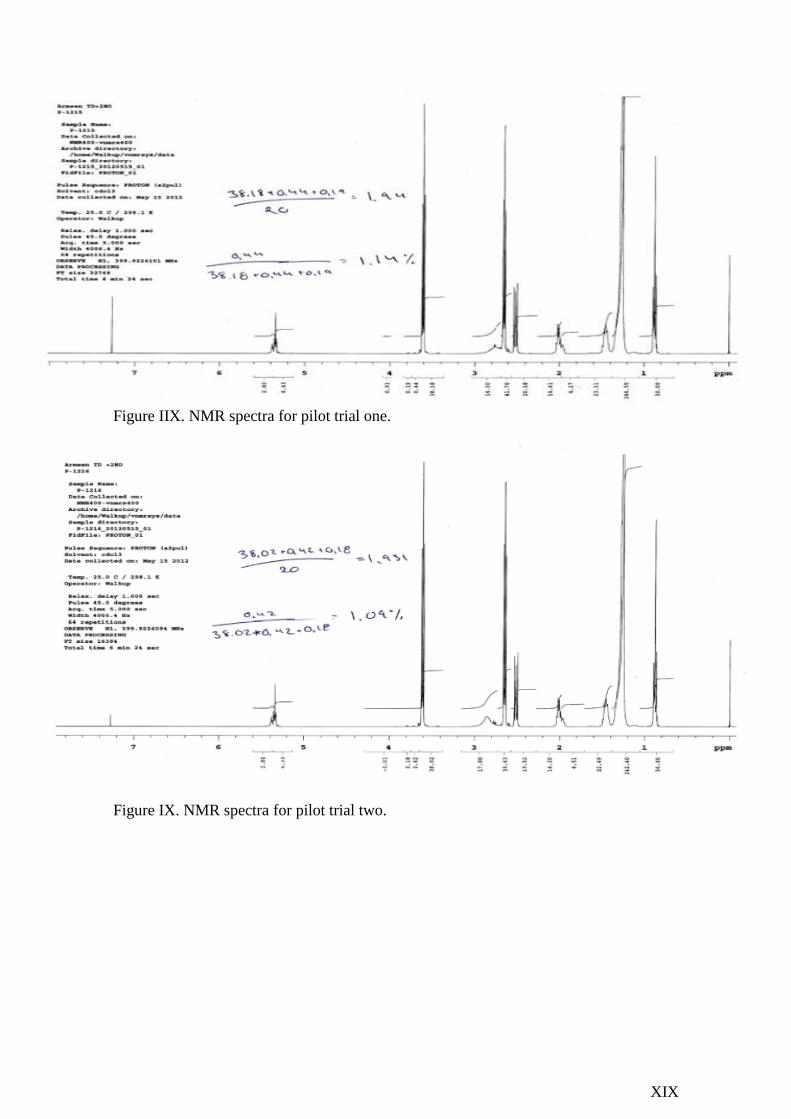
Appendix 4.
In this appendix the NMR spectrums for the pilot and full scale trials are presented. The
spectrums are used for calculating chain elongation and EO distribution.
XIX
Figure IIX. NMR spectra for pilot trial one.
Figure IX. NMR spectra for pilot trial two.
XX
Figure X. NMR spectra for pilot trial three.
Figure XI. NMR spectra for pilot trial four.
XXI
Figure XII. NMR spectra for full scale trial one.
Figure XIII. NMR spectra for full scale trial two.
XXII
Figure XIV. NMR spectra for full scale trial three.