ethovision xt - usf health
TRANSCRIPT

EthoVision® XT is a state-of-the-art video tracking system for automatically recording animal activity and movement. EthoVision XT offers far more than just tracking your animal. Its functionality includes the ability to track the nose, body center, and tail base point of rats and mice, measure the elongation and mobility of their body, and synchro-nize and visualize external data co-acquired with another data acquisition (DAQ) system. The unique detection method ensures that tracking continues, even when the background changes during your observations. The system can be set up to meet virtually all your needs. You can track animals in any type of maze, freely choose measurable parameters, and select whole trials or parts of trials for analysis. EthoVision XT greatly extends the possibilities for behavioral observations already offered by the current EthoVision range.
System configurationsThe base package of EthoVision XT allows you to track the body center point of one animal in one arena. All features described in this document apply to the base package, except for the features belonging to the modules mentioned below. The base package can be extended with one to three different modules: • Multiple body points module – Allows you to
track the nose point and tail base point of rats and mice, in addition to their body center. Tracking the nose point may be of interest in, for instance, measuring explorative behavior in the object recognition test. With this module you can also measure mobility and elongation of the animal’s body on the basis of thresholds that you set yourself. These parameters can be used to automatically measure explorative and motility behavior.
• Physiology module – Synchronizes data obtained with EthoVision XT and co-acquired external data (such as physiological data). Both streams can be visualized in sync and inspected.
• Multiple arenas module – Allows you to track in up to one hundred arenas simultaneously, with in each arena a single animal.
The modular approach makes the system very flexible and versatile and provides you with a future-proof investment.
technical specifications
EthoVision XT
�
Figure 1. EthoVision XT modules.
Figure 2. EthoVision XT user interface.
Multiple body points module
Physiology module
Multiple arenas module
Base package

PROGRAM STRUCTURE
Menu structureEthoVision XT’s user interface has been logically subdivided into menus and dialogs reflecting the different steps in a research project: • Data management • Set up the experiment
- Define experiment settings- Create list of trials and independent variables
(optional)- Define experimental arenas and zones (zones:
optional)- Define trial control conditions (optional)- Define detection settings
• Run the trials (data acquisition)• Edit the data (optional)• Select the data (optional)• Visualize the data• Analyze the data• Export the data (optional)• Help featuresThe logical structure of the menus and the transparent set-up make sure you will quickly get acquainted with the program.
Data structureInformation in EthoVision XT is organized at several levels. An experiment embodies a series of trials carried out with a particular experimental set-up. The data from one animal collected during a trial, the X- and Y-coordinates of the body center point, the nose point, the tail base point, and the body surface area per timestamp, are referred to as a track.
DATA MANAGEMENT: THE EXPERIMENT EXPLORER
The experiment settings are stored in folders of the tree-like experiment explorer. In this overview, you can easily keep track of experimental designs, trial lists, analysis results, etc. The different folders of the explorer represent the components belonging to the currently opened experiment, including:• Experiment settings – Specify the name and
location of the experiment, the number of arenas in which an animal will be tracked, what body parts will be tracked, and from which source (live or from video file) tracking will take place.
• Trial list – List the number of trials that are going to be carried out and the values of the independent variables belonging to these trials. For instance, for each trial the ID of the animal and its treatment can be specified to give a complete overview of the planned trials.
• Arena settings – Determine in what region of the video image on the screen the animal needs to be tracked and what the zones of interest are.
• Trial control profiles – Specify trial control rules. A trial control rule is made of a condition and an action (start or stop tracking) that takes place when the condition is met. For instance, start tracking when the rat’s body center point has been in the center zone of the open field for two seconds.
• Detection settings – Determine how the animalDetermine how the animal will be detected (all acquisition settings like detection method, sample rate, contrast and contour adjustments, etc.).
• Data profiles – Define which data is selected (filtered, nested, or split in time bins) for analysis and visualization.
• Analysis profiles – Specify which statistics (minimum, maximum, mean, duration, etc.) of which parameters (in zone, distance to zone, velocity, etc.) will be calculated.
• Acquired tracks – The tracks recorded by EthoVision XT.
The profiles and track files can be recombined as desired (e.g. you can analyze data of the experiment with several different data profiles or change your detection method, while maintaining the same arena layout).
In addition to managing your data of the current experiment, you can open, close, create, and save experiments. Furthermore, you can make copies of your entire experiment with the following options:
�
Figure 3. The Experiment Explorer.
• Backup – Complete backup of a single experiment with all its associated files. You can use backup to safeguard data and to transfer it to another computer.
• Restore backup – Completely restore an experiment. Amongst others, this enables you to perform data acquisition and data analysis on separate computers.
SET UP THE EXPERIMENT
Setting up your experiment includes defining the experiment settings, arena settings, trial control conditions, detections settings, and creating the trial list.
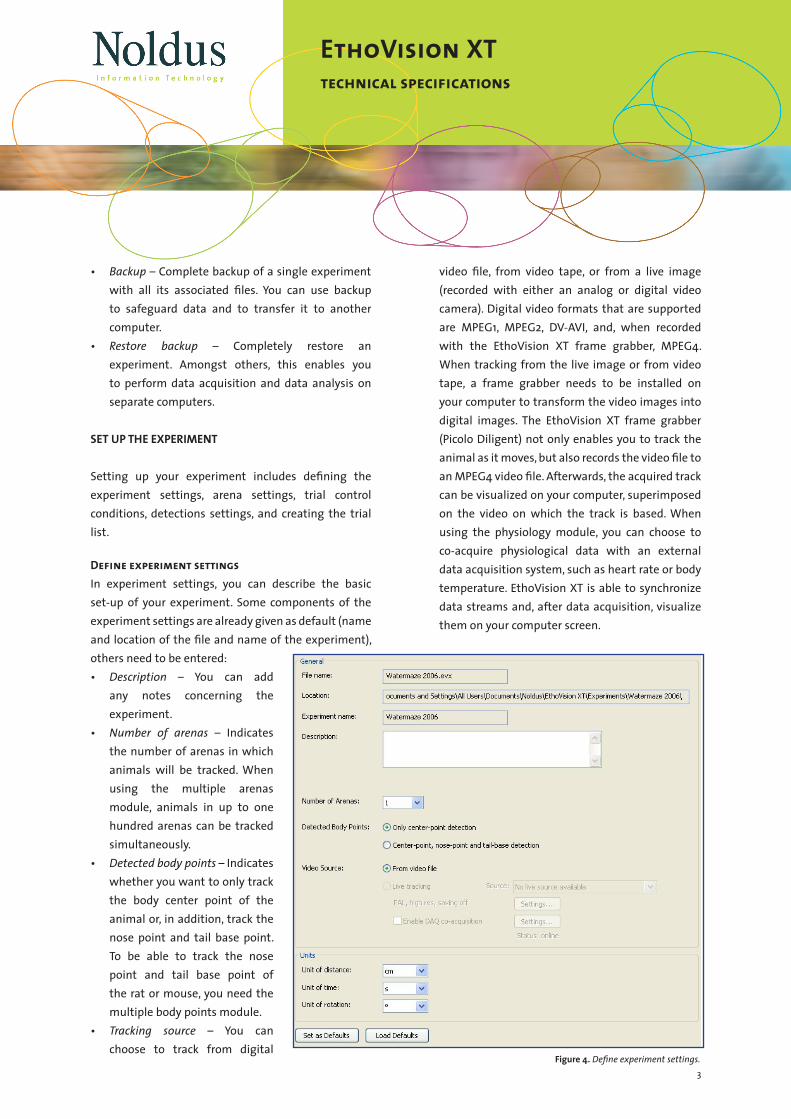
Define experiment settingsIn experiment settings, you can describe the basic set-up of your experiment. Some components of the experiment settings are already given as default (name and location of the file and name of the experiment), others need to be entered: • Description – You can add
any notes concerning the experiment.
• Number of arenas – Indicates the number of arenas in which animals will be tracked. When using the multiple arenas module, animals in up to one hundred arenas can be tracked simultaneously.
• Detected body points – Indicates whether you want to only track the body center point of the animal or, in addition, track the nose point and tail base point. To be able to track the nose point and tail base point of the rat or mouse, you need the multiple body points module.
• Tracking source – You can choose to track from digital
video file, from video tape, or from a live image (recorded with either an analog or digital video camera). Digital video formats that are supported are MPEG�, MPEG�, DV-AVI, and, when recorded with the EthoVision XT frame grabber, MPEG4. When tracking from the live image or from video tape, a frame grabber needs to be installed on your computer to transform the video images into digital images. The EthoVision XT frame grabber (Picolo Diligent) not only enables you to track the animal as it moves, but also records the video file to an MPEG4 video file. Afterwards, the acquired track can be visualized on your computer, superimposed on the video on which the track is based. When using the physiology module, you can choose to co-acquire physiological data with an external data acquisition system, such as heart rate or body temperature. EthoVision XT is able to synchronize data streams and, after data acquisition, visualize them on your computer screen.
�
technical specifications
EthoVision XT
Figure 4. Define experiment settings.

• Units – You can choose what units of distance (mm, cm, m, or inch), time (ms, s, min, hr), and rotation (°, rat, grad, rot) you prefer.
Create list of trials and independent variables The list with trials and independent variables displays all trials that you plan to carry out (or have already carried out or have skipped) and the values of the independent variables belonging to these trials; all ordered in a cross table. In this way, you can easily verify which values of specific independent variables, for instance animal number or animal treatment, belong to which trial number. EthoVision XT can thus be used to schedule the trials: e.g. assist the experimenter in applying the correct treatment and select the correct animals. During data acquisition, the values of the independent variables can be displayed on the computer monitor. Independent variables are descriptors of conditions of which the values are constant during a single trial, but may vary between trials. EthoVision XT differentiates between system variables and user-defined variables: • System variables – These variables contain
information dictated by the system. They represent settings in EthoVision XT, such as the start time of the trial and the duration of the trial. You can decide which system variables you want to have visible in the trial list by selecting the variables of your choice.
• User-defined variables – You can define these variables yourself. For instance, you can add variables on treatment, dosage, operator, and age of the subject or describe external circumstances which may influence the experiment, like room temperature, air pressure, illumination, etc. For each user-defined variable you can choose the data type (text, numerical, time stamp, duration, and Boolean) and values (for instance ‘treated’ and ‘non-treated’ for the independent variable ‘treatment’).
Later on, independent variables can be used to select and group data for visualization and analysis.
Define experimental arenas and zones By defining an arena, i.e. a region in the video image in which an animal is tracked by EthoVision XT, parts that do not belong to the defined arena are ignored during data acquisition. This ensures that events outside of the experimental arena do not interfere with the actual measurement. Defining an arena starts with grabbing a background image. Arenas of any shape and size can be drawn over this still image of your experimental set-up:• Shape of the arena(s) – By using different drawing
options (line, circle, rectangle, ellipse, open or closed polyline), any shape of arena can quickly be drawn and entered into the computer. This means that you can use the system for any kind of test, such as a water maze experiment, a radial arm maze experiment, or an open field test. As you can zoom in on the background image, the arena outlines can be traced with high accuracy.
• Number of arenas – When using the multiple arenas module (which allows you to define up to one hundred arenas) and when indicated to use more than one arena in the experiment settings, the arena settings window will automatically show the indicated number of arenas. If you have multiple arenas with the same shape and size, you can simply duplicate the defined arena as many times as you desire. This is extremely useful when using a large amount of arenas, for instance when tracking fish larvae in a 96-well plate. Data sets acquired in separate arenas are stored as separate track files.
Each arena can subsequently be divided into several spatial zones (for example, the quadrants of a water maze or the rest and object zones in the novel object recognition test). These zones can be used during analysis to detect behavioral differences between different parts of the arena. A variety of calculations, such as frequency (number of visits to a zone) and duration of approaching the object zone (accumulative time spent with nose point in the object zone) can be
used during analysis to quantify behaviors that are related to the spatial position in the arena. Zones are organized in zone groups. Within zone groups, zones need to be non-overlapping. If you want to define overlapping zones, you can do so by using separate zone groups.
4
Figure 5. Trial list with six trials, two system variables, and two user-defined variables.

An overview of all arenas and zone groups that you defined is given in the arenas settings window. In this window you can add and delete zone groups and zones, change their colors, and indicate which zone groups and arenas you like to have displayed in the reference image.• Shape of zones – By using different drawing
options (line, circle, rectangle, ellipse, open or closed polyline) any shape of zone can quickly be drawn in the arena.
• Number of zones – You can define an unlimited amount of zone groups per arena. If you use multiple arenas with the same size, shape, and zone design, you can define one arena with its zone groups and zones and duplicate the complete arena to the amount that you desire.
You can calculate statistics for single zones or a combination of zones (cumulative zones). By redefining
the zones of interest after tracking you can re-analyze your data in any way that you want.
Another way to be able to define overlapping zones within an arena is to use a cumulative zone. Several (overlapping or non-overlapping) zones of interest within the arena
can be combined to a cumulative zone, for instance the two open arms of a plus maze or the four corners of an open field. Within a cumulative zone, transitions between the zones are not counted and the time spent in the zones is added up.
To convert distances of the digitized video image (in pixels) to real distances within the arena (in meters, centimeters, inches) you need to calibrate the arena. For this, you simply need to measure the real-world distance between two points in your arena (for instance the width of your arena), select these two points in the digital image of your arena, and type in the real-world distance in the window that opens automatically. During data acquisition and analysis, the measurements are given in real-world distances. When using multiple arenas, you can choose to apply the calibration of one arena to all other arenas.
Maximum size of the arenaThe maximum arena size, in pixels, is limited by the image resolution of the digital video file you are using, camera, frame grabber, and the image resolution settings in the experiment settings. When working with the EthoVision XT frame grabber you can choose between medium (PAL: �84 x �88 pixels; NTSC: ��0 x �40 pixels) and high (PAL: 768 x 576 pixels; NTSC: 640 x 480 pixels) resolution. If you select the maximum frame grabber resolution, you can reliably track an animal two hundred times as small as its arena. This corresponds to tracking an insect as small as a parasitic wasp in an arena of 80 x �40 cm!
5
technical specifications
EthoVision XT
Figure 6. Arena with zone group 1 (zones west and east) and zone group 2 (zones north and south).
Figure 7. Arena for novel object recognition test with three zones in two zone groups.

Define trial control conditionsThe trial control functionality allows you to start and stop tracking when conditions that you defined are met. A trial control rule is made of a condition and an action that takes place when the condition is met. The condition can be based on the position of the nose point, tail base point, or body center point of the animal in relation to a specific zone or arena and the duration of this position. Possible actions to be taken when the defined condition is met are starting and stopping of data acquisition. Some examples of trial condition rules, when using only one arena:• Start data acquisition when the rat’s body center
point has been in the arena for 5 seconds.• Stop data acquisition when the mouse’s body center
point has been detected in the zone belonging to the platform of the water maze for the first time.
• Stop data acquisition when the rat’s nose point has been in the object zone for �8 seconds.
You can define as many rules as you wish. When multiple rules are defined, EthoVision XT takes the action as soon as the corresponding condition is met, no matter in which order the rules have been entered. You can also set a maximum trial duration. This is handy in case the start or stop condition is never met. For example, if you create a condition ‘stop recording when the animal’s nose point has been in the object zone for 5 seconds’ it may happen that this condition is never met. In such case the system would wait indefinitely for the stop recording condition. To prevent this from happening, select a maximum trial duration.
When using multiple arenas with the multiple arenas module, the experiment control function goes even further. A generic start condition can be applied to each arena individually. When
this condition is met in an arena, EthoVision XT starts tracking in that arena only. By using this cascading start option, you no longer need to worry about placing your animals in their arenas at the exact same time.
Define detection settingsDefining your detection settings includes choosing the detection method, choosing whether or not to use a scan window, adjust the contour settings, adjust the sample rate and pixel smoothing of the video, and define the minimum and maximum size of the animals. If you are using the multiple body points module, you can decide to visualize the nose point, tail base point, body center point, viewing direction, and body contour of the animal while defining your detection settings, to immediately see the results of your settings.
To assure optimal object detection in any experimental set-up, EthoVision XT offers three different object detection methods:• Gray scaling – Defines all connecting pixels with
a gray value above a certain threshold or below another threshold as a possible object. This method can be used when there is high contrast between the background and the animal, for instance when tracking a white rat in an entirely black background.
• Static subtraction – Looks at differences between pixels in a reference image (without the animal) and the new digitized image (including the animal). This method can be used when there is low contrast
6
Figure 9. Data acquisition with trial control and multiple arenas.
Figure 8. Define trial control conditions.

between the animal and the background or the background contains pixels the same value as the animal.
• Dynamic subtraction – Looks at differences between pixels in a reference image and the new digitized image, while updating the reference image on each sample. This detection method ensures that animals will still be reliably tracked, even when the background changes during tracking. Besides the situation in which changes in the background are likely to appear (due to the animal urinating or reorganizing its bedding), this method is useful when an image of the empty arena is not available.
When using one of the subtraction methods, you need to choose to track only objects that are brighter than the background, only objects that are darker than the background, or objects that are brighter and darker than the background (for instance, a hooded rat).
You can scan the complete arena or use a ‘scan window’. With the latter option, EthoVision XT searches for the object in an area smaller than the entire arena. The size of the scan window is automatically determined
by the program, according to the animal’s size. The use of a scan window minimizes problems with reflections in the arena (for instance in the aquatic environment when tracking fish or in the water maze) and reduces the average processor load. The sample rate (the rate at which EthoVision XT analyzes the images to find the animal) can be increased, without increasing the number of missing samples. Two functions to adjust the contour of the animal are available in EthoVision XT. These allow you to adjust the digitized image of the animal detected by the system during the tracking process to avoid accidental mix-up of the object with background noise. • Erosion – Decrease of the animal’s surface area
with �-�0 pixels. This function can be used to eliminate thin parts of the detected object, like a rat’s tail.
• Dilation – Increase of the animal’s surface area with �-�0 pixels. This function can be used to connect parts of the objects that were separated during
object detection (for instance the stripes on a wasp’s body or separation caused by the bars of a cage).
These two functions can be combined. When the option to first erode and then dilate is selected, stick-out bits of the animal’s body are removed (while the body surface area stays the same). When this is the other way around, indentations are removed from the animal’s body, giving a smoother outline.
In the detection settings window you can adjust the sample rate (maximum with PAL= �5 samples/second; NTSC=�9.97 samples/second) and the pixel smoothing level of your video. If the sample rate is too high, small movements may give an overestima-tion of your parameters and if the sample rate is
7
technical specifications
EthoVision XT
Figure 10. The detection setting screen with (A) the detection settings window, (B) the video window, (C) the playback control window, (D) the trial information pane, (E) the analysis results pane, and (F) the view settings pane.
too low you may loose important information. The optimal sample rate depends, among others, on the animal species and the activity of the animal. By increa-sing the pixel smoothing level, the influence of noise can be reduced. A high level of pixel smoothing is recommended when the background has a high variation in gray values.
Furthermore, you can set a minimum and maximum size an object should have in order to be detected. This function prevents objects other than the animal (droppings) or reflections being tracked. RUN THE TRIALS (DATA ACQUISITION)
When you are satisfied with the set-up of your experiment, you can start to acquire data.
Acquire data When acquiring data, all detection settings are inaccessible; when at least one trial has been carried out, the detection settings profile for that trial is locked. In this way it is prevented that settings are accidentally changed which may lead to incomplete data files. When new detection settings are required, you can easily do this by defining a new detection settings profile and use this profile.
You can acquire data in four different ways, depending on your experimental set-up and protocol:
�. Acquire data live – The animals are tracked asThe animals are tracked as they move in your experimental set-up and track data are stored on your hard disk. This method requires no disk space for video storage, but you do not have a video backup either.
�. Acquire data live and record video simultaneously – The animals are tracked as they move in your
experimental set-up and the track data are stored on your hard disk. Meanwhile, EthoVision XT records a video to an MPEG4 video file. The acquired track can be visualized on your computer, superimposed on the video on which the track is based. In addition, you have a video backup which, if needed, enables you to acquire data once again
�. Recording video with EthoVision XT and then acquire data (two-stage tracking) – EthoVision XTEthoVision XT records a video of the animal moving to an MPEG4 file and you are free to acquire data from this video any time you desire. This may be of interest when the computer is not fast enough for recording a video file and acquiring data at the same time. Again, the acquired track can be visualized on your computer, superimposed on the video (MPEG4) on which the track is based.
4. Acquire data from video files recorded with programs other than EthoVision XT – You can use video filesYou can use video files recorded with other programs and use EthoVision XT to acquire and analyze data from it.
When tracking from digital video file (options two to four), the speed can be adjusted to your desire. For example, when the detection settings do not require too much from the processor speed, you can speed up the rate in which the media file is played. This option allows you to analyze the samples at a rate faster than the actual sample rate. This feature allows you to gain valuable time: an experiment of 5 minutes can be tracked in much less time.
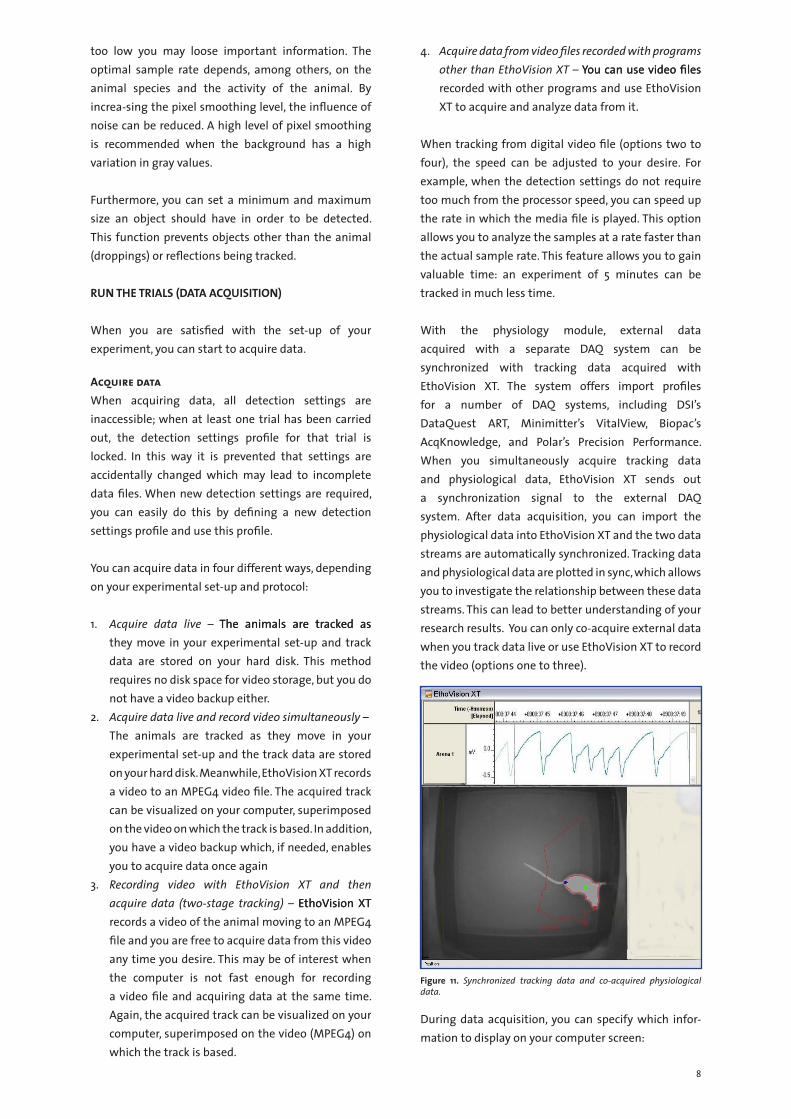
With the physiology module, external data acquired with a separate DAQ system can be synchronized with tracking data acquired with EthoVision XT. The system offers import profiles for a number of DAQ systems, including DSI’s DataQuest ART, Minimitter’s VitalView, Biopac’s AcqKnowledge, and Polar’s Precision Performance. When you simultaneously acquire tracking data and physiological data, EthoVision XT sends out a synchronization signal to the external DAQ system. After data acquisition, you can import the physiological data into EthoVision XT and the two data streams are automatically synchronized. Tracking data and physiological data are plotted in sync, which allows you to investigate the relationship between these data streams. This can lead to better understanding of your research results. You can only co-acquire external data when you track data live or use EthoVision XT to record the video (options one to three).
During data acquisition, you can specify which infor-mation to display on your computer screen:
8
Figure 11. Synchronized tracking data and co-acquired physiological data.

• The video window shows the video signal from your camera or the content of the digital media file. You can choose to either hide or show the acquisition status (awaiting start, generating, etc.), the arenas and zones you defined, and the track features.
• The acquisition control window serves to start, stop, add, or skip trials and to rewind the media file forward or backward.
• The acquisition method window shows whether you are tracking live, from video file, or just saving the video and shows the number or name of the trial to be acquired.
• The trial information pane shows the time the current trial has started (or the video recording has started) and the actual time from your computer.
• The analysis results pane shows, for each arena, real-time information on the detected animal. Information includes the time elapsed since the start of data acquisition, the percentage and the number of samples in which the animal was not found, and the velocity of the body center in the current sample. When using the multiple body points module, the velocity of the nose point and tail base point, the head direction of the animal, and the mobility and elongation status of the animal in the current sample are shown as well.
EDIT THE DATA
The editing data function in EthoVision XT is only meant to correct minor errors, for instance due to the system tracking a reflection instead of the animal (in
an aquatic environment) or confusing the nose point and tail base point. Errors are not very likely to happen when the detection settings are well defined and the experimental set-up is optimal. Though, when they do occur they are easily recognized and corrected. There are several ways to detect errors:• You can set different criteria to find the samples in
which you like to correct errors, for instance based on surface area or distance between nose and tail base point.
• If you have created an MPEG4 file whilst live tracking, the acquired track can be visualized superimposed on the video on which the track is based. Variations between the track and the video may indicate minor errors.
• You can select all missing samples. • There is an easy way to find and correct samples
in which the nose point and tail base point are swapped.
The editing process simply consists of selecting the track to be edited, correcting the error (deleting or moving a point, swapping nose and tail base point), and saving your corrections. After you have saved the edits, the tracks that are subject to analysis always include the changes. If required, you can always return
to the original track file.
SELECT THE DATA
You may want to select data before carrying out the analysis (creating track plots and calcu-lating statistics) or visualization. If you like to analyze some tracks and not others, for instance because you only want tracks
of treated animals, or only like to visualize tracks in a specific arena, you can filter your tracks. If you like to analyze parts of tracks, for instance those in which the animal was moving or those in which the animal was in the center zone of the arena, you can nest over data. If you only want to analyze parts of tracks
9
technical specifications
EthoVision XT
Figure 12. Data acquisition screen.

corresponding to a regular time interval, for instance every tenth minute of a trial, you can define time bins and then run the analysis.
All selection criteria are saved in the data profile folder of the experiment explorer. User-defined selection criteria are conveniently arranged in a sequence of boxes connected by arrows. The first box, the start box, contains all tracks stored in the experiment. The last box, the result box, contains the selected data
that will be used for analysis. In between the start and result box, you can add selection boxes to define your selection criteria. Each selection box indicates over which value the tracks are selected (for instance,
reduce to tracks with treatment = treated) or parts of tracks are selected (reduce to parts of tracks in which the animal was moving). When placing the boxes in sequence, all selection criteria are taken into consi-deration. In the mentioned example all parts of tracks in which the animal was treated AND was moving are selected.
When you split the sequence in two branches which end in the same result box, the result box contains all parts of tracks in which the animal was treated OR the
animal was moving. You can combine as many nesting and filtering conditions as you want.
You can filter and nest over several variables:
Filtering: selection of whole tracksFiltering is the process of picking out entire tracks, according to the value of variables. Filtered tracks and the corresponding video and external (physiological) data are subject to analysis. You can select tracks based on: • Values of system variables – For example, filter byFor example, filter by
trial name if you want to analyze all trials from trial � to �0.
• Values of user-defined variables – For example,For example, filter by sex if you want to analyze all trials of female animals.
• Co-acquired external (physiological) data – ForFor example, filter by the EEG variable if you want to visualize the tracks for which EEG data is co-acquired.
Nesting: selection of parts of tracksNesting is the process of picking out parts of tracks specified by states of the animal or time interval. Track parts and the corresponding video and external (physi-ological) data are subject to analysis. You can select parts of tracks based on: • Zones – For example, nest over in zone if youFor example, nest over in zone if you
want to analyze all parts of tracks in which the mouse’s nose point was in the object zone. You can also nest over a group of zones. For instance, select all parts of tracks in which the animal’s body center point was in any of the four zones belonging to the arms of the plus maze.
• Behavioral states – For example, nest over elonga-tion when you want to select all parts of tracks in which the animal’s body was ‘stretched’. Behavioral states variables that can be used for nesting are movement (moving or not moving of the nose point, body center point, or tail base point), elonga-
�0
Figure 14. Data selection: all (parts of) tracks in which the animal was treated OR moving are selected.
Figure 13. Data selection: all (parts of) tracks in which the animal was treated AND moving are selected.
Figure 15. Concept of data filtering.
Figure 16. Concept of data nesting.

tion (contracted, normal, or stretched), and mobility (highly mobile, mobile, or immobile).
• Time interval – For example, nest over time when you want to select the first two minutes of each trial.
Define time bins: time-based selection of parts of tracksTime bins are time intervals of constant duration that you can define to analyze data as if the tracks were split in two or more segments. Time bins allow you to analyze a series of time intervals within each track. You can enter the length of each time bin (� second to �4 hours). Subsequently, the trials will be divided in time bins with the defined duration.
VISUALIZE THE DATA
After selecting the data (filtering, nesting and defining time bins), the selected tracks or parts of tracks can be visualized and/or analyzed. You can choose to only visualize the track plot or, if you co-acquired physiological data by means of the physiological data module, to visualize the external data plots as well.
Plotting of tracks The (parts of) tracks that have been selected will all be plotted on a single screen, allowing you to explore the tracks in your experi-ment. All track plots are displayed in one matrix and you can sort
rows and columns according to one or more indepen-dent variables. For instance, you can choose to use a user-defined variable (for instance ‘treatment’) to sort the columns and another variable (for instance ‘sex’) to sort the rows. This way, differences in tracks between males and females or between treated and non-treated animals can be easily spotted. Tracks can be played back and forth and snap shots can be taken and saved as a picture. You can choose to only visualize the tracks (paths) or to visualize the samples produced by the nose, body center, and tail base point as well. Samples within a track can be displayed in different colors, depending
��
technical specifications
EthoVision XT
Figure 18. Matrix with four plotted tracks. The columns are sorted by sex and the rows are sorted by treatment.
Figure 19. An example of plotting integrated data: track of one trial (in four different arenas) and the corresponding co-acquired ECG data.
Figure 17. Concept of applying time bins.

on the value of the parameter. For instance, you can choose to visualize the samples with low velocity in yellow and the samples with high velocity in orange. In the novel object recognition test you can distinguish between portions of the track in which the rat was moving fast towards the novel object and portions in which it was moving slower in that direction. This way, you can get a first overall idea of your results. In addition, this visualization feature brings your presentation to a higher level.
Plotting of integrated data You can plot co-acquired data, like tracks, video file, and/or physiological data. If you choose to visualize integrated data, you can only visualize one trial at a time. When playing the track back and forth, the video and external data stream will play back and forth in sync. When nesting criteria are defined in the data profile, the full external data track is shown, but only the time segment included in the selection is highlighted.
ANALYZE THE DATA
Analysis parametersA large number of parameters can be calculated during track analysis, which can be divided into two categories: parameters that can be calculated independent of the EthoVision XT modules you are using and parameters that can only be calculated when you are using the multiple body points module.
Parameters that can always be calculated When not using the multiple body points module, these parameters are calculated for the body center point only. When using this module, these parameters are calculated for the nose point and tail base point as well. • Movement – Spatial movement of the nose, body
center, or tail base point with the speed exceeding or not exceeding a threshold you can define (i.e. moving or not moving). Example: measuring the percentage of time the animal has been moving and not moving in the open field test.
• Distance moved – The distance traveled by the center, nose, or tail base point from the previous sample to the current one. Example: measuring the general activity of mice participating in the fear conditioning test.
• Velocity – Distance traveled by the center, nose, or tail base point per unit time. Example: investigating the difference
in velocity between a treated and a non-treated animal.
• Heading – Direction of movement of the center, nose, or tail base point between one sample and the previous, relative to a system-defined reference direction. Example: measuring the moving direction of a rat participating in the water maze test, directly after releasing it in the basin.
• Turn angle (relative and absolute) – The change in moving direction of the nose, center, or tail base point between one sample and the previous. Absolute turn angle does not take the direction of turning into account (clockwise or anti-clockwise), relative turn angle does. Example: measuring stereotypy in rodents, often characterized by quick changes in moving direction.
• Angular velocity (relative and absolute) – The change in moving direction of the nose, body center, or tail base point per unit time (speed of change in direction). Absolute turn angle does not take the direction of turning into account (clockwise or anti-clockwise), relative turn angle does. Example: measuring the tendency of an animal to turn to a specific direction or object.
• In zone – The nose, center, or tail base point (or a combination of points) being or not being within a zone of interest. Example: measuring the time the animal has spent with its nose point within the object zone.
• Distance to zone – Distance between the nose, center, and/or tail base point and the border or the center of a zone of interest. Example: measuring the distance between the nose point and a rest zone.
Parameters that can only be calculated with the multiple body points module• Head direction – The direction the nose pointThe direction the nose point
is pointing to in a certain sample, relative to a reference direction. Example: determining the direction of gaze in rats, independent of the body’s movement.
• Elongation – Elongation percentage of the rat’s or mouse’s body, relative to two thresholds that you define. EthoVision XT has three elongation states: stretched, normal, and contracted. Example:
��
Figure 20. The statistic results table: each row corresponds to a subject tracked in one arena during a specific trial.

measuring stretch attend postures, characterized by elongation of the body.
• Mobility – Percentage of change in the animal’s area between consecutive samples, relative to two thresholds that you define. EthoVision XT has three mobility states: immobile, mobile and strongly mobile. Example: using the mobility parameter as a measure of freezing in the fear conditioning test or the Porsolt swim test.
Statistics availableDepending on the parameter, the following statistics are available: frequency, latency to first occurrence, total duration, variance, standard deviation, standard error, mean, maximum, and minimum.
OUTPUT AND EXPORT DATA
The results of analysis are displayed in a spreadsheet-like table, where each row corresponds to an animal tracked in one arena during a specific trial. The first columns of the table show which trial, arena, and animal the results correspond to. The following columns show the values of the independent variables (treatment, animal ID) and the dependent variables (the measured parameters). Although EthoVision XT supports a comprehensive set of descriptive analytic tools, you need to export your data to other programs in order to test for statistically significant differences. The track data and the values of the dependent variables can be exported, as well as the calculated statistics: • Export track data and dependent variables values –
Export the X,Y coordinates together with the value of the parameters chosen. Each track is exported as a separate file and the arena name and track number are attached.
• Export statistics – Export the spreadsheet-like table with all statistic results.
You can save your exported data as a Microsoft ExcelMicrosoft ExcelExcel (*.xls) or a text (*.txt) file. In the latter case, you can define the text separator. To be able to save the data as an *.xls file, Excel needs to installed on your
computer. Files can be opened and edited in Excel. After editing, the files can be opened in programs such as SPSS, Systat, SAS, Genstat, Statistica, and GB STAT for extensive analysis.
HELP FEATURES
Help is provided by a number of sources.
Reference manualEthoVision XT comes with a comprehensive reference manual in which all software functions are described in detail. Instructions on the installation, formulas, illustrations, and an alphabetical subject index are included. One chapter is dedicated to a quick overview of the full program. The manual is also included on the installation CD as PDF file.
Online helpComprehensive help information is available for every function of the program. Simply press the F� key or type your question into the Help box on EthoVision XT’s toolbar to enter the online help program. The online help contains all the information that is given in the reference manual. You can search through hundreds of entries in an online knowledge database of questions submitted by our customers and answered by our support staff. Additionally, you can visit the EthoVision XT product page on our web site. Product leaflets, application notes, and a short tour are all given at this web page, as well as all product news.
Help deskEach Noldus product is tested thoroughly before its release and we have done our best to make the documentation as clear as possible. However, if you run into a problem of any kind, our helpdesk can assist you. Our help desk is staffed during normal working hours in three time zones (Pacific Standard Time, Eastern Standard Time and Central European Time). The preferred method to contact our helpdesk is by submitting the Support Request Form, which can be found on our web site: www.noldus.com/support. We try to answer support
��
technical specifications
EthoVision XT

questions within one working day. More complicated questions may require more time, but we guarantee a first response to your question within one working day.
Demonstration projectsDuring the installation of the EthoVision XT software also several demonstrations projects can be installed. These projects (including a water maze, open field, and plus maze) come including digital video files and appropriate analysis settings, to help you set up your experiments in a similar way.
HARDWARE COMPONENTS
An EthoVision XT set-up consists of the EthoVision XT software (base package, optionally extended with the multiple body points module, multiple arenas module, and/or physiology module), the EthoVision XT frame grabber (Picolo Diligent), and the following other hardware components:• video camera with lens • computer with CD or DVD-writer (for backup
purposes) Optional hardware componentsBesides the required hardware components mentioned above, you might need some optional hardware components. We offer a range of additional hardware components to make your experimental set-up complete:• various (IR-translucent) mazes and open fields, such
as the water maze, elevated plus maze, zero maze, T-maze, radial arm maze, and circular and square open fields in different sizes (check our web site for additional information)
• infrared lights (LED array) (check our web site for(check our web site for additional information)
• PhenoTyper® (check our web site for additional(check our web site for additional information)
• tower filming system for tracking up to 96 (zebra)fish larvae in a well plate (check our web site(check our web site for additional information)
• video monitor• backlight unit• camera table• DAQ system when co-acquiring external data
(usually physiological data)
SYSTEM REQUIREMENTS
For optimal performance and functionality of EthoVision XT, an up-to-date computer system is strongly recommended. The minimum system requirements are:
• processor (CPU): � Ghz (tracking in one arena) - 4 Ghz (tracking in multiple arenas)
• internal memory (RAM): 5�� Mb (tracking in one arena) – � Gb (tracking in multiple arenas)
• hard disk: �.0 Gb free space• video memory: 64 Mb• graphics card: �0�4 x 768• video storage when tracking from video: 850 Mb/hr
(MPEG-�), �.6 Gb/hr (MPEG-�), 4 Mb/hr (MPEG-4)• supported video files: MPEG�, MPEG�, DV-AVI,
and, when recorded with the EthoVision XT frame grabber, MPEG4
• operating system: Windows XP Professional with Service Pack �
CUSTOMER SERVICE AND SUPPORT
In case of problems or questions, you have access to a variety of possibilities.
Installation and trainingWe provide on-site installation and a comprehensive training course by a qualified consultant. The training, complete with course materials for the participants, covers the basic video techniques, digital image processing and track analysis, as well as the operation of the hardware and software. Together with the consultant, you will configure the system for your research application. Refresher and advanced training courses are also available, both on-site and at a Noldus office.
Technical supportYour license of EthoVision XT comes with a standard service package of one year, including free support via telephone, fax, or e-mail. You can expect an answer within �4 hours (the next working day). Most problems are solved even faster than that! You also receive a free subscription to our newsletter Noldus News, which informs you about new product developments, applications, and tips and tricks.
Custom developmentA team of software engineers and consultants at Noldus Information Technology takes care of the development and support of the EthoVision XT software. If you have special wishes for modification or enhancements of the software (e.g. special tracking options, extra analysis parameters, interfaces with other software or hardware, etc.), we will be happy to explore the options with you. Contact us for details.
Consulting servicesOur customer support goes far beyond solving technical problems. Our staff includes several consultants with an academic degree and experience in the behavioral
�4

sciences, as well as qualified engineers. They are happy to help you with research problems related to the use of EthoVision XT, the design of your experimental setup, the choice of the appropriate hardware for your application, etc.
CONTACT INFORMATION
International HeadquartersNoldus Information Technology bvWageningen, The Netherlands+��-��7-47��[email protected]
USA, Canada, MexicoNoldus Information Technology Inc.Leesburg, U.S.A.+�-70�-77�-0440Toll-free: �-800-�55-954�[email protected]
Switzerland, Austria, Germany (BY, HE, RP, SL, SN, TH)
Noldus Information Technology GmbHFreiburg, Germany+49-76�-470�[email protected]
Germany (BE, BB, HB, HH, MV, NI, NW, ST, SH)
Noldus Information Technology GmbHBerlin, Germany +49-�0-6956467�[email protected]
FranceNoldus Information Technology FranceSaint-Louis, France+��-�-89697���[email protected]
Spain, PortugalNoldus Information Technology España Barcelona, Spain +�4-9��-���067 [email protected]
HungaryNoldus Information Technology Bt. Budapest, Hungary +�6-�-�08-���� [email protected]
www.noldus.com
EthoVision and PhenoTyper are registered trademarks of Noldus
Information Technology bv. Due to our policy of continuous product
improvement, information in this document is subject to change
without notice.
�5
technical specifications
EthoVision XT

akfjasld;jflsk;fja;ls