ethiopia: a prospective follow up study services on
TRANSCRIPT
Page 1/28
Effects of continuum of care in maternal healthservices on adverse birth outcome in NorthwestEthiopia: a prospective follow up studyMuluwas Amentie Zelka ( [email protected] )
Addis Ababa University School of Public Health https://orcid.org/0000-0003-4298-7061Alemayehu Worku Yalew
Addis Ababa University School of Public HealthGurmesa Tura Debelew
Jimma Institute of Health Sciences: Jimma University
Research Article
Keywords: stillbirth, neonatal death, perinatal death, maternal health, continuum of care
Posted Date: November 11th, 2021
DOI: https://doi.org/10.21203/rs.3.rs-1069811/v1
License: This work is licensed under a Creative Commons Attribution 4.0 International License. Read Full License
Page 2/28
Abstract
BackgroundGlobally, around 4 million of babies were died within the �rst month and more than 3 million werestillbirth. Of them, 99% of newborn deaths and 98% of stillbirth occur in developing countries. Despitegive a priority for maternal health services, adverse birth outcomes are still major public health problemsand big challenge in Ethiopia particularly in study area. Hence, to overcome those challenges, acontinuum of care (COC) is core key strategies. Despite that study conduct on effectiveness of COC inmaternal health services was scare in developing countries and not done in study area. We aimed toassess effectiveness of continuity of care on reduction of adverse events and determinants of adversebirth outcomes.
MethodsCommunity and health facility linked prospective follow-up study design was employed from March 2020to January 2021 in Northwest Ethiopia. A multistage sampling technique was used to recruit 2,198pregnant women. Data were collected by using semi-structured and pretested interviewer questionnaire.Collected data were coded, entered, cleaned and analyzed by using STATA 14. Mixed-effect model wasused to identify community and individual level factors of adverse birth outcomes. Finally, propensityscore matching (PSM) was applied to determine effectiveness of COC in maternal health services.
ResultsMagnitude of adverse birth outcome was 26.8%: stillbirth (2.7%), neonatal mortality rate (3.1%) andneonatal morbidity (6.8%). Risk factors signi�cantly associated were being poor household wealth index(AOR = 3.3), pregnant related complication during pregnancy (AOR = 3.29), labour and childbirth (AOR =6.08), immediately after childbirth (AOR = 5.24), offensive odder amniotic �uid (AOR = 3.04) and historyof stillbirth (AOR = 4.2). Whereas, women receive IFA during pregnancy (AOR = 0.44), initiate BF within1hour (AOR = 0.22) and immunizing newborn within postnatal period (AOR = 0.33) were protectivefactors. As treatment effect, completion of COC in MHS via time dimension (β = -0.03), completion of keyservices of MHS (β = -0.04) and completion of COC in MHS via space dimension (β = -0.02) wereassociated with a signi�cant reduction in the likelihood of perinatal death
ConclusionsThe results suggested that neonatal and perinatal mortality rate were high as compared with nationaland international target. Completion of COC in MHS is an effective strategy in reduction perinatal death.
Page 3/28
Efforts should be made to strengthening COC of MHS and also encourage IFA supplementation,immunizing and early initiation of BF for newborn were strongly recommended.
BackgroundWomen play a signi�cant role in rearing of children and managing family affairs but their loss frommaternity-related causes and neonatal mortality are a signi�cant social, economic and personaldisaster(1). Globally, around 4 million of babies were died within the �rst month and more than 3 millionof births were stillbirth. Hence, 99% of newborn deaths occur in developing countries(2). It is a bigchallenge for the world population and still public health problem particularly in the developing and low-income countries(3). In Africa, annually 1million stillbirths were occurred, of them 300,000 cases wereoccurred during labour and also 1million babies were died within �rst month, of them half million diedwithin 1st day. In Sub-Sahara Africa, under �ve child mortality rate was 16 times more likely to die than inhigh income countries due to poor access to quality of services and discontinuation of care in maternalhealth services (2, 4). Having this in mind, those deaths were peak during the times of birth, the �rst dayand the �rst week of life.
The health need of mother and newborn are inseparably linked together. In the past decay: maternal,newborn and child health policy and programs address their health need separately; this gap andchallenge in care provision especially newborn health are subjected to disadvantaged. Even though, toovercome those challenges, a continuum of care (CoC) in maternal health services is one of the core keystrategies. Thus, it reaches mothers and babies at a crucial time and place to reduce the risk of death,illness or disability of neonatal (5). Health of newborn relies on good linkage of maternal healthintervention because newborn health is a sensitive indicator of continuity of maternal health services (5).Despite these, almost half of African women were not receiving skilled care during childbirth andpostnatal care services after delivery(4).
While utilization rate of essential maternal health services reach 90%, neonatal death reduced by 37 –67% (430,000 – 800,000) of deaths (4). Hence, continuum of care in maternal health services via timedimension could reduce neonatal mortality: completion of continuity of Antenatal (ANC) services couldreduce by 7 – 14%; continuity of care at child birth could reduce by 19 – 34% and continuity of postnatal(PNC) services could reduce 10 – 27% of neonatal deaths. Similarly, space dimension continuity of carecould avert neonatal death: continuity of care at family/community level interventions (14 – 32%);outpatient/outreach interventions (7 – 14%) and clinical setting interventions (26 – 51%) of neonataldeath could avert(5). A variety of evidence revealed that completion of continuity of care in maternalhealth services via time and space dimension were more likely reduce adverse birth outcomes (stillbirth,neonatal mortality and morbidity) (4, 6–12).
Despite give a priority for maternal health services, adverse birth outcome (stillbirth, neonatal death andillness) are still major public health problems in Ethiopia particularly in Benishangul Gumuz Region.However, majority of literature suggested evidences based on cross sectional study design and facility
Page 4/28
based survey which couldn’t show a cause and effect relationship and also using traditional binarylogistic and linear regression couldn’t explore the treatment effect of completion of continuity of maternalhealth services on adverse birth outcome. Moreover, relies on cross sectional and facility survey, it isdi�cult to organize clear epidemiological evidence on treatment effect. In general, clear epidemiologicaldata on adverse birth outcome (stillbirth, neonatal death and morbidity) were generated using prospectivefollow up study design, which found to be an important evidence for implementation of maternal healthservices in Ethiopia.
Therefore, the objective of this study was to investigate effect of continuum of care in maternal healthservices on perinatal death and also determinant factors that hindering adverse birth outcome usingpropensity score matching (PSM) and multilevel regression model respectively.
Methods
Study design and settingCommunity and health facility linked prospective follow-up study design was conducted in Benishangul-Gumuz Regional State (BGRS) from March 2020 to January 2021. The region is one of the eleven statesof Ethiopia's Federal Democratic Republic of Ethiopia. Assosa town is the capital city of the region,located 670kms West of Addis Ababa, the capital city of Ethiopia. The region has three zones, three townadministrative cities, twenty one districts/Woredas, one special district/Woreda’s and 475 clusters/Kebele’s (439 rural and 36 urban clusters/ Kebele’s). The region represents around 4.6% of the total landarea of Ethiopia and most of the people in the region are sparsely populated (13).
Source population and study participantsAll pregnant women and birth that registered as live birth as well as stillbirth at the time of birth within thefollow up period were considered as source population. Whereas, the study population was newbornsthat registered as “live birth” or “stillbirth” (which is declared by women, birth attendants or healthworkers) at the time of birth and selected by simple sampling techniques.
Sample size and sampling technique The sample size for this study was calculated by using STATA/MP 13.0 software by considering twopopulation proportion formulas based on the following assumption. The outcome variable adverse birthoutcome (stillbirth, neonatal death and any illness within neonatal period), and the predictor variable wascontinuum of care in maternal health service. In Ethiopia, literatures that support to determine samplesize for this objective are not available. Like as Ethiopia particularly in Benishangul Gumuz Region; inrural India, most births take place in the home, where high-risk practices are common(10). Unfortunately,neonatal mortality in Uttar Pradesh, India (29 deaths per 1,000live birth: Urban 20 verses Rural 38 deaths
Page 5/28
per 1,000live birth)(14) is almost similar with Ethiopia neonatal mortality (29 per 1,000live birth) (15), sothat evidence stated in Uttar Pradesh, India is used for sample size determination. Study done in UttarPradesh, India was found that proportion of adverse birth outcome, “neonatal death”, among whosemother use complete continuum of care in maternal health services is 4.29% ((P1 = 0.0429) andproportion of adverse birth outcome, “neonatal death”, among whose mother never use ANC service is8.43% (P2 = 0.0843) (10). A 95% con�dence level and 80% power were used to detect 9.8% difference or54.4% increment among exposed and non-exposed group. Hence, r=ratio of exposure to non-exposurepregnant women equal to 1:1 for the population allocation ratio; P (pooled population proportion)
was calculated (P = 0.0636); considering a design effect 2 and a non-response rate of 10%. Asresult, the �nal sample size was 2,402 pregnant women had been follow up to look the effect ofcontinuity of maternal health services on perinatal death, used for as �nal sample size for this study.
Since this research work was carried out at a regional level, the study subjects (pregnant women) werechosen using a multistage sampling technique. The sampling procedure used for this study was asfollow: primarily two zones and one town administration were chosen by simple random sampling (SRS).Following that, four districts/“woredas” from the Assosa Zone, two districts/“woredas” from the MetekelZone, and two districts/“woredas” from the Assosa town administration were chosen by simple randomsampling (SRS) technique. Thirdly, from each selected district/“woreda”, seven kebeles from each district(except Assosa district/“woreda”: 10 kebeles were selected) and �ve ketenes from each district/“woreda”of town administration were selected and included in the study. Then after, among the selectedkebeles/ketenas (7 kebeles from each districts/“woredas”, 10 kebeles from Assosa districts/“woredas”and �ve ketenes from each districts/“woredas” of town administration), pregnant women wereenumerated by using house-to house visit and all obtained and registered pregnant women were includedin the study. All women who claimed an 8 weeks or longer pregnancy, as determined by the loss of twoconsecutive menses, were considered eligible and joined in the study, which followed for 11 months.Assuming that each household with pregnant women had at least one pregnant woman, households withpregnant women and neonates were selected as the �nal sampling unit (FSU). Similarly, all healthfacilities found within the catchment areas were list and considered as a candidate for health facilitysurvey. Therefore, 46 health facilities (3 hospitals, 12 health centers and 31 health posts) were foundwithin the catchment areas and included for health facility survey.
Data collection processData collection was conducted using semi-structured questionnaires and registration format adoptedfrom EDHS 2016(15), National Technical Guidance for MPDSR 2017(16), MCH Program Indictor Survey2013(17), Survey tools conduct in Jimma Zone, Southwest Ethiopia(18), Survey tools conducted in RuralSouth Ethiopia(19) and other relevant different literatures. The instrument was prepared in English andtranslated into local language (“Amharic”) and then back translated to English to ensure validity of the
Page 6/28
instrument. Following that, training was offered for data collectors and supervisors for 3days and alsopre-test was carried out on 35 individuals, located outside of the study areas/cluster. During actual datacollection, principal investigator and supervisors were frequently supervised and checked the work ofdata collectors and also clari�cation and direction was forwarded to those who had doubts.
Data management and analysis Data was coded and entered into Epi Info version 7.2.2.6 to develop skipping patterns and avoid logicalmistakes. The data was then cleaned, edited, and analyzed using STATA Software version 14. Allvariables were computed for descriptive statistics. Analysis with only one variable were performed, thecrude odds ratio and 95% con�dence interval were used to select candidate variables for multivariateanalysis (p < 0.25). At the level of signi�cance (p < 0.05), a maximum likelihood estimate of theindependent effect on the outcome variable was calculated. The household wealth index was calculatedand categorized by using Principal Component Analysis (PCA). Before running the full model, effectmodi�cation or interaction effect at p < 0.1 and multi-collinarity effect between independent variablesusing variance in�ation factors (VIF > 10%) were assessed. All independent variables included had VIP <10 and multi-collinearity effect of each variables were p < 0.1. Hence, there was no signi�cant interactionand multi-collinearity effect was detected. Since, the sampling procedure for this study was multistagesampling procedure; due to cluster variability mixed effect multilevel regression model was applied todetect determinants factors of adverse birth outcomes (still birth, neonatal death and any neonatalillness). Thus, for this study ‘Kebeles/Ketenas’ were categorized as clusters and cluster level variableswere place of residence, access to health center and household wealth index were taken as level – 2factors. Women who gave birth during follow study were nested within their households and therefor inthe community. As a result women individual level variables were socio-demographic, obstetric,information, maternal health services and newborn health services were taken as level – 1 factor. Loglikelihood ratio (LR) test was to con�rm goodness of �t of the multilevel model that found to be statisticalsigni�cant such as data �t the model. Finally, the effect of continuity of maternal health servicesperinatal death was estimated by propensity score matching. The effect was measured by β 95%CI at p <0.05.
Results
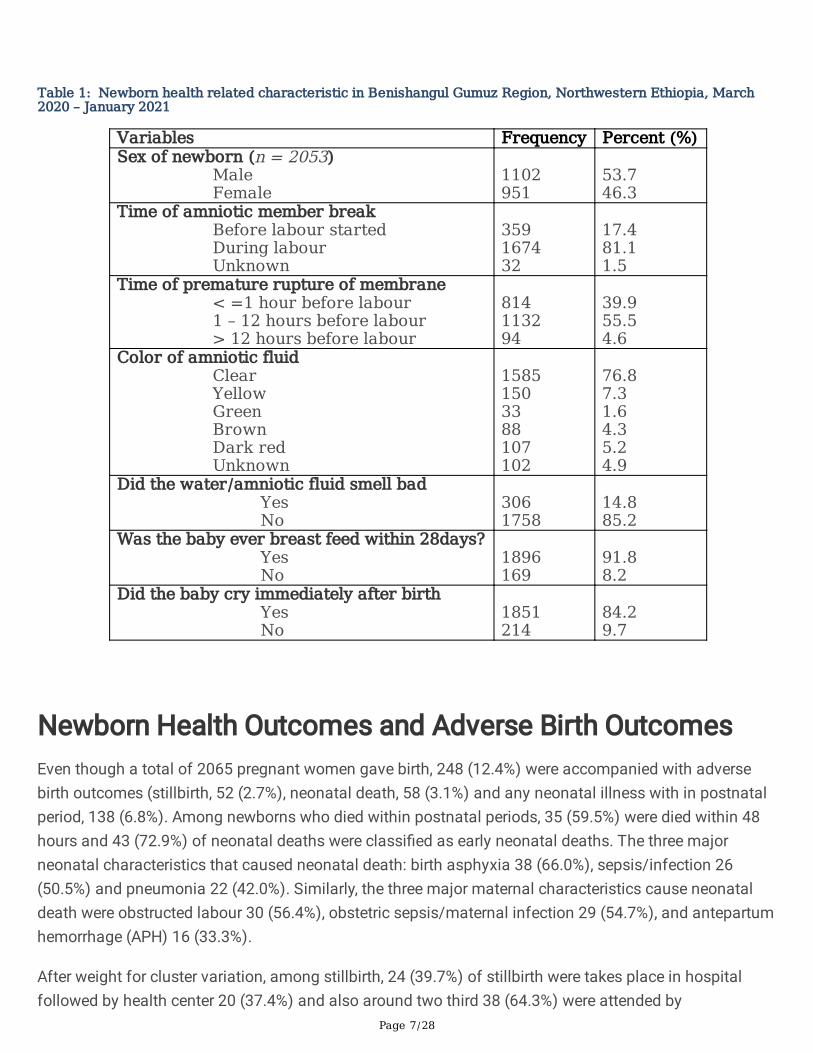
Newborn Characteristics and Health Related Issues The characteristics of newborns born: 1102 (53.7%) were male and 359 (17.4%) were amniotic memberbreak before labour started and time of premature rupture of membrane was 1 – 12 hours before labourstarted 1132 (55.5%). More than three fourth 1585 (76.8%) of women reported that the color of amniotic�uid was clear, whereas 305 (14.8%) of women stated that amniotic �uid had bad odor. Majority, 1896(91.8%) was the baby ever breast fed within 28 days and 1851 (84.2%) of the newborns were cryingimmediately after birth (Table 1).
Page 7/28
Table 1: Newborn health related characteristic in Benishangul Gumuz Region, Northwestern Ethiopia, March2020 – January 2021
Variables Frequency Percent (%)Sex of newborn (n = 2053)
Male Female
1102951
53.746.3
Time of amniotic member breakBefore labour started During labour Unknown
359167432
17.481.11.5
Time of premature rupture of membrane < =1 hour before labour1 – 12 hours before labour> 12 hours before labour
814113294
39.955.54.6
Color of amniotic fluid ClearYellow Green BrownDark redUnknown
15851503388107102
76.87.31.64.35.24.9
Did the water/amniotic fluid smell bad YesNo
3061758
14.885.2
Was the baby ever breast feed within 28days?Yes No
1896169
91.88.2
Did the baby cry immediately after birth Yes No
1851214
84.29.7
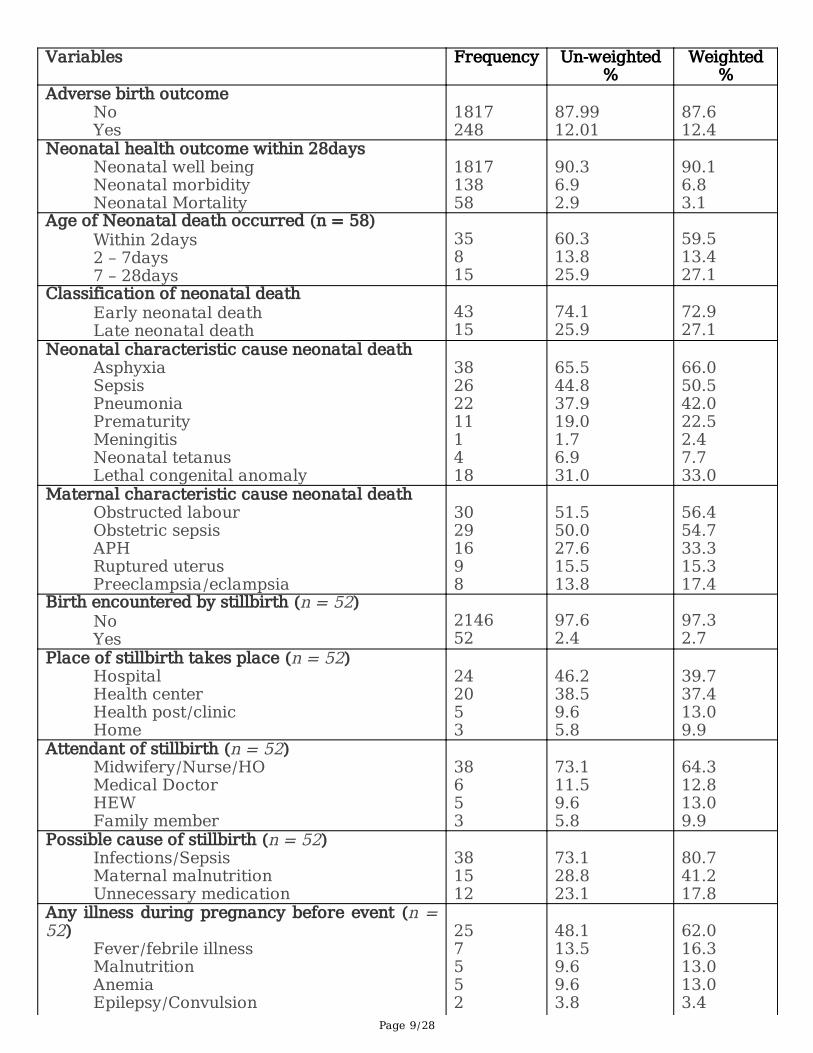
Newborn Health Outcomes and Adverse Birth Outcomes Even though a total of 2065 pregnant women gave birth, 248 (12.4%) were accompanied with adversebirth outcomes (stillbirth, 52 (2.7%), neonatal death, 58 (3.1%) and any neonatal illness with in postnatalperiod, 138 (6.8%). Among newborns who died within postnatal periods, 35 (59.5%) were died within 48hours and 43 (72.9%) of neonatal deaths were classi�ed as early neonatal deaths. The three majorneonatal characteristics that caused neonatal death: birth asphyxia 38 (66.0%), sepsis/infection 26(50.5%) and pneumonia 22 (42.0%). Similarly, the three major maternal characteristics cause neonataldeath were obstructed labour 30 (56.4%), obstetric sepsis/maternal infection 29 (54.7%), and antepartumhemorrhage (APH) 16 (33.3%).
After weight for cluster variation, among stillbirth, 24 (39.7%) of stillbirth were takes place in hospitalfollowed by health center 20 (37.4%) and also around two third 38 (64.3%) were attended by
Page 8/28
midwifery/nurse/health o�cers. The major possible cause of stillbirth were maternal infection/sepsis 38(80.7%), maternal malnutrition 15 (41.2%) and unnecessary medication 12 (17.8%). The top threepregnant related problems during pregnancy before the occurrence of stillbirth were severe abdominalpain 31 (66.2%), excessive vaginal bleeding 23 (50.1%) and blurred vision 11 (31.6%). Whereas, commonillness that women encountered during pregnancy were febrile illness 25 (62.0%), malnutrition 7 (13.3%)and anemia 5 (13.0%) (Table 2).
Table 2: Adverse birth outcome and related factors among the study subject in Benishangul Gumuz Region,Northwestern Ethiopia, March 2020 – January 2021
Page 9/28
Variables Frequency Un-weighted%
Weighted%
Adverse birth outcomeNoYes
1817248
87.9912.01
87.612.4
Neonatal health outcome within 28daysNeonatal well being Neonatal morbidity Neonatal Mortality
181713858
90.36.92.9
90.16.83.1
Age of Neonatal death occurred (n = 58)Within 2days2 – 7days7 – 28days
35815
60.313.825.9
59.513.427.1
Classification of neonatal deathEarly neonatal deathLate neonatal death
4315
74.125.9
72.927.1
Neonatal characteristic cause neonatal deathAsphyxia Sepsis PneumoniaPrematurityMeningitisNeonatal tetanusLethal congenital anomaly
382622111418
65.544.837.919.01.76.931.0
66.050.542.022.52.47.733.0
Maternal characteristic cause neonatal deathObstructed labourObstetric sepsis APHRuptured uterusPreeclampsia/eclampsia
30291698
51.550.027.615.513.8
56.454.733.315.317.4
Birth encountered by stillbirth (n = 52)NoYes
214652
97.62.4
97.32.7
Place of stillbirth takes place (n = 52)Hospital Health centerHealth post/clinicHome
242053
46.238.59.65.8
39.737.413.09.9
Attendant of stillbirth (n = 52)Midwifery/Nurse/HOMedical Doctor HEWFamily member
38653
73.111.59.65.8
64.312.813.09.9
Possible cause of stillbirth (n = 52) Infections/Sepsis Maternal malnutrition Unnecessary medication
381512
73.128.823.1
80.741.217.8
Any illness during pregnancy before event (n =52)
Fever/febrile illnessMalnutrition Anemia Epilepsy/Convulsion
257552
48.113.59.69.63.8
62.016.313.013.03.4
Page 10/28
High blood pressurePregnancy related problems (n = 52)
Severe abdominal pain Excessive vaginal bleedingSevere headacheBlurred vision Foul smelling vaginal discharge Shortness of breathing Swelling of fingers, face and leg
31231311975
59.644.225.021.217.313.59.6
66.250.118.431.625.216.713.0
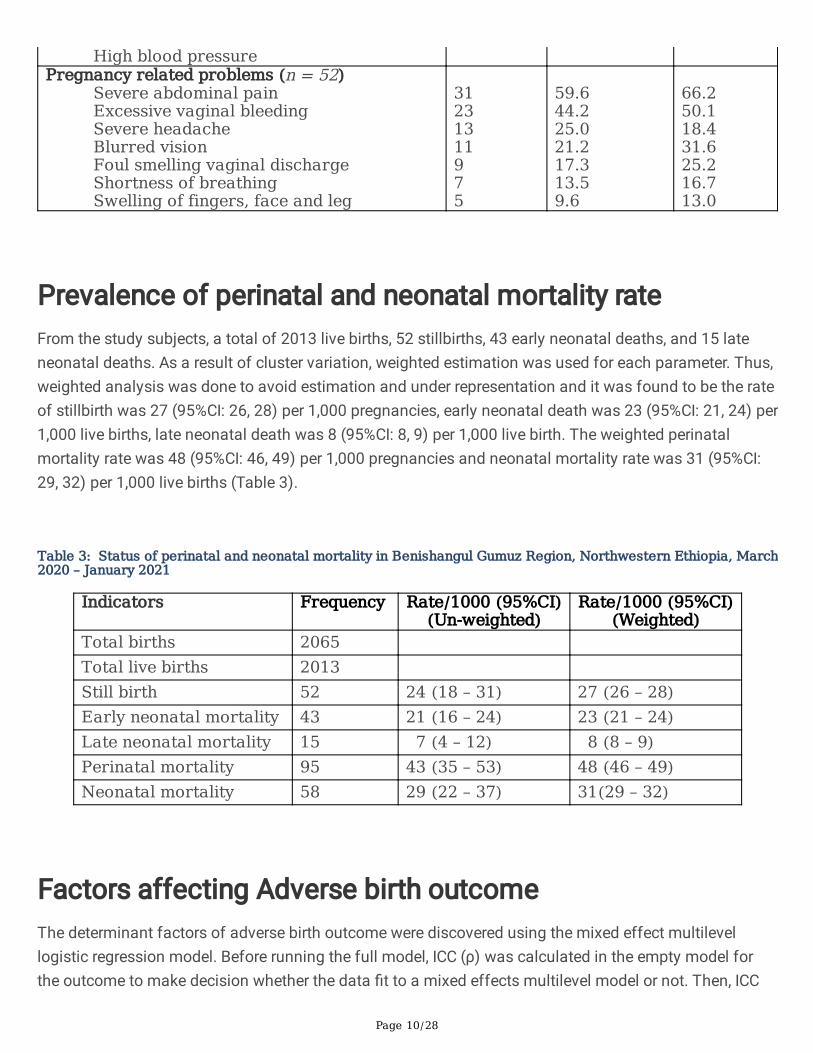
Prevalence of perinatal and neonatal mortality rateFrom the study subjects, a total of 2013 live births, 52 stillbirths, 43 early neonatal deaths, and 15 lateneonatal deaths. As a result of cluster variation, weighted estimation was used for each parameter. Thus,weighted analysis was done to avoid estimation and under representation and it was found to be the rateof stillbirth was 27 (95%CI: 26, 28) per 1,000 pregnancies, early neonatal death was 23 (95%CI: 21, 24) per1,000 live births, late neonatal death was 8 (95%CI: 8, 9) per 1,000 live birth. The weighted perinatalmortality rate was 48 (95%CI: 46, 49) per 1,000 pregnancies and neonatal mortality rate was 31 (95%CI:29, 32) per 1,000 live births (Table 3).
Table 3: Status of perinatal and neonatal mortality in Benishangul Gumuz Region, Northwestern Ethiopia, March2020 – January 2021
Indicators Frequency Rate/1000 (95%CI)(Un-weighted)
Rate/1000 (95%CI)(Weighted)
Total births 2065 Total live births 2013 Still birth 52 24 (18 – 31) 27 (26 – 28)Early neonatal mortality 43 21 (16 – 24) 23 (21 – 24)Late neonatal mortality 15 7 (4 – 12) 8 (8 – 9)Perinatal mortality 95 43 (35 – 53) 48 (46 – 49)Neonatal mortality 58 29 (22 – 37) 31(29 – 32)
Factors affecting Adverse birth outcome The determinant factors of adverse birth outcome were discovered using the mixed effect multilevellogistic regression model. Before running the full model, ICC (ρ) was calculated in the empty model forthe outcome to make decision whether the data �t to a mixed effects multilevel model or not. Then, ICC

Page 11/28
(ρ) was calculated as a full model for the outcome to detect the variability attributed to clusters aftercontrolling the individual level.
Likewise, the adverse birth outcomes, ICC (ρ) was calculated in the empty model and it was found to be0.32, indicating that 32% of the variation was contributed by cluster variations. The test of the preferenceof log-likelihood versus logistic regression was statistically signi�cant (P < 0.0001). Then, the full modelwas run by including both the cluster level and individual level variables and the ICC (ρ) was increased to0.53. This again indicated that 53% of the variation was attributed to cluster level variables. Thepreferences of log-likelihood verses logistic regression was determined indicate that statisticallysigni�cant (p < 0.0001). Hence, this is suggested that using multilevel analysis is crucial rather thanlogistic regression model (Table 4).
Table 4: Pa rameters of odds ratio and Test of Goodness-of-fit of the Mixed-effects MultilevelModels, Benishangul Gumuz Region, Northwest Ethiopia, 2021
odelsFixed
intercept -cons(95%CI)
Random effect asLevel-2 variance var(-
cons (95%CI))
Intra-classCorrelationCoefficient:ICC(ρ)
Loglikelihood
(LR)-deviance
Significance of LR testVs Logistic regression
(P-value)
versethcomes*
Emptyel
Fullel
0.08(0.05,0.12)
0.1(0.002,2.92)
1.55(0.89, 2.71)
3.75(1.74,8.06)
0.32 = 32%
0.53 = 53%
-670.72
-220.11
P < 0.0001
P < 0.0001
P value less than 0.05 is statistically significant and the data fit for the multilevel model* Multilevel regression model applied to measure the effect of factors on outcome
After adjusting for confounding effects, a multivariable mixed effects logistic regression model wasperformed. Then, the determinant factors of adverse birth outcome identi�ed at cluster and individuallevel factors such that at the cluster level (level – 2) factors: house hold wealth index and at individuallevel (level - 1) factors: women educational status, history of abortion, time of 1st ANC initiation, iron folicacid supplementation, initiate BF within one hours, pregnant related problems during labour andimmediately after childbirth, presence of offensive amniotic �uid and immunizing newborn withinpostnatal period were found to have a statistical signi�cant association with adverse birth outcomes.
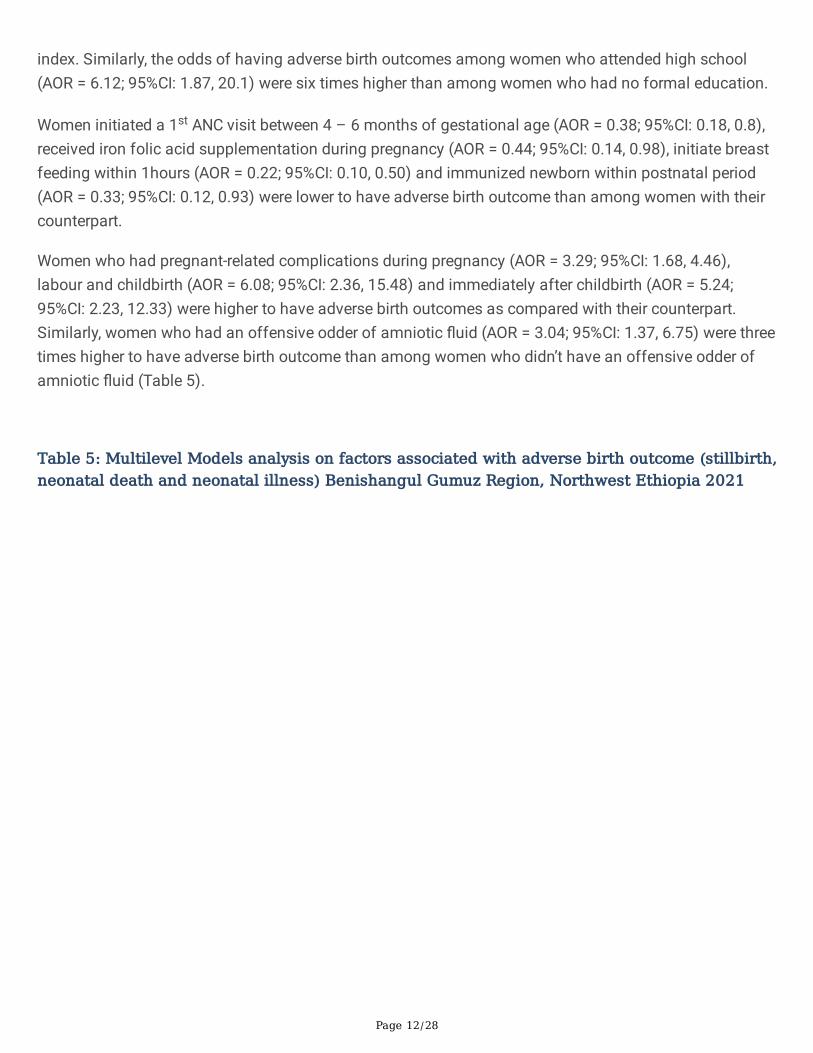
The odds of having adverse birth outcomes among women resided in poor household wealth index (AOR= 3.3; 95%CI: 1.07, 10.23) were three times higher than among women resided in rich household wealth
Page 12/28
index. Similarly, the odds of having adverse birth outcomes among women who attended high school(AOR = 6.12; 95%CI: 1.87, 20.1) were six times higher than among women who had no formal education.
Women initiated a 1st ANC visit between 4 – 6 months of gestational age (AOR = 0.38; 95%CI: 0.18, 0.8),received iron folic acid supplementation during pregnancy (AOR = 0.44; 95%CI: 0.14, 0.98), initiate breastfeeding within 1hours (AOR = 0.22; 95%CI: 0.10, 0.50) and immunized newborn within postnatal period(AOR = 0.33; 95%CI: 0.12, 0.93) were lower to have adverse birth outcome than among women with theircounterpart.
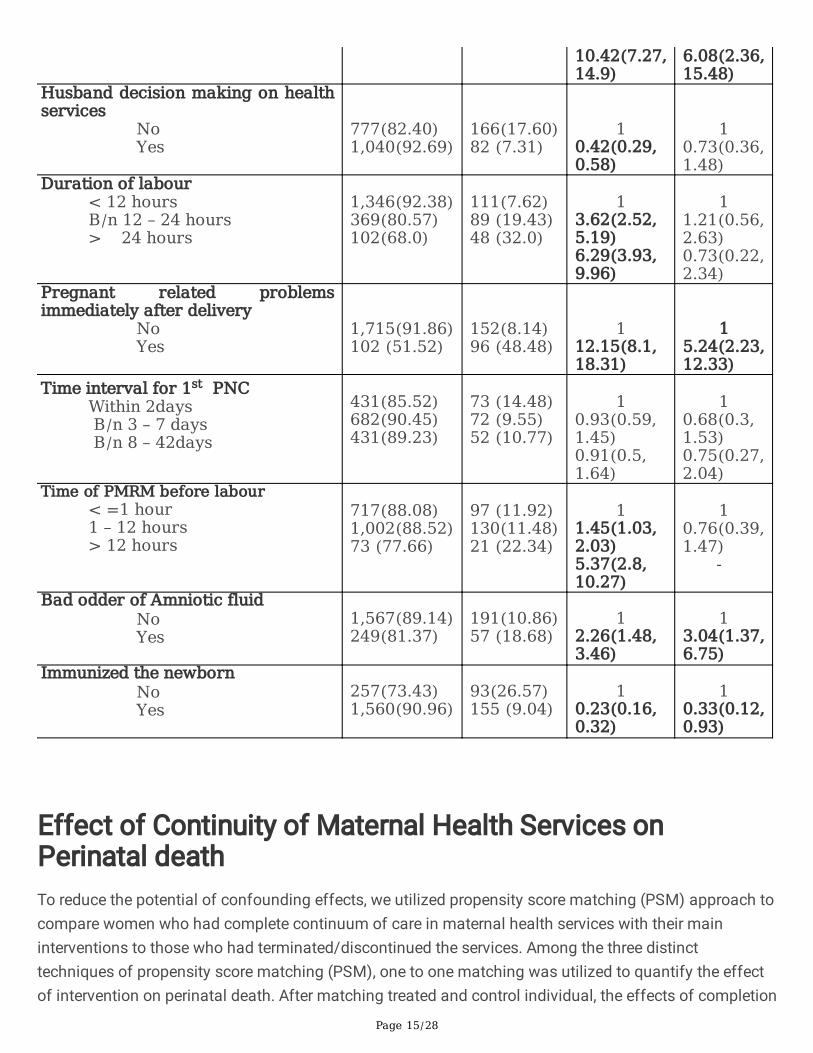
Women who had pregnant-related complications during pregnancy (AOR = 3.29; 95%CI: 1.68, 4.46),labour and childbirth (AOR = 6.08; 95%CI: 2.36, 15.48) and immediately after childbirth (AOR = 5.24;95%CI: 2.23, 12.33) were higher to have adverse birth outcomes as compared with their counterpart.Similarly, women who had an offensive odder of amniotic �uid (AOR = 3.04; 95%CI: 1.37, 6.75) were threetimes higher to have adverse birth outcome than among women who didn’t have an offensive odder ofamniotic �uid (Table 5).
Table 5: Multilevel Models analysis on factors associated with adverse birth outcome (stillbirth,neonatal death and neonatal illness) Benishangul Gumuz Region, Northwest Ethiopia 2021
Page 13/28
Determinant factors Adverse birth outcomes Crud OR95%CI
AdjustedOR
95%CINo YesLevel – 2 (Community level) variables Place of Residents
UrbanRural
613(85.5)1,204(89.32)
104(14.5)144(10.68)
1
1.12(0.55,2.27)
1
2.17(0.48,9.85)
Time takes to reach HC< 2 Hours>=2 Hours
1,362(88.16)455(87.50)
183(11.84)65(12.50)
1
1.98(1.15,3.42)
1
0.96(0.32,2.85)
Household wealth index1st Quintile (Poor)2nd Quintile (Middle)3rd Quintile (Rich)
566(84.60)604(85.67)647(93.63)
103(15.40)101(14.33)44(6.37)
1.63(0.97,2.74)1.91(1.22,3.0)
1
3.3(1.07,10.23)2.20(0.98,5.0)
1Leve-1 (individual level) variables Age (Years)
< 20
1. – 29
>= 30
138(86.79)1,173(88.86)506(86.35)
21(13.21)147(11.14)80(13.65)
1
0.79(0.46,1.36)0.89(0.5,1.6)
1
0.50(0.04,6.27)0.35
(0.03,4.67)
Ethnicity BertaOthers
989(90.32)828(85.36)
106(9.68)142(14.64)
1
0.98(0.58,1.66)
1
0.96(0.3,3.12)
Woman education levelNo formal educationPrimary SchoolHigh SchoolTertiary education
1,146(89.25)333(86.05)180(83.33)158(88.76)
138(10.75)54(13.95)36(16.67)20(11.24)
1
1.41(0.95,2.1)1.52(0.96,2.43)0.79(0.45,1.37)
1
1.41(0.5,3.97)6.12(1.87,20.1)0.91(0.22,3.77)
Partner education levelNormal education Primary SchoolHigh SchoolTertiary education
1,033(89.21)199(82.23)245(88.45)286(86.93)
125(10.79)43(17.77)32(11.55)43(13.07)
1
2.08(1.32,3.29)0.99(0.62,1.61)0.84(0.54,1.29)
1
1.49(0.53,4.16)
1.44(0.52,4.07)
0.69(0.22,2.22)
History of stillbirth NoYes
1,263(90.15)130(76.02)
138(9.85)41(23.98)
1
3.46(2.18,5.5)
1
4.2(1.78,9.93)
Information on MHS

Page 14/28
No Yes
150(81.97)1,667(88.58)
33 (18.03)215(11.42)
10.62(0.38,0.99)
10.93(0.3,
2.89)Place of delivery for previousdelivery
HomeHealth PostHealth CenterHospital
354(86.76)322(91.48)531(86.91)186(92.54)
54(13.24)30(8.52)80(13.09)15(7.46)
10.82(0.44,1.51)0.59(0.37,0.97)0.33(0.16,0.71)
1
1.19(0.46,3.09)
1.26(0.55,2.89)
0.39(0.1,1.55)
Availability of MHSNo Yes
103(83.74)1,714(88.26)
20(16.26)228(11.74)
1
0.75(0.42,1.34)
1
2.76(0.18,42.85)
Provision of maternal health carefor community
No Yes
115(80.99)1,702(88.51)
27(19.01)221(11.49)
10.59(0.36,1.0)
1
1.1 (0.1,11.37)
Time of 1st ANC initiation1-3 months of GA4-6 months of GAAfter 6 months of GA
459(84.84)1,223(92.37)81(61.83)
82(15.16)101(7.63)50(38.17)
1
0.31 (0.21,0.46)4.16(2.41,7.19)
1
0.38(0.18,0.8)0.5 (0.11,2.32)
Number of ANC Visits < 4>=4
523(85.18)1,294(89.18)
91(14.82)157(10.82)
1
0.69(0.49,0.97)
1
0.98(0.42,2.3)
IFA supplementation NoYes
306(78.06)1,511(90.32)
86(21.94)162(9.68)
1
0.31(0.22,0.44)
1
0.44(0.14,0.98)
TT during pregnancy No Yes
410(81.03)1,407(90.25)
96(18.97)152(9.75)
1
0.41(0.29,0.57)
1
1.08(0.41,2.81)
Initiate BF within 1hrsNo Yes
303(71.97)1,514(92.09)
118(28.03)130(7.91)
1
0.15(0.11,0.22)
1
0.22(0.10,0.50)
Pregnant related problems duringpregnancy
No Yes
1,525(91.37)292(73.74)
144(8.63)104(26.26)
13.99(2.86,5.60)
13.29(1.68,6.46)
Pregnant related problems duringchildbirth
No Yes
1,640(92.71)176(59.66)
129(7.29)119(40.34)
1
1
Page 15/28
10.42(7.27,14.9)
6.08(2.36,15.48)
Husband decision making on healthservices
No Yes
777(82.40)1,040(92.69)
166(17.60)82 (7.31)
10.42(0.29,0.58)
10.73(0.36,1.48)
Duration of labour< 12 hours B/n 12 – 24 hours> 24 hours
1,346(92.38)369(80.57)102(68.0)
111(7.62)89 (19.43)48 (32.0)
1
3.62(2.52,5.19)6.29(3.93,9.96)
1
1.21(0.56,2.63)0.73(0.22,2.34)
Pregnant related problemsimmediately after delivery
No Yes
1,715(91.86)102 (51.52)
152(8.14)96 (48.48)
112.15(8.1,18.31)
15.24(2.23,12.33)
Time interval for 1st PNCWithin 2days B/n 3 – 7 days B/n 8 – 42days
431(85.52)682(90.45)431(89.23)
73 (14.48)72 (9.55)52 (10.77)
1
0.93(0.59,1.45)0.91(0.5,1.64)
1
0.68(0.3,1.53)0.75(0.27,2.04)
Time of PMRM before labour< =1 hour 1 – 12 hours> 12 hours
717(88.08)1,002(88.52)73 (77.66)
97 (11.92)130(11.48)21 (22.34)
1
1.45(1.03,2.03)5.37(2.8,10.27)
1
0.76(0.39,1.47)
-
Bad odder of Amniotic fluid NoYes
1,567(89.14)249(81.37)
191(10.86)57 (18.68)
1
2.26(1.48,3.46)
1
3.04(1.37,6.75)
Immunized the newbornNoYes
257(73.43)1,560(90.96)
93(26.57)155 (9.04)
1
0.23(0.16,0.32)
1
0.33(0.12,0.93)
Effect of Continuity of Maternal Health Services onPerinatal deathTo reduce the potential of confounding effects, we utilized propensity score matching (PSM) approach tocompare women who had complete continuum of care in maternal health services with their maininterventions to those who had terminated/discontinued the services. Among the three distincttechniques of propensity score matching (PSM), one to one matching was utilized to quantify the effectof intervention on perinatal death. After matching treated and control individual, the effects of completion

Page 16/28
of continuum of care in maternal health services via time and space dimension on perinatal death weredetermined.
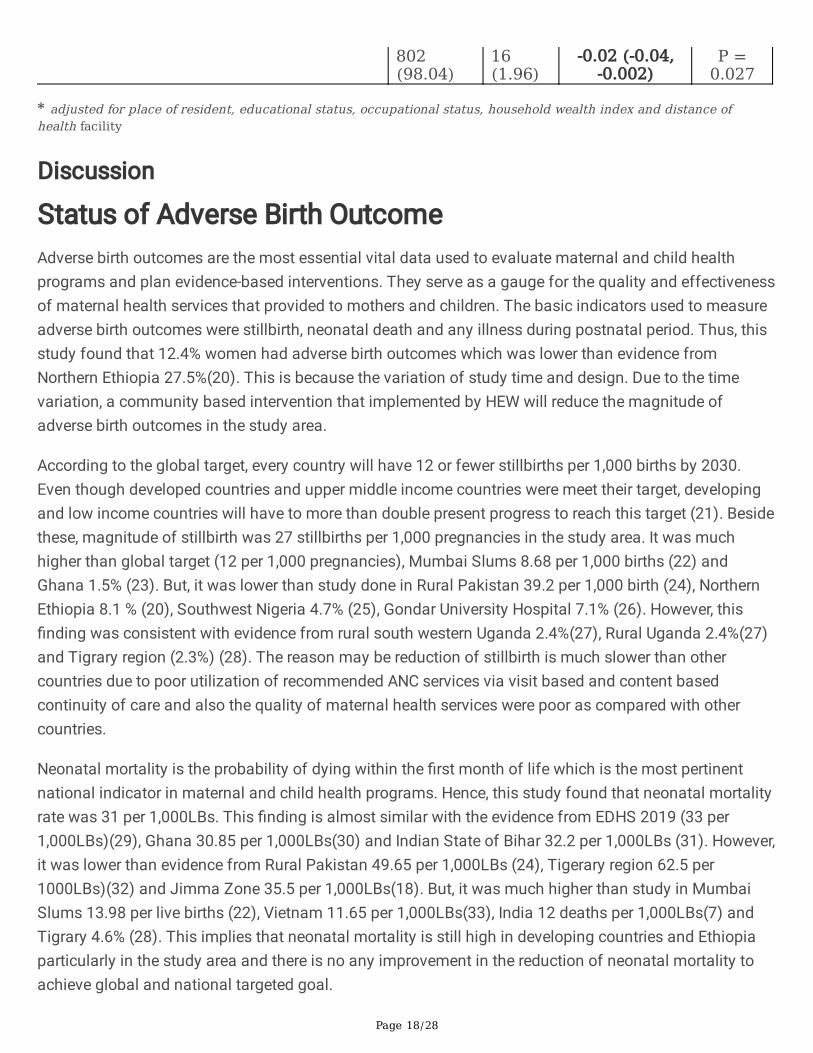
Hence, the result found to be received 1st ANC visit (β = -0.08; 95%CI: -0.13, -0.04; p < 0.0001); completed4th ANC visit (β = -0.04; 95%CI: -0.06, -0.02; p = 0.002); skilled attendant of ANC services (β = -0.03; 95%CI:-0.05, -0.01; p = 0.002); completed continuity of care for both 4th ANC and skilled delivery (β = -0.02;95%CI: -0.04, -0.01; p = 0.006); completion of continuum of care in maternal health services (β = -0.03;95%CI: -0.04, -0.01; p = 0.007); completed key services of ANC package (β = -0.04; 95%CI: -0.05, -0.02; p <0.0001), completion of key services of PNC package (β = -0.05; 95%CI: -0.07, -0.04; p < 0.0001), completewhole key service maternal health services (β = -0.04; 95%CI: -0.05, -0.02; p < 0.0001) and completedcontinuum of care via space dimension (β = -0.02; 95%CI: -0.04, -0.002; p = 0.027) were associated with asigni�cant reduction in the likelihood of perinatal death (Table 6).
Table 6: Propensity Score Matching Analysis on the effect of continuum of care in maternalhealth services on perinatal death Benishangul Gumuz Region, Northwest Ethiopia 2021

Page 17/28
Factors Perinatal death Adjustedestimateβ 95%CI
P –value No Yes
I. Continuity of care in maternal health services via time dimension
First ANC servicesNo Received Received
248(88.89)1,855(96.66)
31(11.11)64(3.34)
-0.08 (-0.13,-0.04)
P <0.0001
Fourth ANC servicesDiscontinued Completed care
692(92.89)1,411(97.11)
53(7.11)42(2.89)
-0.04 (-0.06,-0.02)
P =0.002
Delivery Care ServicesUnskilled delivery servicesSkilled delivery services
868(94.66)1,235(96.41)
49(5.34)46(3.59)
-0.03 (-0.05,-0.01)
P =0.002
Continuity of care for both 4th ANC and Skilled delivery Discontinuity of car Completion of car
1,155(94.75)948(96.83)
64(5.25)31(3.17)
-0.02 (-0.04,
-0.01)
P =
0.006
Overall completion of continuity of maternal health services (ANC, SD andPNC)
Discontinuity of continuum of care Completion of continuum of care
1,391(94.82)712(97.40)
76(5.18)19(2.60)
-0.03 (-0.04,
-0.01)
P =
0.007
II. Continuity of care for key maternal health services
Continuity of key services of ANC package Discontinuity of key services Completionof key services
988(93.47)1,155(97.72)
69(6.53)26(2.28)
-0.04 (-0.05,
-0.02)
P <
0.0001
Continuity of key services of PNC package Discontinuity of key servicesCompletion of key services
1,289(93.75)814(98.91)
86(6.25)9(1.09)
-0.05 (-0.07,
-0.04)
P <
0.0001
Continuity of key services of all key services of MHS package Discontinuity of key servicesCompletion of key services
1,650(94.88)453(98.69)
89(5.12)6(1.31)
-0.04 (-0.05,
-0.02)
P <
0.0001
III. Continuity of care for maternal health services via space dimension
Discontinuity of care Completion of continuum of care
1,301(94.28)
79(5.72)
Page 18/28
802(98.04)
16(1.96)
-0.02 (-0.04,-0.002)
P =0.027
* adjusted for place of resident, educational status, occupational status, household wealth index and distance ofhealth facility
Discussion
Status of Adverse Birth OutcomeAdverse birth outcomes are the most essential vital data used to evaluate maternal and child healthprograms and plan evidence-based interventions. They serve as a gauge for the quality and effectivenessof maternal health services that provided to mothers and children. The basic indicators used to measureadverse birth outcomes were stillbirth, neonatal death and any illness during postnatal period. Thus, thisstudy found that 12.4% women had adverse birth outcomes which was lower than evidence fromNorthern Ethiopia 27.5%(20). This is because the variation of study time and design. Due to the timevariation, a community based intervention that implemented by HEW will reduce the magnitude ofadverse birth outcomes in the study area.
According to the global target, every country will have 12 or fewer stillbirths per 1,000 births by 2030.Even though developed countries and upper middle income countries were meet their target, developingand low income countries will have to more than double present progress to reach this target (21). Besidethese, magnitude of stillbirth was 27 stillbirths per 1,000 pregnancies in the study area. It was muchhigher than global target (12 per 1,000 pregnancies), Mumbai Slums 8.68 per 1,000 births (22) andGhana 1.5% (23). But, it was lower than study done in Rural Pakistan 39.2 per 1,000 birth (24), NorthernEthiopia 8.1 % (20), Southwest Nigeria 4.7% (25), Gondar University Hospital 7.1% (26). However, this�nding was consistent with evidence from rural south western Uganda 2.4%(27), Rural Uganda 2.4%(27)and Tigrary region (2.3%) (28). The reason may be reduction of stillbirth is much slower than othercountries due to poor utilization of recommended ANC services via visit based and content basedcontinuity of care and also the quality of maternal health services were poor as compared with othercountries.
Neonatal mortality is the probability of dying within the �rst month of life which is the most pertinentnational indicator in maternal and child health programs. Hence, this study found that neonatal mortalityrate was 31 per 1,000LBs. This �nding is almost similar with the evidence from EDHS 2019 (33 per1,000LBs)(29), Ghana 30.85 per 1,000LBs(30) and Indian State of Bihar 32.2 per 1,000LBs (31). However,it was lower than evidence from Rural Pakistan 49.65 per 1,000LBs (24), Tigerary region 62.5 per1000LBs)(32) and Jimma Zone 35.5 per 1,000LBs(18). But, it was much higher than study in MumbaiSlums 13.98 per live births (22), Vietnam 11.65 per 1,000LBs(33), India 12 deaths per 1,000LBs(7) andTigrary 4.6% (28). This implies that neonatal mortality is still high in developing countries and Ethiopiaparticularly in the study area and there is no any improvement in the reduction of neonatal mortality toachieve global and national targeted goal.

Page 19/28
In this study, we found that perinatal mortality rate was 48 per 1,000 pregnancies. This �nding isconsistent with the pooled estimate of perinatal mortality rate in Ethiopia was 51.3 per total births(34).However, this �nding was higher than study in Hawassa town HF 2.7% (35) and rural northern Ghana 39per 1,000 births(36). Whereas, it was lower than evidence from low income countries 55 per 1,000 births(37), Rural Pakistan 69.95 per birth (24) and Rural Congo 61 per 1,000 births(38). Among newborns diedwithin postnatal periods, 59.5% of the newborns were died within 48 hours and early neonatal deathscontribute 72.9% of neonatal deaths. This �nding is consistent with different study done in the countriesand outside the countries (32, 33, 37, 39).
Worldwide, the major causes of neonatal death are infections (sepsis/pneumonia, tetanus and diarrhea),prematurity/preterm birth and birth asphyxia. In line with these, we found that the three major neonatalcharacteristics that causes neonatal death: birth asphyxia (66.0%), sepsis/infection (50.5%) andpneumonia (42.0%). This �nding was supported by different studies (18, 22, 36–40). However, somevariation between countries may be sought because of the variability of quality, availability andutilization rate of maternal and newborn health services.
Maternal complications during pregnancy and childbirth are predisposing factors for neonatal death. Asresult, safe motherhood is a proven initiatives to prevent newborn death by overcoming pregnant relatedcomplications(39). Hence, this study found that obstructed labour (56.4%), obstetric sepsis/maternalinfection (54.7%), and APH (33.3%) were common pregnant related problems that cause neonatal death.This �nding was consistent with evidence from low and middle income countries which found thatobstructed labor and placental abruption cause birth asphyxia, and also maternal infections causeneonatal infections that cause neonatal death (41). This is due maternal and neonatal health conditionare interlinked each other’s.
In this study, the possible causes of stillbirth were maternal infection or obstetric sepsis, maternalmalnutrition and unnecessary medication. This �nding is consistent with evidence from low-incomecountries (37) and rural northwest Bangladesh (42). Moreover, before the occurrence of stillbirth, womenwere frequently suffered with pregnant related problems (severe abdominal pain, excessive vaginalbleeding and blurred vision and any illness during pregnancy (febrile illness, malnutrition and anemia).This �nding is supported by other study (21). This is because pregnant related problem and maternalillness during pregnancy cause poor placental function, either with fetal growth restriction or pretermlabor, or both, is a common cause of stillbirths. As a result, different evidence argued that better prenatalcare is critical to preventing 1.3 million stillbirths and ending unnecessary neonatal deaths (21).
Determinant factors of Adverse Birth OutcomeAmong community level factors, household wealth index is predictor of adverse birth outcome. Beside,women resided in poor household wealth index were three times more likely to have adverse birthoutcome. This is because level of household index are directly related to access of information andreceiving health services, which enable them to prevent themselves and her newborn from any illness andadverse event.
Page 20/28
Educational status is a determinant factor of adverse birth outcomes, in which women who attended highschool were six times more likely to had adverse birth outcome as compared with women who had noformal education. This may be educated people have better knowledge and information on the impact ofadverse birth outcomes, as result they are early diagnosis the problems and report properly for furthertreatment and management as compared with people with no formal education. Moreover, people lackeducation did not report any adverse event and believing that the event as a usual life rather thanconsidering as health problems. So, the magnitude of adverse birth outcomes was high among educatedpeople.
In this study, initiating 1st ANC visit between 4 – 6 months of gestational age reduced adverse birthoutcomes by 62%. This study is consistent with previous study in Gondar University Hospital (26) andGhana (23). This could be the fact that during ANC visits, relevant health issues can be identi�ed andaddressed early. This is only feasible if pregnant women present themselves to a suitable health facilityat an early stage of labor and pregnancy. As a result, the probability of occurring adverse birth outcomeswill be remission.
According to WHO directives, IFA supplementation during pregnancy, early initiating BF within 1hour forthe newborn and immunization increased the survival of newborn by overcoming the adverse event. Inline these, we found that women received IFA supplementation during pregnancy and initiate BF within1hours for her newborn and immunized newborn within postnatal period were less likely to have adversebirth outcomes. This �nding is concurrent with previous studies within the country and abroad (6, 10, 18,32).
The occurrence of pregnant related problems during pregnancy, childbirth and immediately afterchildbirth decreases the survival of newborn. Beside, we depicted that women who had pregnant-relatedcomplications during pregnancy, labour and childbirth and immediately after childbirth were more likelyto have adverse birth outcomes. This �nding consistent with evidence from low- and middle-incomecountries(43), Developing countries(44), Ghana(23), Indian State of Bihar(31), Jimma Zone(18) andGondar University Hospital(26). This is the fact that women who have pregnant related complicationswere prone for infection and birth asphyxia which are the leading cause of stillbirth, neonatal death andneonatal illness. This is also explained by the health condition of newborn relies on maternal healthstatus before, during and after conception.
As principle, amniotic �uid should be odorless or have a slightly sweet odor. However, if it is noticed thatsmells bad, it could be a sign and symptom of uterine infection. Thus, this study revealed that womenwho had an offensive odder of amniotic �uid were three times more likely to have adverse birth outcome.This is explained by offensive odder of amniotic �uid is an indication of infections, which is the leadingcause of stillbirth birth, neonatal death and illness during postnatal period.
Effect of continuum of care in maternal health services onperinatal death
Page 21/28
Maternal health interventions during pregnancy, childbirth and after childbirth have a bene�cial healthimpact on maternal and newborn health outcomes (45). This is because early detection of pregnancy-related disorders throughout pregnancy, management of labor and delivery, care of any adverse event,and treatment of serious infectious infections and acute malnutrition are all effective interventions ofmaternal health services packages, which could reduce 77% of perinatal mortality(46).
In line with these, we found that women received 1st ANC visit; completed 4th ANC visit; skilled attendantof ANC services; completed continuity of care for both 4th ANC and skilled delivery; completion ofcontinuum of care in maternal health services; completed key services of ANC package, completion ofkey services of PNC package, complete whole key service maternal health service and completedcontinuum of care via space dimension were signi�cantly reduce perinatal deaths. This �nding isconsistent with previous studies conducted in the country and abroad (6, 7, 18, 23, 24, 28, 38, 40, 47–60).This is because more than one third of all child deaths occur in the �rst month of life, providing skilledcare to mothers during pregnancy, as well as during and after birth, greatly contributes to child survival,with two-thirds of newborn deaths preventable if known, effective health measures are provided at birthand during the �rst week of life.
ConclusionsIn this study, we concluded that neonatal and perinatal mortality rate were high as compared withnational and international targets. Risk factors for adverse birth outcomes were poor household wealthindex, pregnant related complication during pregnancy, childbirth and immediately after childbirth, badodder amniotic �uid and history of stillbirth. Whereas, the protective interventions were receiving IFAsupplementation during pregnancy, initiating BF within 1hour for newborn, immunizing newborn andcompletion of continuity of care in maternal health services via time and space dimension. Efforts shouldbe made to strengthening supplementation of IFA during, immunizing newborn and early initiation of BFfor newborn as well as early detection and treatment of risk factors for poor birth outcomes were stronglyrecommended. Moreover, increased attention to newborns, as well as, in the context of the continuum ofcare, to women before and after giving birth, is required to effectively reduce adverse birth outcomes,perinatal and neonatal mortality. This must be accomplished through reaching out to disadvantagedpopulations’ particularly poor population and providing them with the necessary health care.
AbbreviationsANCAntenatal CareAORAdjusted Odd RatioAPHAntepartum HemorrhageBF

Page 22/28
Breast FeedingBGRSBenishangul Gumuz RegionCICon�dence IntervalCOCContinuum of CareCORCrude Odd RatioEDHSEthiopia Demographic and Health SurveyFSUFinal Sampling UnitGAGestational AgeHCHealth CenterHEWHealth Extension WorkersHOHealth O�cerICCIntra-class Correlation Coe�cientIFAIron Folic AcidIRBInstitutional Review BoardLBsLive BirthsLRLog Likelihood RatioMCHMaternal and Child HealthMHSMaternal Health ServicesMPDSRMaternal and Perinatal Death Surveillance and ResponseNMRNeonatal Mortality RatePCA

Page 23/28
Principal Component AnalysisPNCPostnatal CarePSMPropensity Score MatchingRECResearch Review and Ethics CommitteeSPHSchool of Public HeathSPSSStatistical Package for Social SciencesSRSSimple Random SamplingTTTetanus ToxoidWHOWorld Health Organization
Declarations
Ethics approval and consent to participateEthical approval was obtained from Research Review and Ethics Committee (REC) of School of PublicHealth, Addis Ababa University's with protocol number SPH/3089/011 and Institutional Review Board(IRB) of College of Health Sciences of Addis Ababa University with protocol number 048/19/SPH.Necessary permission letters were obtained from Regional Health Bureau and respective all localdistricts. Con�dentiality was maintained by avoiding any identities from the questionnaire. Beforestarting actual data collection, written and verbal consent was obtained from each study subjects.
Consent to publishNot Applicable
Availability of data and materialsThe d atasets used and analyzed during the current study are available from the corresponding author onreasonable request.
Competing interests
Page 24/28
The authors declare that they have no competing interests.
Funding This study funded by Addis Ababa University but there is no other funding agencies for this works
Authors’ contributionsMA conceived and designed the study. Then after, data was collected, analyzed, interpreted and wrote thewhole document. AW and GT were critically commenting the whole document and genuinely guide thewhole work. All authors read and approved the �nal manuscripts.
AcknowledgementsWe would like to thank Addis Ababa University, College of Health for providing ethical approval andpartially sponsored this project work. The authors would also want to express their gratitude to all of thepregnant women, data collectors, supervisors, and other individuals who contributed directly or indirectlyto the study's success. Last but not least, the author wishes to express his gratitude to Miss AbebechTefera, Miss Chaltu Argeta, Dr. Nigatu Disassa, and Assistant professor Atnafu Morka for theirunwavering assistance in the preparation, magement and duplication of research questionnaires.
References1. Marian F. MacDorman TJM, Ashna D. Mohangoo. International Comparisons of Infant Mortality
andRelated Factors: United States and Europe. September, 2014;63(5).
2. Website:. https://www.idrc.ca/en/initiative/innovating-maternal-and-child-health-africa.
3. Trend in Maternal Mortality:1990 to 2015 Estimates2015; Geneva, Switzerland: World HealthOrganization (WHO).
4. De Graft-Johnson J KK, Tinker A, et al. The maternal, newborn and child health continuum of care:Opportunities for Africa’s newborns. Partnership for Maternal, Newborn and Child Health.2011;2006:23–36.
5. Joseph de Graft-Johnson KK, Anne Tinker, Susan Otchere, Indira Narayanan, Rumishael Shoo,DoyinOluwole, Joy Lawn. Household to home continuum of care for maternal, newborn, and childhealth.24 - 33.
�. Kayode GA, Ansah E, Agyepong IA, et al. Individual and community determinants of neonatalmortality in Ghana: a multilevel analysis. BMC Pregnancy and Childbirth. 2014;14:165-.
7. Fadel SA, Ram U, Morris SK, et al. Facility Delivery, Postnatal Care and Neonatal Deaths in India:Nationally-Representative Case-Control Studies. PLoS One. 2015;10(10):e0140448.
Page 25/28
�. Carvajal-Aguirre L, Amouzou A, Mehra V, et al. Gap between contact and content in maternal andnewborn care: An analysis of data from 20 countries in sub-Saharan Africa. J Glob Health.2017;7(2):020501.
9. Manandhar DS, Osrin D, Shrestha BP, et al. Effect of a participatory intervention with women's groupson birth outcomes in Nepal: cluster-randomised controlled trial. The Lancet. 2004;364(9438):970–9.
10. Kumar V, Mohanty S, Kumar A, et al. Effect of community-based behaviour change management onneonatal mortality in Shivgarh, Uttar Pradesh, India: a cluster-randomised controlled trial. The Lancet.2008;372(9644):1151–62.
11. Kikuchi K AE, Okawa S, Enuameh Y, Yasuoka J, Nanishi K, et al. Effective Linkages of Continuum ofCare for Improving Neonatal, Perinatal, and Maternal Mortality: A Systematic Review and Meta-Analysis. PLoS ONE. 2015;10(9).
12. Azad K, Barnett S, Banerjee B, et al. Effect of scaling up women's groups on birth outcomes in threerural districts in Bangladesh: a cluster-randomised controlled trial. The Lancet.2010;375(9721):1193–202.
13. ((UNDP) UNDP-E. The Benishangul Regional State is selected for design of model REDD programunder the UNFCCC Warsaw Framework. 2017.
14. National Institution for Transforming India (NITI) Aayog, Goverment of India, 2013. Website:http://niti.gov.in/content/neo-natal-mortality-rate-nmr-1000-live-births [Internet].
15. Agency CS, editor Ethiopia Demographic and Health Survey2016; Addis Ababa: The DHS ProgramICF Rockville, Maryland, USA.
1�. (MoH) EMoH. National Technical Guidance For Mataernal and Perinatal Death Surveillance andResponse (MPDSR). In: INSTITUE EPH, editor. 2017.
17. Agha S WE. Maternal and Child Health Program Indicator Survey 2013, Sindh Province. MNCHServices Component, USAID/Pakistan MCH Program. Karachi, Pakistan: Jhpiego. 2013.
1�. Gurmesa Tura Debelew, Mesganaw Fantahun Afework, Yalew AW. Determinants and Causes ofNeonatal Mortality in Jimma Zone, Southwest Ethiopia: A Multilevel Analysis of Prospective FollowUp Study. PLoS ONE. 2014;9(9).
19. Yaliso Yaya Balla TD, Bernt Lindtjorn. Maternal and neonatal mortality in rural southEthiopia:Outcomes of Community-Based Birth Registration by Health Extension Workers. January,2015;10(3).
20. Seyoum E, Bekele A, Tsegaye AT, et al. Magnitude and Determinants of Adverse Perinatal Outcomesin Tefera Hailu Memorial Hospital, Sekota Town, Northern Ethiopia. Global pediatric health.2021;8:2333794x211015524.
21. Joy E Lawn, Hannah Blencowe, Peter Waiswa, et al. Ending preventable stillbirths: Stillbirths: rates,risk factors, and acceleration towards 2030. The Lancet Ending Preventable Stillbirths Series withThe Lancet Stillbirth Epidemiology.Lancet 2016; 387: 587–603.
22. Gülmezoglu AM, More NS, Bapat U, et al. Community Mobilization in Mumbai Slums to ImprovePerinatal Care and Outcomes: A Cluster Randomized Controlled Trial. PLoS Medicine.

Page 26/28
2012;9(7):e1001257.
23. Afulani PA. Determinants of stillbirths in Ghana: does quality of antenatal care matter? BMCPregnancy Childbirth. 2016;16(1):132.
24. Bhutta ZA, Soo� S, Cousens S, et al. Improvement of perinatal and newborn care in rural Pakistanthrough community-based strategies: a cluster-randomised effectiveness trial. The Lancet.2011;377(9763):403–12.
25. Awoleke JO, Olo�nbiyi BA. Poor prenatal service utilization and pregnancy outcome in a tertiaryhealth facility in Southwest Nigeria. Pan Afr Med J. 2020;35:28-.
2�. Adane AA, Ayele TA, Ararsa LG, et al. Adverse birth outcomes among deliveries at Gondar UniversityHospital, Northwest Ethiopia. BMC Pregnancy Childbirth. 2014;14:90.
27. Asiki; G, Baisley; K, Newton; R, et al. Adverse pregnancy outcomes in rural Uganda (1996–2013):trends and associated factors from serial cross sectional surveys. BMC Pregnancy and Childbirth.2015;15:279.
2�. Haftu A, Hagos H, Mehari MA, et al. Pregnant women adherence level to antenatal care visit and itseffect on perinatal outcome among mothers in Tigray Public Health institutions, 2017: cohort study.BMC Res Notes. 2018;11(1):872.
29. Ethiopian Public Health Institute E, Federal Ministry of Health F, Icf. Ethiopia Mini Demographic andHealth Survey 2019. Addis Ababa, Ethiopia: EPHI/FMoH/ICF, 2021.
30. Betty R Kirkwood, Alexander Manu, Augustinus H A ten Asbroek, et al. Eff ect of the Newhints home-visits intervention on neonatal mortality rate and care practices in Ghana: a cluster randomisedcontrolled trial. Lancet 2013; 381 2184–92: Website: http://dxdoiorg/101016/S0140-6736(13)60095-1. 2013.
31. Kumar GA, Dandona R, Chaman P, et al. A population-based study of neonatal mortality andmaternal care utilization in the Indian state of Bihar. BMC Pregnancy and Childbirth. 2014;14:357.
32. Mengesha HG, Wuneh AD, Lerebo WT, et al. Survival of neonates and predictors of their mortality inTigray region, Northern Ethiopia: prospective cohort study. BMC Pregnancy and Childbirth.2016;16:202.
33. Eriksson L, Nga NT, Hoa DTP, et al. Secular trend, seasonality and effects of a community-basedintervention on neonatal mortality: follow-up of a cluster-randomised trial in Quang Ninh province,Vietnam. J Epidemiol Community Health. 2018;72(9):776–82.
34. Jena BH, Biks GA, Gelaye KA, et al. Magnitude and trend of perinatal mortality and its relationshipwith inter-pregnancy interval in Ethiopia: a systematic review and meta-analysis. BMC pregnancy andchildbirth. 2020;20(1):432-.
35. Tsegaye B, Kassa A. Prevalence of adverse birth outcome and associated factors among womenwho delivered in Hawassa town governmental health institutions, south Ethiopia, in 2017. ReprodHealth. 2018;15(1):193.
3�. Engmann C, Walega P, Aborigo RA, et al. Stillbirths and early neonatal mortality in rural NorthernGhana. Tropical Medicine & International Health. 2012;17(3):272–82.

Page 27/28
37. Engmann C, Garces A, Jehan I, et al. Causes of community stillbirths and early neonatal deaths inlow-income countries using verbal autopsy: an International, Multicenter Study. J Perinatol.2012;32(8):585–92.
3�. Matendo RM EC, Ditekemena JD, Gado J, Tshefu A, McClure EM et al. Challenge of ReducingPerinatal Mortality in Rural Congo: Findings of a Prospective, Population-based Study. Journal ofHealth, Population and Nutrition. 2011;29(5):532–40.
39. Joy E Lawn, Simon Cousens, Jelka Zupan. Neonatal Survival and neonatal deaths: When? Where?Why? The Lancet Neonatal Survival Steering Team. 2005;Lancet 2005; 365: 891–900.
40. Fottrell E, Azad K, Kuddus A, et al. The effect of increased coverage of participatory women's groupson neonatal mortality in Bangladesh: A cluster randomized trial. JAMA Pediatr. 2013;167(9):816–25.
41. Goldenberg RL, McClure EM, Saleem S. Improving pregnancy outcomes in low- and middle-incomecountries. Reprod Health. 2018;15(Suppl 1):88.
42. Sikder SS, Labrique AB, Craig IM, et al. Patterns and determinants of care seeking for obstetriccomplications in rural northwest Bangladesh: analysis from a prospective cohort study. BMC HealthServ Res. 2015;15:166.
43. Harrison MS, Ali S, Pasha O, et al. A prospective population-based study of maternal, fetal, andneonatal outcomes in the setting of prolonged labor, obstructed labor and failure to progress in low-and middle-income countries. Reprod Health. 2015;12 Suppl 2:S9.
44. Firdawek E, Worku A. Maternal Near Miss and Still birth in developing countries: A Systematic Reviewwith Meta-Analysis. Journal of Pregnancy and Child Health. 2015;02(06).
45. Lassi ZS, Majeed A, Rashid S, et al. The interconnections between maternal and newborn health--evidence and implications for policy. J Matern Fetal Neonatal Med. 2013;26 Suppl 1:3–53.
4�. Black RE, Levin C, Walker N, et al. Reproductive, maternal, newborn, and child health: key messagesfrom Disease Control Priorities 3rd Edition. The Lancet. 2016;388(10061):2811–24.
47. Gurmesa Tura, Mesganaw Fantahun, Worku A. The effect of health facility delivery on neonatalmortality: systematic review and meta-analysis. BMC Pregnancy and Childbirth 2013, 13:18Available at http://wwwbiomedcentralcom/1471-2393/13/18. 2013.
4�. Aboubaker S, Qazi S, Wolfheim C, et al. Community health workers: A crucial role in newborn healthcare and survival. Journal of global health. 2014;4(2):020302-.
49. Abdul Hakeem Jokhio, Heather R. Winter, Kar Keung Cheng. An Intervention Involving TraditionalBirth Attendants and Perinatal and Maternal Mortality in Pakistan. The new england journal ofmedicine: 352; 20. 2005.
50. Worku AG, Yalew AW, Afework MF. The contributions of maternity care to reducing adversepregnancy outcomes: a cohort study in Dabat district, northwest Ethiopia. Matern Child Health J.2014;18(6):1336–44.
51. Kikuchi K, Yasuoka J, Nanishi K, et al. Postnatal care could be the key to improving the continuum ofcare in maternal and child health in Ratanakiri, Cambodia2018. e0198829 p.
Page 28/28
52. Kananura RM, Wamala R, Ekirapa-Kiracho E, et al. A structural equation analysis on the relationshipbetween maternal health services utilization and newborn health outcomes: a cross-sectional studyin Eastern Uganda. BMC Pregnancy Childbirth. 2017;17(1):98.
53. Shiferaw K, Mengiste B, Gobena T, et al. The effect of antenatal care on perinatal outcomes inEthiopia: A systematic review and meta-analysis. PloS one. 2021;16(1):e0245003-e.
54. Baqui AH, El-Arifeen S, Darmstadt GL, et al. Effect of community-based newborn-care interventionpackage implemented through two service-delivery strategies in Sylhet district, Bangladesh: a cluster-randomised controlled trial. The Lancet. 2008;371(9628):1936–44.
55. Baqui AH, Williams EK, Rosecrans AM, et al. Impact of an integrated nutrition and health programmeon neonatal mortality in rural northern India. Bulletin of the World Health Organization.2008;86(10):796–804.
5�. Gogia S, Sachdev HP. Home-based neonatal care by community health workers for preventingmortality in neonates in low- and middle-income countries: a systematic review. J Perinatol. 2016;36Suppl 1:S55-73.
57. Jokhio AH, Winter HR, Cheng KK. An Intervention Involving Traditional Birth Attendants and Perinataland Maternal Mortality in Pakistan. New England Journal of Medicine. 2005;352(20):2091–9.
5�. Kikuchi K, Ansah EK, Okawa S, et al. Effective Linkages of Continuum of Care for ImprovingNeonatal, Perinatal, and Maternal Mortality: A Systematic Review and Meta-Analysis. PLoS One.2015;10(9):e0139288.
59. Kikuchi K, Okawa S, Zamawe CO, et al. Effectiveness of Continuum of Care-Linking Pre-PregnancyCare and Pregnancy Care to Improve Neonatal and Perinatal Mortality: A Systematic Review andMeta-Analysis. PLoS One. 2016;11(10):e0164965.
�0. Rahman A, Moran A, Pervin J, et al. Effectiveness of an integrated approach to reduce perinatalmortality: recent experiences from Matlab, Bangladesh. BMC Public Health. 2011;11:914.