ethanol plant valuation
TRANSCRIPT

Ethanol Plant Valuation
Thomas Reineke, SAMA,CAE, ASA
Property Tax Compliance Officer
Property Tax Division
Minnesota Department of Revenue
12/8/2011 1

For Educational Purposes Only
• The opinions set forth herein reflect the viewpoints of the author. While a great deal of care has been taken to provide accurate and current information, no responsibility is assumed for the accuracy of the data contained herein. This document was created for educational purposes with the understanding that the author is not engaged in rendering legal, accounting, or other professional advice.
12/8/2011 2

Outline
• Ethanol Facts and Figures
• Supply and Demand
• Approaches to Value
1. Cost Approach
2. Sales
3. Operational Income Approach
12/8/2011 3

Ethanol Facts and Figures
2009 2010
Each gallon of
ethanol delivers as
much as 130%
more energy
Each gallon of
ethanol delivers as
much as 260%
more energy
In 2009 production
of 10.75 billion
gallons
In 2010 production
of 13 billion
gallons
78% of all gas
sold is blended
with ethanol
90% of all gas
sold is blended
with ethanol
12/8/2011 4

Facts and Figures (cont’d)
2009 2010
There are more
than 8 million
FFV on the
road
There are more
than 8.5 million
FFV’s
12/8/2011 5
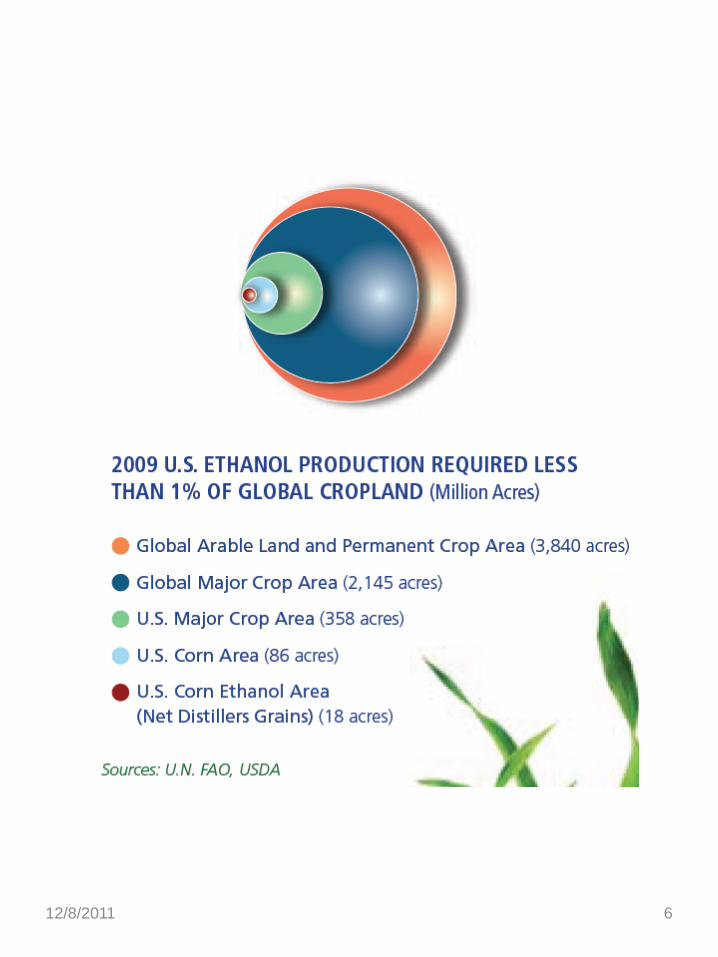
12/8/2011 6

US Ethanol Plant Map
12/8/2011 7

Ethanol Plant Locations in Minnesota
12/8/2011 8

12/8/2011 9
Ethanol Production in the U.S.
0
2,000
4,000
6,000
8,000
10,000
12,000
14,000
19
80
19
82
19
84
19
86
19
88
19
90
19
92
19
94
19
96
19
98
20
00
20
02
20
04
20
06
20
08
20
10
Millio
ns o
f G
allo
ns
Year

U.S. Corn Acres Planted
12/8/2011 10
0
20,000,000
40,000,000
60,000,000
80,000,000
100,000,000
120,000,000
1920 1940 1960 1980 2000 2020
Corn Acres

12/8/2011 11

12/8/2011 12

12/8/2011 13

12/8/2011 14

The Energy Policy Act of 2005
• - was responsible for regulations that ensured gasoline sold in the U.S. contained a minimum volume of renewable fuel, called the Renewable Fuels Standard. The regulations aimed to double , by 2012, the use of renewable fuel, mainly ethanol made from corn.
12/8/2011 15

The Energy Independence and Security Act of 2007
• - expanded the Renewable Fuels Standard to require that 36 billion gallons of ethanol and other fuels be blended into gasoline, diesel, and jet fuel by 2022.
12/8/2011 16

Production of Ethanol at its Maximum
• 13 billion gallons maximum output at 10% blend
• Recently expanded to 15% blend, production will equal demand again in 4 years
• Lack of flex-fuel vehicles that use 85% ethanol blend (approx 8MM of the 240MM vehicles)
• Of the 170,000 gas stations, only about 2,300 have ethanol. The cost of retrofitting gas pump for ethanol is between $22,000 and $80,000.
12/8/2011 17

• Corn production has steadily increased while using fewer acres
• Farmers grow 5 times as much corn as they did in the 1930’ – on 20% less land. That’s still 13 million acres, or 20,000 square miles, twice the size of Massachusetts.
• The yield per acre has increased from 24 bushels in 1931 to 154 now, a six-fold increase
12/8/2011 18

12/8/2011 19

Alternative Fuel Sources • - biodiesel
• - electric
• -hydrogen
• -methanol
• -propane
• -bio-butanol
• -bio-gas
• -Fischer-Tropsch Diesel
• -Hydrogenation Derived Diesel
• -P Series Ultra Low Sulfur Diesel
• Technology to convert nat’l gas, coal, biomass to liquid
12/8/2011 20

Ethanol Process
• .
12/8/2011 21
Ethanol Production Methods
Wet vs. Dry Milling
The principle difference between the two methods is the initial treatment of the grain and resulting co-products. The increased production of higher margin co-products in the wet-mill process results in lower ethanol yield, approximately 2.5 gallons of ethanol per bushel of corn whereas a typical dry mill yields 2.7 gallons per bushel of corn.
12/8/2011 22

Co-Products of the Ethanol Process
• 1. Ethanol - 85%
• 2. Distillers Grains - 15%
• 3. Carbon Dioxide
• Distillers Grains are marketed at $150/ton dry as
compared to $50/ton wet.
12/8/2011 23

Cost Approach
12/8/2011 24

12/8/2011 25

12/8/2011 26

12/8/2011 27

12/8/2011 28

12/8/2011 29

12/8/2011 30
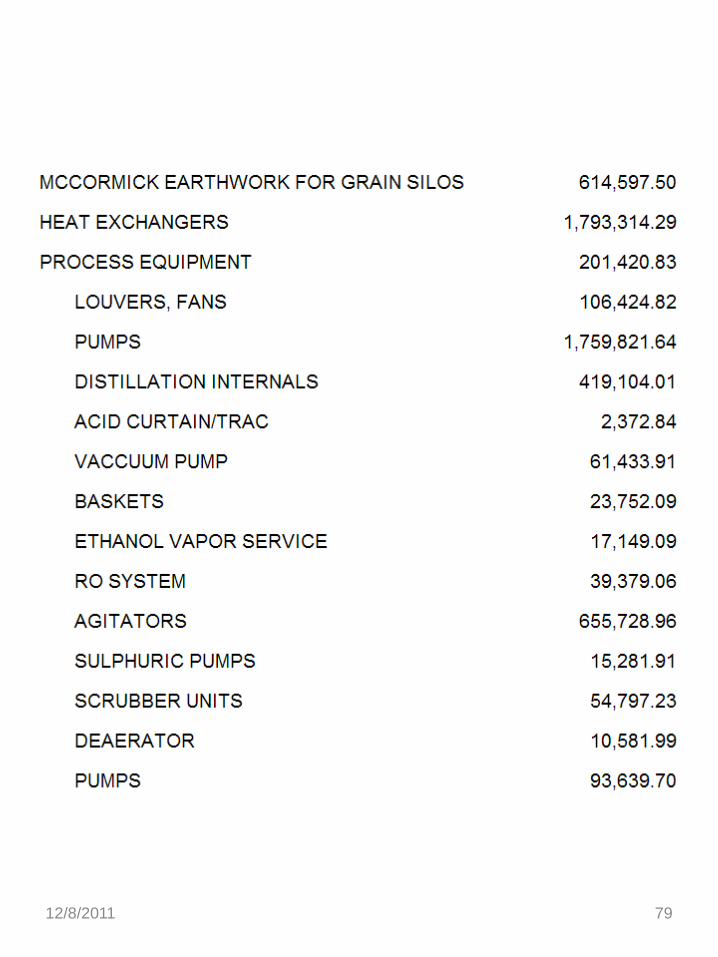
50 MGY Ethanol Production Facility
Asset Category Summary
DEPRECIABLE
DESCRIPTION COST BASIS
DESIGN / BUILD CONTRACT
SITEWORK $ 430,395.43
CONCRETE 6,267,641.27
MASONRY/ARCHITECTURE 466,261.72
STRUCTURAL STEEL / MISCELLANEOUS METALS 4,642,152.07
TOWER WALKWAY 379,127.95
PRE-ENGINEERED BUILDINGS 427,060.48
DDG STORAGE FACILITY 538,878.85
MAINTENANCE OFFICE 110,049.24
GRAIN HANDLING SYSTEM
Concrete Storage 2,310,000.00
Mechanical 9,525,874.32
MCCORMICK EARTHWORK FOR GRAIN SILOS 614,597.50
PROCESS TANKS AND VESSELS 4,984,986.53
DENATURANT TANKS 1,226,318.81
TANKS - FIELD CONTAINMENT LINERS 323,199.09
AMYLAZE TANKS 208,357.30
FIELD ERECTED TANKS
Denatured Ethanol Tanks 1,335,000.00
Beerwell vessel 826,650.00
Fermentation vessel 2,598,800.00
Piping and mechanical 1,695,481.45

12/8/2011 31
HEAT EXCHANGERS 1,793,314.29
PROCESS EQUIPMENT 201,420.83
LOUVERS, FANS 106,424.82
PUMPS 1,759,821.64
DISTILLATION INTERNALS 419,104.01
ACID CURTAIN/TRAC 2,372.84
VACCUUM PUMP 61,433.91
BASKETS 23,752.09
ETHANOL VAPOR SERVICE 17,149.09
RO SYSTEM 39,379.06
AGITATORS 655,728.96
SULPHURIC PUMPS 15,281.91
SCRUBBER UNITS 54,797.23
DEAERATOR 10,581.99
PUMPS 93,639.70
CENTRIFUGES 2,151,977.15
CHILLER 358,662.86
TRUCK SCALES & PROBE 272,583.77
ETHANOL LOADOUT 358,662.86
COOLING TOWER 624,073.37
DUAL DRYER SYSTEM 4,979,502.97
THERMAL OXIDIZER 4,562,191.56
METHANATOR 746,018.75
PROCESS PIPING AND VALVES 3,732,852.20
GASKETS 11,820.51
ADAPTERS/COUPLERS 3,529.97
PIPE CLAMPS 49,656.87
FLANGES 10,059.66
PROCESS PUMPS 28,426.33
PIPE & VALVES 2,619,585.90

12/8/2011 32
PAINTING 717,325.72
INSULATION 1,405,958.40
PLUMBING & HVAC 94,987.61
FILTRATION 26,448.75
VENTS, TUBING, FILTERS 33,508.87
HEATING/AIR 454,781.64
ELECTRICAL & INSTRUMENTATION 1,734,181.33
LABORATORY EQUIPMENT 101,287.07
MECHANICAL INSTRUMENT 95,145.38
WIRE 974,837.07
HYDROSTATIC SCREEN 72,287.78
CALIBRATED VALVE 13,749.61
BLOWERS 7,986.36
MECHANICAL INSTRUMENT 15,434.70
YEAST TANK AERATER 5,266.18
ANGLE IRON 2,895.38
METERING PUMPS 4,504.81
DCS SYSTEM 434,099.81
WIRE/CABLE 488,007.13
LEVEL GAUGES 17,839.62
MECHANICAL INSTRUMENT 22,610.91
INSTRUMENTS 46,858.61
SULFURIC ACID EDUCTOR 6,938.98
SPEED SWITCHES 33,872.32
ELECTRICAL MATERIAL 1,171,353.14
ELECTRICAL MATERIAL 265,835.36
FLASHDEK MATERIAL 7,064.31
GAUGES, THERMOMETERS 106,403.23
MECHANICAL INSTRUMENT 111,741.84

12/8/2011 33
FLOW METERS 9,980.93
BEARINGS 5,011.24
LEG MONITORING EQUIPMENT 7,933.62
ELECTRICAL MATERIAL 118,944.15
MOLECULAR SIEVE 287,647.61
BILLABLE REPLACEMENT WIRE 73,864.19
73,651,232.77
ADMINISTRATIVE BUILDING - LAMBERTON CONSTRUCTION
DEPRECIABLE
DESCRIPTION COST BASIS
$ 296,036.52
WATER TREATMENT CLS BUILDING - RICE LAKE
DEPRECIABLE
DESCRIPTION COST BASIS
EXCAVATION, UTILITIES, AND RESTORATION $ -
PIPING 2,384,721.03
EARTHWORK AND RESTORATION 350,175.96
REINFORCING STEEL, CONCRETE WORK, PRECAST 2,119,587.81
MASONRY 52,299.01
STRUCTURAL & MISC. METAL 257,629.46
RO ADDITION 371,537.48
ROUGH & FINISH CARPENTRY 2,273.87
EPDM ROOFING, INSULATION, CAULKING 145,641.37
H.M. DOORS, OVERHEAD DOORS 21,994.01
INTERIOR FINISHES, PAINTING 287,644.54

12/8/2011 34
PROCESS EQUIPMENT -
FIRE/STORAGE TANK 426,032.26
VESSCO EQUIPMENT 3,260,046.11
SIEMENS EQUIPMENT 1,942,462.44
PUMPS 101,759.09
SLUDGE STORAGE MIXER 68,843.68
ADDITIONAL MISC EQUIPMENT AND PIPING 217,042.02
INSTALLATION 373,985.65
MECHANICAL 1,575,791.83
ELECTRICAL AND CONTROLS 1,307,537.71
WATER BOOSTER SYSTEM 16,521.32
WELL HOUSE CONSTRUCTION Offsite 44,419.75
LIFT STATION & FORCEMAN PIPING 116,530.10
C02 LINE 30,482.76
PIPE ON RACK TO ETHANOL FACILITY 105,798.94
15,580,758.19
SITEWORK
DEPRECIABLE
DESCRIPTION COST BASIS
1,569,756.19

12/8/2011 35
SITE FENCING
DEPRECIABLE
DESCRIPTION COST BASIS
FURNISH AND INSTALL CHAIN LINK FENCE $ 81,169.44
LAND IMPROVEMENTS SURFACING OF ROADS
DEPRECIABLE
DESCRIPTION COST BASIS
BUILD AND PAVE ROADS $ 855,327.03
MAINTENANCE EQUIPMENT
DEPRECIABLE
DESCRIPTION COST BASIS
PLANT TOOLS AND EQUIPMENT $ 78,973.18

12/8/2011 36
LAND IMPROVEMENTS
DEPRECIABLE
DESCRIPTION COST BASIS
SURVEYING, CULVERT STAKING, DIRT WORK $ 49,681.25
FIBER OPTIC CABLE AND TELEPHONE EQUIPMENT 24,573.84
SAND, GRAVEL & FILL MATERIALS 124,977.80
PE PIPING TO ELECTRICAL SOURCE 91,180.38
PUMPS, METERS, AND VALVES 114,712.55
POTABLE WATER SANITARY SEWER 105,024.17
510,149.98
RAIL SPUR CONSTRUCTION
DEPRECIABLE
DESCRIPTION COST BASIS
7,034,023.07
FIRE PROTECTION LOOP
DEPRECIABLE
DESCRIPTION COST BASIS
673,635.99
12/8/2011 37
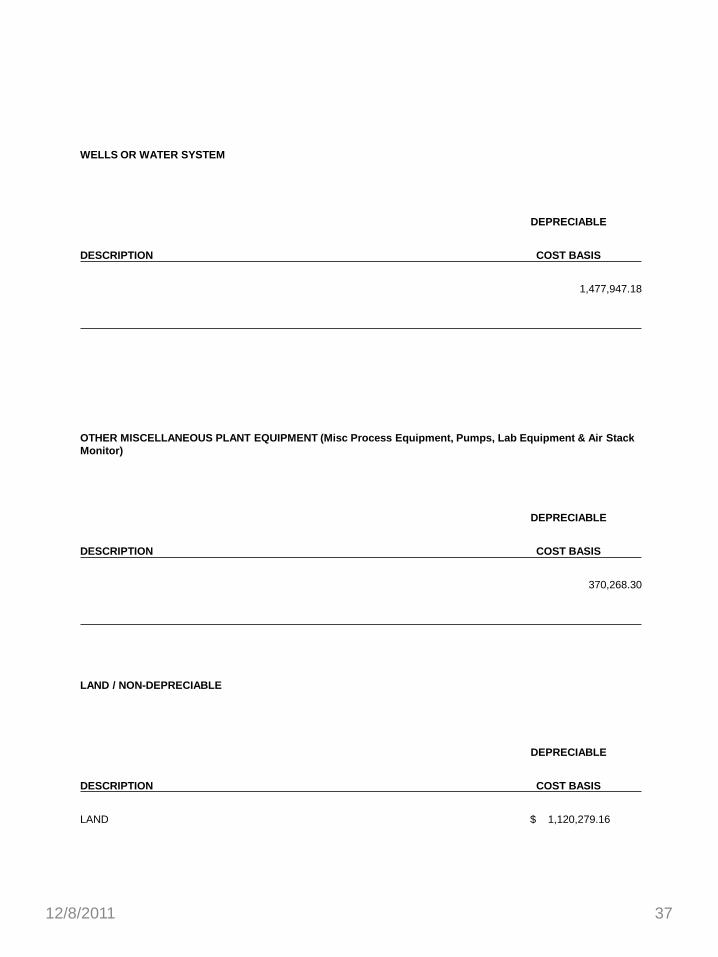
WELLS OR WATER SYSTEM
DEPRECIABLE
DESCRIPTION COST BASIS
1,477,947.18
OTHER MISCELLANEOUS PLANT EQUIPMENT (Misc Process Equipment, Pumps, Lab Equipment & Air Stack
Monitor)
DEPRECIABLE
DESCRIPTION COST BASIS
370,268.30
LAND / NON-DEPRECIABLE
DEPRECIABLE
DESCRIPTION COST BASIS
LAND $ 1,120,279.16

12/8/2011 38
Vehicles $ 41,994.00
Other Equipment (Motorized) $ 1,077,595.90
Additions (non real) $ 709,038.09
CIP (non real) $ 14,644.00
$105,142,828.98

What’s Taxable Real Property and what is non-taxable
machinery and equipment?
12/8/2011 39

12/8/2011 40

12/8/2011 41

Not Taxable
12/8/2011 42

Real Estate is Taxable
• The Property Tax Administrators Manual defines Real Estate as:
12/8/2011 43
Real Estate includes the land
and any appurtenances (e.g.
structures) attached to the land.
It is
immobile and tangible. It
includes all things that are a
natural part of the land such as
trees, minerals,
etc. as well as things that are
attached to it by people such as
buildings and site
improvements.

Taxable - (ii) The exclusion provided in clause (i) does not apply to the exterior shell of a structure which
constitutes walls, ceilings, roofs, or floors if the shell of the structure
has structural, insulation, or temperature control functions or
provides protection from the elements. Such an exterior shell is
included in the definition of real property even if it also has special functions distinct from that of a
building.
12/8/2011 44

Taxable vs. Non-Taxable
• In Busch v.County of Hennepin, 380 NW 2d 813,816 (Minn. 1986) (“Busch”), the Minnesota Supreme Court held that personal and real property should be distinguished by applying the “Shelter” test…
12/8/2011 45

Cont’d
• ..in Barton Enter., Inc. v. County of Ramsey, 390 N.W. 2d 776 (Minn 1986) the Minnesota Supreme Court held that…”the tanks themselves were taxable real property because they provided shelter to their contents and protected their contests from contaminants and from the elements.
12/8/2011 46

What is the Shelter Test?
• 3-step process whereby:
• 1. If the property falls within the broad definition of real property, (step 2)
• 2. Is tools, implements, machinery and equipment
• Step 3: If a structure has walls, ceilings, roofs or floors, and provides building like functionality, i.e., structural, insulation, or temperature control functions; or provides protections from the elements, that exterior structure is taxable.
12/8/2011 47

Ethanol Facility, Anywhere, MN
12/8/2011 48

Reverse Osmosis lined Pond
12/8/2011 49
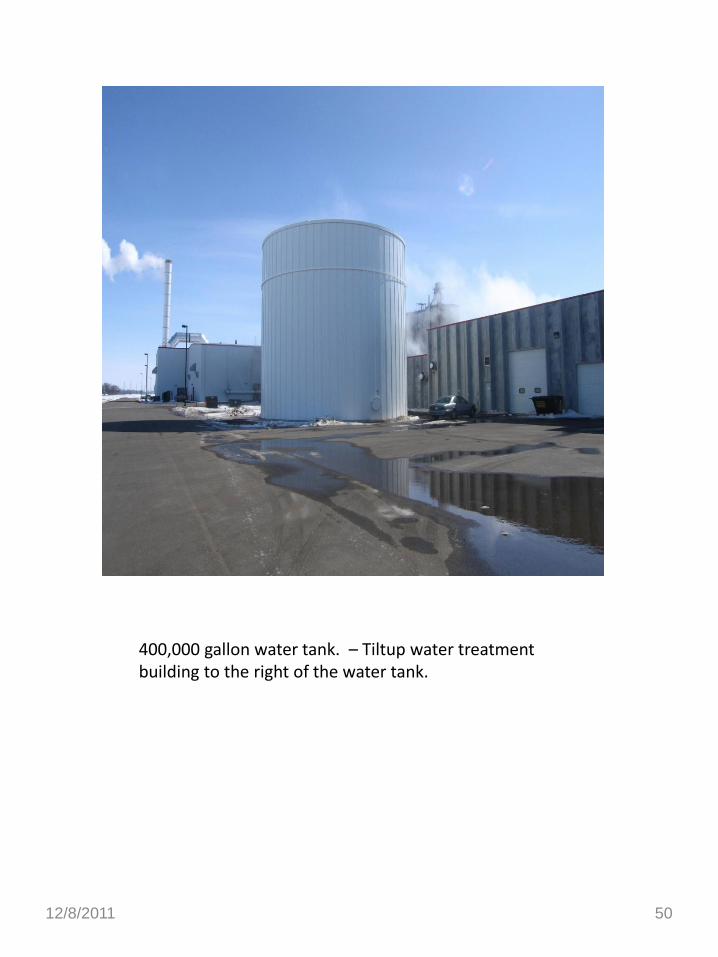
400,000 gallon water tank. – Tiltup water treatment building to the right of the water tank.
12/8/2011 50

Water Clarifier – Part of water treatment facility that recycles water for use in the ethanol process
12/8/2011 51

Water Press located I the Water Treatment Building
12/8/2011 52

Sludge Tank
12/8/2011 53
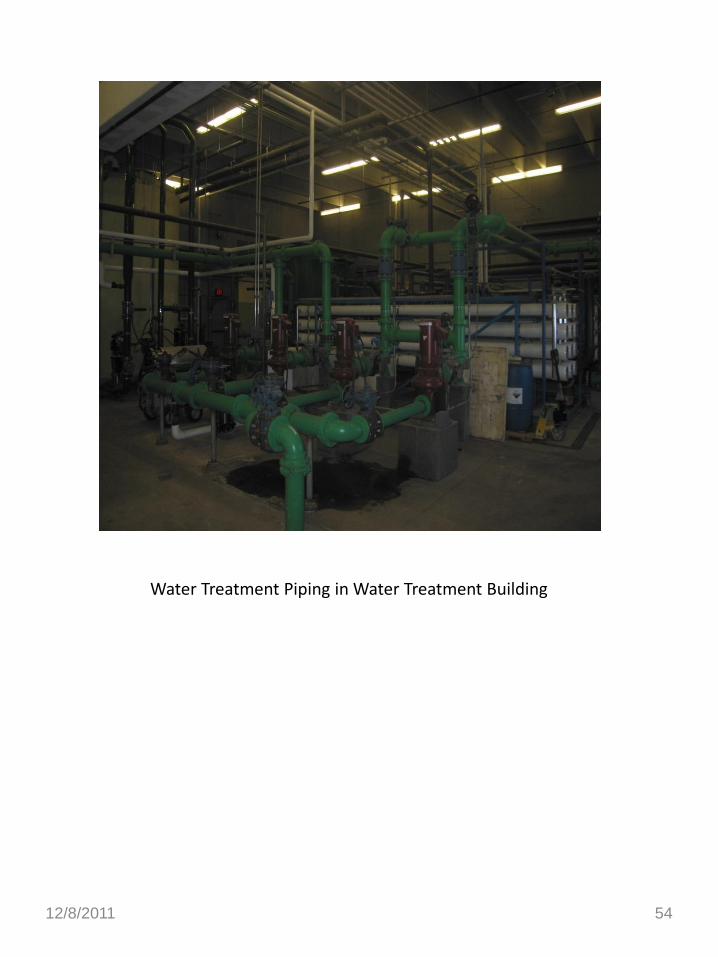
Water Treatment Piping in Water Treatment Building
12/8/2011 54
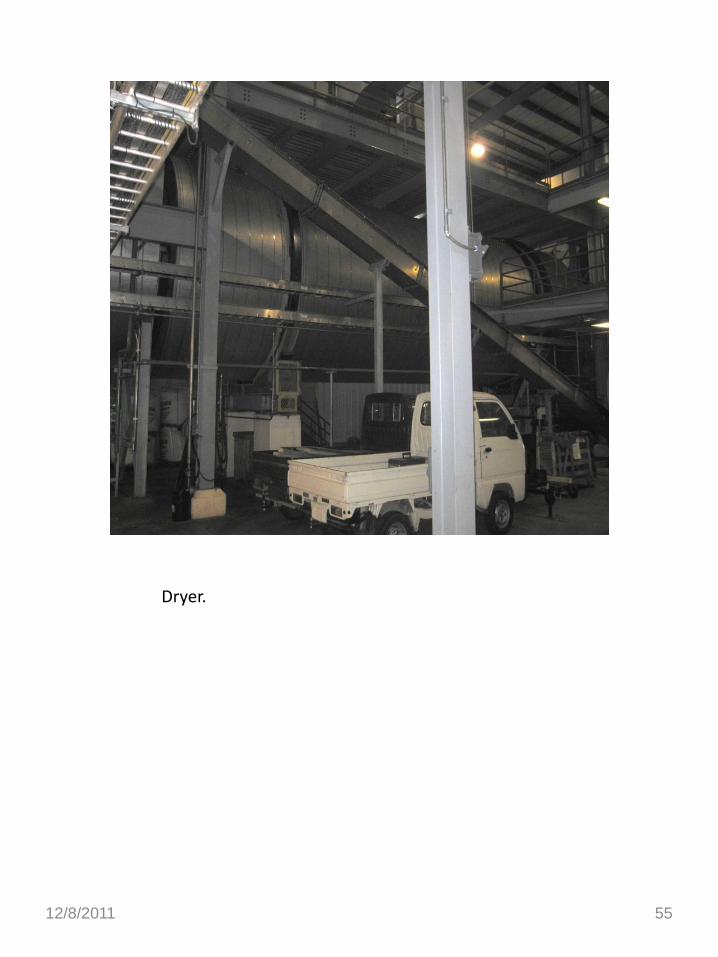
Dryer.
12/8/2011 55

Cooling Tower
12/8/2011 56

Energy Center Building
12/8/2011 57

Boiler System – Thermal Oxidizer located in the Energy Center.
12/8/2011 58

Process Building
12/8/2011 59

Chemical Storage Tanks located in the Process. These tanks are within the building.
12/8/2011 60

Personal Property – Evaporators located in the Process Building
12/8/2011 61

Chiller located in the Process Building. Note fermentation tank in the background.
12/8/2011 62

Fermentation Vessel. This is one of 4 fermentation tanks that are used in the process. Liquid only remains in this tank for 55 hours.
12/8/2011 63

Fermentation Tanks and Beer Well.
12/8/2011 64

Methanators and Thermal Oxidizer Stack
12/8/2011 65

Centrifuge
12/8/2011 66

Distiller
12/8/2011 67

Poured concrete Silos (2+)
12/8/2011 68

Hammer Mill
12/8/2011 69
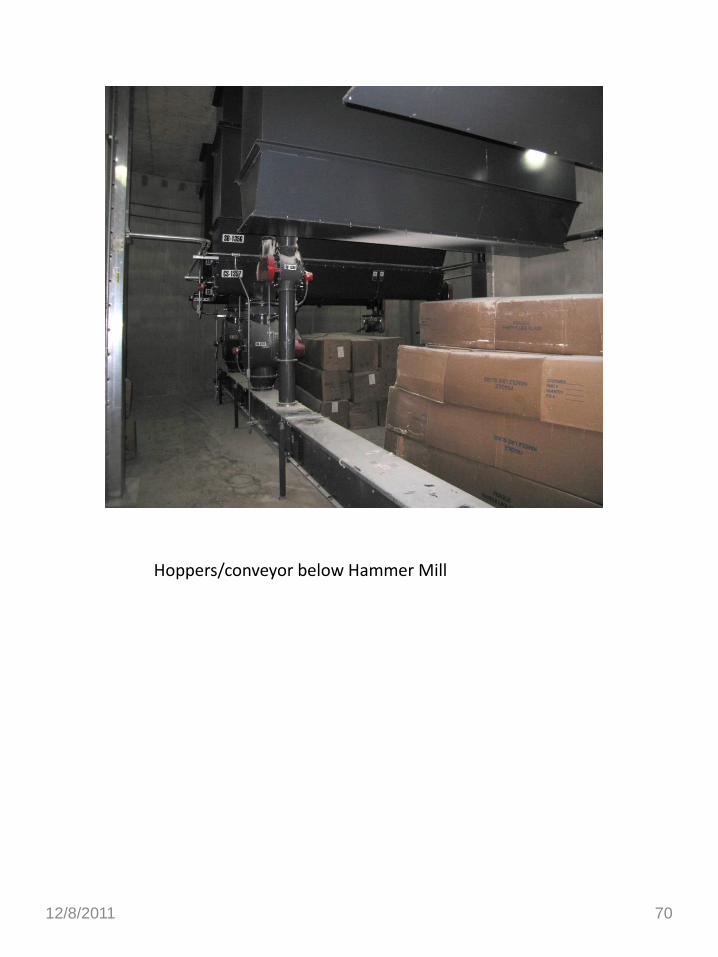
Hoppers/conveyor below Hammer Mill
12/8/2011 70

1st Floor Electric Control Panel below conveyor system
12/8/2011 71

Dust Collector
12/8/2011 72

Grain Receiving Bldg w/rail spur
12/8/2011 73

Rail Spur
12/8/2011 74

Receiving Building – Corn in, Distillers Grains - Out
12/8/2011 75

Tank Farm- #1-Denaturant Process Tank; #2- 200 Proof Tank ; #3- 190 Proof Tank; #4&5 Finished Ethanol Tanks in the background. The conveyor system is in the foreground.
12/8/2011 76
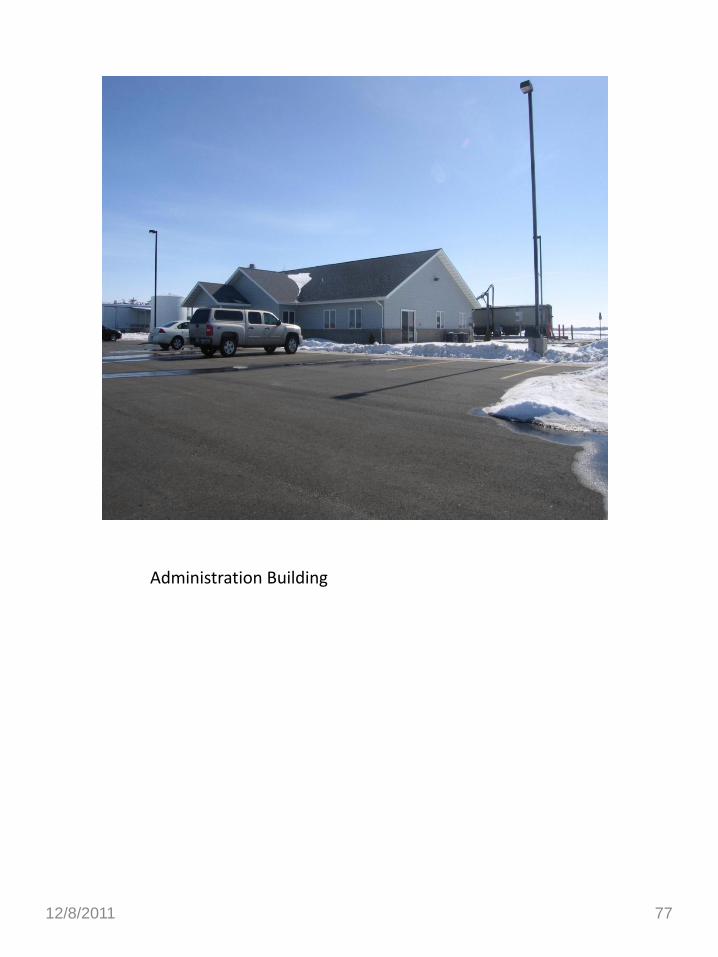
Administration Building
12/8/2011 77

12/8/2011 78
12/8/2011 79

12/8/2011 80

12/8/2011 81

12/8/2011 82

12/8/2011 83

12/8/2011 84

12/8/2011 85

12/8/2011 86

12/8/2011 87

Contributors to Economic Obsolescence
• 1. Changes in the availability and price of corn and natural gas
• 2. Volatile commodity and financial markets
• 3. Changes in environmental regulations
• 4. Lack of transportation, storage and blending infrastructure
• 5. Changes in Federal/State laws or policies/tax incentives
• 6. Changes in ethanol production technology
12/8/2011 88

External Obsolescence by Market Extraction
• Total Cost $2.00 100%
• Sale Price $1.00 50%
• Total Deprec. $1.00 50%
• Physical $0.20 10%
• Allocation to
• External $0.80 40%
• *Sale Price should exclude land value
12/8/2011 89

12/8/2011 90

Cost Approach Value
• $0.33 per gallon
12/8/2011 91

12/8/2011 92
Income Approach
• Agri-business appraisers typically include an Income Approach to value when appraising a Industrial process facility such as an ethanol plant.
• A minimum of 3, with preferably 5 years of historical financial data is required.
• Short-comings of applying an operational income approach are due to the recent construction and volatility in the grain/ethanol commodity market.
• High corn prices are eating up profit margins placing financial strain on many plants.
12/8/2011 93

Ethanol Plant Sales
12/8/2011 94

Market Value Indicators by importance
• 1. Certificate of Real Estate Value (Real Property)
• 2. Certificate of Real Estate Value (Sale of a Business) – how the portion of the sale allocated to R.E. was
determined
– was the allocation appraisal based
– who did the appraisal and what was the basis for the appraisal.
– Note: Use of allocations as evidence of market value is on a case-by-case basis.
12/8/2011 95

Ethanol Plant Sales
12/8/2011 96

Sales Approach
• Sale 1 $1.00
• Sale 2 $0.92
• Sale 3 $0.92
• Sale 4 $1.07
• Sale 5 $0.94
• Sale 6 $0.94
• Total $5.79 / 6 = $.965
• Median Sale Price $0.94
• $0.94 x 34% = $0.32 per gallon
12/8/2011 97

12/8/2011 98
Value Per Gallon from Approaches
• Cost $0.33
• Sales $0.32
12/8/2011 99

Reconciliation
• Explain the strengths and weaknesses of each approach to value, recognizing that MN Courts have relied principally on the Cost Approach to Value Special Purpose Properties, and that the cost approach is an imprecise measure which tends to inflate the value of a property because of the difficulty in determining total accrued depreciation. At the same time, the sales and income approaches tend to artificially lower the assessment. Fed.Reserve, 313 N.W.2d at 623. 12/8/2011 100

12/8/2011 101