ethanol. conversion of sugars to etoh the manufacture of alcoholic beverages originated over 5000...
Post on 21-Dec-2015
216 views
TRANSCRIPT

Ethanol

Ethanol
• Conversion of sugars to ETOH
• The manufacture of alcoholic beverages originated over 5000 years ago– Water was generally impure and thus fermented
juices provided a level of protection from spoilage by their high alcohol content
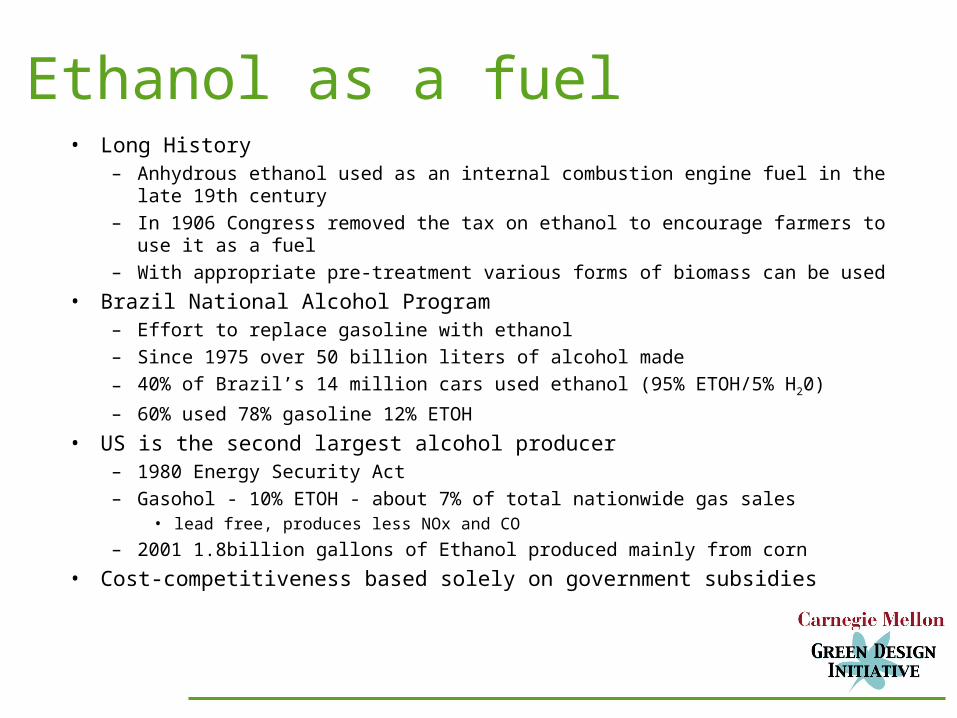
Ethanol as a fuel• Long History
– Anhydrous ethanol used as an internal combustion engine fuel in the late 19th century
– In 1906 Congress removed the tax on ethanol to encourage farmers to use it as a fuel
– With appropriate pre-treatment various forms of biomass can be used
• Brazil National Alcohol Program– Effort to replace gasoline with ethanol
– Since 1975 over 50 billion liters of alcohol made
– 40% of Brazil’s 14 million cars used ethanol (95% ETOH/5% H20)
– 60% used 78% gasoline 12% ETOH
• US is the second largest alcohol producer– 1980 Energy Security Act
– Gasohol - 10% ETOH - about 7% of total nationwide gas sales• lead free, produces less NOx and CO
– 2001 1.8billion gallons of Ethanol produced mainly from corn
• Cost-competitiveness based solely on government subsidies

Ethanol fuel properties in relation to fuel performance
Energy density
Heat of vaporization
Lower flame temperature
Relative volume ofcombustion products
Octane Number
0.65-0.69
2.3
0.976
1.07
1.15
Lower mpgLarger tank
More air to cylinderIncreased powerDecreased cooling needs
Higher efficiencyin optimized engine
Increases work from gas expansion
Allows increased compression ratio and hence higherPower and efficiency
PropertyEthanol/Gasoline
ValueImpact
From Lynd 1996;Bailey 1996

Reasons to use Ethanol• Energy security• Ethanol offers substantial environmental
benefits. – Ethanol makes gasoline burn cleaner. – Ethanol reduces greenhouse gas emissions.
• Ethanol is made from abundant renewable resources.
• Ethanol is good for farmers and rural economy.

Corn Milling Liquefaction Saccharification Fermentation
Distillation Dehydration
Centrifugation
Evaporation
Dry FeedMixing Drying Cooling
Corn
-Amylase Gluco-amylase Yeast
Fuel GradeEthanol
Denaturant
Distillers Dried Grains w/ soluble
Dry Milling Simplified Process

QuickTime™ and aPhoto - JPEG decompressor
are needed to see this picture.

Poplars

Poplar Plantation

Poplar Cutting

Switchgrass Stand

Switchgrass

Switchgrass Bale

Size ReductionDilute AcidPretreatment
Liquid Solid Separation
DetoxificationVia
Ion Exchange
Enzyme Production SSCF Fermentation
SeparationSolids ProcessingCogen
Biomass
Fuel GradeEthanol
Simplified Bioethanol Process

Current Ethanol Costs
Net Feedstock Costs
Other Operating Costs
Total Production Costs
Annualized Capital Costs
Selling Price
0.54
0.42
0.96
0.26
1.22
0.48
0.46
0.94
0.22
1.16
$/gal
Dry Mill Wet Mill
0.37
0.25
0.62
0.54
1.16
Cellulosic(estimate)

Effect of Biomass Cost on Ethanol Production Cost

Natural Vegetation and Ag/Urban Waste
From Lynd (1996)
Mixed paperPackingUrban woodYard wasteAgricultural residuesForest residuesWood processing residues
Total
2614
411
12093
187
Waste category Availability
(million dry tons)

Waste Ag Cellulosics
• Corn stover is available in the highest amounts - 100 to 200 million tons per year.
• Bagasse could contribute another 700,000 tons.
• If all of the corn stocks and bagasse were collected, about 6.5 billion gallons of ethanol could be produced annually.
• Only 30 to 60% of the total stover and bagasse could be collected, reducing the potential ethanol to 2 to 4 billion gallons annually.

Sugarcane, Corn, Switchgrass Comparison
Crop Yield (tons/acre)Fermentation Sugar (tons/acre)Ethanol from 1° sugars (gallons/acre)Harvested Cellulosics (tons/acre)Ethanol from Cellulosics (gallons/acre)
Total Ethanol (gallons/acre)
Cane
293.4
54726
1741
2288
Corn
92.5
3222
125
447
Switchgrass
8n/an/a7.2
490
490

Variability of the literature calculations
AcresLand Need
EthanolRequired
EthanolYield
BiomassYield
AcresGallons Ethanol
1( ) Tons Biomass
Acre
( )Tons Biomass
Gal Ethanol( )

Hohenstein&
Wright
Rainey&
Mann
Wright et al.
Cook &Beyea
Downing et al.
Switchgrass
GeneralSRWC
HEC
Energy cane
Hybrid Poplars
Natural Forests
LowHigh
LowHighLowHighLowHighLowHighLowHigh
2 (4)6 (14)
5 (12)14 (32)4 (10)8 (17)
5(12)
9 (20)16 (35)16 (35)
4 (9)10 (22)
2 (4)11 (25)5 (12)
21 (48)
1 (2)2 (4)
4 (10)7 (15)7 (15)9 (20)
5 (11)10 (22)
Plant Type
Source
tons/acre (metric tons/hectare)
Biomass Yields from Literature

Gross Calculation
• 195 billion gallons of ethanol needed
• Using Switchgrass
• 195 to 600 million acres of land

Land Use in the Contiguous 48 States
Use Acreage(Million Acres)
Proportion ofTotal Area
(%)
Grassland Pasture& Range
ForestCroplandSpecial UseOther Use
589
55946019492
31
302410
5

Environmental Impact• Food vs. energy
• Land use competition
• Soil quality
• Water quality
• Chemical inputs
• Biodiversity– monoculture
– suitability for wildlife habitat
– landscape effects
– stability

Greenhouse gas emissions reduction
• Burning fossil fuels converts “old biomass” into new CO2” - this then contributes to the greenhouse effect
• Burning “new biomass” contributes no net CO2 if we replant the harvested biomass or burn biomass specifically grown for energy generation (energy crops)

Greenhouse gas emissions (Corn)Shaporri/IPCC Robertson Wagner-Riddle
N2O emissions(lbs C/gal of gasoline equivalent) 3.1 2.3 2.4CO2 emissions from ethanol fuel cycle(lbs C/gal of gasoline equivalent) 8.3 7.4 7.6Total Ethanol Emissions to GasolineEmissions 1.19 1.08 1.09Total Ethanol Emissions to GasolineEmissions with Co-product Credits 1.16 1.06 1.08

Greenhouse gas emissions (Biomass)
Corn(Shap/IPCC)
Switchgrass(Robertson)
SWRC(Robertson)
Nitrogen Use (CO2 Equivalent)(lbs/C/acre) 681 227 40
N2O emissions(lbs C/gal of gasoline equivalent) 3.1 1.6 0.28
CO2 emissions from ethanol fuel cycle(lbs C/gal of gasoline equivalent) 8.3 1.7 1.7
Ratio of Total Ethanol Emissions to GasolineEmissions 1.19 0.48 0.29
Ratio of Total Ethanol Emissions to GasolineEmissions with Co-product Credits 1.16 NA NA

Gasoline requirements per region (% of Total - 1.2 billion gallons)
27%
16%14%15% 8%
5%
3%
12%
5%
> 5 to 10%
> 10 to 20%
> 20%Do to rounding values may not equal 100%

0
50
100
150
200
250
300
350
US Region
2000 Ethanol Requirements
2010 Ethanol Requirements
Production Capacity

Pipeline Infrastructure

80
90
100
110
120
130
140
150
160
170
2000 2005 2010 2015 2020 2025
Year
Fuel Amount (billion gallons)
2012 Kyoto
Project Consumption
Permitted Consumption
Fuel Consumption

0
20
40
60
80
100
120
140
160
180
2000 2005 2010 2015 2020 2025
Year
Fuel Amount (billion gallons)
Baseline Consumption
Gasoline Use
Ethanol Production
Ethanol Production

0
20
40
60
80
100
120
140
160
180
2000 2005 2010 2015 2020 2025
Year
Fuel Volume (billion gallons)
Baseline Consumption
E0 E10
E85
Fuel Mix