estimation of grain nutrient and their association …plantarchives.org/pdf 17-1/241-246...
TRANSCRIPT
ESTIMATION OF GRAIN NUTRIENT AND THEIR ASSOCIATION WITHGRAIN YIELD IN FINGER MILLET [ELEUSINE CORACANA (L.)GAERTN]
R. Das*, S. R. Pandravada1 and P. J. HarikrishnanCollege of Agriculture, Vellayani, Kerala Agricultural University, Thrissur - 695 522, India.
1National Bureau of Plant Genetic Resources, Regional Station, Hyderabad - 30, India.
AbstractThe low protein content in finger millet grain is a matter for concern. So to identify genotypes having high protein and calciumcontent as well as their association with yield, present experiment was conducted with 48 genotypes of finger millet with 3replication at NBPGR, regional station Hyderabad. White seeded genotype (SNVD-11-88) had higher protein contents (9.33mg/100g grain), while among brown seeded types genotype SNVD-11-15 had the highest protein content (9.23mg/100ggrain). Calcium content of the genotypes ranged from 188.66mg/100 g of grain (CMLS-01-336-SEL-11) to 324.33 mg/100 g ofgrain (SNVD-11-15) with an average value of 235.34 mg/100g.The genotypic coefficients of variability were moderate andhigh for protein (16.4) and calcium (31.21), respectively. Protein content, calcium content and grain yield have shown highheritability viz.,99.47, 97.74,75 respectibly. Genetic advance as percentage of mean was also high for these three characteristics,protein 34.5, calcium 46.44, grain yield/plot39.65. High heritability coupled with high genetic advance indicated their governanceby additive gene action. A negative significant correlation was observed between protein content and grain yield (-0.4596)and correlation between calcium content and grain yield is not significant (0.0169). Protein content had significant positiveassociation with calcium content (0.2597). Genotypes having higher protein and calcium content can be used in furtherbreeding programme for the purpose of bio-fortification.Key words : Finger millet, grain colors, protein, calcium, correlation, biofortification.
IntroductionFinger millet [Eleusine coracana (L.) Gaertn] also
known as birds foot millet, ragi or African millet is anannual plant widely grown as an important food crop inthe arid areas of Africa and South Asia. It ranks third inimportance among the millets after sorghum and pearlmillet in India. It is a hardy crop that can be grown indiverse environments from almost at sea level in southIndia to high lands of Himalayas (altitudes of 1850 to2300 meters) and from poor soils on hill slopes to richsoils in the Indo-gangetic plains. The crop provides foodgrain as well as straw, which is valued animal feedespecially in rainfed areas. In India, it is very popularlyknown as ragi and is grown in an area of 2 million hectareswith a production of 2.6 million tonnes. Finger milletprovides staple food for a large section of farmingcommunity and economically weaker sections in many
parts of India. Important finger millet growing states areKarnataka, Tamil Nadu, Andhra Pradesh, Maharastra,Orissa, Jharkhand, Chattishgarh and Uttarakhand.
Finger millet grain is nearly globular in shape and isvery small in size (1.0 to 1.5 mm in diameter). Brown isthe predominant grain colour in finger millet although afew varieties have white seeds (Vadivoo et al., 1998).The nutritional quality of finger millet grain makes it anideal food for infants and invalids. Among brown andwhite grain types, the latter are preferred because theycontain higher protein, lower fiber and lower tannins.However, yield potential of the white grained types isgenerally lower than the browns. Finger millet is also avery rich source of calcium.
The basic information on the existence of geneticvariability and diversity in a population and the relationshipbetween different traits is essential for any successful
Plant Archives Vol. 17 No. 1, 2017 pp. 241-246 ISSN 0972-5210
*Author for correspondence : P.G Hostel, Room No-20, College of Agriculture, Vellayani, Trivandrum - 695 522, India.E mail : [email protected]

242 R. Das et al.
plant breeding program (Sripichitt et al., 2007). Suchgenetic studies on protein and calcium contents alongwith yield and yield related characteristics will be usefulin the development of high yielding finger millet varieties(Upadhyaya et al., 2011) with high protein and calciumcontents. Hence, the present study of 28 finger milletgenotypes having varying seed coat colors and nodalpigmentation was undertaken to determine the geneticvariability for the above two nutrients and their relationshipwith yield, nodal pigmentation and grain color.
Materials and MethodsThe present investigation was undertaken at the
National Bureau of Plant Genetic Resources,Rajendranagar, Hyderabad. The experimental materialcomprised of 48 germplasm lines of finger millet. Theselines were collected from different parts of India andraised in a randomized block design with three replicationsat NBPGR research farm at Rajendranagar Hyderabad.
Five random plants in each replication for eachgenotype were tagged for making observations and themean of five plants was used for statistical analyses.Observations were recorded on lodging, stay-greenness,nodal pigmentation, grain colour, grain protein contentgrain calcium content and grain yield/plot. For theestimation of protein and calcium, grains from threerandom sample from each replication were selected. Forthe estimation of grain protein content, the micro-Kjeldahlmethod of Humphries (Humphries, 1956) was used andthe calcium content was estimated by using the versenatetitration procedure of Jackson 1956 using a triple acidextract solution and expressed in mg per 100 g of grainon a moisture free basis. Phenotypic and genotypiccoefficients of variability (PCV and GCV) weredetermined. Broad sense heritability was computed usingthe method suggested by Hanson et al. (1956) andGenetic advance (GA), as a percentage of the mean,was computed using the method of Johnson (1955).Genotypic correlations also were determined.
For characters lodging (fig. 1), staygreen colour, nodalpigmentation (fig. 2) and grain colour have given code todescribe their form of appearance which are presentedin table 1. Nodal pigmentation is given code no. (0 absent/1 present), degree of lodging is given code no. (3 high/5intermediate/7 low), stay green colour is given code no.(0 absent/1 present) and grain colour is given code no. (1white/2 light brown/3 copper brown/4 purple brown).Scoring was done on the basis of coding.
ResultsAnalysis of variance for the experiment involving a
set of 48 finger millet genotypes for protein content,
calcium content and grain yield per plot (g), revealed thatthe variance were significant for all the charactersindicating greater diversity among the 48 finger milletgenotypes studied. The range of protein content was from5.96 g (SRYA-333-SEL-1) to 9.33 g (SNVD-11-88) per100 g of grain. Twenty two genotypes possessedsignificantly higher protein content than the general meanof 7.50 g per 100 g of grain.
The brown seeded genotype (SNVD-11-88) hadhigher protein contents than the general mean. The copperbrown seeded genotypes PSR-10095-SEL-1,SRYA-333-SEL-1, SRS-13436, AR-2, AR-3, AR-5, SNVD-11-89,SNVD-11-38 and the purple brown seeded genotypeSRS-13435, SRS-13433, SRS-13426, CMLS-01-336-SEL-03 had low protein contents (lower than the meanvalue) (table 2). Highest yield per plant was observedfor the genotype NSS-7928-SEL-1 and was showingpresence of nodal pigmentation and lowest yield for thegenotypes PR-202 showing absence of nodalpigmentation. Different degree of lodging andstaygreenness has been recorded in these germplasm.
The appearance of the characters degree of lodging,staygreen colour, nodal pigmentation and grain colour isshown in frequency, reveals that there is a huge variationin the appearance of these characters, which arepresented in table 1. In case of nodal pigmentationgenotypes without nodal pigmentation is more with66.66% frequency and genotypes with pigment is lesswith 33.33%. Genotypes with higher susceptibility tolodging recorded higher in number among 48 genotypeswith 66.66% frequency, genotypes with intermediatelodging having less genotypes than susceptible one with27.08% frequency. Genotypes with green colour atmaturity is less in no. with 33.33% frequency andgenotypes without green colour at maturity recorded66.66%. Genotypes having grain colour light brownoccurred with 45.83% frequency, copper brown with45.75% frequency and purple brown with 10.41%frequency. The results are conformity with Sripichitt etal. (2007).
Calcium content of the genotypes ranged from188.66mg/100 g of grain (CMLS-01-336-SEL-11) to324.33 mg/100 g of grain (SNVD-11-15) with an averagevalue of 235.34. Eighteen genotypes possessedsignificantly higher calcium content than the general meanof 235.34 mg/100 g of grain (table 2).
The genotype NSS-7928-SEL-1 gave the highestgrain yield of 1591 g per plot followed by NSS-7928-SEL-2 (1518g). The lowest value was noted in PR-202(536 g). Thirteen entries had significantly higher grain

Estimation of Grain Nutrient and their Association with Grain Yield in Finger Millet 243
yield than the general mean of 1010 g per plot. Thegenotype SNVD-11-88, which had the highest proteincontent, had 903 g of grain yield per plot. The grain yieldof SNVD-11-15, which had the highest calcium content,was 598 g /plot. The grain yield of the genotype with thelowest protein content (SRYA-333-SEL-1) was 1085 gper plot and that of the low calcium containing type,CMLS-01-336-SEL-11, was 817 g per plot.
The knowledge of genetic variability present in a givencrop species for the character under improvement is ofparamount importance for the success of any plantbreeding programme. Information on coefficient ofvariation is useful in measuring the range of variabilitypresent in the characters. Heritability and genetic advance
are important selection parameters. Genotypic coefficientof variation (GCV) along with heritable estimates wouldprovide a better picture of the amount of genetic advanceto be expected by phenotypic selection (Burton andDevane, 2002). It is suggested that genetic gain shouldbe considered in conjunction with heritability estimates(Johnson, 1955). Heritability estimates along with geneticadvance are normally more helpful in predicting the gainunder selection than heritability estimates alone.
GCV for calcium content (31.62) and grain yield(25.41) was high, while for protein content it wasmoderate (16.4). PCV for calcium and yield is also high,where as for protein content it was moderate. Regardingheritability estimates, the genotypes of the presentinvestigation had high values for all the above threecharacteristics, 99.47, 97.74,75 for protein content,calcium content and grain yield/plot respectably. Geneticadvance as percentage of mean was also high for thesethree characteristics, protein 34.5, calcium 46.44, grainyield/plot 39.65 (table 3).
The protein content had a significant and positivegenotypic correlation with calcium content (0.2597) andnegative and significant genotypic correlation with grainyield (-0.4596). The genotypic correlation of calciumcontent with grain yield was not significant (0.0169).
DiscussionFinger millet is an excellent source of calcium (seven
times more than rice) and protein. Among cereals, itpossesses a reasonably high level of methionine, the majorlimiting amino acid of tropical regions, and the componentleast correctable by the addition of pulses to the diet.The low protein content in finger millet grain is a matter
Fig. 1 : Lodging of finger millet plants in field.
Fig. 2 : Plant with nodal pigment and plant without nodalpigment.

244 R. Das et al.
for concern.Qualitative characters are useful criteria for
characterization of germplasm accessions, as they showhigh heritability and stable expression. Further, ifqualitative characters show association with yieldcomponents, it can serve as a marker in selection process.The variability for four qualitative characters viz., nodalpigmentation, degree of lodging at maturity, staygreennessand grain colour present in national collection of fingermillet accession are discussed here. Hence, in thisinvestigation, 48 genotypes with different degree oflodging,staygreenness, seed coat colors, nodalpigmentation were evaluated for protein and calciumcontents and grain yield.
Present investigation showed significant differencebetween the genotypes for protein content and calciumcontent of grain ranged from 5.96mg/100 g grain (SRYA-333-SEL-1) to 9.33mg/100 g grain (SNVD-11-88).Upadhyaya et al, Sonnad and Vadivoo et al. noted widedifferences in protein content. The protein content ofwhite seeded types have been found to be higher whencompared to that of brown seeded types, but variation inprotein content is maximum in brown seeded types.Similar result has been reported by (Vadivoo et al., 1998;Parida et al., 1989). It has been clear from the result thatmost of the lines having high yield showed presence ofnodal pigmentation although lines which is having lowyield also showed presence of pigmentation. It has beenrecorded that in maximum cases the genotypes havingintermediate lodging and lack of senescence countedhigher yielding. The result is conformity with severalauthours (Shigeta, 1985; Sripichitt et al., 2007; Vadivooet al., 1998).
The estimates of heritability act as predictiveinstrument in expressing the reliability of phenotypic value.Therefore, high heritability helps in effective selectionfor a particular character. Heritability in broad sense isthe ratio of genotypic variance to the phenotypic varianceand is expressed in percentage. In the present study allquantitative characters show high heritability (broadsense). High heritability for quantitative charactersindicates the scope of genetic improvement of thesecharacters through selection.
Moderate GCV estimates obtained for protein contentindicated fairly large extent of genetic variation for thischaracteristic. High heritability coupled with high geneticadvance as a percentage of the mean observed for thischaracteristic. In the present investigation, high heritabilitycoupled with high genetic advance as per cent of meanwas observed for three character protein content, calciumcontent and grain yield per plot. Thus, these traits arepredominantly under the control of additive gene actionand hence these characters can be improved by selection.The results are conformity with Vadivoo et al. (1998).
A negative significant correlation was observedbetween protein content and grain yield in thisinvestigation, indicating an increase in protein content dueto the decrease in grain yield. Similar results wereobtained by Vadivoo et al. (1998), Dineshkumar (1987).No significant correlation has been found between graincalcium content and grain yield. This was conformity withthe findings of Bothikar et al. (2014). Protein contentwas significantly and positively correlated with calciumcontent. Similar results were reported by Bothikar et al.(2014), Sripichitt et al. (2007).
To conclude, in the present study white seeded fingermillet genotypes had higher protein contents, while brown
Table 1 : Code no of four qualitative characters and Frequency at which qualitative characters occurs.
Character Code no. Description Percentage frequencies of each character
0 Absent 66.66Nodal pigmentation
1 Present 33.33
3 High 66.66
Degree of lodging at maturity 5 Intermediate 27.08
7 Low 6.25
0 Absent 66.66Staygreen colour
1 Present 33.33
1 White 2.02
2 Light brown 45.83Grain colour
3 Copper brown 45.75
4 Purple brown 6.4

Table 2 :Degree of lodging, stay green colour, nodal pigmentation, grain colour and yield performance of 48 germplasm lines forprotein and calcium.
S. Genotype Degree of Stay green Nodal Grain colour Protein Calcium Grainno. lodging at colour pigmentation (1 white/2 content content yield/
maturity (0 absent/ (0 absent/ light brown/ Mg/100 g Mg/100 plot(g)(3 high/5 1 present) 1 present) 3 copper grain g grain
intermediate brown/4/7 low) purple brown
1 SNVD-11-5 3 0 1 2 8.4 219 1270.662 SNVD-11-15 3 0 1 2 9.23 324.33 598.333 snvd-11-28 3 0 0 2 8.1 228 789.334 SNVD-11-38 3 0 0 3 7.28 232 696.665 SNVD-11-41 7 1 0 2 7.4 258 8746 SNVD-11-54 5 1 0 3 7.7 222 9967 SNVD-11-72 7 0 1 2 8.1 238 1140.338 SNVD-11-77 3 0 0 2 7.98 238.33 11699 GPU-67 3 0 0 3 7 219 125810 SNVD-11-88 3 1 1 2 9.33 301 90311 SNVD-11-89 5 1 1 3 7.23 225 847.6612 SNVD-11-99 3 0 1 3 7.9 255 790.3313 SNVD-11-112 3 0 0 3 7.7 189.33 119314 PR-202 5 0 0 3 7.1 192 536.3315 AR-1 3 0 0 3 7.8 231 125116 SNVD-11-118 5 0 1 2 7.75 198.66 1162.6617 AR-2 3 0 0 3 6.84 199.33 829.3318 AR-3 5 1 0 3 7.1 201 109919 SRS-13466 3 0 1 2 8.22 288 101320 AR-4 3 0 1 3 7.8 205 88921 AR-5 7 1 1 3 7.44 217.66 88922 BAR-174 5 1 1 2 8.42 286.33 1269.3323 CMLS-01-336-SEL-01 3 0 0 3 6.83 220.33 1183.6624 CMLS-01-336-SEL-03 5 1 1 4 7.1 222.33 1225.3325 CMLS-01-336-SEL-06 3 1 0 3 7 204.66 832.6626 CMLS-01-336-SEL-07 3 1 0 2 6.85 199 86727 CMLS-01-336-SEL-08 3 0 1 2 7.55 201.66 88628 CMLS-01-336-SEL-09 3 0 0 1 8.73 255.33 73429 Gpu-45 3 0 1 2 7.64 194.33 1100.3330 CMLS-01-336-SEL-11 5 0 0 2 7.74 188.66 817.6631 CMLS-01-336-SEL-12 3 0 0 3 7.71 198 104832 NSS-7928-SEL-1 5 1 0 3 6.71 213.66 1591.6633 NSS-7928-SEL-2 5 1 0 2 6.55 239 1518.6634 NSS-7928-SEL-3 3 0 0 2 7.11 222 1108.6635 NSS-7928-SEL-4 3 0 0 2 7 238 1023.6636 PSR-10095-SEL-1 3 1 1 3 6.57 240 1103.3337 PSR-10121 5 1 0 2 6.64 280 657.3338 SRYA-333-SEL-1 3 0 0 3 5.96 266 1085
Table 2 continued...
Estimation of Grain Nutrient and their Association with Grain Yield in Finger Millet 245
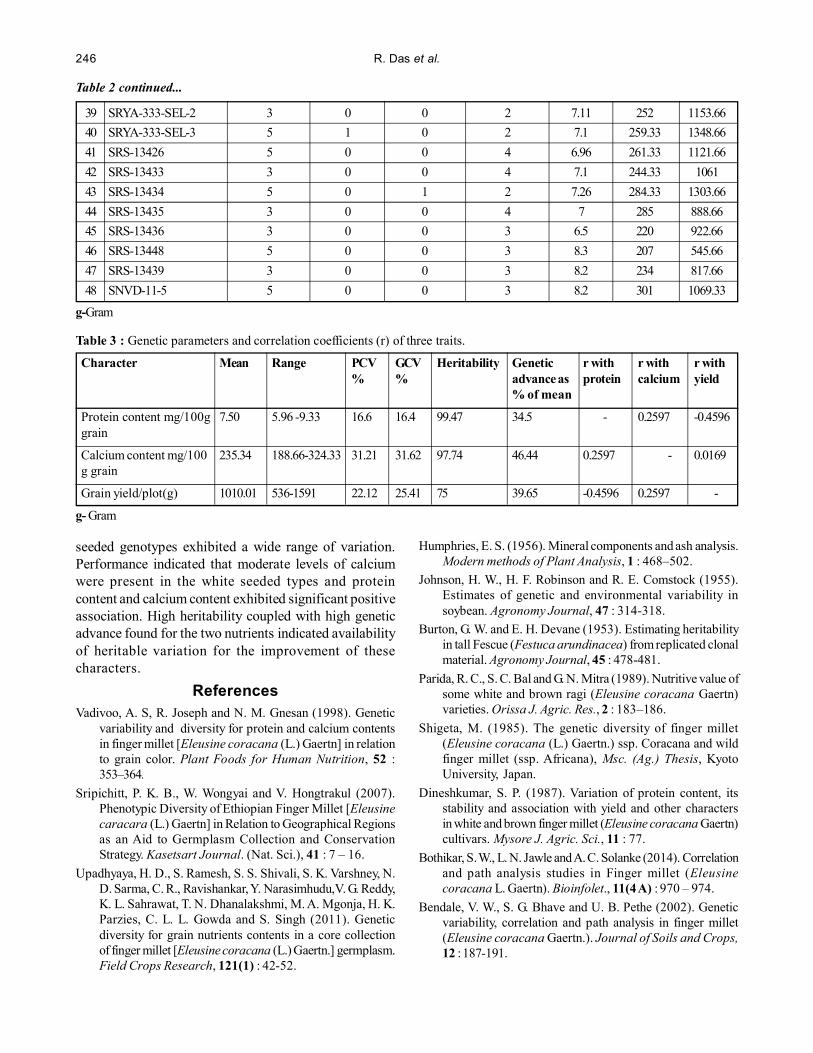
39 SRYA-333-SEL-2 3 0 0 2 7.11 252 1153.6640 SRYA-333-SEL-3 5 1 0 2 7.1 259.33 1348.6641 SRS-13426 5 0 0 4 6.96 261.33 1121.6642 SRS-13433 3 0 0 4 7.1 244.33 106143 SRS-13434 5 0 1 2 7.26 284.33 1303.6644 SRS-13435 3 0 0 4 7 285 888.6645 SRS-13436 3 0 0 3 6.5 220 922.6646 SRS-13448 5 0 0 3 8.3 207 545.6647 SRS-13439 3 0 0 3 8.2 234 817.6648 SNVD-11-5 5 0 0 3 8.2 301 1069.33
g-Gram
Table 2 continued...
Table 3 : Genetic parameters and correlation coefficients (r) of three traits.
Character Mean Range PCV GCV Heritability Genetic r with r with r with% % advance as protein calcium yield
% of mean
Protein content mg/100g 7.50 5.96 -9.33 16.6 16.4 99.47 34.5 - 0.2597 -0.4596grain
Calcium content mg/100 235.34 188.66-324.33 31.21 31.62 97.74 46.44 0.2597 - 0.0169g grain
Grain yield/plot(g) 1010.01 536-1591 22.12 25.41 75 39.65 -0.4596 0.2597 -
g- Gram
seeded genotypes exhibited a wide range of variation.Performance indicated that moderate levels of calciumwere present in the white seeded types and proteincontent and calcium content exhibited significant positiveassociation. High heritability coupled with high geneticadvance found for the two nutrients indicated availabilityof heritable variation for the improvement of thesecharacters.
ReferencesVadivoo, A. S, R. Joseph and N. M. Gnesan (1998). Genetic
variability and diversity for protein and calcium contentsin finger millet [Eleusine coracana (L.) Gaertn] in relationto grain color. Plant Foods for Human Nutrition, 52 :353–364.
Sripichitt, P. K. B., W. Wongyai and V. Hongtrakul (2007).Phenotypic Diversity of Ethiopian Finger Millet [Eleusinecaracara (L.) Gaertn] in Relation to Geographical Regionsas an Aid to Germplasm Collection and ConservationStrategy. Kasetsart Journal. (Nat. Sci.), 41 : 7 – 16.
Upadhyaya, H. D., S. Ramesh, S. S. Shivali, S. K. Varshney, N.D. Sarma, C. R., Ravishankar, Y. Narasimhudu,V. G. Reddy,K. L. Sahrawat, T. N. Dhanalakshmi, M. A. Mgonja, H. K.Parzies, C. L. L. Gowda and S. Singh (2011). Geneticdiversity for grain nutrients contents in a core collectionof finger millet [Eleusine coracana (L.) Gaertn.] germplasm.Field Crops Research, 121(1) : 42-52.
Humphries, E. S. (1956). Mineral components and ash analysis.Modern methods of Plant Analysis, 1 : 468–502.
Johnson, H. W., H. F. Robinson and R. E. Comstock (1955).Estimates of genetic and environmental variability insoybean. Agronomy Journal, 47 : 314-318.
Burton, G. W. and E. H. Devane (1953). Estimating heritabilityin tall Fescue (Festuca arundinacea) from replicated clonalmaterial. Agronomy Journal, 45 : 478-481.
Parida, R. C., S. C. Bal and G. N. Mitra (1989). Nutritive value ofsome white and brown ragi (Eleusine coracana Gaertn)varieties. Orissa J. Agric. Res., 2 : 183–186.
Shigeta, M. (1985). The genetic diversity of finger millet(Eleusine coracana (L.) Gaertn.) ssp. Coracana and wildfinger millet (ssp. Africana), Msc. (Ag.) Thesis, KyotoUniversity, Japan.
Dineshkumar, S. P. (1987). Variation of protein content, itsstability and association with yield and other charactersin white and brown finger millet (Eleusine coracana Gaertn)cultivars. Mysore J. Agric. Sci., 11 : 77.
Bothikar, S. W., L. N. Jawle and A. C. Solanke (2014). Correlationand path analysis studies in Finger millet (Eleusinecoracana L. Gaertn). Bioinfolet., 11(4 A) : 970 – 974.
Bendale, V. W., S. G. Bhave and U. B. Pethe (2002). Geneticvariability, correlation and path analysis in finger millet(Eleusine coracana Gaertn.). Journal of Soils and Crops,12 : 187-191.
246 R. Das et al.