estimation of errors in calculated liquid rocket injector
TRANSCRIPT

Trans. JSASS Aerospace Tech. Japan
Vol. 16, No. 5, pp.335 - 344, 2018
DOI: 10.2322/tastj.16.335
Estimation of Errors in Calculated Liquid Rocket Injector Performance Usinga Miniature Cryogenic Test Stand
By Brunno B. VASQUES1) and Oskar J. HAIDN1)
1)Institute of Space Propulsion, Technical University of Munich, Garching b. Munchen, Germany
(Received June 22nd, 2017)
Liquid oxygen and liquid methane rocket engines are leading candidates for a variety of space missions, including the critical role
of main descent propulsion of planetary landing spacecraft. Particular mission characteristics in this context may dictate the use of
propulsion systems with deep-throttling capability and able to deliver good performance over the entire thrust range. A well-known in-
jector type with favourable combustion stability, heat transfer and performance characteristics is the pintle injector. This atomizer has
been tested with a variety of propellants, such as monomethyl hydrazine/nitrogen tetroxide, fluorine/methane and oxygen/hydrogen.
However, characterization employing liquid oxygen and liquid methane is relatively scarce. In order to obtain relevant parametric
performance data at nominal and off-nominal conditions, a miniature cryogenic test stand operating with LO2/LCH4 propellants was
designed and built. Presented here are the results of a systematic study to determine the uncertainty of measured and calculated pa-
rameters defining pintle injector performance. The approach used for the measurement of relevant quantities such as thrust, propellant
flow rates, temperature and pressures is discussed and a description of the methodology used in the error analysis is given. Final values
of uncertainty in characteristic velocity efficiency are presented for different pintle injector configurations.
Key Words: Cryogenic Test Stand, Oxygen/Methane Propellants, Pintle Injector, Rocket Performance Estimation.
Nomenclature
A : area, [L2]B : bias error
Cd : discharge coefficient, [-]C∗ : characteristic velocity, [LT−1]CF : thrust coefficient, [-]d : diameter, [L]f : correction factor (pressure), [-]F : force, [MLT−2]h : specific enthalpy, [L2T−2]
Km : global mixture ratio, [-]L∗ : chamber characteristic length, [L]m : mass flow rate, [ML−1]N : number of samplesp : pressure, [ML−1T−2]s : specific entropy, [L2T−2K]S : precision indext : t-Student’s parameterT : temperature, [K]U : uncertaintyV : velocity, [LT−1]X : parameter in a sampleβ : correction factor, [-]∆ : differentialϵ : contraction ratio, [-]η : efficiency, [-]θ : influence coefficientκ : thermodynamic propertyν : degrees of freedomρ : density, [ML−3]ϕ : correction factor, [-]
Subscripts95 : 95th percentile point of t-Student’s
distributiona : ambient
DIS : dischargeDIV : divergence
e : exite f f : effectiveexp : experimental
f : fuelFR : frictionHL : heat lossi : ith parameter or measurement
in j : injectoridealin j : idealized injector
k : chamberKE : chemical kineticsline : propellant lineo : oxidizer or stagnationp : pressure factort : throatT : totalth : venturi throat
theo : theoreticalTR : throat radiusvac : vacuum
1. Introduction
Investigation of liquid rocket engines with variable thrust ca-pability have been pursued since the late 1930s.2) The ability tomodulate the engine thrust has been a necessity in a variety ofmission profiles:
Copyright©2018 by the Japan Society for Aeronautical and Space Sciences and ISTS. All rights reserved.
335

Trans. JSASS Aerospace Tech. Japan Vol. 16, No. 5 (2018)
• During orbit manoeuvres including orientation and stabi-lization;• In space rendezvous and docking;• For hovering and landing on the surface of celestial bodies;• In ballistic missile trajectory control.
Throttling ranges are mission dependent; higher ratios are usedwhen a more precise trajectory control is needed. Ratios bellow4:1 (i.e. 25% of rated thrust level) are usually considered “shal-low throttle”, requiring simpler techniques for propellant reg-ulation. With respect to propellant combination, mission anal-ysis for planetary landing applications has indicated a need forpropulsion systems with high specific impulse and low-toxicity.Liquid oxygen and liquid methane are currently leading can-didates for these applications. Compared to liquid hydrogen,liquid methane provides a higher bulk density in combinationwith liquid oxygen and can be readily stored in space, due to itshigher boiling point. Theoretical peak performance is achievedat a mixture ratio of 3.5 at an expansion area ratio of 400:1.1)
However, before these advantages can be realized in an ac-tual lander propulsion system, two facts must be considered.First, knowledge of the processes involved in the atomizationand mixing of propellants in the combustion chamber through-out the throttling range is necessary to obtain optimum perfor-mance and stability,3).4) Secondly, among all hydrocarbon fu-els, methane possesses the lowest heat capacity as a liquid. Asa result, regenerative cooling can only be effected at pressuresabove the critical pressure (ca. 45.8 [MPa] for methane), whereproblems of boiling heat transfer can be avoided. Therefore, un-less propellant tanks can be built light enough to withstand suchpressure levels, the use of a complex pump-fed propellant deliv-ery system has to be considered. For a lander application, wherereliability and reaction time are of paramount importance, thisdecision must be carefully evaluated. Depending on missionprofile, passively cooled thrust chambers can be envisioned asa feasible alternative to regeneratively cooled chambers. Sincethe injector plays a major role in defining overall propulsionsystem performance, stability and chamber-wall heat transfercharacteristics, the need existed to evaluate the performance ofliquid oxygen and liquid methane propellants in combinationwith injection systems which possess some degree of throttlingpotential. For this purpose, a fully mobile, miniature, cryo-genic test bench was conceived, designed and built. While theconcept privileged flexibility and small size, the referred teststand design incorporates solutions common to large scale testfacilities. In order to assess injector performance with an ade-quate degree of confidence, knowledge of errors in calculatedperformance parameters is fundamental. General literature re-lated to uncertainty analysis are found in Refs. 9) and 10), witha particular application for a gaseous oxygen-gaseous hydro-gen rocket engine provided by Ref. 11). The objective of thepresent study is to establish an uncertainty methodology and toassess the corresponding errors on the values of characteristicvelocity and combustion efficiency obtained from hot-fire testsusing the cryogenic test bench conceived and employing fourdifferent pintle injector configurations.
2. Experimental Apparatus
2.1. Calorimetric combustion chamberFor evaluation of the injector types and screening of potential
design configurations, short-duration firings using an uncooledcombustion chamber and nozzle were performed. The nominaldesign parameters were a throat diameter of 13.5 [mm] and acontraction ratio of 13 with characteristic chamber lengthsL∗
between 1.45 and 2.40 [m]. Such a large contraction ratio wasbased upon a previous conceptual study which indicated thatsufficient surface area must be available for heat pick-up, if a re-generative cooling scheme is envisioned. The nominal mixtureratio of 2.8 is the result of a trade-off between theoretical per-formance and fuel availability to serve as a coolant. Chamberpressures of 0.5 to 1.5 [MPa] were adopted in the early inves-tigations and explore the range typical to pressure-fed thrusterapplications.2.2. Injector selection
The pintle injector was the initial candidate selected becauseof its performance potential and development flexibility, per-mitting a large number of systematic variations in injection pa-rameters within the same basic hardware. This type of atomizeris unique in that a single moving sleeve can control the gapsaccurately to maintain the proper absolute and relative injec-tion stream velocities over the throttling range. For flight-typethrottling propulsion systems, the injector is not required to bea flow mechanism; it can be linked to control valves which as-sume this function, and thus the injector can be adjusted foroptimum combustion efficiency,5).6)
Some key design parameters pertaining pintle injector designinclude:7)
• Injection stream physical size and shape;• Individual stream kinetic energy;• Momentum- and velocity-ratio between interacting
streams;• Spray angles;• Wall compatibility;• Mass flux distribution and injection pattern across chamber
cross-sectional area.
At the outset of the design phase, a goal was established toevolve a configuration which would incorporate maximum flex-ibility as well as economy in fabrication. The final injector de-sign is a building block version with replaceable injection ele-ments, permitting rapid modifications with minimum effort, seeFig. 1.
In this particular design, thrust level variation is achieved inthe single-point firings by adjusting the thickness of spacersdefining fuel flow gap and by replacing oxidizer orifice sizes.2.2.1. Overview of pintle injector design
Hydraulic design of the pintle injector is fundamentally basedupon obtaining a mechanical interlock of the propellants whichforces liquid phase mixing to occur. For the present investi-gation, the oxidizer is employed as the center propellant, be-ing metered and directed radially outward as individual streamsfrom the central pintle. The fuel, therefore, is injected as a hol-low cylindrical sheet which intercepts the oxidizer streams, withpart of the fuel impinging the oxidizer and part of it penetratingbetween the oxidizer orifices. The parameters which showed a
336

Trans. JSASS Aerospace Tech. Japan Vol. 16, No. 5 (2018)
Fig. 1. 3-D view of pintle injector.
dominating influence on injector performance7) are as follows:
1. Ratio of oxidizer-to-fuel injection momentum;2. Ratio of secondary oxidizer flow to primary orifice flow;3. Number, size and shape of central orifices;4. Elemental spacing of central orifices;5. Length between annular flow injection point and point of
impact with the central radial streams;
Variation of these parameters are used to control both per-formance and wall environment. As a part of the design anal-ysis, the effects of geometry, momentum and velocity ratios,impingement angles and pressure drops were then studied. Theresults of these analyses were used to establish all of the injec-tor dimensions. By considering initially the continuity equationand liquid injection at an average temperature of 120 [K] andthe flow area-pressure relationship we obtain:
CdA =
[m
2ρ∆P
]1/2
(1)
whereCd is the average injector discharge coefficient,A is theflow area,m is the propellant mass flow rate and∆P is the pres-sure drop across the element. It is found from Eq. (1) that thepropellant injection area requirements are small for a 500-[N]class thruster. However, the area is a function of the orificepressure drops selected, and this parameter must be controledand matched with the oxidizer pressure drop for mixing per-formance. A simple but effective approach to this control is ob-tained through an examination of the gross dynamics of interac-tion of fuel and oxidizer. The factor involving momentum ratiosis a measure of the inherent propellant energy for atomizationand mixing. From first principles, this ratio is represented as:8)
F f
Fo=
mf Vf
moVo. (2)
It becomes then evident that to assure peak performance canoccur virtually through all throttling range, it is necessary to op-timize the injector hydraulics. The criteria usually establishedfor pintle injectors is applicable in either case of sheet or jetinjectors. This criteria implies that sheet types of one-on-oneelements should perform best for:7)ρoV2
o
ρ f V2f
(do
df
)= 1, (3)
or in terms of mixture ratio:
K2m
ρ f
ρo
(df
do
)3
= 1. (4)
On the basis of the foregoing design approach, it was finallyestablished that the optimum velocity ratio for LO2/LCH4 at thedesign mixture ratio of 2.8 is approximately:
Vo
Vf=
1(mo/mf )
= 0.35. (5)
2.3. Ignition systemIn the present investigation a torch and a resonance igniter
were initially considered. However, for reasons of simplicityand relatively high reliability, a conventional torch igniter run-ning on gaseous oxygen and gaseous methane was designed andemployed throughout the test-firings. Nominal chamber pres-sure was 0.35 [MPa] at a mixture ratio of 2.5. Igniter operatingtimes varied slightly during the tests. An average 0.600 [ms]operating time proved sufficient for the majority of main enginemixture ratios investigated.
3. Cryogenic Test Stand
All hot-firing test activities were conducted at the rocket testfacility of the Faculty of Space Propulsion in Garching, Ger-many. An overall view of the completed cryogenic test stand isshown in Fig. 2. Due to laboratory space limitations, the teststand was conceived as a movable, flexible unit; each propellantfeed-system is mounted on a fold-out table that can be directlyaligned to the injection head connection points. The various teststand systems are discussed in the following sections.
(a) Test stand roll-out. (b) Feed-system preparation.
(c) Typical test setup.
Fig. 2. Overall view of the miniature cryogenic test stand.
337

Trans. JSASS Aerospace Tech. Japan Vol. 16, No. 5 (2018)
3.1. Liquid methane supply systemProduction of liquid methane took place prior to testing and
employed a pressurized liquid nitrogen bath at 0.65 [MPa] tokeep methane temperature within the liquid range. A regulatedsupply of gaseous methane flowed through a stainless steel tub-ing coil built around a cylindrical storage tank immersed in theliquid nitrogen bath. This tank was pressurized to a level of0.2 [MPa] for propellant tranfer operations. The actual out-let temperature of liquid methane was around 120 [K]. A sec-ond, 3-liter ”run tank”, was used for supplying sufficient liq-uid methane for the firing. The LCH4 produced in the liquefierwas made to circulate in the propellant lines and venturi meterthrough a series of isolation and bypass valves, before reach-ing the run tank. A liquid nitrogen refrigerant flow supplied bya 100-liter dewar was maintained throughout the test for cool-down operations. Propellant lines upstream and downstream ofthe instrumentation unit were simply foam insulated. This wasespecially important in order to reduce line stiffness and attenu-ate thrust cell side-loading effects. The line segment containingthe venturi meter was vacuum insulated. Thermal control ofthe methane line proved difficult due to the low mass flows in-volved and the high heat input from ambient. The LN2 refriger-ant flowrate was then adjusted to result in methane temperaturesupstream of the venturi meter as low as 120 [K]. In general, theoverall methane flow system was broken down into a numberof parallel flow circuits, rather than flowing all sections in a sin-gle series arrangement. A bypass of flow (bleed) was providedthat tapped-off the LCH4 propellant supply system. The bypasscontrol valve was automatically sequenced off just prior to theactuation of the main fuel valve. Pressurization of the run tankwas made directly by gaseous methane by switching the corre-sponding pressurizing valve. An electro-pneumatically drivenvalve isolated all the flow system from the engine in the eventof a sequence failure. Gas supply to this valve and to all fuelline purge operations was made with a dedicated gaseous nitro-gen provision.3.2. Liquid oxygen supply system
Liquid oxygen was produced on-site by direct liquefactionof gaseous oxygen flowing through a coil immersed in a liquidnitrogen bath. The coil was made out of stainless steel tubingspun around a 3-liter capacity tank. This tank was completelyimmersed in the liquid nitrogen bath and stored the liquefiedoxygen produced for the firing. It was possible, by selective ac-tuation of isolation valves, to flow LN2 through both the LO2supply system and the line jackets for preliminary system cool-down or temperature control. The liquid oxygen supply sys-tem from the tank to the main valve was a vacuum-insulated,LN2-jacketed line. As in the case of the LCH4 system, a liq-uid nitrogen refrigerant flow was maintained through the jacketpassages in the instrumentation unit and a final run of approxi-mately 30 [cm] line leading to the engine was unjacketed. Thissegment was simply foam-insulated during chilldown. This wasadopted for simplicity and to increase thrust measurement ac-curacy. The LN2 refrigerant flowrate was controlled by varyingthe dewar supply pressure, allowing delivery of liquid oxygento the LO2 venturi meter at temperatures as low as 85 [K]. A by-pass flow system was provided which tapped off the LO2 pro-pellant supply system immediately downstream of the venturi
meter. The bypass control valve maintained a continous flowthrough that portion of the system until just prior to actuationof the engine main oxidizer valves. The bypass valve shut-off
and opening of the oxidizer main valve were controlled by thesequencer. A dedicated gaseous nitrogen system was used forall line purges. The oxidizer tank pressurization was providedby the gaseous oxygen entering the liquefier, through actuationof pressurizing valves.3.3. Igniter supply system
Regulated supplies of GO2 and GCH4 ran through stainlesssteel tubing mounted along each folding table and connectedvia flexible hoses to the respective igniter valves. Correct ig-niter mixture ratio was achieved by metering both flows throughsonic orifices mounted downstream of each valve. Spark energywas provided by a 10-kV electric spark coil generator. A reg-ulated supply of GN2 was used for igniter purge and cleaningprocedures during checkout operations.3.4. Chamber installation details
Details of the chamber installation may be seen in Fig. 3. Thethrust absorbing structure was a frame made of 10-[mm] thicksteel plates welded together. This structure provided enoughseismic mass and damping. Two steel flexures, located 90 de-grees apart, were used to permit axial motion of the engine,while supporting the weight of the hardware and absorbing sideloads. The engine was bolted to a thrust mount that threadedinto the body of the load cell. This mount had a conical shapethat was partially relieved to provide access to the thrust calibra-tion fixture. The fixture consisted of a ball-bearing mounted,right-angled lever system which allowed hanging weights onthe horizontal arm.3.4.1. Instrumentation and controls
The pressure transducers used were mainly thin-film straingage instruments and where oxygen compatibility and superiorcorrosion resistance was required, ceramic strain gage trans-ducers were adopted. The load-cell used for thrust measure-ments was a bonded strain-type transducer with a 1000 [N] rat-ing. This load-cell was selected to provide a high-stiffnessand, thus, to result in a high thrust mesasurement response.The cryogenic range temperature measurements were madewith copper/constantan (propellant tanks) and chromel/alumel(feed-system) thermocouples by use of feed-throughs or stan-dard connectors. Elevated temperatures, such as those ex-hibited by the chamber surfaces during firing, were moni-tored with iron/constantan thermocouples. These were of thebare wire type with stripped leads for faster response. Inner-wall, transient temperature data, used 0.5 [mm]-diameter probechromel/alumel thermocouples. These thermocouples werepressed against the bottom of the mounting holes with an av-erage force of ca. 3.5 [N], ensuring proper contact of the ther-mocouple sensing tip with the chamber inner-wall at all times.The propellant flowrates were measured using subcritical ven-turi meters specially designed for this purpose. A three-wallstainless-steel construction was conceived to permit a continu-ous flow of LN2 through the inner annular passage, while a vac-uum was maintained in the outer annulus for superior thermalinsulation. Upstream and downstream of the venturi meters,two mounting blocks were attached. These fully instrumentedblocks served as a manifold for the LN2 refrigerant flow and
338
Trans. JSASS Aerospace Tech. Japan Vol. 16, No. 5 (2018)
(a) Front view.
(b) Rear view.
Fig. 3. Chamber installation with provisions for pressure,temperature and force measurements.
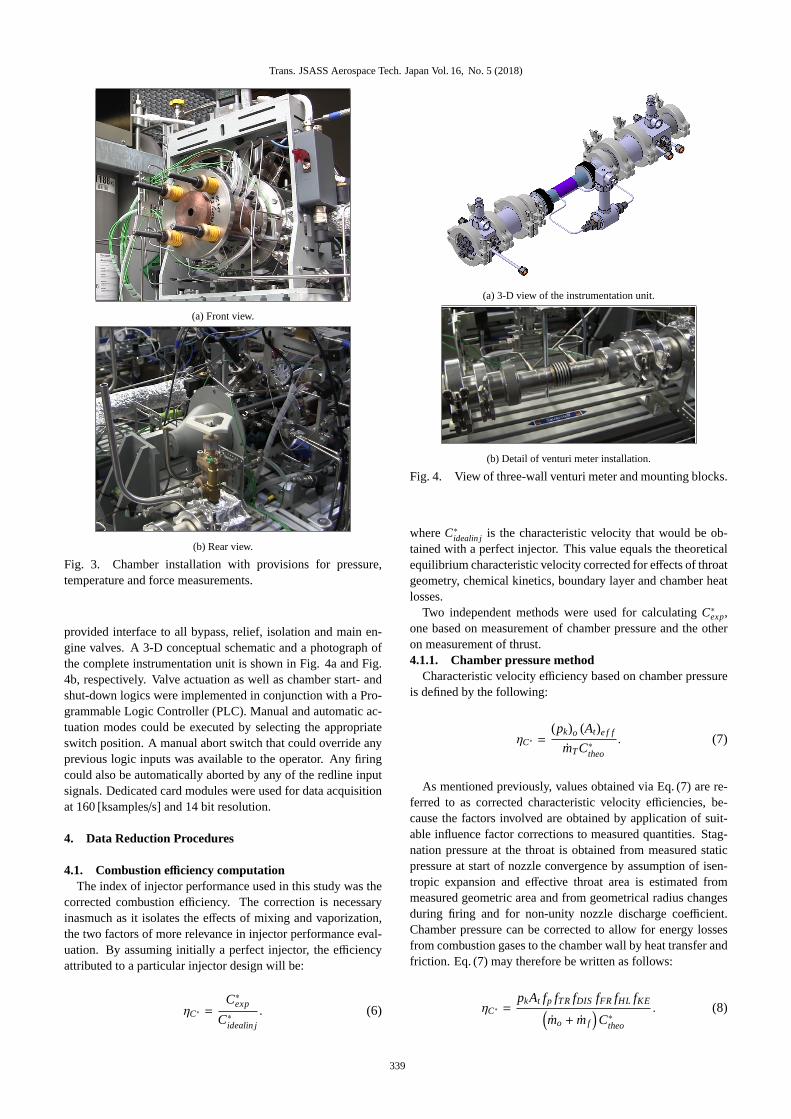
provided interface to all bypass, relief, isolation and main en-gine valves. A 3-D conceptual schematic and a photograph ofthe complete instrumentation unit is shown in Fig. 4a and Fig.4b, respectively. Valve actuation as well as chamber start- andshut-down logics were implemented in conjunction with a Pro-grammable Logic Controller (PLC). Manual and automatic ac-tuation modes could be executed by selecting the appropriateswitch position. A manual abort switch that could override anyprevious logic inputs was available to the operator. Any firingcould also be automatically aborted by any of the redline inputsignals. Dedicated card modules were used for data acquisitionat 160 [ksamples/s] and 14 bit resolution.
4. Data Reduction Procedures
4.1. Combustion efficiency computationThe index of injector performance used in this study was the
corrected combustion efficiency. The correction is necessaryinasmuch as it isolates the effects of mixing and vaporization,the two factors of more relevance in injector performance eval-uation. By assuming initially a perfect injector, the efficiencyattributed to a particular injector design will be:
ηC∗ =C∗exp
C∗idealin j
. (6)
(a) 3-D view of the instrumentation unit.
(b) Detail of venturi meter installation.
Fig. 4. View of three-wall venturi meter and mounting blocks.
whereC∗idealin j is the characteristic velocity that would be ob-tained with a perfect injector. This value equals the theoreticalequilibrium characteristic velocity corrected for effects of throatgeometry, chemical kinetics, boundary layer and chamber heatlosses.
Two independent methods were used for calculatingC∗exp,one based on measurement of chamber pressure and the otheron measurement of thrust.4.1.1. Chamber pressure method
Characteristic velocity efficiency based on chamber pressureis defined by the following:
ηC∗ =(pk)o (At)e f f
mTC∗theo
. (7)
As mentioned previously, values obtained via Eq. (7) are re-ferred to as corrected characteristic velocity efficiencies, be-cause the factors involved are obtained by application of suit-able influence factor corrections to measured quantities. Stag-nation pressure at the throat is obtained from measured staticpressure at start of nozzle convergence by assumption of isen-tropic expansion and effective throat area is estimated frommeasured geometric area and from geometrical radius changesduring firing and for non-unity nozzle discharge coefficient.Chamber pressure can be corrected to allow for energy lossesfrom combustion gases to the chamber wall by heat transfer andfriction. Eq. (7) may therefore be written as follows:
ηC∗ =pkAt fp fTR fDIS fFR fHL fKE(
mo + mf
)C∗theo
. (8)
339

Trans. JSASS Aerospace Tech. Japan Vol. 16, No. 5 (2018)
4.1.2. Calculations based on thrustThe alternate determination of characteristic velocity effi-
ciency is based on thrust:
ηC∗ =Fvac
mT (CF)vacC∗theo
. (9)
Values of vacuum thrust are obtained by correcting the sea-level measurements. These corrected values can then be used inconjunction with theoretical thrust coefficients for calculationof C∗. Nozzle efficiency is taken as 100% if there is no com-bustion in the nozzle, if chemical equilibrium is maintained inthe expansion process and if energy losses from the combustiongases are taken into account.9)
ηC∗ =(F + paAe) ϕFRϕDIVϕHLϕKE(
mo + mf
)(CF)theoC∗theo
. (10)
In Eq. (10), the correction factors are directly applied to vac-uum thrust rather than the measured thrust, because, for con-venience, the factors are readily calculated as changes in ef-ficiency based on theoretical vacuum parameters. Implicit inthe use of theoreticalCF values are corrections to geomet-ric throat area and to measured static chamber pressure at thestart of nozzle convergence. Therefore, calculation of correctedC∗ efficiency from thrust measurement includes all factors ofEq. (10) plus an additional one to account for non-parallel noz-zle exit flow. Because(CF)theo is essentially independent ofsmall changes to chamber pressure and contraction ratio whichare involved in corrections topk andAt, these corrections are ofno practical significance in calculation ofC∗ from thrust mea-surements. Methods of estimation of the various correction fac-tors are described in Ref. 9).4.2. Mass flow rate computation
Experimentally, both methods of combustion efficiency com-putation require knowledge of the mass flow rate of propellants.This parameter is obtained by considering venturi meter up-stream pressure and temperature conditions and by calculatingthe corresponding flow velocity at the venturi throat:
Vth =
√√√ 2(hline − hth)[1−
(ρth
ρline
)2β4
] . (11)
In this case, pressure at the venturi throat must be known:
pth = pline − ∆p. (12)
The propellant thermodynamic state points at the venturithroat are obtained by assuming isentropic flow to the throat,i.e.
sth = sline. (13)
In Eq. (11), the parameterβ is the line contraction ratio, de-fined by:
β =dth
dline. (14)
The mass flow across any of the venturi meters can be calcu-lated as follows:
m= CdAthρthVth (15)
whereCd is the venturi discharge coefficient obtained from wa-ter flow calibrations.
Finally, the total propellant flow is given by
mT = mo + mf . (16)
5. Uncertainty Analysis Description
The parameter used in this study for characterization of errorin a given measurement is the uncertaintyU, made up of biasB and precisionS. Precision is the variation between repeatedmeasurements and the standard deviation of this group of datapoints characterizes the random error. For samples cointainingmore than 30 data points the error range can be generally re-garded as twice the computed standard deviation and includes95% of the total spread of measurements.9) Depending on thecharacteristics of the measurement or group of data, differentapproaches may be used to calculateS.11) In a very generalway, the precision indexS is given by:
SX =
√√∑Ni=1
(Xi − X
)2
N − 1. (17)
Bias represents the constant or systematic error. In repeatedmeasurements, it is assumed that each data point has the samebias. Whereas precision can be estimated based on calibrationand test history, unknown bias factors need to be estimated. Al-ternatively, the known components of bias can be eliminated bycomparison with the true value.
Sources of bias and precision error are assumed in this studyto result from calibration, data acquisition and data reductionprocedures. The root sum square method is used to combinethese numerous sources of error. As a result, for the bias,
B =√
B21 + B2
2 + B23... + B2
N (18)
whereBi is the systematic error of theith elemental source.In a similar way, for the precision index:
S =√
S21 + S2
2 + S23... + S2
N (19)
whereSi represents the precision index of theith error sourceinvolved.
A single number describing both factors and having a simpleinterpretation is highly desirable. The uncertainty interval is themost widely used standard:
U± = B± ± tS. (20)
In other words,U represents the interval within which the truevalue is expected to lie, given a certain confidence level or cov-erage. In this study, a confidence level of 95% was considered:
U±95 = B± ± t95S. (21)
The value oft95 is a function of the number of degrees of free-dom used in obtainingS. As mentioned previously, when thedegrees of freedom of a certain measurement is higher than 30,t95 can be generally taken as 2.9) Values fort95 can be found intables for t-Student’s distribution12) as a function of the degreesof freedom of the sample, calculated as follows:11)
ν =
(∑Ni=1 S2
i
)2
∑Ni=1
S4i
νi
(22)
340

Trans. JSASS Aerospace Tech. Japan Vol. 16, No. 5 (2018)
whereSi is the spread or precision index resulting from thecombination of the various error sources, andνi represents thedegrees of freedom connected to each error source.
5.1. Total uncertainty of a measurementThe error in the measurement of a given parameter involved
in the calculation of a final quantity can be propagated by use ofinfluence coefficients describing the effect of a unit error in theparameter on the final result. IfPi represents theith parameterto be measured in order to obtain a quantityq, then the influencecoefficients are given by:
θi =∂q∂Pi. (23)
Therefore, the precision of a given quantitySq becomes
Sq =
√√√ N∑i=1
(θiSPi
)2 (24)
and for the bias sources:
Bq =
√√√ N∑i=1
(θi BPi
)2. (25)
To apply Eqs. (24) and (25) the uncertainties in the param-etersPi must be independent and random,12) using Eq. (21) inthe last step to obtain the total uncertainty of a result.
As described in Section 4.1, the effects of mixing and vapor-ization need to be isolated, in order to discern the level of ex-cellence of a given injector design. In order to accomplish thisisolation, all other effects must be accurately estimated. How-ever, the test data and the correction factors have uncertaintiesassociated with them, resulting in an uncertainty in the isolatedeffect. The model used in calculating this corresponding uncer-tainty is:
U±ηC∗ = ±t95
√S2
C∗exp+ S2
C∗FR+ S2
C∗DIV+ S2
C∗HL+ S2
C∗theo. (26)
EachS factor in Eq. (26) represents the change in injectorefficiency caused by a change of magnitudeS in the specificfactor, as described by Eq. (24).5.2. Determination of influence coefficients
The computation of influence coefficients are required topropagate the errors of measured parameters associated with afinal quantity. For analytical expressions, such as those givenby Eq. (11), the influence coefficients are obtained by partialdifferentiation with respect to the parameter of interest. When-ever thermodynamic properties are involved, a small perturba-tion around the nominal value was used. All propellant ther-modynamic state points were calculated using the REFPROPprogram13) supplied by the National Institute of Standards andTechnology (NIST). Expressions for the influence coefficientsand their typical values are summarized in Table 1.
Particularly for the velocity at the venturi throat, it is interest-ing to describe the influence coefficients in terms of measuredparameters, i.e. pressure and temperature in the line and pres-sure drop across the venturi. Ifκ is a calculated thermodynamic
Table 1. Influence coefficients.
Parameter Expression Value Unitspth
∂pth
∂pline= 1 1 [Pa/Pa]
∂pth
∂dp = −1 -1 [Pa/Pa]
β ∂β∂dth= 1
dline0.170× 100 [1/m]
∂β∂dline= − dth
d2line
0.690× 10⁻¹ [1/m]
Vth∂Vth
∂hline= 1√
2√
hline−hth[1−(
ρthρline
)2β4]
0.590× 10⁻¹ [s/m]
∂Vth
∂hth= − ∂Vth
∂hline0.590× 10−1 [s/m]
∂β∂dline= − dth
d2line
0.258× 10⁻¹ [m/s]∂Vth
∂ρline= − ρ
2th
ρ3line
Vthβ4
[1−(ρthρline
)2β4]−0.190×10⁻² [m4/kg · s]
∂Vth
∂ρth=ρth
ρ2line
Vthβ4
[1−(ρthρline
)2β4]0.190× 10⁻² [m4/kg · s]
mo,mf
∂m∂pline= ∂m∂Vth
∂Vth
∂pline+ ∂m∂ρth
∂ρth
∂pline0.410× 10−9 [m3 · s/kg2]
∂m∂Tline= ∂m∂Vth
∂Vth
∂Tline+ ∂m∂ρth
∂ρth
∂Tline−0.170×10⁻³ [kg · s/K]
∂m∂dp =
∂m∂Vth
∂Vth
∂dp +∂m∂ρth
∂ρth
∂dp 0.280× 10⁻⁶ [s/m]∂m∂dline= ∂m∂Vth
∂Vth
∂dline−0.230× 100 [kg/s ·m]
mt∂mt
∂mo= 1 1 [kgs−1/kg · s−1]
∂mt
∂mf= 1 1 [kgs−1/kg · s−1]
C∗exp∂C∗exp
∂pk=
fpAt fTR
mt0.240× 10−3 [m2 · s/kg]
∂C∗exp
∂At=
pk fp fTR
mt0.205× 106 [1/s]
∂C∗exp
∂mt= − pk fpAt fTR
m2t
−0.190× 10⁵ [m/kg]
property (either enthalpy, temperature or density at the venturithroat), then the chain rule applies:
∂κ
∂pline=∂κ
∂pth
∂pth
∂pline+∂κ
∂sline
∂sline
∂pline, (27)
∂κ
∂∆p=∂κ
∂pth
∂pth
∂∆p, (28)
∂κ
∂Tline=∂κ
∂sline
∂sline
∂Tline. (29)
Eq. (21) and Eq. (24) through Eq. (29) plus expressions in Ta-ble 1 form the basis for the calculation of all uncertainties.5.3. Error sources
Possible error sources associated with each instrument wascarefully traced for calibration and data acquisition errors. Inthe case of pressure tranducers, hysteresis and non-linearitywere calibrated out using a precision electronic calibrator asreference. Sources of data acquisition errors originated frompressure sensor temperature variations during data collectionand zero shift were mitigated by effecting the calibration at testconditions.
The venturi meters were periodically calibrated using wateragainst high precision magnetic inductive type flowmeters. Dis-crepancies in the values of discharge coefficients obtained withwater and the real, low viscosity propellants, were acknowl-edged. Unfortunately, no other means were available at the timeof testing to assess discharge coefficient values associated withthe real propellants.
Thermocouples used in the feed-system lines and combustionchamber were not calibrated; these were employed as per sup-plier stated precision standards. In the case of the combustion
341

Trans. JSASS Aerospace Tech. Japan Vol. 16, No. 5 (2018)
chamber, several sources of error influence the values of tran-sient temperature. Some of these errors include disturbancesin thermocouple reading due to roughness in combustion andchamber operation, uncertainty of the exact location of a inner-wall thermocouple and of the thermal properties of the combus-tion chamber wall material.
Thrust measurement errors due to a shift in load cell outputsignal caused by rigid propellant lines, valve connections andflexures were verified and compensated for prior to engine test-ing. Offset reading error was eliminated since the load cell waszeroed prior to each test fire. Errors due to misalignment be-tween thrust chamber force vector and the resultant componentmeasured by the load cell, as well as those resulting from mis-alignment of forces acting on an axis different from the enginecenterline could not be entirely quantified and eliminated.
Errors due to data reduction techniques included, for exam-ple, the effect of smoothing and linear interpolation of recordedpropellant and chamber temperatures or calculated thermalproperties. In the case of propellant flow rate computation,errors are inevitably present if two-phase flow develops in theline. Whenever two-phase flow upstream of the venturi exists,only such thermodynamic properties as pressure and tempera-ture are not sufficient to characterize the flow and knowledgeof the vapour quality is needed.14) Figure 6 presents typicalsignal traces obtained during an early test for both venturi me-ters. Pressure oscilations in the LO2 venturi meter indicate two-phase flow was present. Appropriate venting of the lines andpermanent liquid nitrogen cooling flow through the venturi me-ter jackets was conducted prior to and during data taking inorder to maintain propellants in subcooled conditions. Addi-tionally, values of mass flow converted from orifices mounteddownstream of the main valves served as backup to the venturimeters. Values from venturi and orifice flow meters agreed towithin ±4% of one another. Figure 5 shows a break down of allcontributing scattered errors associated with LCH4 flow rate. Abig portion of the total error is attributed to venturi dischargecoefficient and pressure drop. These results are somewhat in-flated by worst-case instrumentation and data acquisition errorsassumed in the analysis, but certainly demonstrate areas of im-provement.
6. Results
Preliminary tests employed two different LO2 orifice shapesand a reduced chamber contraction ratio of 9. The injector waswater-flow calibrated prior to engine tests in order to establishbasic hydraulic characteristics and to set the proper shim thick-ness for the LCH4 injector, as shown qualitatively in Fig. 7aand Fig. 7b.
Figure 8 depicts typical pressure traces and Fig. 9 illustratesthe general aspect of the exhaust flame in a test-run. The calcu-lation of characteristic exhaust velocity followed by the cham-ber pressure method and theC∗ efficiency was calculated as in-dicated in Subsection 4.1.1. Initially, no corrections were madefor engine friction losses, throat area change or heat losses tothe chamber wall. The final precision inηC∗ was±4.5% for onestandard deviation.
The slot-shaped (rectangular) orifice, was the first configura-tion tested (Injector 1). The proposed arrangement uses a single
Fig. 5. Breakdown of scattered errors in LCH4 mass flow rate.
0
0:5
1
1:5
2
2:5
3
3:5
�0:5
0
0:5
1
1:5
2
Time, [s℄
D
i
�
e
r
e
n
t
i
a
l
P
r
e
s
s
u
r
e
,
[
M
P
a
℄
�
1
0
�
1
LO
2
venturi
LCH
4
venturi
1
Fig. 6. Representative pressure traces for the venturi meters.
(a) LCH4 injector flow employ-
ing a 2-[mm] thick shim.
(b) LO2 and LCH4 flows at opti-
mum momentum balance.
Fig. 7. Injector cold-flow testing.
row of twelve orifices as shown in Fig. 10.Similar to the slot geometry, twelve orifices were used with
the circular orifice geometry (Injector 2). In comparison to theslot shape, circular orifices showed better flow reproducibilityduring water calibration and a wider spray angle. At such di-mensions, they also offer advantages in terms of manufacturing.For these reasons, these tests aimed at answering the question:what can a slot geometry accomplish that cannot be accom-plished by a circular geometry? Performance computation forboth injector configurations is shown in Fig. 11. In fact, there isno discernible performance difference in terms of combustionefficiency within the given error between both configurations atthe design point. The value aroundηC∗=90.5% at the designKm
342

Trans. JSASS Aerospace Tech. Japan Vol. 16, No. 5 (2018)
0 1 2 3 4
0
10
20
30
40
50
60
70
Time, [s℄
P
r
e
s
s
u
r
e
,
[
M
P
a
℄
�
1
0
�
1
Igniter hamber Main hamber
LCH
4
inje tor LOX inje tor
LCH
4
tank LOX tank
1
Fig. 8. Representative pressure traces.
Fig. 9. Typical hot-fire test run.
Fig. 10. Slot orifices mounted to the pintle tip.
of 2.8 for the slot shape was satisfactory. This compares withanηC∗=89.0% for the round LO2 orifices. However, the circu-lar shape exhibited lower performance decay across the mixtureratios tested. This is because of the constant momentum ratioobtained in these tests and probably some improvement in mix-ing as a consequence of increased residence time resulting fromthe wider spray angle.
A second series of tests employed two slightly modified ver-sions of the injector (Injector 3 and Injector 4) in an attemptto reduce thermal loads to the pintle tip and nozzle throat. Inthis case, an uncooled nozzle with an expansion area ratio of4:1 and a chamber characteristic length of 1.45 [m] and nomi-nal contraction ratio of 13 was used. Corrected values for thecharacteristic velocity efficiency were computed by both meth-ods presented in Subsections 4.1.1 and 4.1.2. Figure 12 givesthe calculated combustion efficiency as a function of mixtureratio an the comparison of both methods ofηC∗ computation.Calculations based on both techniques agree to within±2.5%of one another. This is somehow an optimistic figure, since
1:52
2:53
3:54
4:5
1200
1400
1600
1800
2000
Design point
Mixture ratio, [-℄
C
h
a
r
a
t
e
r
i
s
t
i
v
e
l
o
i
t
y
,
[
m
=
s
℄
Slot Cir ular
Theoreti al
11:5
22:5
33:5
44:5
0:7
0:75
0:8
0:85
0:9
0:95
1
Design point
Mixture ratio, [-℄
C
o
m
b
u
s
t
i
o
n
e
Æ
i
e
n
y
,
[
�
℄
Slot Cir ular
1
Fig. 11. Computed performance comparison for the slot andcircular orifices.
thrust cell bias errors could not be fully eliminated or identi-fied. Injector 4 has slightly better performance than Injector3 at the same mixture ratio. With the errors considered, bothinjectors were around 80% efficient at the design point. Thelower performance in comparison with the previously tested in-jectors are believed to result from design modifications leadingto LCH4 flow momentum losses and poorer interaction with theLO2 sprays. A summary of injector performance and operatingconditions is given in Table 2.
Table 2. Performance summary for the evaluated injectors(Km = 2.8 [-], pk = 1.0 [MPa] abs., chamber pressure method).
∆pin j [MPa]
Injector LO2 LCH4 ηC∗ , [%] L∗, [m] ϵk, [-]
1 0.024 2.10 90.5 2.40 92 0.026 2.14 89.0 2.40 93 0.029 0.49 78.8 1.45 134 0.011 0.95 83.9 1.45 13
7. Conclusion
A methodology has been developed for the determination ofuncertainty in the final calculated values of characteristic com-
343

Trans. JSASS Aerospace Tech. Japan Vol. 16, No. 5 (2018)
1:52
2:53
3:54
4:5
0:5
0:55
0:6
0:65
0:7
0:75
0:8
0:85
0:9
0:95
1
Mixture ratio, [-℄
C
o
m
b
u
s
t
i
o
n
e
Æ
i
e
n
y
,
[
�
℄
Inje tor 3 Inje tor 4
0:5 0:60:7 0:8 0:9 1
0:5
0:55
0:6
0:65
0:7
0:75
0:8
0:85
0:9
0:95
1
Combustion eÆ ien y, [�℄ based on hamber pressure
C
o
m
b
u
s
t
i
o
n
e
Æ
i
e
n
y
,
[
�
℄
b
a
s
e
d
o
n
t
h
r
u
s
t
Inje tor 3 Inje tor 4
1
Fig. 12. Performance comparison for injectors 3 and 4 andcorrelation between both methods ofηC∗ computation.
bustion efficiency for a pintle injector operating with cryogenicLO2 and LCH4 propellants and an uncooled combustion cham-ber. Uncertainty is given by a bias and a precision, which iscomputed after the propagation of system elemental errors. Twotechniques forηC∗ computation were presented, one based onchamber pressure and another on thrust measurements.
Critical factors affecting the accuracy of the experimentallydetermined characteristic velocity are: (1) the accuracy of theknowledge of the propellant thermodynamic properties ustreamof venturi inlet; (2) the deviation in venturi discharge coeffi-cient calibrated with water with respect to real propellants andthe accuracy of this calibration; (3) the accuracy of thrust mea-surements, due to unknown bias errors.
Tests have been made with four pintle injector configurations.Injectors 1 and 2 performed closely, and within the error mar-gin of ±4.5% in ηC∗ no conclusion can be stated in terms ofperformance advantages of one injector configuration over theother. Tests made with two additional pintle injector configu-rations gave combustion efficiency values in terms of indepen-dent thrust and chamber pressure measurements which agreedto within±2.5% of one another. The accuracy of the determina-tion will depend on the correct estimation of propellant thermo-dynamic state and on the degree of refinement of experimentaltechniques as well as in the accuracy with which the data for
experimental characteristic velocity correction are obtained.
Acknowledgments
The authors would like to thank Capes (Nr. 9337/2013) fortheir suppport in the development of this work.
References
1) Schoenman, L.: Low-thrust ISP Sensitivity Study, Aerojet LiquidRocket Company, NASA CR-165621, 1982.
2) Casiano, M. J., Hulka, J. R., and Yang, V.: Liquid-Propellant RocketEngine Throttling: A Comprehensive Review,J. of Propulsion andPower,5(2010), pp.897–923.
3) Harrje, T. D.: Liquid Propellant Rocket Combustion Instability,NASA SP-194, Cleveland, Ohio, 1972.
4) Bazarov, V. G.: Throttleable Liquid Propellant Engines Swirl Injec-tors for Deep Smooth Thrust Variations, AIAA Paper 94-2978, 1994.
5) Hammock, R. W., Currie, C. E., and Fisher, E. A.: Apollo ExperienceReport - Descent Propulsion System, NASA TN D-7143, 1973.
6) Dressler, G. A.: Summary of Deep Throttling Rocket Engines withEmphasis on Apollo LMDE, AIAA Paper 2006-5220, 2006.
7) Popp, M., Hulka, J., Yang, V., and Habiballah, M.: ”Liquid Bipropel-lant Injectors”,Liquid Rocket Thrust Chambers: Aspects of Model-ing, Analysis and Design, Progress in Astronautics and Aeronautics,Washington, D.C.,200(2004), pp.141–165.
8) Sutton, G. P. and Biblarz, O.:Rocket Propulsion Elements, John Wi-ley & Sons Inc., Hoboken, New Jersey, 2010, pp.282-283.
9) Gross, K. W. and Evans, S. A.: JANNAF Rocket Engine PerformanceTest Data Acquisition and Interpretation Manual, CPIA Publication245, 1975.
10) Abernethy, R. B. and Thompson, J. W.:Handbook, Uncertainty inGas Turbine Measurements, Arnold Air Force Station, Tennessee,AEDC-TR-73-5, 1973.
11) Kenneth, J. D.: Pretest Uncertainty Analysis for Chemical Rocket En-gine Tests, NASA-TM-89819, 1987.
12) Taylor, R. J.:An Introduction to Error Analysis, University ScienceBooks, Sausalito, 1997, pp.121–153.
13) Lemmon, E. W., Huber, M. L., and McLinden, M. O.: NIST StandardReference Database 23: Reference Fluid Thermodynamic and Trans-port Properties-REFPROP, Version 9.1, National Institute of Stan-dards and Technology, Standard Reference Data Program, Gaithers-burg, 2013.
14) Filippov, Yu. P. and Panferov, K. S.: Two-Phase Cryogenic Flow Me-ters, Part II - How to Realize the Two-Phase Pressure Drop Method,Cryogenics, 51(2011), pp.640–645.
344