estimating the potential reductions in energy demand ... · through efficiency, control and...
TRANSCRIPT

Loughborough UniversityInstitutional Repository
Estimating the potentialreductions in energy demandthrough efficiency, control
and lifestyle change in a realhome
This item was submitted to Loughborough University's Institutional Repositoryby the/an author.
Citation: COSAR-JORDA, P., BUSWELL, R.A. and MITCHELL, V., 2013.Estimating the potential reductions in energy demand through efficiency, con-trol and lifestyle change in a real home. IN: Proceedings of FutureBuild, BathUniversity, 4-6 September 2013, pp. 135 - 144.
Additional Information:
• This is a conference paper.
Metadata Record: https://dspace.lboro.ac.uk/2134/13164
Version: Accepted for publication
Publisher: c© University of Bath
Please cite the published version.
This item was submitted to Loughborough’s Institutional Repository (https://dspace.lboro.ac.uk/) by the author and is made available under the
following Creative Commons Licence conditions.
For the full text of this licence, please go to: http://creativecommons.org/licenses/by-nc-nd/2.5/

Estimating the potential reductions in energy demandthrough efficiency, control and lifestyle change in a real
home
P. Cosar JordaBuilding Energy Research
GroupLoughborough University, UK
R. A. BuswellBuilding Energy Research
GroupLoughborough University, [email protected]
V. MitchellLoughborough Design SchoolLoughborough University, [email protected]
ABSTRACTIn order for the UK to generate pathways to help deliverthe near and long term CO2 reduction targets set by theCommittee on Climate Change, a number of future scenar-ios were generated to simulate consumer responses to energyprice changes based on economic background, developmentsin technology, fuel price and other assumptions. The overallcarbon reductions anticipated by these scenarios lie between40% and 90% by 2050, the domestic sector is expected toreduce emissions by 31% by 2020 and 60% by 2050. Thequestion is how the residential sector will respond to theanticipated changes to the supply and demand for energy.There will be potential future CO2 reductions through theintroduction of more efficient appliances and the implemen-tation of more advanced heating controls, enabled throughICT 1. What is less clear is how far the benefits of efficiencyand control will get us to these goals and to what degreepeople will have to make changes to their chosen way of liv-ing in the home. In this paper we ask, whether the answer tosignificant reduction in energy consumption lies with the ac-quisition of equipment, or the adaptation of family life. Theapproach has been to take whole house energy data froma real family home in 2013 and place it in three possiblelandscapes that look towards 2050. This model simulatesenergy consumption in 2050 by applying potential interven-tions to determine the effects of efficiency, control and moresustainable lifestyles.
KeywordsDomestic energy consumption, Whole house simulation, Life-style change, Future Technology
1. INTRODUCTION1ICT: Information & Communication Technology
.
The UK CO2 targets require a reduction in emissions of80% by 2050 [41]. This challenge is of special interest tothe domestic sector, which accounted for 25% of the over-all UK emissions and just over 40% of the final energy usein 2009 [14]. Future scenarios predict significant decreasein CO2 emissions for energy production due to implemen-tation of renewable energy systems [37] and increased lo-calised domestic energy production [15]. The introductionof renewable energy systems creates greater intermittence inthe supply which is challenging for the energy sector, wheredemand must be met while balancing generation [28].
Reducing domestic CO2 emissions is challenging as reduc-tion and shifting demand requires active participation fromthe user, over and above the capital investment and timefor organising refitting, buying new efficient appliances andupdating home technologies [8]. Future pathways towardsreduced CO2 emissions assume lifestyle change and antici-pate that householders will respond to energy price signalsand social sustainable values [41]. However, several stud-ies argue that energy is not visible to users and that theyare not always rational in their actions [48] which makes itdifficult to predict the real savings from energy efficiencyand control interventions. The design of energy demand re-duction interventions, therefore, needs to consider lifestylevalues related to energy consumption in the home includingperceptions of comfort and convenience [35, 39, 34].
The aspects of home dweller’s lifestyle that need to changein order to deliver the savings in consumption necessitatedby reduction targets is not well defined. Future scenariossuch as the lifestyle scenario [41], The UKDCM (UK Do-mestic Carbon model) developed as part of the model 40%house [7, 23] and other national household scenarios [33, 38,29, 45, 25, 20, 2, 19, 24, 47, 43, 42, 3, 40, 26, 27, 17, 21,30] make assumptions about the shifting and reductions indomestic demand, in order to establish the topology of fu-ture generation. As we move towards 2020 and beyond, theroll out of smart meters to every dwelling will occur [15, 32,18] and the hope is that consumption will become more vis-ible, and billing more sophisticated. More advanced HomeEnergy Management Systems (HEMS) are also entering themarket, these allow consumption monitoring at an appliancelevel as well as increased home automation and control. Suchsystems should help users to reduce energy consumption, al-though the effectiveness of such interventions has so far beenvaried [1, 4, 31, 6, 10, 13].

There is a need therefore to consider more explicitly andsystemically how the 2050 target can be met taking intoconsideration retrofit opportunities, smart appliances, sys-tems control and lifestyle change. The approach taken inthis paper is to sketch out plausible 2050 landscapes, take areal family living today, and model their consumption underdifferent interventions to predict the effect of these interven-tions on consumption in a 2050 world. Conclusions can thenbe drawn about the extent of the changes that may need totake place as well as the challenge of the assumptions onwhich the current future scenarios are based.
2. LIVING IN 2030/2050Existing future scenarios that describe possible landscapes
towards 2050 CO2 reductions examine not just public pol-icy measures, fuel prices, economic growth and technicalimprovements but also important cultural shift [46]; espe-cially in the home, where domestic consumption, dominatedby space heating, hot water use and electricity consump-tion for lighting and appliances purposes, increased by 150per cent between 1970 and 2008. The main increase inthe domestic sector took place from 1970 to 1986 largelyas a result of the spread of installed central heating andthe increase in the number of energy-consuming goods [18]which resulted in people adopting higher comfort levels inthe home. This trend has been the focus of several pro-grammes and studies which aim to decrease domestic energydemand by designing and evaluating information and feed-back interventions. Insights from these intervention studiesare being used to shape socio-political initiatives towards alow carbon housing stock. Government policies have alreadybeen launched to facilitate the implementation of more effi-cient systems, improved billing, consumption feedback andgreener energy production. Programmes such as the GreenDeal, ECO, the Renewable Heat Incentive (RHI) and EnergyPerformance Certificates (EPCs) [5] consider not just tech-nological change but aim to encourage lifestyle change [5],incentivising people, for example through finance schemesand attempting to reduce the ‘rebound effect’ associatedwith Retrofit and ICT interventions in existing homes. Thelifestyle scenario, The Carbon Plan and the UK White Pa-per 2007 [18], describe some of the key characteristics of en-ergy production and consumption predicted to impact newand existing households. Published changes in energy con-sumption for existing dwellings have been analysed here andpossible savings have been quantified for a sample house, dif-ferentiating between technology, ICT, behaviour and retrofitinterventions and evaluating three outcome scenarios.
3. THE HOME TODAYThe data used in this paper is from an ongoing home en-
ergy monitoring project in the UK, which explores residen-tial energy use and the interplay with householders lifestylesand routines. 20 homes are monitored in total and a wholehouse approach has been taken, looking at main electri-cal appliances and circuits, gas and hot water consumption,room and outside air temperature and room presence signal[11]. This paper uses data from one monitored home, here-after called H05. H05’s energy profile is typical of homesin the UK and is deemed representative, with its estimatedannual electricity consumption of 14745 MJ nearing the av-erage figure of 11678 MJ reported by DEFRA [49]. The
property is a 1930s semi-detached family home with a floorarea of ≈100m2over two-storeys.
Taking a snapshot of the property today in 2013, the housewall construction already has post building insulation in-stalled in the cavity and the loft has been insulated with200 mm of rock-wool. The windows have been refitted withdouble glazed units through the whole house and more thanhalf the lights are CFL 2. H05 has been extended and con-tains a large kitchen diner, a living room, a sitting roomused as home office and a utility on the ground floor, andthree bedrooms and a bathroom on the first floor. There isa detached garage which contains a tumble dryer, a secondfridge and a second freezer.
Most appliances are relatively new, including a A+ ratedwashing machine, and an electric hob and oven. The mainhot water and space heating system is a gas condensing com-bination boiler which is less than 5 years old. Space heat-ing is supplied by radiators which have TRVs 3 fitted. Thespace heating is mainly controlled by a programmer whichallows multiple time and temperature settings. Hot waterfor showering is supplied by the main combination boiler.
The family comprises of two parents, a teenage daughterand a dog; The house is generally occupied all day on Fri-days, (when the father (H05MA) works from home) and atweekends. H05 therefore, has two main occupancy profiles,
• working days, from Monday to Thursday when thewhole family is out of the house during the day; and,
• ‘at-home’ days, from Friday to Sunday when the houseis more permanently occupied.
To describe and apportion the energy consumption in thehome, monitored data was taken for two winter days, oneworking day and one ‘at-home’ day. Figure 1 shows theenergy consumption profile for gas, hot water and electric-ity during both days of study: the total energy consump-tion in H05 was 40% lower during the working than the‘at-home’ day. During the ‘at-home’ day the heating sys-tem was continuously on, maintaining the indoor air tem-perature close to 22oC . The heating system led scheduledon/off times which resulted in a fluctuating air temperaturebetween 15oC to 19oC during the working day showing dif-ferent cumulative gas flow, depicted in the top two plots ofFigure 1. Gas flow is constant during the ‘at-home’ day (lefthand plot) except between 07:00 and 08:00 when a showertook place, indicating that the boiler modulates gas flowdepending on load.
The power profile also differs between both days. Peaks inelectric consumption appeared all along the ‘at-home’ day,whereas during the working day, peaks are mostly concen-trated in the evening when people are active in the home.Electricity consumption lies between 7% and 9% of whole en-ergy consumption of the home on both (winter) days. Spaceheating demand is on average near to 90% of the daily en-ergy consumption. During the monitoring year, H05 spaceheating was on from September to April, which proportion-ally accounted for 60% of the annual energy demand, beingvery similar to UK published figures [16].
To analyse the energy reduction afforded by the imple-mentation of measures which are part of the future land-scapes, savings are simulated in H05 based on the data from
2CFL: Compact Fluorescent Lights3TRV: Thermostatic Radiator Valve

the two days of study. The simulation modelled improve-ments in technology for lighting, appliances and for the heat-ing system, ICT interventions for space heating and appli-ances and retrofit opportunities. Likely savings from eachof the categories were quantified and applied to three futurehousehold scenarios.
4. INTERVENTIONS 2013 → 2050Over a span of less than 40 years, substantial technological
and cultural changes are expected to shift everyday life in thehome. Housing low carbon scenarios describe more smartlycontrolled houses, more efficient appliances and heating sys-tems, stronger regulations for product design and labellingand higher energy prices [8]. Major potential changes affect-ing energy demand in households have been identified in theliterature and are listed below:
Space and hot water heating controlsMinimum heating controls comprise a time programmer androom thermostat or combined programmable room thermo-stat plus thermostatic radiator valves (TRVs) and furtherzone controls to heat required parts of the house [11]. Themost likely application of such controls is through ‘smarthome’ technology that is combined with HEMS to providemore efficient management of energy use in the home.
Building fabric and housing stockNew buildings need to achieve close to zero space heatingdemand by 2020 the latest. Therefore heat loss standardsas well as ventilation heat loss through infiltration of cold airwill be reduced. Refurbishment of the existing stock to thestandard of current Building Regulations for new dwellingsis necessary since most of the UK housing stock will stillbe standing in 2050 [46, 8]. Retrofit opportunities rangefrom easy and cost-effective measures, such as insulation ofcavity walls, replacement of old windows with double, tripleand other glazing systems and placement of thicker insula-tion in lofts, to more expensive and disruptive solutions suchas insulating solid ground floors, updating already refittedwindows or applying surface wall insulation [44]. Infiltrationof cold air from the fabric will be reduced by the applicationof restrictive air pathways such as blocking chimneys, seal-ing skirting boards and service pipes penetration to achievethe same infiltration rates as in new buildings. [8]
Appliances, lighting and heating systems technologyMore efficient domestic appliances are expected to enter themarket eventually decreasing energy consumption; standbyloads will decrease to 1 Watt and smaller appliances will be-come trendy. Incandescent bulbs will be replaced by CFLsin the first stage and LEDs4 after 2020.[41]. New high ef-ficient heating systems will be installed widely, phasing outnon condensing boilers and rising up boiler efficiency levelsto 95% [8].
Heating and electricity provisionLow carbon heat pumps and zero carbon solar hot water,biomass, geothermal, solar Photovoltaic and wind turbineswill generate 30% to 40% of domestic gas and electricity [8]
4LED: Light Emitting Diode
which will impact on carbon emissions and also on energyprice and availability.
LifestyleGreener lifestyles are expected to become a social norm [41].In these future lifestyle projections, feedback and informa-tion will increase people’s awareness of energy to enable sav-ings. These information measures which take several formsranging from informative bills to direct, immediate feedbackas with smart meters, have potential for savings between 5and 20% [9]. Overheating will become socially unacceptableand maximum peak indoor temperature will be 17oC from2025 [41]. Ventilation will need to be reduced not just byavoiding infiltration of cold air but by motivating appropri-ate natural ventilation, lowering down standard ventilationrates to 0.6 air changes per hour. Practices will be led bypersonal action against carbon emissions by shifting time ofuse to satisfy energy availability and by changing shopping,laundry and cooking routines to reduce carbon emissionsfrom electricity production.
5. MODELLING THE HOME 2013The model described here is based on measured consump-
tion values taken from H05. The object of the model is todescribe energy consumption of the home today (2013) andthen by systematically applying changes to the model, yieldthe energy consumption that might be indicative of that in2050. The approach is staged:
1. develop a steady-state heat balance model that param-etrises the high level energy use and supply;
2. estimate the heat losses through the fabric and venti-lation/infiltration;
3. review and classify interventions and ways of changingenergy consumption; and then,
4. apply these expected reductions through the high levelparameters by disaggregation either by consumptionclassification or time dependency.
The high level heat balance is given by;
0 = (Qg + Qe + Qp)− (Qw + Qf + Qv), (1)
Where Qg, Qe, Qp, Qw, Qf and Qv are the daily sum of gasconsumption, electricity consumption, heat gains throughpeople, heating for hot water, heat losses due to the fabricof the dwelling, cold air infiltration and ventilation [11]. Gasand hot water consumption are measured at a sample rateof 1 second and hence it is possible to determine gas use forcooking, space heating and hot water production. Qe is mea-sured at the mains circuit at 1 minute intervals, but can alsobe generated by summing the power from all appliances andlighting circuits since these are monitored. A balance wasmade comparing the aggregated power with the mains andthe difference was negligible compared to the uncertaintyin the measurement of the devices. The number of peoplein the home on the days used in this study was estimatedthrough observation of activity via PIR sensors and workingprofile knowledge of the families. The fabric losses were esti-mated based on selected U-values for the construction type.The mean indoor and outdoor temperatures were estimated
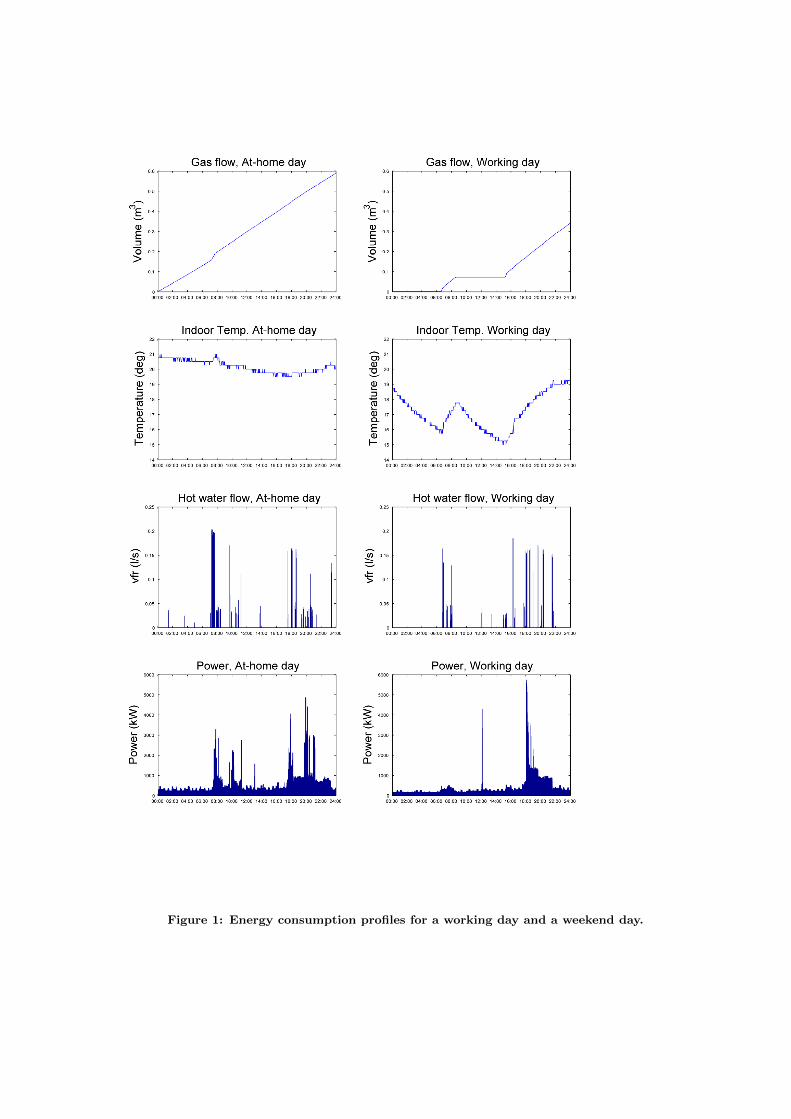
Figure 1: Energy consumption profiles for a working day and a weekend day.

based on the monitoring data. The ventilation/infiltrationlosses are estimated in Equation 1.
The paper attempts to understand where the line be-tween interventions and behaviour/lifestyle change lies inreal homes to ascertain how much change to the day-to-daydomestic routines and practices must take place in order tomeet the 2050 intended targets. Simplifications are madeto make the illustration possible with in the scope of thepaper. There is an assumption that the quoted reductiontargets will apply to this home, when in reality they arelikely to be unevenly distributed, targeting those with higherconsumption/CO2 production. Although the approach isscalable and can be applied to multiple years of data whichaccount for seasonal change, we focus here on a fairly typ-ical week day and an ‘at-home’ day in January 2013; Sincemost energy saving are likely to be through reduction ofthe space heating demand, this study represents a conserva-tive estimate of the saving possibilities, drawing the line be-tween technology and behaviour driven reductions. The keyparameters considered on these two sample days are sum-marised in Table 1. The specified target values are based onpredicted changes which will affect households as describedin the last section.
Applying changes to the modelA review of interventions has been carried out in the liter-ature and where possible, published reductions from trialshave been used as realistic estimates of the savings we mightexpect our home to make. Some of these changes are easilyapplied on whole day values: if we know there is one lessperson in the home (someone has left) then gains (Qp) willgo down proportionally. Where there is a saving on an ap-pliance, i.e. a fridge is replaced with a more efficient device,then this must be applied to the specific device and so theloads need to be disaggregated to do this. This has beencarried out for the electrical loads and classified accordingto the DEFRA categories [49], depicted in Figure 2. Coldappliances include three refrigerators; lighting is measuredin the lighting circuits and lamp bulbs; audiovisual equip-ment and computers are included in the ICE 5 [12]; cookinginclude all the electric devices used for heating or/and pro-cessing food; washing and drying appliances are laundry de-vices and dishwasher. Electric loads which do not fall neatlyinto these categories are accounted for as ‘others’.
Other changes include modes of operation that are timedependant during the day. A TV, for example, might havea standby load and so a time series model is required toevaluate the reduction generated by switching it off whennot in use. The reductions that can be realised by reducingthe duration of space heating, or by reducing the set pointtemperature must be evaluated by estimating the ratio ofthe effect of reduction on the volume of gas consumed. Byway of example, the latter is implemented thus,
Q′f + Q′vQf + Qv
=Q′g −Q′wQg −Qw
, (2)
5ICE: Information, Communication and Entertainment de-vices
Figure 2: Appliance consumption for a workday anda weekend day.
where Q′f + Q′v is the fabric and ventilation losses at thenew lower set point and (Qf + Qv), Qg and Qw are theestimates from the data. The expression then ratios downthe gas consumption that might be expected if a lower setpoint temperature was used. The effects on space heatingthat have been treated with this and similar approaches inthis study are:
• lowering the indoor temperature set point, describedabove;
• using space heating only when the house is occupied,by applying three different occupancy patterns;
• ensuring the heating is off at night when the family aresleeping; and,
• working from home, when only part of the house isheated.
The appropriate interventions for this family home areapplied to the model and the estimated effects on energyconsumption calculated. These results are then discussed incontext of future targets in the 2050 home.
6. 2050 HOUSEHOLD SCENARIOSIn order to create the future scenarios for H05 energy con-
sumption, the main variables considered have been technol-ogy and lifestyle. The reference scenario places H05 whereit is now and technology and lifestyle change are applied tomove from the house today to three different 2050s’ land-scapes, which are summarised in Figure 3. For this analysisoccupancy patrons remain constant considering 4 workingdays and 3 ‘at-home’ days.
Reference scenarioThe reference scenario describes H05’s current picture, il-lustrating the characteristics of their appliances, space heat-ing controls and building thermal behaviour. H05’s centralspace heating is fired by a combination condensing boilerand it is controlled by TRVs in each radiator and program-mer allowing multiple time and temperature settings. Hotwater is supplied by the boiler; Indoor temperature is be-tween 18 and 21oC , being very constant on the day ‘at-home’but fluctuating on the working day. Natural ventilation ishigher during the ‘at-home’ day when laundry takes place,impacting on the ventilation rate which sharply increasesfrom 0.86h−1 to 1.86 h−1. The main consuming appliances

Table 1: Energy balance parameters considered in the model.Description Parameter Value Value Target Unit Intervention
Weekend Workday ValueFabric Heat loss Qf 315.8 269.54 - MJ -Whole house UA values UA 174.38 174.38 146 W/K RetrofitAve. indoor temp. Ti 21.7 18 17 oC LifestyleAve. outdoor temp. To 0.74 0.11 - oC -Hot water heat loss Qw 21.52 7 - MJ -Hot water use mw 233 76.5 - Kg -H.water initial temp. T iw 40 40 - oC -H.water final temp. Tfw 18 18 - oC -Ventilation heat loss Qv 393.72 155.09 - MJ -Ventilation rate N 1.86 0.86 0.6 h−1 LifestyleElectric heat gains Qe 55 37 - MJCold appliance number 3 3 1 - LifestyleCold appliances input 12.4 12.4 8.4 MJ TechnologyLighting input 7.4 6.1 1.95 MJ TechnologyWashing Machine 14.19 0 1 MJ LifestyleDishwasher 6.75 0 2.89 MJ LifestyleSpace heating Qh 636 375 - MJ -Boiler efficiency nh 80% 80% 95% - TechnologyBody heat Qp 17.28 12.96 - MJ -
Figure 3: H05 Scenarios.
in the house are the dishwasher, washing machine, a fridge-freezer, a second fridge and a second freezer placed in thegarage, three TVs and other ICE devices.The house equip-ment is considerably new and their building has already beenrefitted. H05 householders have some interest in the envi-ronment even though their lifestyle is not led by sustainablevalues.
Lifestyle changeIn this scenario H05 is placed in a world of energy aware-ness where sustainability has become a social norm, result-ing in an important lifestyle shift. H05’s home activitiesare constrained by householders commitment to the envi-ronment. Technology, ICT and building thermal behaviourdo not change, the family effort to cut emissions is focusedon reducing net consumption rather than purchasing moreefficient devices. The indoor air temperature is maintainedat 17oC during the heating season and the family is more con-
scious of how to program the system to avoid the heatingon when no one is using it. The ventilation rate has beenreduced to a minimum of 0.6h−1, assuming that buildingcold air infiltration is as low as in new buildings and naturalventilation practices are supportive of low heat loss. Theassumption here is that the dwelling characteristics avoidcold air infiltration higher than the standard. The familyinterest for the environment motivate them to look for allsorts of feedback in order to cut consumption and to aim atspecific reduction goals in comparison with the neighbour-hood and the national average domestic consumption. Theyalso change their shopping routines and the way they storefood to reduce their ownership of refrigerators from three toone. The use of the tumble dryer is avoided and the washingmachine and the dishwasher are used no more than 3 timesa week. The lighting is updated by changing all the oldincandescent lights to CFL. In this scenario, carbon emis-sions are expected to decrease by adjusting appliance timeof use to energy availability in the electric grid, consideringthe integration of smart grids as part of this potential futurelandscape.
Technological changeH05 Technological change scenario considers best technol-ogy possibilities for ICT, main appliances and fabric ma-terials without taking into account the cost effectivenessof the interventions but considering any technological im-provement as an investment for cutting energy consump-tion. In this scenario, the house has been re-refitted withthe best windows in the market, better and deeper loft in-sulation, insulation under the ground floor, surface insula-tion on the already filled cavity walls and a new insulatedprincipal door; the boiler is replaced by a new best efficientcondensing boiler and ICT is installed all through the houseto smartly control the heating system and each radiator;only occupied spaces are heated and the ‘all off’ home modeis used when the house is empty. The rebound effect takesplace through increasing householders expectations for ther-
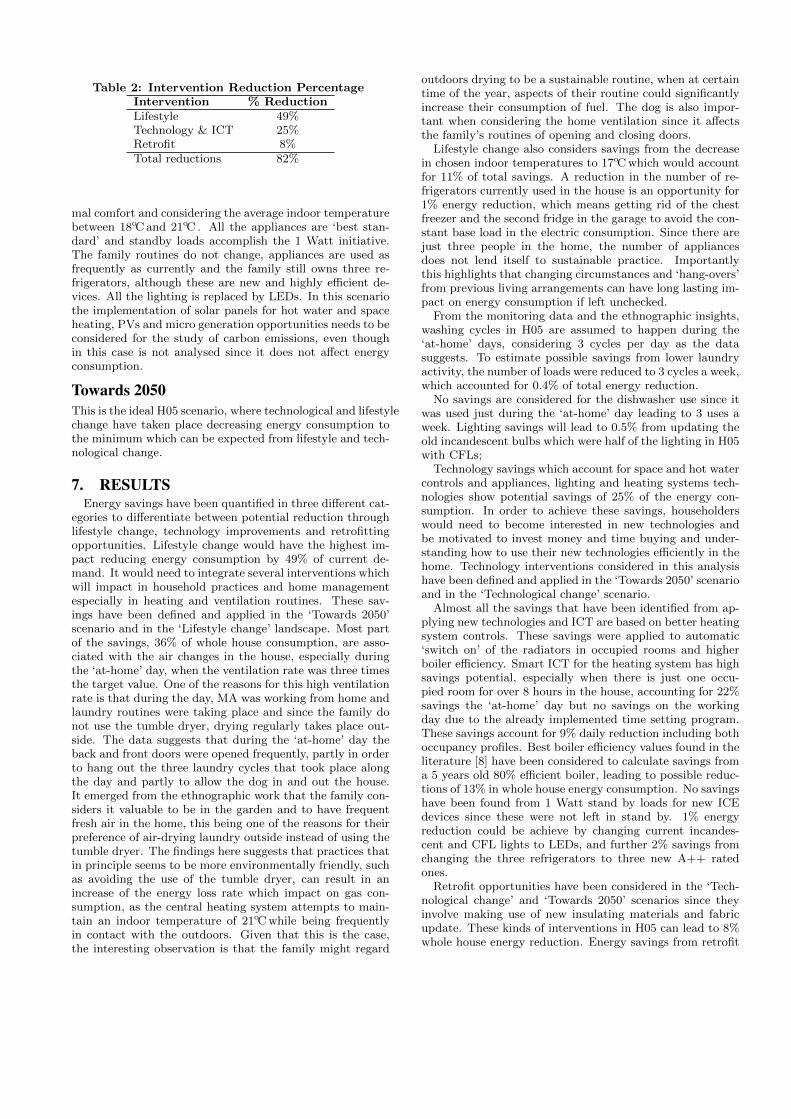
Table 2: Intervention Reduction PercentageIntervention % ReductionLifestyle 49%Technology & ICT 25%Retrofit 8%Total reductions 82%
mal comfort and considering the average indoor temperaturebetween 18oC and 21oC . All the appliances are ‘best stan-dard’ and standby loads accomplish the 1 Watt initiative.The family routines do not change, appliances are used asfrequently as currently and the family still owns three re-frigerators, although these are new and highly efficient de-vices. All the lighting is replaced by LEDs. In this scenariothe implementation of solar panels for hot water and spaceheating, PVs and micro generation opportunities needs to beconsidered for the study of carbon emissions, even thoughin this case is not analysed since it does not affect energyconsumption.
Towards 2050This is the ideal H05 scenario, where technological and lifestylechange have taken place decreasing energy consumption tothe minimum which can be expected from lifestyle and tech-nological change.
7. RESULTSEnergy savings have been quantified in three different cat-
egories to differentiate between potential reduction throughlifestyle change, technology improvements and retrofittingopportunities. Lifestyle change would have the highest im-pact reducing energy consumption by 49% of current de-mand. It would need to integrate several interventions whichwill impact in household practices and home managementespecially in heating and ventilation routines. These sav-ings have been defined and applied in the ‘Towards 2050’scenario and in the ‘Lifestyle change’ landscape. Most partof the savings, 36% of whole house consumption, are asso-ciated with the air changes in the house, especially duringthe ‘at-home’ day, when the ventilation rate was three timesthe target value. One of the reasons for this high ventilationrate is that during the day, MA was working from home andlaundry routines were taking place and since the family donot use the tumble dryer, drying regularly takes place out-side. The data suggests that during the ‘at-home’ day theback and front doors were opened frequently, partly in orderto hang out the three laundry cycles that took place alongthe day and partly to allow the dog in and out the house.It emerged from the ethnographic work that the family con-siders it valuable to be in the garden and to have frequentfresh air in the home, this being one of the reasons for theirpreference of air-drying laundry outside instead of using thetumble dryer. The findings here suggests that practices thatin principle seems to be more environmentally friendly, suchas avoiding the use of the tumble dryer, can result in anincrease of the energy loss rate which impact on gas con-sumption, as the central heating system attempts to main-tain an indoor temperature of 21oC while being frequentlyin contact with the outdoors. Given that this is the case,the interesting observation is that the family might regard
outdoors drying to be a sustainable routine, when at certaintime of the year, aspects of their routine could significantlyincrease their consumption of fuel. The dog is also impor-tant when considering the home ventilation since it affectsthe family’s routines of opening and closing doors.
Lifestyle change also considers savings from the decreasein chosen indoor temperatures to 17oC which would accountfor 11% of total savings. A reduction in the number of re-frigerators currently used in the house is an opportunity for1% energy reduction, which means getting rid of the chestfreezer and the second fridge in the garage to avoid the con-stant base load in the electric consumption. Since there arejust three people in the home, the number of appliancesdoes not lend itself to sustainable practice. Importantlythis highlights that changing circumstances and ‘hang-overs’from previous living arrangements can have long lasting im-pact on energy consumption if left unchecked.
From the monitoring data and the ethnographic insights,washing cycles in H05 are assumed to happen during the‘at-home’ days, considering 3 cycles per day as the datasuggests. To estimate possible savings from lower laundryactivity, the number of loads were reduced to 3 cycles a week,which accounted for 0.4% of total energy reduction.
No savings are considered for the dishwasher use since itwas used just during the ‘at-home’ day leading to 3 uses aweek. Lighting savings will lead to 0.5% from updating theold incandescent bulbs which were half of the lighting in H05with CFLs;
Technology savings which account for space and hot watercontrols and appliances, lighting and heating systems tech-nologies show potential savings of 25% of the energy con-sumption. In order to achieve these savings, householderswould need to become interested in new technologies andbe motivated to invest money and time buying and under-standing how to use their new technologies efficiently in thehome. Technology interventions considered in this analysishave been defined and applied in the ‘Towards 2050’ scenarioand in the ‘Technological change’ scenario.
Almost all the savings that have been identified from ap-plying new technologies and ICT are based on better heatingsystem controls. These savings were applied to automatic‘switch on’ of the radiators in occupied rooms and higherboiler efficiency. Smart ICT for the heating system has highsavings potential, especially when there is just one occu-pied room for over 8 hours in the house, accounting for 22%savings the ‘at-home’ day but no savings on the workingday due to the already implemented time setting program.These savings account for 9% daily reduction including bothoccupancy profiles. Best boiler efficiency values found in theliterature [8] have been considered to calculate savings froma 5 years old 80% efficient boiler, leading to possible reduc-tions of 13% in whole house energy consumption. No savingshave been found from 1 Watt stand by loads for new ICEdevices since these were not left in stand by. 1% energyreduction could be achieve by changing current incandes-cent and CFL lights to LEDs, and further 2% savings fromchanging the three refrigerators to three new A++ ratedones.
Retrofit opportunities have been considered in the ‘Tech-nological change’ and ‘Towards 2050’ scenarios since theyinvolve making use of new insulating materials and fabricupdate. These kinds of interventions in H05 can lead to 8%whole house energy reduction. Energy savings from retrofit

measures in H05 are mainly expected from the insulation ofthe ground floor, which is not just an expensive measure buta disruptive process as well.
The best expectable future picture is the ‘Towards 2050’which is hopeful since 82% of the energy can be saved by ap-plying lifestyle and technological interventions. This land-scape is especially challenging, since it affects some of thefamily routines, the way they control their heating and theirindoor temperature choice. Furthermore, it requires an im-portant economic investment to update appliances, systemsand fabric. The other two scenarios draw half way land-scapes. ‘Technological change’ describes a possible H05 wherefabric and systems are best standard but householders chooseto have a comfortable and convenient lifestyle which stillmeans reducing their energy consumption by 33%. Thelifestyle scenario has more potential savings, requiring a rad-ical shift in home management and in some everyday prac-tices such as laundry and shopping, resulting in 49% energyreduction.
8. DISCUSSIONH05’s potential savings are in line with 2050 goals. More
than half of the savings that could be achieved in this house-hold affect householders’ thermal comfort and family prac-tices. Most of the savings found in the analysis are in reduc-ing energy demand for space heating, which is expected sinceelectricity accounted for 9% of whole energy consumption.
H05 have already applied some sustainable practices suchas leaving ICE devices off when not in use or avoiding the useof the tumble dryer. What they might not be aware of is theamount of energy that can be wasted if doors/windows areopen frequently and/or for long periods of time, even moreso on a cold winter day and when having set the heating pro-grammer to a high indoor temperature. The family effortstowards energy reduction need to be permanently fed backto avoid unexpected rebound effects which can lead to un-aware energy consumption like leaving doors open frequentlyor heating the whole house all day long when working fromhome.
Household occupancy is determinant of energy consump-tion [36], therefore occupancy patterns will be most impor-tant when targeting domestic energy reduction, questioningthe sustainability of teleworking, which leads to space heat-ing, lighting and all sorts of resources that enable an indi-vidual working space. On the other hand, some trends suchas US size appliances especially in cold appliances and theownership of more than one refrigerator [49] per householdneed to be taken into account for sustainable standards; athree member family owning three refrigerators which arepermanently on might be prohibitive in a world of risingcommodity prices and resource scarcity [22]. The adoptionof lower ownership levels for cold appliances will need to gohand in with more frequent shopping which in this case willresult in an important lifestyle change.
9. CONCLUSIONSIn this paper possible energy reductions have been quan-
tified and categorised to identify CO2 savings from expectedinterventions in household energy consumption towards 2050.This approach needs to be located in the broader picture offuture scenarios which predict CO2 savings from the do-mestic sector, not just from changes in energy demand but
also from changes in energy production and distribution.New technologies, greener lifestyles, best building thermalbehaviour and better household controls will be indispens-able parts of the savings, but the impact of lower carbonemissions from energy production is a great percentage ofthe expected reduction. Renewable energy production istargeted to increase in future scenarios depending on eco-nomic and technological development. This will result inlower carbon intensive electricity, fuel shift for space heat-ing and hot water, and the implementation of smart gridswhich will give price signals to adapt appliance time of useto energy availability. Further analysis will look at carbonreduction opportunities based on low carbon technologiesand resources. These are described in future scenarios suchas the electrification of the heating, the implementation ofheat pumps, natural gas networks, and renewable sourcesmaking up 15% of the energy production. Other measuresconsidered in the de-carbonisation of the housing stock arethe increase of micro generation and local energy produc-tion.
The outcomes from this analysis are relative to two daysof data, further work is needed in order to confirm conclu-sions and complete the picture given here. Since both daysof study are two winter days, savings from space heating andventilation loses are magnified, therefore annual savings areexpected to be lower. Thus, the application of this model tolonger monitoring periods and to a greater number of house-holds will amplify the results, which will make it possible tostudy hot water usage patterns, showering, cooking and ICEuse in more depth.
10. NOMENCLATURE
Qg Gas flow rate MJQe Electric flow rate MJQp Personal heat rate MJQw Hot water flow rate MJQf Fabric heat loss MJQv Ventilation heat loss MJCvg Gas Calorific Value MJm−3
Vg Gas volume m3
mw Water mass kgCpw specific heat capacity Jkg−1K−1
nh efficiency −
11. ACKNOWLEDGMENTSThis paper forms part of the work produced on the LEEDR:
Low Effort Energy Demand Reduction Project based at Lough-borough University, UK. The work was funded through theTEDDI call managed by the RCUK Digital Economy andEnergy programmes (EPSRC Grant Number EP/I000267/1).
12. REFERENCES[1] H. Allcott. Social norms and energy conservation.
Journal of Public Economics, 95(9):1082–1095, 2011.
[2] K. Anderson. Decarbonising the UK: Energy for aclimate conscious future. Tyndall Centre for ClimateChange Research, 2005.
[3] G. Ault, D. Frame, N. Hughes, and N. Strachan.Electricity network scenarios for great britain in 2050.

Final Report for OfgemaAZs LENS project(Ref.No.157a/08), London: Ofgem, 2008.
[4] I. Ayres, S. Raseman, and A. Shih. Evidence from twolarge field experiments that peer comparison feedbackcan reduce residential energy usage. 2009.
[5] Behavioural Insights Team. Behaviour change andenergy use. Cabinet Office, London(availableat)/http://www.cabinetoffice.gov.uk/resourcelibrary/behaviour-change-and-energy-useS,2011.
[6] R. G. Bittle, R. Valesano, and G. Thaler. The effectsof daily cost feedback on residential electricityconsumption. Behavior modification, 3(2):187–202,1979.
[7] B. Boardman. Examining the carbon agenda via the40% house scenario. Building ResearchandInformation, 35(4):363–378, 2007.
[8] B. Boardman, S. Darby, G. Killip, M. Hinnells, C. N.Jardine, J. Palmer, G. Sinden, K. Lane, R. Layberry,and A. Wright. 40% house. 2005.
[9] B. Boardman and S. J. Darby. Effective Advice: energyefficiency and the disadvantaged. EnvironmentalChange Institute, University of Oxford, 2000.
[10] G. Brandon and A. Lewis. Reducing household energyconsumption: a qualitative and quantitative fieldstudy. Journal of Environmental Psychology,19(1):75–85, 1999.
[11] R. Buswell. Uncertainty in whole house monitoring. Inproceedings of 2013 Conference in BuildingSimulation, 2013.
[12] M. Coleman, N. Brown, A. Wright, and S. K. Firth.Information, communication and entertainmentappliance useaASinsights from a uk household study.Energy and Buildings, 2012.
[13] S. Darby. Smart metering: what potential forhouseholder engagement? Building Research andInformation, 38(5):442–457, 2010.
[14] Department of Energy and Climate Change. Thecarbon plan: Delivering our low carbon future.Technical report, 2011.
[15] Department of Energy and Climate Change. Planningour electric future: a white paper for secure, affordableand low-carbon electricity, volume 8099. StationeryOffice, 2011.
[16] Department of Energy and Climate Change. Energyconsumption in the united kingdom: 2012. Technicalreport, 31 January 2013 2012.
[17] Department of Energy andClimate Change. 2050pathways. Technical report, 2010.
[18] Department of Trade and Industry. Energy whitepaper 2007 meeting the energy challenge, 2007.
[19] I. Elders, G. Ault, S. Galloway, J. McDonald,J. Kohler, M. Leach, and E. Lampaditou. Electricitynetwork scenarios for great britain in 2050. 2006.
[20] European Comission. World energy technologyoutlook h2. Technical report, 2005.
[21] forum for the future. Consumers future 2020.Technical report, May 2013 2011.
[22] forum for the future. Which. consumers in 2030forecast and projections for life in 2030. Technicalreport, January 2013 2013.
[23] Heating and hot water Taskforce. Heating and hotwater pathways to 2020. Technical report, 2010.
[24] ILEX. The balance of power- reducing co2 emissionsfrom the uk power sector. Technical report, 2006.
[25] Institute of Innovation Research. Scenario exercise onmoving towards a sustainable energy economy.Technical report, University of Manchester, 2004.
[26] International Energy Agency. World energy outlook.Technical report, 2008a.
[27] International Energy Agency. Energy technologiesperspectives. Technical report, 2008b.
[28] A. Molderink, V. Bakker, M. G. C. Bosman, J. L.Hurink, and G. J. M. Smit. Management and controlof domestic smart grid technology. Smart Grid, IEEETransactions on, 1(2):109–119, 2010.
[29] N. Nakicenovic, J. Alcamo, G. Davis, B. de Vries,J. Fenhann, S. Gaffin, K. Gregory, A. Grubler, T. Y.Jung, and T. Kram. Special report on emissionsscenarios: a special report of Working Group III of theIntergovernmental Panel on Climate Change, 2000.
[30] nationalgrid. Uk future energy scenarios. Technicalreport, 2011.
[31] J. M. Nolan, P. W. Schultz, R. B. Cialdini, N. J.Goldstein, and V. Griskevicius. Normative socialinfluence is underdetected. Personality and SocialPsychology Bulletin, 34(7):913–923, 2008.
[32] D. of Energy and C. Change. Smart meteringimplementation programme: Response to prospectusconsultation. Technical report, 2011.
[33] Office of Science and Technology. Foresight scenarios.Technical report, 1999.
[34] P.Cosar, R.a.Buswell, L.H.Webb, L. Mackley, andR. ans S.Pink. Energy in the home: Everyday life andthe effect on time of use. In proceedings of 2013Conference in Building Simulation, 2013.
[35] W. Poortinga, L. Steg, C. Vlek, and G. Wiersma.Household preferences for energy-saving measures: Aconjoint analysis. Journal of Economic Psychology,24(1):49–64, 2 2003. ID: 50.
[36] I. Richardson, M. Thomson, D. Infield, andC. Clifford. Domestic electricity use: A high-resolutionenergy demand model. Energy and Buildings,42(10):1878–1887, 2010.
[37] A. Roscoe and G. Ault. Supporting high penetrationsof renewable generation via implementation ofreal-time electricity pricing and demand response. IETRenewable Power Generation, (1752-1416), 2010. ID:20.
[38] Royal Commission on Environmental Pollution. Theclimate change. Technical report, 2000.
[39] O. G. Santin. Behavioural patterns and user profilesrelated to energy consumption for heating. EnergyandBuildings, 43(10):2662–2672, 2011.
[40] Shell International BV. Shell energy scenarios to 2050.Technical report, 2008.
[41] E. P. Skea, J. and M. Winskel. Energy 2050: Makingthe transition to a secure low energy system.Earthscan, 2011.
[42] N. Strachan, R. Kannan, and S. Pye. Scenarios andsensitivities on long-term uk carbon reductions usingthe uk markal and markal-macro energy system
models. London: UKERC Research Report, 2, 2008.
[43] F. O. the Earth. A bright future: Friends of theearth’s electricity sector model for 2030. Technicalreport, 2006.
[44] The Technology Strategy Board. Retrofit revealed. theretrofit for the future projects-data analysis report.Technical report, 17 of April 2013 2013.
[45] UK climate Impacts programme. Socio-economicscenarios for climate change impact assessment.Technical report, 2000.
[46] UK Energy Research Centre. Making the transition toa secure and low carbon energy system:synthesisreport. 2009.
[47] WADE. Decentralising uk energy. Technical report,Greenpeace, 2006.
[48] A. Warde. Consumption and theories of practice.Journal of consumer culture, 5(2):131–153, 2005.
[49] J.-P. Zimmermann, M. Evans, J. Griggs, N. King,P. Roberts, and C. Evans. Household electricity surveya study of domestic electrical product usage. TechnicalReport R66141, 2012. ID: 9.