estimating the multiplier effects of tourism expenditures...
TRANSCRIPT

Estimating the Multiplier Effects of Tourism Expenditures on a Local Economy through a Regional Input-Output Model
by Endre Horváth and Douglas C. Frechtling
Published in Journal of Traveo Research vol. 37, no. 4 (May 1999), pp. 324-332.
ABSTRACT
Tourism benefits regional economies through increased output, labor earnings and employment. Tourism multipliers embody the total increase in output, labor earnings and employment through interindustry linkages in a region as a result of tourism expenditures. The RIMS II regional input-output model was employed to estimate the multiplier effects of visitor expenditures in Washington, D.C. Both normal and ratio multipliers were analyzed, and the latter was found to be a more reliable indicator of total impact. A comparison of multipliers for 37 industries and the tourism sector in the city shows that tourism ranks relatively high in terms of output and labor earnings generated. These findings suggest recommendations for the economic growth and development of Washington, D.C.
Tourism, “the activities of persons traveling to and staying in places outside their usual environment for not more than one consecutive year for leisure, business and other purposes” (UN/WTO 1994, p. 5), can generate sales and output1, labor earnings and employment in a nation, or a province, state, department, municipality, or other local area within a nation. These economic contributions are of interest to private businesses, public agencies and individuals living in areas that tourists visit. Informed private decision-making and public policy requires that executives, officials, employees and their dependents understand the contribution that tourists make to the local economy, including those businesses directly serving visitors and those that supply these businesses. 1 It is conceptually true that sales receipts are different from the value of output necessary to consummate the transaction. The former is the value of what is sold, comprising what is immediately produced for sale and what is sold out of inventory. Output, on the other hand, is what is produced, comprising what is sold immediately and what is placed “on the shelf” for future sale. As a practical matter in tourism analysis, relatively little of what is sold to visitors comes out of inventory since most of what tourists buy are services. The latter are produced at the time they are consumed, so there is little violence done to theory to equate sales with output in this context. Since the term, “output” is preferred by the expositors of the RIMS II analysis discussed in this study, it is the term used herein.

2
A great deal has been published about the contributions of tourism to national, regional and local economies (e.g., Bull 1991, Fletcher 1994b, Frechtling 1994a, Lundberg, Krishnamoorthy and Stavenga 1995, U.S. Travel Data Center 1991, World Travel and Tourism Council 1996). Most of these studies include estimates of what tourists or visitors to an area spend while there, which generates economic activity directly in the form of output or sales, labor earnings and employment. Many of these studies have presented estimates of the so-called “multiplier impact” of tourism expenditures: the total sales, output or other measure of economic benefits generated once the initial visitor spending has worked its way through the economy under study through inter-industry transactions (the “indirect impact”) and through employee consumption expenditures (the “induced impact”). A significant number of these studies employ input-output models to explore these total economic effects. However, a common complaint about such models is that they are expensive to develop at the regional level given their extensive data requirements (e.g., Fletcher 1994b, p. 478; Frechtling 1994a, pp. 386-387). The purpose of the study is to explore the estimation of the total contributions to a local economy attributable to tourism spending through the use of a regional input-output model that can produce multiplier estimates for any single or multi-county region of the U.S. Pursuant to this, the study examines several types of economic multipliers useful to tourism analysis, including partial multipliers, normal multipliers and ratio multipliers, each of which can be used to estimate sales transactions, output, income and employment attributable to tourism spending in a local area. This study extends the work of Mak (1989), which applied a set of statewide multipliers derived from a regional input-output system operated by the U.S. Department of Commerce to 1983 estimates of tourism expenditures in each of the 50 states and the District of Columbia. The next section identifies the objectives and scope of the study. The second section presents an overview of literature on the economic impacts of tourism and lists a number of national and regional tourism multipliers. The third section presents the methodology and the data required to apply the RIMS II multipliers to a given region. The fourth section applies the RIMS II multipliers to the city of Washington, D.C. and analyzes the results. The final section provides conclusions and recommendations.
SCOPE OF THE STUDY

3
Specifically, this study pursues the following objectives:
• how the regional input-output system of the U.S. Department of Commerce can be used to estimate the direct, indirect and induced impacts of tourism expenditures on sales/output, labor earnings and employment in a local economy;
• comparison of the validity of normal or final-demand multipliers to ratio or direct-effect multipliers in estimating such local impacts;
• comparison of the tourism multiplier for an area to multipliers for other sources of economic activity;
• effect of geographic extent of the area on the size of the tourism multiplier;
This study is limited to the contributions of tourism to the output, labor earnings and employment in a region. A wider scope of analysis could encompass the social, cultural and environmental impacts of such visitors. Additional research could also identify the costs to the jurisdiction of hosting visitors, that could be compared to the jurisdiction’s revenues visitors generate through taxes and fees. Finally, the input-output technique has some serious conceptual and operational drawbacks (Briassoulis 1991, Fletcher 1994b, Frechtling 1994a, Hughes 1994), yet this study does not attempt to correct these.
LITERATURE REVIEW
To aid discussion of development of tourism multipliers, extant studies of tourism’s economic impact can be broken down into four categories: methodologies, case studies, assessments, and summaries. The following is based upon review of more than 100 studies gathered by the authors on the economic impact of tourism published in English. Methodologies The economic impact of tourism has been studied extensively by researchers for a quarter of a century. In one of the earliest methodological articles (Archer 1973), the author identifies four major factors in determining the impact of tourism in an area: the nature of the main facility, the number of visitors, spending by visitors and the degree to which spending recirculates in the local economy. In practice, reliable estimates of tourism expenditures and valid information on the structure of the local economy are sufficient to estimate tourism economic impacts. Frechtling (1974, 1994a) outlines a cost-factor model for estimating travel expenditures at the national and regional level. His major proposition is that tourists have difficulty reporting their expenditures in a jurisdiction accurately,

4
but they can report certain activity measures reliably. The latter include number of nights spent, type of accommodation used, season of the year the trip was taken, travel party size and transportation used. The volume of such activities can be translated into expenditure estimates by multiplying them by the per-unit costs of each activity derived from various administrative records. The resulting expenditure estimates in a jurisdiction can then be incorporated in a regional input-output model to determine the multiplier effects. Fletcher (1989, 1994a) identifies input-output analysis as a relatively reliable method to trace the effects of initial tourism spending in an economy. Alternative methodologies include cost-benefit analysis and ad hoc multipliers (Fletcher 1994b). According to Fletcher, input-output models are preferable since they operate in a general equilibrium framework, provide a comprehensive view of the economy, pay attention to sectoral interdependencies, and are flexible and policy neutral. Weaknesses of input-output analysis include the assumption of uniform consumption functions for all household income levels, the aggregation of competitive and non-competitive imports, massive data requirements, and the static nature of input-output models. Leontief (1985) presents input-output modeling in its theoretical form. Multipliers can be calculated to show the benefits of tourism which include increased output, earnings and employment. Multipliers are derived from input-output tables representing the structure of an economy. Input-output tables are prepared in 80 countries at the national, regional and metropolitan level. Miller and Blair (1985) demonstrate several applications of input-output modeling, including the evaluation of energy requirements and environmental impacts. They show how higher inter-industry linkages increase the multiplier effect of an initial change in final demand. O'Connor and Henry (1975) discuss the treatment of competitive and non-competitive imports, subsidies and indirect taxes, and the valuation of unsold produce. He emphasizes the necessity to periodically update input-output tables. Archer and Fletcher (1990) show how input-output modeling can be used to estimate the economic impacts of tourism. They point out that all exogenous injections of expenditure into an economy have a multiplier effect, and tourism is only one of them. These authors identify the major policy implications of multiplier analysis. They contend that input-output analysis is a valid measure of short term economic impacts rather than of the overall efficiency of resource allocation. Archer and Fletcher assert that policy implications concern the structure of the economy, backward and forward inter-industry linkages, supply constraints, and capital and labor intensities.

5
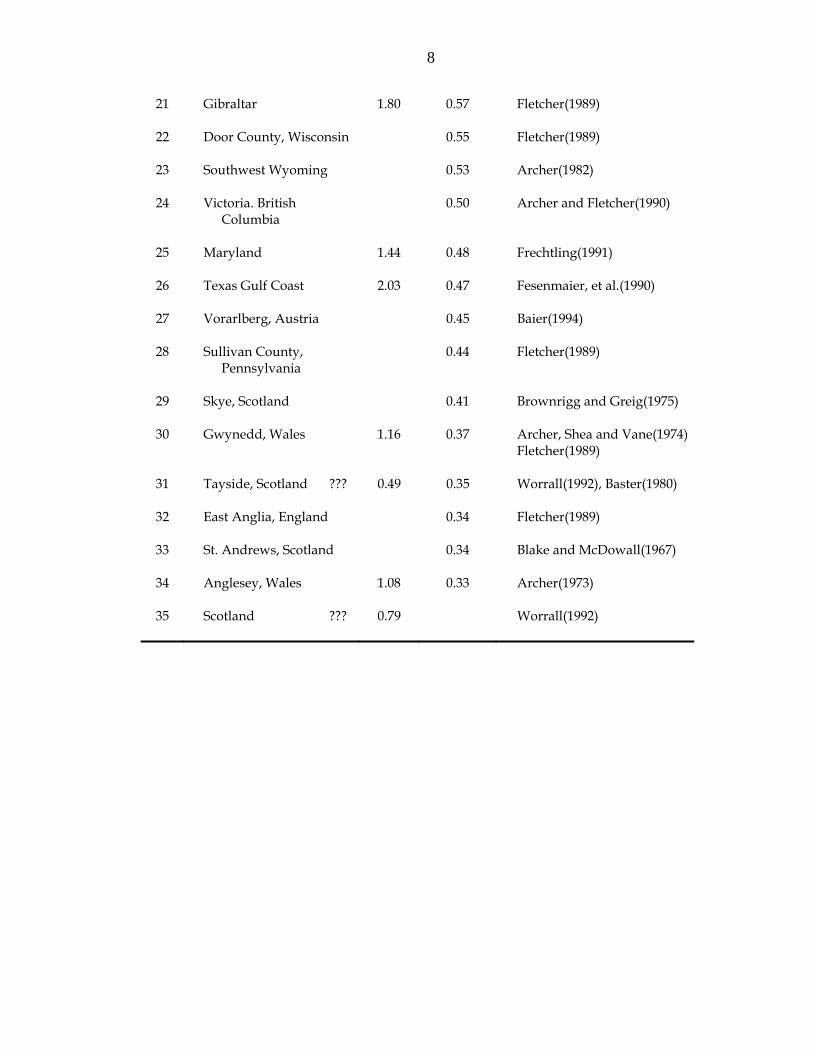
According to Archer and Fletcher, input-output analysis has three major uses. First, it can be used to analyze public and private investments. Second, it helps simulate the impact of new tourism developments. Third, it can be used to compare the relative magnitudes of impacts made by different types of tourism, and those made by tourism versus other sectors of the economy. Mak (1989) obtained estimates of the output, earnings and employment multipliers for each of the U.S. states from the RIMS II regional input-output system developed and operated by the U.S. Department of Commerce. This study extends that work in two ways. First, it includes only tourism expenditures made by visitors while visiting the area under study, excluding those made in the traveler’s home area (e.g., passenger fares) and certain imputed expenditures (e.g., fixed automobile expenses). Second, it adjusts tourism expenditures to be consistent with final demand as defined in the RIMS II system. In addition, this study employs the most recent multiplier estimates available to produce estimates for 1994. Case studies Tourism impact models in one form or another have been built for over seventy regions and countries according to the studies listed as references. It must be noted that interregional or international comparisons are difficult to make due to differences in methodology. Generally, the tourism multipliers are highest for large economies with strong inter-industry linkages and low import leakages. Table 1 and Table 2 present a number of multipliers identified for different regions and countries for different years, ranked by their earnings multipliers. Note that the conceptual bases for calculating the employment multipliers is not standardized across studies, making it difficult to make consistent comparisons of employment multipliers. Consequently, they are not included here. The output and earnings multipliers provide a good basis for comparison, as the methodologies are virtually the same across different studies. These multipliers are multiplied by tourism expenditures at either purchasers’ prices or producers’ prices to obtain the output or labor earnings, respectively, generated by indirect and induced effects of the initial expenditures. The tourism earnings multiplier tends to be higher in larger regions and countries with self-sufficient economies, and lower in smaller regions and countries where earnings leak out of the economy through importing goods and services to satisfy tourism demand. The positive relationship between the size of the region and the value of the multiplier is strongly supported by the results in Table 1, where small regions rank lower. The pattern is less evident in the case of

6
the countries listed in Table 2, where some relatively small economies, such as Ireland rank high, and some large economies, such as the United States, rank low. The sources of the data are indicated in the right hand columns of the tables. The latest estimates have been used in each case. Not all studies are equally rigorous, and methodologies differ somewhat across studies.

7
Table 1: Tourism output and earnings multipliers in selected regions ranked by earnings multipliers
Rank
Region
Multipliers
Source
Output Earnings
1
Michigan
2.25
Gartner and Holecek(1983)
2 New Hampshire,
1.70 Pigram and Cooper(1980)
3 Northern Cyprus 2.00 1.30 Bicak and Altinary(1996)
4 Devon, Cornwall 1.29 Archer YEAR??
5 Puerto Rico 2.08 1.24 Ruiz(1985)
6 Northern Ireland 1.20 Archer and Fletcher(1990)
7 Chicago, Illinois 1.10 Tiebout(1960)
8 Indian Ocean 1.03 Archer(1982)
9 Miami, Florida 1.76 0.93 Mescon and Vozikis(1985)
10 Massachusetts 0.89 Cournoyer(1982)
11 Missouri 0.88 Fletcher(1989)
12 Hong Kong 0.98 0.87 Lin and Sung(1983)
13 Hawaii 0.80 Liu(1986)
14 Walworth County, Wisconsin
0.78 Fletcher(1989)
15 Washington, D.C. metropolitan area
1.63 0.74 Fuller(1995)
16 British Columbia 1.50 0.65 Liu and Var(1982)
17 Galveston, Texas 0.64 Rose(1981)
18 Colorado 0.60 Fletcher(1989)
19 Oregon 1.21 0.60 Johnson and Moore(1993)
20 British Virgin Islands
1.98 0.58 Encontre(1989), Archer(1982)
8
21 Gibraltar 1.80 0.57 Fletcher(1989)
22 Door County, Wisconsin
0.55 Fletcher(1989)
23 Southwest Wyoming
0.53 Archer(1982)
24 Victoria. British Columbia
0.50 Archer and Fletcher(1990)
25 Maryland 1.44 0.48 Frechtling(1991)
26 Texas Gulf Coast 2.03 0.47 Fesenmaier, et al.(1990)
27 Vorarlberg, Austria 0.45 Baier(1994)
28 Sullivan County, Pennsylvania
0.44 Fletcher(1989)
29 Skye, Scotland 0.41 Brownrigg and Greig(1975)
30 Gwynedd, Wales 1.16 0.37 Archer, Shea and Vane(1974) Fletcher(1989)
31 Tayside, Scotland ??? 0.49 0.35 Worrall(1992), Baster(1980)
32 East Anglia, England
0.34 Fletcher(1989)
33 St. Andrews, Scotland
0.34 Blake and McDowall(1967)
34 Anglesey, Wales 1.08 0.33 Archer(1973)
35 Scotland ??? 0.79 Worrall(1992)

9
Table 2. Tourism multipliers in selected countries ranked by earnings multipliers.
Rank
Country
Multipliers
Source
Output Earnings
1
Pakistan
3.30
Pigram and Cooper(1980)
2 Australia 2.52 Archer(1984b), Cooper and Pigram(1984)
3 Turkey 1.52 2.03 Liu, Var and Timur(1984)
4 Yugoslavia 3.56 1.99 Janez(1979)
5 United Kingdom 1.73 Fletcher(1989)
6 Ireland 1.72 Fletcher(1989)
7 Canada 1.70 Archer(1984b)
8 Sri Lanka 1.59 Archer(1989)
9 Lebanon 1.40 Archer(1984b)
10 Egypt 1.23 Fletcher(1989)
11 Bermuda 2.66 1.22 Archer and Fletcher(1990), Archer(1995a)
12 Dominica 1.20 Fletcher(1989)
13 Greece 1.20 Archer(1984b)
14 Cyprus 1.14 Archer(1989)
15 Solomon 0.99 Archer and Fletcher(1990)
16 Mauritius 0.97 Archer and Fletcher(1990)
17 Singapore 2.00 0.94 Khan, Seng and Cheong(1990)
18 Seychelles 0.88 Archer and Fletcher(1996)
19 Antigua 0.88 Fletcher(1989)
20 Bahamas 2.25 0.88 Archer and Fletcher(1990)

10
21 Tanzania 1.59 0.85 Curry(1986)
22 Philippines 1.87 0.82 Santos, et al.(1983), Archer(1989)
23 Fiji 0.82 Curry(1986)
24 Nepal 0.76 Curry(1986)
25 Italy 0.71 Costa(1984)
26 USA 2.40 0.68 U.S. Travel Data Center(1996)
27 West Samoa 0.66 Archer(1989), Archer and Fletcher(1990)
28 Cayman 0.65 Fletcher(1989)
29 Kenya 1.81 0.64 Summary(1986)
30 Iceland 0.64 Fletcher(1989)
31 Jamaica 0.60 Fletcher(1989)
32 Malta ??? 0.86 0.56 Briguglio(1992)
33 Cook Islands ??? 0.55 Milne(1987)
34 St. Lucia 0.55 Seward and Spinrad(1982)
35 Palau 0.51 Archer and Fletcher(1990)
36 Belize 2.11 0.41 Lindberg and Enriquez(1994)
37 Barbados 1.41 Armstrong, Daniel and Francis(1974)
38 Korea 1.42 Song and Ahn(1983)
The following appeared to be especially rigorous and well-documented studies of tourism impact: Archer and Fletcher(1996) on the Seychelles, Armstrong, Daniel and Francis (1974) on Barbados, Curry(1986) on Tanzania, Diamond(1981) on Singapore, and Strang(1970) on Wisconsin. Assessments As the number of tourism impact studies has grown, the increasing likelihood that faulty methodologies have been employed has been recognized and voiced in a number of critical articles. Archer(1976b) calls attention to the

11
abuses of multipliers that undermine the credibility of tourism research. Most abuses result from overlooking the limitations of multiplier studies. Briassoulis (1991) and Hughes (1994) highlight weaknesses and limitations of input-output modeling that are often forgotten. Briassoulis discusses three limiting assumptions underlying input-output modeling: linear homogenous production functions, the lack of capacity constraints, and the existence of unemployment. She points out that the first assumption is not valid if there is substitution and the coefficients of the production functions change. The latter will happen if tourism is a new industry in a region. Furthermore, input-output analysis should be linked with cost-benefit studies of cultural and environmental impacts in order to obtain complete results. Hughes (1994) describes the confusion caused by the use of a number of different methodologies and multipliers. He points out that expenditure data have limited predictive value. Hughes argues that applying input-output models from other regions to an area is faulty methodology. He emphasizes that multiplier analysis ignores that all rounds of spending need time to take place, and that this time will usually exceed the single calendar year assumed in input-output analysis. Furthermore, Hughes warns that adding up impact estimates of total earnings would exceed 100% of the GDP, therefore the total impact of tourism spending should not be expressed as a percentage of GDP. He argues that different geographic areas and methods cannot be compared, but different industries of the same economy should always be contrasted. Bryden and Faber (1971), and Levitt and Gulati (1970) contend that unrealistic multiplier values will support otherwise unjustified development policies. Both studies scrutinize the methodology of Zinder (1969). They point out that Zinder's study presents a transactions multiplier that was obtained by multiple counting of value added in consecutive rounds of spending. The authors recommend alternative methods, such as Keynesian multipliers or input-output modeling. The following articles and books provide useful summaries and bibliographies of the tourism impact literature: Archer (1977b), Commonwealth Agricultural Bureaux (1984), Fletcher (1989), Fletcher (1994a), Frechtling (1994a), and Yee (1993).
METHODOLOGY
The impact of tourism on the Washington, D.C. economy in 1994 serves as a case to demonstrate the use of a particular regional input-output model available for all areas of the U.S. Two sets of data are required to carry out an

12
input-output analysis to demonstrate the impact of tourism expenditures on output, earnings and employment in a region such as the city of Washington. Tourism’s economic impact on a region begins with tourism expenditures, “the total consumption expenditure made by a visitor on behalf of a visitor for and during his/her trip and stay at destination” (UN/WTO 1994, p. 21). Consequently, the first data set required is a breakdown of tourism expenditures by category (e.g., local transportation, food, lodging), from visitor surveys or other sources indicating how much tourists spend on transportation, accommodation, food and other goods and services in the local economy. The second data set required comprises appropriate multipliers for estimating total output, earnings and employment generated by the tourism expenditures. This study employs multipliers derived from the RIMS II regional input-output model operated by the Bureau of Economic Analysis (BEA) of the U.S. Department of Commerce (Bureau of Economic Analysis 1997). Figure 1 details the process of using RIMS II multipliers to provide total impact estimates in a U.S. region and comprise the steps followed in this study.
Figure 1: Steps for Estimating the Total Impact of Tourism Expenditures in a Local Economy Using RIMS II Multipliers
1. Obtain tourism expenditures in the economy under study by
category of item purchased. 2. Remove retail sales taxes from those categories where such are
included in visitor expenditures to obtain the value of each item in terms of delivery to final (here, consumer) demand.
3. Match the expenditure categories with the RIMS II industries. 4. Obtain the RIMS II output, earnings and employment multipliers
for these industries from the BEA. 5. Multiply the tourism expenditures in each industry by the
appropriate final-demand multipliers to obtain total output, earnings and employment produced in the economy by the tourism expenditures. Or, alternatively, multiply income and employment directly generated by these expenditures by the appropriate direct-effect multipliers to obtain total earnings and employment produced by tourism expenditures.

13
6. Attempt to validate these estimates by comparing them with similar estimates obtained from other reliable sources.
For this study, estimates of visitor expenditures in Washington, D.C. were obtained from the U.S. Travel Data Center’s Travel Economic Impact Model (TEIM) for 1994 for 15 categories. The TEIM embodies the following definition of tourism expenditure: spending by U.S. residents on trips to places 100 miles away from home and trips including one or more nights in paid accommodations (U.S. Travel Data Center 1996, p. 42).2 Specifically, it excludes foreign visitor spending in the U.S., which probably produces a significant underestimate of total tourism expenditures in Washington, D.C. Of the 15 expenditure categories, expenditures on air transportation, bus transportation, rail transportation, boat transportation and fixed auto expenses were excluded since they relate predominantly to outbound tourism or are likely to be made in a visitor’s residence area. No expenditures appeared in the categories of campground lodging or second home lodging in the city. Of the remaining eight categories, three categories were found to include city sales taxes in the expenditure estimates ⎯ hotel lodging (14.7% on room rate), foodservice (10% on meal cost), automobile rental (13.1% on rental rate). The associated tax revenues were removed from the relevant expenditure categories because the RIMS II multipliers relate to final demand purchases from each industry net of such taxes (column 4). The 8 remaining TEIM expenditure categories were coded into the 5 RIMS II industry categories most closely related to them, as indicated in Table 3. As shown, a total value of $2.2 billion in goods and services was delivered to U.S. visitors to Washington, D.C. in 1994. The largest part of these expenditures occurred in the eating-and-drinking-place industry, while nearly as much was received by the combined hotel lodging and amusement and recreation services industries.
Table 3: The Relationship of TEIM Expenditure Estimates to RIMS II Industries for Washington, D.C., 1994
4. Tourism
final demand
2 Specifically excluded from this concept are those traveling (1) as part of an operating crew of a transport vehicle, (2) commuting to and from work, and (3) student trips to school or those taken while in school. (ibid.)

14
1. TEIM category
2. RIMS II code
3. RIMS II industry
expenditures ($million)
5. Distribu-tion
Taxicabs
24
Transportation
$34.1
2%
Auto gasoline, rental car gasoline, shopping
28 Retail trade 390.2 18%
Hotel lodging, entertainment/recreation
32 Hotels and other lodging places, amusement and recreation services
826.1 37%
Food 35 Eating and drinking places
871.0 39%
Auto rental 37 Miscellaneous services
84.7 4%
All $2,206.0 100%
Note: details may not add to totals due to rounding. Source: U.S. Travel Data Center The second edition of the BEA’s Regional Industrial Multiplier System, commonly called “RIMS II” was accessed to obtain multipliers appropriate to measuring the total economic impact of tourism in Washington, D.C. for 1994. The following section outlines the process used to produce these multipliers. RIMS II Methodology The BEA developed a method for estimating regional input-output multipliers in the 1970s and updated its estimates in early 1997 (Bureau of Economic Analysis, U.S. 1997; hereafter “BEA 1997”). The current revisions offer 1994 multiplier estimates for 37 industries and private households, which are considered “both suppliers of labor inputs to regional industries and purchasers of regional output” (BEA 1997, p. 21). This present article comprises one of the

15
first applications of the new estimates to examine the output, earnings and employment multipliers related to tourism spending in a region. RIMS II multipliers are developed in three steps (ibid.). First, the “make and use tables” of the national input-output accounts (1987 are the latest available) are adjusted to exclude imported commodities. The make and use tables show the amounts of each commodity used as input for the production of each commodity. Next, an “industry-share matrix” showing each industry’s share of the production of each commodity is computed and employed to produce a “commodity-by-industry direct requirements matrix”. This shows at the national level the dollar value of each commodity required to produce one dollar’s worth of each industry’s output. Finally, a national “industry-by-industry direct requirements table” is prepared, presenting each industry’s output as a proportion of a dollar’s output of each industry delivered to final demand. By convention, each column in the direct requirements table shows the inputs required by the industry listed at its head from the industries listed at the beginning of each row to produce one dollar of the column-industry's output. As part of this process, household earnings, including wages and salaries, proprietors’ income, directors’ fees, and employer contributions to health insurance less personal contributions for social insurance, are produced. These estimates are used to develop the earnings and employment multipliers. The second step is to prepare a regional direct requirements table. This can be done for any grouping of the more than 3,000 counties in the U.S. Given a study region, such as the District of Columbia, “location quotients” are used to produce regional interindustry requirements from the national table. The location quotient for a row industry indicates to what extent the study region’s “supply of an industry’s output is sufficient to meet regional demand” (ibid., p. 23), and is computed as “the ratio of the industry’s share of regional wages and salaries to that industry’s share of national wages and salaries” (ibid., p. 22). Consequently, a location quotient for a row industry greater than or equal to one indicates that all regional industries’ demands for the output of the row industry is met entirely from intra-regional production. On the other hand, if the location quotient for a row industry is less than one, this suggests that the industry’s output is not sufficient to supply intra-regional industries’ needs and a portion these needs must be satisfied from imports from outside the region. Such imports reduce the output produced within the region (often called “leakages”) and thus reduce the size of the multipliers associated with that industry. Such quotients are multiplied by the adjusted national direct requirements table to produce the regional direct requirements table.

16
The final adjustment to the national tables needed to produce the regional direct requirements table is to revise the household row entries based on the proportion of total workers in the region who commute from outside of it. This is to avoid over-estimating the purchases in the region by those employed within it. The regional direct requirements table must be transformed by matrix inversion to produce the total requirements table for the region, for this table supplies the multiplier estimates for output in the region for each industry. Final-demand earnings multipliers are based on the change in final demand produced by an activity such as tourism spending in the region and equals the output multiplier for an industry multiplied by the household-row entry in the direct requirements table. Final-demand employment multipliers are derived by multiplying the final-demand earnings multiplier for an industry by the ratio of jobs to earnings for the industry. This number represents the portion of a job in an industry related to one dollar of earnings for that job and is quite small, by convention it is expressed as jobs per $1 million in earnings. The final-demand earnings and employment multipliers, also called “normal” multipliers”, must be distinguished from “direct-effect”, or “ratio”, multipliers for individual industries (Frechtling 1994a, p. 383). The former comprise the ratio of the total earnings or employment to final demand, in this case, tourism expenditures in the region less sales taxes. The direct-effect earnings multiplier indicates the ratio of total earnings generated by the change in final demand to the earnings directly generated. Similarly, the direct-effect employment multiplier is the ratio of total employment generated to the number of jobs directly generated by the change in final demand. The final-demand multipliers are more useful for policy analysis because they indicate how much in total earnings can be generated by a given increase in tourism spending. Jurisdictions can use such multipliers to determine the total “bang for the buck” to be derived from stimulating an additional $1 million in tourism spending in the area through marketing programs. However, the BEA indicates the direct-effect earnings and employment multipliers will produce more accurate estimates of total effects if the earnings and employment directly attributable to and increase in final demand are available and are accurate. This is because the direct-effect multipliers are more sensitive in embodying the regional relationships between output on the one hand and earnings and employment on the other (ibid., p. 9).
RESULTS

17
Table 4 shows the RIMS II final-demand partial multipliers for each of the industries associated with tourism spending in Washington, D.C. in 1994.
Table 4: Final Demand Tourism Multipliers for Washington, D.C., 1994.
RIMS II
code
RIMS II industry
Output
Earnings
Employ-
ment*
24
Transportation
1.2549
0.2224
6.49
28 Retail sales 1.3534 0.2016 10.65
32 Hotels and other lodging places, amusement and recreation services
1.4594 0.1936 7.54
35 Eating and drinking places
1.2496 0.1475 9.81
37 Miscellaneous services
1.5031 0.1682 6.39
*number of jobs per $1 million of output delivered to final demand by the row industry Source: RIMS II tabulations obtained by the authors from the Bureau of Economic Analysis, 1997.
Multiplying each of these RIMS II final-demand multipliers (Table 4) by tourism final demand expenditures (i.e., expenditures net of sales taxes) (Table 3, column 4) produces the estimates of total output, earnings and employment generated in Washington, D.C. shown in Table 5.
Table 5: Estimates of Total Output, Earnings and Employment Generated by Tourism Expenditures based on RIMS II Final-demand Multipliers for
Washington, D.C., 1994

18
RIMS II code
RIMS II industry
Tourism
final demand
expenditures ($million)
Total output
($million)
Total earnings
($million)
Total employment
(jobs)
24
Transportation
$34.1
$42.8
$7.6
221
28 Retail trade
390.2 528.0 78.7 4,155
32 Hotels and other lodging; amusement and recreation services
826.1 1,205.6 159.9 6,229
35 Eating and drinking places
871.0 1,088.4 128.5 8,544
37 Miscellaneous services
84.7 127.3 14.2 541
Total $2,206.0 $2,992.1 $388.9 19,691
Note: details may not add to totals due to rounding.
Source: authors’ calculations
Comparing the earnings multipliers for the tourism-related industries in Table 4 with those found by other studies for similar areas in Table 1 suggests the RIMS II final-demand multipliers for Washington are quite low. This is confirmed by comparing the total earnings generated by this process ($388.9 in Table 5) to the U.S. Travel Data Center’s estimate of earnings directly attributable to these expenditures: $595 million. Similarly, the total employment estimates from the RIMS II final-demand multipliers appear low. The Table 5 estimate of 19,691 jobs produced direct, indirect and induced impacts of these tourist expenditures is only a little more than one-half of the Data Center’s estimate of employment directly generated of 33.5 thousand. This casts severe doubts on the validity of the RIMS II final-demand multipliers for tourism for Washington, D.C.

19
As indicated above, the BEA agrees that the final-demand multipliers may not be as representative of an area as the direct-effect multipliers since the former are based on national relationships of output to earnings and employment rather than those pertaining to the region under study. The TEIM estimates of earnings and employment are based on the relationships of tourism expenditures net of sales taxes to earnings and employment for the various tourism-related industries for Washington, D.C., not the nation. Consequently, the TEIM estimates of the earnings and employment directly attributable to tourism spending appear to be more accurate than the RIMS II relationships implicit in the final-demand multipliers. Table 6 presents the U.S. Travel Data Center’s TEIM estimates of earnings and employment directly generated by tourism expenditures in the five relevant RIMS II industries (columns 2 and 3). Columns 4 and 5 present the RIMS II direct-effect multipliers for earnings and employment, respectively. Finally, columns 6 and 7 present the products of the TEIM direct estimates and the RIMS II multipliers. For example, to obtain the direct-effect multiplier estimate of total earnings associated with tourism spending for transportation in Washington, D.C., we multiply the earnings directly generated in column 2 ($2.33 million) by the direct-effect earnings multiplier in column 4 (1.151) to obtain the direct-effect multiplier earnings in column 6 ($2.7 million). (The products and totals in Table 6 may not exactly match independent multiplication and addition of them due to the rounded estimates shown in the table.) Overall, Table 6 indicates that more than $781 million in earnings in Washington, D.C. businesses were generated by tourism spending for nearly 39.5 thousand jobs. The final figures in columns 4 and 5 are the implicit direct-effect multipliers for total tourist expenditures, reflecting the average of the industry multipliers weighted by tourist expenditures.
Table 6: Estimates of Total Earnings and Employment Generated by Tourism Expenditures based on RIMS II Direct-effect Multipliers for Washington, D.C.,
1994
1. RIMS II industry receiving
initial expenditure
2. TEIM earnings directly
generated ($million)
3. TEIM jobs
directly generated
4. RIMS II direct-effect
earnings multiplier
5. RIMS II direct-effect employment
multiplier
6. Direct-
effect multiplier earnings
($million)
7. Direct-effect
multiplier jobs
Transportation
$2.33
125
1.151
1.169
$2.7
146

20
Retail trade 41.28 2,280 1.231 1.125 50.8 2,565
Hotels and other lodging; amusement and recreation services
283.47 12,550 1.420 1.312 402.4 16,464
Eating and drinking places
259.4 18,220 1.208 1.088 313.3 19,820
Miscellaneous services
8.09 36 1.472 1.332 11.9 479
Overall $594.6 33,535 1.314 1.177 $781.1 39,474
Note: details may not add to totals due to rounding.
Source: authors’ calculations
Direct-effect multipliers cannot be compared to the multipliers shown in Tables 1 and 2 for other areas of the world because these latter are final-demand multipliers. However, they can be transformed into final-demand multipliers by simply dividing the total earnings or employment (columns 6 or 7 in Table 6) by the original tourist expenditures net of sales taxes (Table 3). The final-demand multiplier estimates for total tourist expenditures in Washington, D.C. in 1994 derived by this method are shown in Table 7.
Table 7: Summary of Estimates of Tourism Expenditures, Output, Earnings and Employment Using RIMS II Direct-effect Multipliers for
Washington, D.C., 1994 Total impact measure
Implicit final-
demand multiplier
Total impact
Tourism final demand
expenditures
- -
$2,206 million
Output 1.356 $2,992 million

21
Earnings 0.354 $781.1 million
Employment 17.9* 39,474
*number of jobs per $1 million of output delivered to final demand
Comparing the final-demand output and earnings multipliers in Table 7 with those for other sub-national regions in Table 1 indicates Washington, D.C. falls near the bottom. This is not surprising, given that the city is only 68 square miles (177 sq. km.) in area and the center of a large, economically-integrated metropolitan area (nine times the population of the city alone). Washington metropolitan area tourism study Fortuitously, a study was conducted of 1994 visitor expenditures and their impact on the Washington metropolitan area within Interstate 495 which circles the city, commonly called “the beltway” (Fuller 1995). For comparison, the population of this area is about 3.3 million, or 6 times that of the city alone. In the final report, certain impact estimates were also presented for the city only. The Fuller study included visitor surveys to gather expenditure data and employed RIMS II data to estimate the total effects of these expenditures on the metropolitan area economy and the city economy (ibid., pp. 21-22). The study estimated that foreign and domestic visitors to the city spent a total $2.552 billion in 1994, comparable to the U.S. Travel Data Center’s estimate of $2.206 million for domestic tourists alone. The study provides estimates of earnings, both directly generated and including the multiplier effects, but does not provide employment estimates comparable to the present study. Table 8 compares the multipliers derived from the Fuller study to those of the present study. The output multipliers for the city are nearly identical. Comparison of the metro area output multiplier to the city’s suggests the enhanced interindustry linkages in the larger metro area boosts the output multiplier by 20 percent over the city alone. Comparison of the final-demand earnings multipliers is puzzling since the Fuller study estimates appear so much larger than the present study, even though both are based on the same regional input-output model for the same areas. The fact that the direct-effect earnings multipliers for the metro area (Fuller 1995) and the city of Washington (present study) affirm each other deepens the enigma. The fact that the former is about one-quarter larger than the latter appears reasonable, reflecting the greater interindustry linkages in the larger, metro area.

22
Table 8: Comparison of multipliers derived from two studies of the Washington, D.C. area, 1994
Multiplier measure
Washington metro area (Fuller 1995)
Washington, D.C.
(Fuller 1995)
Washington, D.C.
(present study)
Output
1.630
1.364
1.356
Final-demand
earnings
0.739 0.666 0.354
Direct-effect earnings
1.638 N.A. 1.314
N.A. = not available
Partial multipliers We have herein developed and compared “partial multipliers” for the tourism sector of the Washington, D.C. area. Partial multipliers indicate the response of different industries in the local economy to increases in final demand, such as tourism expenditures. The higher the partial multipliers, the higher a certain industry's contribution to local output, earnings and employment. The BEA publishes partial multipliers for 37 industries for any multi-county region in the U.S. upon request. The following two tables compare the multipliers derived for the tourism sector in the city of Washington in this study to other industries. As discussed above, the tourism sector is a composite of five industries responding to tourism expenditures. Table 9 shows the ranking of the top 9 industries (out of 37) and the tourism sector in Washington, D.C. in terms of output, earnings and employment multipliers as derived from special tabulations obtained from BEA for 1994. Tourism ranks relatively high in terms of interindustry linkages within the city. Indeed, tourism ranks fifth in its employment multiplier, and two of the four industries surpassing it are substantial recipients of tourism spending and comprise part of its composite multiplier.
Table 9: Top industries and tourism in Washington, D.C. ranked by final-demand multiplier values, 1994

23
Rank
Industry
Output
Industry
Earnings
Industry
Employment
1 Depository, nondepository institutions, brokers, etc.
1.51
Farm products, and agricultural, forestry and fishing services
0.299
Farm products, and agricultural, forestry and fishing services
18.54
2 Miscellaneous services
1.50 Business services 0.267 Personal services 13.73
3 Business services 1.47 Personal services 0.249 Retail 10.65
4 Hotels and other lodging; amusement and recreation services
1.46 Health services 0.228 Eating and drinking places
9.81
5 Personal services 1.43 Transportation 0.222 Tourism 8.93
6 Communications 1.39 Retail 0.202 Apparel and other textile products
7.79
7 Insurance 1.37 Depository, nondepository institutions, brokers, etc.
0.199 Business services 7.66
8 Tourism 1.36 Hotels and other lodging; amusement and recreation services
0.194 Hotels and other lodging; amusement and recreation services
7.54
9 Retail 1.35 Tourism 0.176 Transportation 6.49
10 Health services 1.31 Miscellaneous services
0.168 Miscellaneous services
6.39
Source: Authors’ calculations from BEA RIMS II tabulations
As discussed above, there is reason to believe the RIMS II final-demand multipliers for earnings and employment for Washington, D.C. do not accurately reflect the relationships of final demand to earnings and employment existing in the city. The ranking in Table 9 may still be accurate if such relationships are

24
similarly underestimated for all industries. To check this assumption, Table 10 compares the RIMS II direct-effect multipliers for the top industries in the city, since these are appraised to be more accurate reflections of local interindustry conditions by the BEA.
Table 10: Top industries and tourism in Washington, D.C. ranked by direct-effect multiplier values, 1994
Rank
Industry
Earnings
Industry
Employment
1 Real estate
3.103
Real estate
2.06
2 Depository, nondepository institutions, brokers, etc.
1.512 Chemical , allied, petroleum and coal products
2.01
3 Miscellaneous services
1.472 Communications 1.93
4 Communications 1.454 Motor vehicles and equipment
1.83
5 Hotels and other lodging; amusement and recreation services
1.420 Depository, nondepository institutions, brokers, etc.
1.61
6 Chemical , allied, petroleum and coal products
1.393 Electric, gas and sanitary services
1.51
7 Insurance 1.379 Primary metal industries
1.49
8 Printing and publishing
1.353 Insurance 1.46
9 Tourism 1.314 Printing and publishing
1.45
10 Primary metal industries
1.313 Paper and allied products
1.36
Source: Authors’ calculations from BEA RIMS II tabulations

25
Tourism again ranks among the top one-fourth of all industries in terms of earnings multipliers, suggesting relatively strong linkages with industries that pay exceptional wages and salaries. However, tourism ranks 28 (out of 38) in terms of its direct-effect employment multiplier. This suggests that those industries linked to the tourism sector produce relatively little employment per dollar of output but those employed are relatively highly paid.
CONCLUSION
The RIMS II regional input-output system of the U.S. Department of Commerce can be applied to summarize the direct, indirect and induced effects of tourism expenditures on any single county or multi-county economy in the U.S. The system provides output, earnings and employment multipliers in either the final-demand (i.e., normal) form, or the direct-effect (i.e., ratio) form for 37 industries and the household sector. Tourism expenditure categories can be coded into five RIMS II industries to produce composite tourism multipliers. These can be compared to other industries in a region to rank tourism in power to produce indirect and induced contributions to the regional economy. The 1994 version RIMS II system was applied to estimate the total output, earnings and employment produced by tourism expenditures in Washington, D.C. Expenditures by visitors in the city for 1994 were derived from the Travel Economic Impact Model (TEIM) of the U.S. Travel Data Center. These expenditures were applied to the RIMS II final-demand multipliers to obtain estimates of total output, earnings and employment for the city. The final-demand multipliers produced demonstrably low earnings and employment estimates, so the RIMS II direct-effect multipliers were applied instead. These produced more reasonable results: final-demand multipliers of 1.356 for output, 0.354 for earnings, and 17.9 jobs per $1 million of delivery to final demand (tourism expenditures net of sales taxes). These estimates appear reasonable based on comparisons with a large number of output and earnings multipliers derived from an study of the tourism multiplier literature and with a 1994 study of tourism’s impact on the Washington metropolitan area. The latter, also employing RIMS II multipliers, indicated that the larger metro area produced greater inter-industry linkages, expressed through tourism output and earnings multipliers that were 20 percent and 25 percent, respectively, larger than that of the city alone. Tourism demand in the city produced output and earnings multipliers higher than three-quarters or more of the local industries. The employment

26
multiplier was low relative to other industries, suggesting tourism linkages produce relatively few but highly paid jobs in industries helping supply tourism demand. Overall, the tourism multipliers estimated for the city of Washington were low relative to other areas of the world studied. The city is a relatively small geographic and population component of a large, highly industrially-integrated metropolitan area. Its internal inter-industry linkages are relatively weak, and the primary tourism industries import a large portion of their goods and services inputs from outside the city. The city government and other organizations concerned with growing the Washington city economy would do well to strengthen such internal linkages through polices to encourage the location of suppliers to tourism businesses within the city limits. The study also suggested a number of recommendations for further research. Research is needed on the local factors that demonstrate strong positive or negative relationships with the size of tourism multipliers, perhaps through a meta-analysis of extant studies (Glass, McGaw and Smith 1981). This could lead to estimation of tourism multipliers for similar areas from one study, and to policy recommendations for increasing the total economic benefits from tourism through stronger internal linkages. Another area of research needed to determine the validity of the input-output approach is investigation of the known limitations or weaknesses of such multipliers on their estimation. This would be particularly useful against alternative methods of estimating such multipliers (e.g., Fletcher 1994b, p. 478), Frechtling 1994a, pp, 384-387) Finally, it would be useful to know how tourism multipliers are actually applied in public policy-making and business operational and investment decisions. Understanding the uses to which tourism multipliers are put would indicate the most fruitful areas for improving them.
REFERENCES
Archer, Brian H. (1973). The Impact of Domestic Tourism, Bangor Occasional Papers in Economics, Number 2. Cardiff: University of Wales Press.
Archer, B. H. (1976b). “The Uses and Abuses Multipliers”, in Charles E. Gearing, William W. Swart and Turgut Var (eds.): Planning for Tourism Development: Quantitative Approaches, New York: Praeger, pp. 115-132.

27
Archer, B. H. (1982). “The value of multipliers and their policy implications”, Tourism Management, 3(2), pp. 236-241.
Archer, Brian (1984b). “Tourism and the British Economy”, Rivista Internazionale di Scienze Economiche e Commerciali, 31 (7), pp. 597-613.
Archer, B. H. (1989). “Tourism and island economies: impact analyses”, in: Cooper, C. P. (ed.): Progress in Tourism, Recreation and Hospitality Management, Belhaven Press, London, 1, pp. 125-134.
Archer, Brian (1995a). ÒThe Impact of International Tourism on the Economy of Bermuda, 1994”, Journal of Travel Research, 34 (2), pp. 27-30.
Archer, Brian and John Fletcher (1990). Multiplier Analysis in Tourism, Cahiers du Tourisme, Série C, No. 103. Centre des Hautes Etudes Touristiques, Aix-en-Provence.
Archer, Brian and John Fletcher (1996). The Economic Impact of Tourism in the Seychelles, Annals of Tourism Research, Vol. 23., No. 1., pp. 32-47.
Archer, Brian, Sheila Shea and Richard de Vane (1974). Tourism in Gwynedd, Wales Tourist Board.
Armstrong, W. E., S. Daniel and A. A. Francis (1974). A Structural Analysis of the Barbados Economy, 1968, With an Application to the Tourist Industry, Social and Economic Studies, Vol. 23., No. 4., pp. 493-520.
Baier, S. (1994). The economic impact of travel and tourism in a mountain area: the case of Vorarlberg, Austria, in: Seaton, A. V., et al. (eds.): Tourism - The State of the Art, John Wiley and Sons, New York, pp. 141-144.
Bicak, Hasan Ali and Mehmet Altinary (1996). Economic Impact of the Israeli Tourists on North Cyprus, Annals of Tourism Research, Vol. 23., No. 4., pp. 928-931.
Blake, C. and S. McDowall (1967). A local input-output table, Scottish Journal of Political Economy, Vol. 14., 1967, pp. 227-242.
Briassoulis, H. (1991). Methodological issues: tourism input-output analysis, Annals of Tourism Research, Vol. 18., No. 3., pp. 485-495.
Briguglio, Lino (1992). Tourism Multipliers in the Maltese Economy, in: Johnson, Peter and Barry Thomas (eds.): Perspectives on Tourism Policy, Mansell, London, pp. 76-80.
Brownrigg, M. and M. A. Greig (1975). Differential multipliers for tourism, Scottish Journal of Political Economy, Vol. XXII, No. 3., pp. 261-275.
Bryden, J. M. and M. Faber (1971). Multiplying the tourist multiplier, Social and Economic Studies, Vol. 20., No. 1., pp. 61-82.
Bull, Adrian (1991). The Economics of Travel and Tourism. New York: John Wiley & Sons.
Bureau of Economic Analysis, U.S. (1997). Regional Multipliers, A User Handbook for the Regional Input-Output Modeling System (RIMS II), third edition. Washington: U.S. Government Printing Office.
Commonwealth Agricultural Bureaux (1984). Tourism multipliers: annotated bibliography, Farnham Royal, Slough, UK.
28
Cooper, M. J. and J. J. Pigram (1984). Tourism and the Australian Economy, Tourism Management, Vol. 5., No. 1., pp. 2-12.
Costa, Paolo (1984). La valutazione degli effetti economici del turismo in Italia, Rivista Internazionale di Scienze Economiche e Commerciali, Vol. 31., No. 7., pp. 614-626.
Cournoyer, N. C. (1982). A layman's look at tourism statistics, Cornell Hotel and Restaurant Administration Quarterly, Vol. 23., No. 1., pp. 6-9.
Curry, Steve (1986). The Economic Impact of International Tourism in the United Republic of Tanzania: An Input-Output Analysis, Industry and Development, Vol. 19., pp. 55-75.
Diamond, J. (1981) The Economic Impact of International Tourism on the Singapore Economy, Les
Cahiers du Tourisme, Serie C, No. 69., Centre des Hautes Etudes Touristiques, Universite de Droit, d'Economie et des Sciences, Aix-en-Provence.
Encontre, Pierre (1989). Why does the tourist dollar matter: An introduction to the economics of tourism in the British Virgin Islands, British Virgin Islands Tourist Board.
Fesenmaier, Daniel R., Lonnie Jones, Seoho Um, and Teofilo Ozun Jr. (1990). Assessing the economic impact of outdoor recreation travel to the Texas gulf coast, Journal of Travel Research, Vol. 28., No. 1., pp. 18-23
Fletcher, John E. (1989). Input-Output Analysis and Tourism Impact Studies, Annals of Tourism Research, Vol. 16., pp. 514-529.
Fletcher, John E. (1994a). “Input-output analysis” in Stephen F. Witt and Luiz Moutinho, eds., Tourism Marketing and Management Handbook, 2nd ed., New York: Prentice Hall, pp. 480-484.
Fletcher, John E. (1994b). “Economic impact” in Stephen F. Witt and Luiz Moutinho, eds., Tourism Marketing and Management Handbook, 2nd ed., New York: Prentice Hall, pp. 475-479.
Frechtling, Douglas C. (1974). A Model for Estimating Travel Expenditures, Journal of Travel Research, Vol. 12., No. 4. pp. 9-12.
Frechtling, Douglas C. (1991). Maryland Tourism Promotion and Impact Study, Maryland Tourism Council.
Frechtling, Douglas C. (1994a). “Assessing the Impacts of Travel and Tourism ⎯ Measuring Economic Benefits.” In J. R. B. Ritchie and C. R. Goeldner, editors, Travel, Tourism, and Hospitality Research, A Handbook for Managers and Researcher. New York: John Wiley & Sons, pp. 367-391.
Fuller, Stephen S. (1995). The impact of the hospitality industry on the metropolitan Washington economy, Greater Washington Research Center, Washington D.C.
Gartner, William C. and Donald F. Holecek (1983). Economic Impact of an Annual Tourism Industry Exposition, Annals of Tourism Research, Vol. 10., No. 2., pp. 199-212.

29
Glass, Gene V., Barry McGraw, and Mary Lee Smith (1981. Meta-analysis in Social Research. Newbury Park, CA: Sage Publications.
Hughes, Howard L. (1994). Tourism multiplier studies: a more judicious approach, Tourism Management, Vol. 15., No. 6., 403-406.
Janez, Sirse (1979). Estimation of macroeconomic effects of tourism with input-output analysis: the Yugoslavian case, Cahiers du Tourisme, Série C, No. 57., Centre des Hautes Etudes Touristiques, Aix-en-Provence.
Johnson, Rebecca L., and Eric Moore (1993). Tourism Impact Estimation, Annals of Tourism Research, Vol. 20., pp. 279-288.
Khan, Habibullah, Chou Fee Seng and Wong Kwei Cheong (1990). Tourism Multiplier Effects on Singapore, Annals of Tourism Research, Vol. 17., pp. 408-418.
Leontief, Wassily (1985). Input-Output Economics, Oxford University Press, New York, 2nd ed. (1st ed.: 1966).
Levitt, K. and I. Gulati (1970). Income effects of tourist spending: mystification multiplied, a critical comment on the Zinder Report, Social and Economic Studies, Vol. 19., No. 3., pp. 326-343.
Lin, Tzong-Biau and Yun-Win Sung (1983). Hong Kong, in: T. Lin and E. A. Pye (eds.): Tourism in Asia: The Economic Impact, Singapore University Press, Singapore, pp. 1-100.
Liu, Juanita C. (1986). Relative Economic Contributions of Visitor Groups in Hawaii, Journal of Travel Research, Vol. 25., No. 1., pp. 2-9.
Liu, J. C., J. Quayson and T. Var (1982). Tourism multipliers revisited, Cahiers du Tourisme, Centre des Hautes Etudes Touristiques, Serie C., No. 70., Aix-en-Provence.
Liu, Juanita, Turgut Var and A. Timur(1984). Tourist-income Multipliers for Turkey, Tourism Management, Vol. 5., No. 4., pp. 280-287.
Lundberg, Donald E., Mink H. Stavenga, and M. Krishnamoorthy (1995). Tourism Economics. New York: John Wiley & Sons.
Mak, James (1989). “The Economic Contribution of Travel to State Economies.” Journal of Travel Research , 28 (fall): pp. 2-5.
Mescon, T. S. and G. S. Vozikis (1985). The economic impact of tourism at the Port of Miami, Annals of Tourism Research, Vol. 12., No. 4., pp. 515-528.
Miller, Ronald E. and Peter D. Blair (1985). Input-Output Analysis: Foundations and Extensions, Prentice-Hall, Englewood Cliffs.
Milne, S. S. (1987). Differential multipliers, Annals of Tourism Research, Vol. 14. No. 4. pp. 499-515.
O'Connor, R and E. W. Henry (1975). Input-output analysis and its applications, Griffin's Statistical Monographs and Courses, No. 36, Charles Griffin and Co., London.
Pigram, John J. and Malcolm J. Cooper (1980). “Economic Impact Analysis in Tourism Planning and Development”, in Douglas G. Pearce, ed., Tourism in the South Pacific: The contribution of research to development and planning,

30
Proceedings of UNESCO Tourism Workshop Ratoronga, New Zealand, June 10-13, 1980, University of Canterbury, Christchurch, pp. 19-31.
Ruiz, A. L. (1985). Tourism and the economy of Puerto Rico: an input-output approach, Tourism Management, Vol. 6., No. 1., pp. 61-65.
Santos, J. S. D., E. M. Oritz, E. Huang and F. Secretario (1983). Philippines, in: T. Lin and E. A. Pye (eds.): Tourism in Asia: The Economic Impact, Singapore University Press, Singapore, pp. 173-240.
Seward, Shirley B. and Bernard K. Spinrad (1982). Tourism in the Caribbean: The Economic Impact, International Development Research Centre, Ottawa.
Song, Byung-Nak and Choong-Yong Ahn (1983). Korea, in: T. Lin and E. A. Pye (eds.): Tourism in Asia: The Economic Impact, Singapore University Press, Singapore, pp. 101-173.
Strang, W. A. (1971). The Use of Market Segmentation in Planning for a Recreation-Based Economy, Technical Report Number 5, The University of Wisconsin Sea Grant Program, Madison
Summary, Rebecca M. (1987). Tourism's Contribution to the Economy of Kenya, Annals of Tourism Research, Vol. 14., No. 4., pp. 531-540.
Tiebout, Charles M. (1960). Community Income Multipliers: A Population Growth Model, Journal of Regional Science, Vol. 2., No. 1., pp. 75-84
U.S. Travel Data Center (1991). The 1990-91 Economic Review of Travel in America, Washington, D.C.: U.S. Travel Data Center.
U.S. Travel Data Center (1996). Impact of Travel on State Economies1994, Travel Industry Association of America, Washington, D.C.
Worrall, Heather (1992). Comparison of Tourism Multipliers in Scotland and Tayside, Dundee Discussion Papers in Economics, Number 35, Department of Economics and Management, University of Dundee, Dundee.
United Nations Department for Economic and Social Information and Policy Analysis and World Tourism Organization (1994). Recommendations on Tourism Statistics. New York: United Nations. Herein referred to as “UN/WTO 1994”.
World Travel and Tourism Council (1996). The 1996/7 WTTC Travel & Touirsm Report, London: Insight Media Ltd.
Yee, Jordan G. (1993). Economic impact assessment of the travel and tourism industry: visitor expenditures, tourism multipliers, input-output analysis, and case studies: a selected bibliography, Intelligence Centre, Pacific Asia Travel Association, San Francisco.
Zinder, H. and Associates Inc. (1969). The Future of Tourism in the Eastern Caribbean, USAID, Regional Development Agency, Washington DC.