estimating energy consumption and efficiency of mobile ... . this report estimates the market size...
TRANSCRIPT

Estimating Energy Consumption of Mobile Fluid Power in the United States Lauren A. Lynch and Bradley T. Zigler National Renewable Energy Laboratory
NREL is a national laboratory of the U.S. Department of Energy Office of Energy Efficiency & Renewable Energy Operated by the Alliance for Sustainable Energy, LLC
This report is available at no cost from the National Renewable Energy Laboratory (NREL) at www.nrel.gov/publications.
Technical Report NREL/TP-5400-70240 November 2017
Contract No. DE-AC36-08GO28308

National Renewable Energy Laboratory 15013 Denver West Parkway Golden, CO 80401 303-275-3000 • www.nrel.gov
Estimating Energy Consumption of Mobile Fluid Power in the United States Lauren A. Lynch and Bradley T. Zigler National Renewable Energy Laboratory
NREL is a national laboratory of the U.S. Department of Energy Office of Energy Efficiency & Renewable Energy Operated by the Alliance for Sustainable Energy, LLC
This report is available at no cost from the National Renewable Energy Laboratory (NREL) at www.nrel.gov/publications.
Technical Report NREL/TP-5400-70240 November 2017
Contract No. DE-AC36-08GO28308

NOTICE
This report was prepared as an account of work sponsored by an agency of the United States government. Neither the United States government nor any agency thereof, nor any of their employees, makes any warranty, express or implied, or assumes any legal liability or responsibility for the accuracy, completeness, or usefulness of any information, apparatus, product, or process disclosed, or represents that its use would not infringe privately owned rights. Reference herein to any specific commercial product, process, or service by trade name, trademark, manufacturer, or otherwise does not necessarily constitute or imply its endorsement, recommendation, or favoring by the United States government or any agency thereof. The views and opinions of authors expressed herein do not necessarily state or reflect those of the United States government or any agency thereof.
This report is available at no cost from the National Renewable Energy Laboratory (NREL) at www.nrel.gov/publications.
Available electronically at SciTech Connect http:/www.osti.gov/scitech
Available for a processing fee to U.S. Department of Energy and its contractors, in paper, from:
U.S. Department of Energy Office of Scientific and Technical Information P.O. Box 62 Oak Ridge, TN 37831-0062 OSTI http://www.osti.gov Phone: 865.576.8401 Fax: 865.576.5728 Email: [email protected]
Available for sale to the public, in paper, from:
U.S. Department of Commerce National Technical Information Service 5301 Shawnee Road Alexandria, VA 22312 NTIS http://www.ntis.gov Phone: 800.553.6847 or 703.605.6000 Fax: 703.605.6900 Email: [email protected]
Cover Photos by Dennis Schroeder: (left to right) NREL 26173, NREL 18302, NREL 19758, NREL 29642, NREL 19795.
NREL prints on paper that contains recycled content.

iii This report is available at no cost from the National Renewable Energy Laboratory (NREL) at www.nrel.gov/publications.
Abstract This report estimates the market size and energy consumption of mobile off-road applications utilizing hydraulic fluid power, and summarizes technology gaps and implementation barriers. Mobile fluid power is the use of hydraulic fluids under pressure to transmit power in mobile equipment applications. The mobile off-road fluid power sector includes various uses of hydraulic fluid power equipment with fundamentally diverse end-use application and operational requirements, such as a skid steer loader, a wheel loader or an agriculture tractor. The agriculture and construction segments dominate the mobile off-road fluid power market in component unit sales volume. An estimated range of energy consumed by the mobile off-road fluid power sector is 0.36 – 1.8 quads per year, which was 1.3% – 6.5% of the total energy consumed in 2016 by the transportation sector. Opportunities for efficiency improvements within the fluid power system result from needs to level and reduce the peak system load requirements and develop new technologies to reduce fluid power system level losses, both of which may be facilitated by characterizing duty cycles to define standardized performance test methods. There are currently no commonly accepted standardized test methods for evaluating equipment level efficiency over a duty cycle. The off-road transportation sector currently meets criteria emissions requirements, and there are no efficiency regulations requiring original equipment manufacturers (OEM) to invest in new architecture development to improve the fuel economy of mobile off-road fluid power systems. In addition, the end-user efficiency interests are outweighed by low equipment purchase or lease price concerns, required payback periods, and reliability and durability requirements of new architecture. Current economics, low market volumes with high product diversity, and regulation compliance challenge OEM investment in commercialization of new architecture development.

iv This report is available at no cost from the National Renewable Energy Laboratory (NREL) at www.nrel.gov/publications.
Acknowledgments This study was conducted in support of the U.S. Department of Energy Vehicle Technologies Office (VTO) with inputs from members of the fluid power industry, fluid power related research and other U.S. national laboratories. The authors would specifically like to thank the contributing OEMs, Tier 1 suppliers and system integrators, Lonnie Love (Oak Ridge National Laboratory), George Fenske (Argonne National Laboratory), Lelia Cosimbescu (Pacific Northwest National Laboratory), Jun Qu (Oak Ridge National Laboratory), Eric Lanke (National Fluid Power Association), Paul Michael (Milwaukee School of Engineering), Kim Stelson (University of Minnesota), and Mike Gust (University of Minnesota) for their information and support.

v This report is available at no cost from the National Renewable Energy Laboratory (NREL) at www.nrel.gov/publications.
Acronyms Btu British thermal unit DOE U.S. Department of Energy EPA U.S. Environmental Protection Agency MOVES MOtor Vehicle Emission Simulator NFPA National Fluid Power Association NREL National Renewable Energy Laboratory OEM original equipment manufacturer ORNL Oak Ridge National Laboratory quad 1015 Btu VTO Vehicle Technologies Office

vi This report is available at no cost from the National Renewable Energy Laboratory (NREL) at www.nrel.gov/publications.
Table of Contents Abstract ....................................................................................................................................................... iii List of Figures ........................................................................................................................................... vii List of Tables ............................................................................................................................................. vii Executive Summary ................................................................................................................................. viii 1 Introduction ........................................................................................................................................... 1
1.1 The United States’ Current Energy Flow ...................................................................................... 1 1.2 Mobile Fluid Power ....................................................................................................................... 1 1.3 Energy Use and Efficiency Study ................................................................................................. 2
2 Mobile Off-Road Fluid Power Market .................................................................................................. 3 3 Energy Consumption of the Mobile Off-Road Fluid Power Market ................................................. 4
3.1 Upper Bound Assessment of Energy Consumption ...................................................................... 4 3.2 Lower Bound Assessment of Energy Consumption ...................................................................... 6
4 Sources of Mobile Fluid Power System Inefficiencies ..................................................................... 8 4.1 Architecture Inefficiencies ............................................................................................................ 8 4.2 Operator Inefficiencies .................................................................................................................. 9
5 Barriers of Efficiency Improvements ................................................................................................ 10 5.1 Architecture and End Use Diversity ............................................................................................ 10 5.2 Measuring Performance .............................................................................................................. 10 5.3 Customer Acceptance .................................................................................................................. 10
6 Conclusions ........................................................................................................................................ 12 References ................................................................................................................................................. 13 Bibliography .............................................................................................................................................. 14 Appendix A ................................................................................................................................................ 15
Upper Bound Energy Calculations ....................................................................................................... 15 Mobile Fluid Power Workshop Key Observations ............................................................................... 16 Fluid Power Testing Standards ............................................................................................................. 19

vii This report is available at no cost from the National Renewable Energy Laboratory (NREL) at www.nrel.gov/publications.
List of Figures Figure 1. Estimated U.S. energy consumption in 2016 (Lawrence Livermore National Laboratory 2016) . 1 Figure 2. 2016 Transportation sector energy consumption (ORNL 2016a) ................................................. 2 Figure 3. Unit sales of hydraulic components (NFPA 2015) ........................................................................ 3 Figure 4. Upper bound – energy consumption of mobile fluid power in relation to the total transportation
sector (ORNL 2016a) ............................................................................................................... 6 Figure 5. Lower bound - energy consumption of mobile fluid power in relation to the total transportation
sector (ORNL 2016a) ............................................................................................................... 7 Figure 6. Sources of machine fuel efficiency of common hydraulic fluid power systems (Love et al. 2012)8
List of Tables Table 1. Off-Highway Transportation-Related Fuel Consumption .............................................................. 5

viii This report is available at no cost from the National Renewable Energy Laboratory (NREL) at www.nrel.gov/publications.
Executive Summary This report estimates the market size and energy consumption of mobile off-road applications utilizing hydraulic fluid power, and summarizes technology gaps and implementation barriers. The objectives of this study were to:
• Estimate the current size of the mobile off-road hydraulic fluid power market, the respective energy consumption.
• Understand the sources and scale of mobile off-road hydraulic fluid power system inefficiencies and the technology gaps.
• Identify market barriers for implementing new technologies within the mobile off-road hydraulic fluid power market.
The mobile off-road market comprises construction, agriculture, material handling, oil and gas, and mining segments. Mobile off-road equipment incorporating fluid power includes an extremely wide range of different types of equipment, system architectures, per-unit fuel consumption, and operating conditions. Therefore, it is difficult to comprehensively estimate the energy consumed, quantify average system efficiencies and project high level impact of technology improvements in terms of energy reduction. A lower bound of energy consumption was referenced from a previous study where industry data were used to estimate system efficiency and energy consumption (Love et al. 2012). A baseline system efficiency average for construction and agriculture equipment was based on OEM feedback, and the upper bound of energy consumption was estimated from fuel consumption data sourced from the U.S. Environmental Protection Agency’s MOtor Vehicle Emission Simulator (MOVES) model. The key findings of the current study include:
• The construction and agriculture segments accounted for 75% of the mobile off-road hydraulic fluid power market based on component unit sales in 2014.
• The energy consumption range of fluid power systems within the mobile off-road industry was 0.36 – 1.8 quads per year, which is 1.3% – 6.5% of the energy consumed by the transportation sector (27.8 quads of energy) in 2016.
Key areas requiring fundamental research in the mobile off-road fluid power market include:
• New technology development to reduce fluid power system level inefficiencies
• New architectures to level and reduce the peak system load requirements
• New technology to increase power density of stored energy
• Development and evaluation of hydraulic fluid and component optimization
• Integration of fluid monitoring and advanced component design
• Characterization of duty cycles to define and standardize performance test methods.

ix This report is available at no cost from the National Renewable Energy Laboratory (NREL) at www.nrel.gov/publications.
There have been multiple demonstrations of effective concepts that improve component and system level efficiency, as well as new architecture concepts that eliminate bulk sources of inefficiency within the fluid power system. Common industry feedback is that the cost of the concept(s) is too high to merit commercial investment, sufficient reliability and durability data are not available for end users to adopt willingly, and there are no regulating forces currently in place requiring adoption of efficiency improvements.

1 This report is available at no cost from the National Renewable Energy Laboratory (NREL) at www.nrel.gov/publications.
1 Introduction 1.1 The United States’ Current Energy Flow Petroleum was the leading fuel consumed in 2016 in the United States with more than half of the consumption by the transportation sector (Lawrence Livermore National Laboratory 2016). To achieve energy dominance, it is critical to invest in early-stage research and development of innovative technologies that promote the nation’s growth by utilizing local resources efficiently. The U.S. Department of Energy’s (DOE's) Vehicle Technologies Office (VTO) promotes early-stage research and development of sustainable transportation technologies in support of reducing petroleum use in the U.S. This specifically includes high energy use segments including on-road light-, medium-, and heavy-duty vehicles, as well as some off-road applications. Improving vehicle efficiency benefits the consumer with lower fuel costs, supports the domestic security by reducing dependency on imported resources, and benefits the public health and environment by reducing pollution.
Figure 1. Estimated U.S. energy consumption in 2016 (Lawrence Livermore National Laboratory 2016)
1.2 Mobile Fluid Power Mobile fluid power uses hydraulic fluids under pressure to generate and transmit power in mobile equipment applications. Mobile machinery operated by fluid power includes a wide range of applications in industry. Fluid power systems are combined with other power transmission, such as mechanical or electrical, and quickly transmit power of high force and torque, even at low speeds.

2 This report is available at no cost from the National Renewable Energy Laboratory (NREL) at www.nrel.gov/publications.
1.3 Energy Use and Efficiency Study Off-road vehicles accounted for 8% of the total energy consumed in the U.S. transportation sector, compared to 21% by heavy-duty on-road vehicles and 55% by light-duty passenger cars and trucks (Oak Ridge National Laboratory 2016a). The VTO sought to increase knowledge of the off-road vehicle segment as their recent focus concentrated more strongly in on-road segments with greater impact to the total transportation energy consumption. The National Renewable Energy Laboratory (NREL) supported the VTO by conducting a high-level study to inform the DOE of the current status of the commercial off-road fluid power systems market and identify areas of low technology readiness levels for potential early-stage research needs. An earlier report, Estimating the Impact (Energy, Emissions and Economics) of the U.S. Fluid Power Industry, was a collaborative effort of Oak Ridge National Laboratory (ORNL) and the National Fluid Power Association (NFPA) to identify the order of magnitude of energy consumed by the fluid power industry (Love et al. 2012). The ORNL report is the most comprehensive study of fluid power systems for commercial off-road vehicles conducted to date and was often used as a baseline for NREL’s analysis. In addition, NREL hosted a Mobile Fluid Power Workshop in Golden, Colorado, on September 12, 2017, where 55 attendees from industry, research and academia, and DOE national laboratories participated in facilitated discussions to understand the current state of art of the industry and identify early stage, precompetitive research needs for efficiency improvement. Original equipment manufacturers (OEM), Tier 1 suppliers and integrators, universities, industry trade groups, and DOE national laboratory researchers all provided input that identified efficiency opportunities and necessary low technology readiness level research needs.
Figure 2. 2016 Transportation sector energy consumption (ORNL 2016a)

3 This report is available at no cost from the National Renewable Energy Laboratory (NREL) at www.nrel.gov/publications.
2 Mobile Off-Road Fluid Power Market The mobile off-road market comprises construction, agriculture, material handling, oil and gas, and mining segments. Mobile off-road equipment incorporating fluid power includes an extremely wide range of types of equipment, complexity, sizes, population, duty cycles, end uses, and per-unit fuel consumption. In addition, each piece of equipment may include several unique fluid power subsystems (Stelson et al. 2017). Therefore, it is difficult to comprehensively estimate the energy consumed, quantify average system efficiencies, and project the high-level impact of technology improvements in terms of energy reduction.
The mobile off-road hydraulic fluid power segment made up 67% of hydraulic component units sold in 2014 and included construction machinery, agriculture machinery, material handling machinery, oil and gas machinery, and mining machinery (NFPA 2015). Construction and agriculture applications dominate the market segment and together account for 75% of the mobile off-road hydraulic component unit sales. Therefore, the largest opportunities for mobile off-road fluid power market efficiency improvements are likely within the agriculture and construction machinery sectors, which is consistent with the 2012 ORNL report based on similar data from industry partners of the NFPA (Love et al. 2012).
Figure 3. Unit sales of hydraulic components (NFPA 2015)

4 This report is available at no cost from the National Renewable Energy Laboratory (NREL) at www.nrel.gov/publications.
3 Energy Consumption of the Mobile Off-Road Fluid Power Market
Mobile off-road equipment using fluid power includes an extremely wide range of technologies and architectures with different end uses and per-unit fuel consumption rates. In addition, most efficiency, fuel consumption rate, and hours of operation data for the fluid power component, subsystems and systems are proprietary information or unmeasured. An average system efficiency estimate that included engine efficiency was 30% for construction and agriculture machinery as provided by an OEM, who wishes to remain anonymous. This is an improvement compared to the 21.1% average efficiency in mobile hydraulic applications previously estimated in the ORNL report.2 Unfortunately, it is difficult to comprehensively estimate the energy consumed by the entire mobile fluid power market; therefore, this task was approached by bounding the energy consumption between upper and lower bound estimates using different approaches.
3.1 Upper Bound Assessment of Energy Consumption Based on off-road transportation fuel consumption data from the U.S. Environmental Protection Agency's (EPA's) MOtor Vehicle Emission Simulator (MOVES) MOVES14a model agricultural, construction, mining, industrial and logging equipment consumed 1.967 quads of diesel, gasoline, and liquefied petroleum gas (ORNL 2016b). The 0.0188 quads consumed by compressed natural gas industrial equipment is assumed to primarily drive terminal tractors with no significant fluid power use and was therefore discounted from the total fuel consumption. As the construction, mining and industrial equipment breakout included some non-mobile uses, such as drill rigs and cranes, 5% of the 1.967 quads was removed to deduct those uses. The results were approximately 1.87 quads of energy consumed in a year for mobile off-road applications that utilize fluid power.
2 Discussion with corporate fellow Lonnie Love August 15. 2017, at Oak Ridge National Laboratory (Bradley Zigler and Lauren Lynch, interviewers)

5 This report is available at no cost from the National Renewable Energy Laboratory (NREL) at www.nrel.gov/publications.
Table 1. Off-Highway Transportation-Related Fuel Consumption
Off-Hwy Transportation Related Fuel Consumption from the EPA MOVES2014a Model
Diesel (quad)
Gasoline (quad)
Liquefied Petroleum Gas
(quad)
Compressed Natural Gas
(quad) Agriculture Equipment
Tractors, mowers, combines, balers, and other farm equipment which has utility in its movement
0.5993 0.0086 0 0
Construction & Mining Equipment Pavers, rollers, drill rigs, graders, backhoes, excavators, cranes, mining equipment
0.9676 0.0113 0.0019 -
Industrial Equipment Forklifts, terminal tractors, sweeper/scrubbers
0.1378 0.0009 0.2071 0.0188
Logging Equipment Feller/buncher/skidder 0.0224 0.0018 0 -
TOTAL OF EACH 1.7271 0.0307 0.209
TOTAL OF ALL FUELS 1.9668
According to an agricultural and construction equipment OEM who wishes to remain anonymous, most of these applications utilize over 95% of fuel for fluid power, with the exception of agricultural tractors (tractors may apply between 5%–60% of the fuel for fluid power use, depending on what implements are utilized). As an upper bound estimate, this study therefore assumes 95% of the agricultural, construction, mining, industrial and logging equipment fuel used in the United States is consumed in powering fluid power systems (versus other use, such as mechanical transmission traction drive). This results in a net of 1.78 quads applied to mobile fluid power. As this is a broad assumption due to the difficulties of comprehensively estimating the energy consumed across such a wide and diverse market, a rounded number of 1.8 quads per year was used as an approximate estimate for the upper bound of fuel consumed by the mobile off-road fluid power sector.

6 This report is available at no cost from the National Renewable Energy Laboratory (NREL) at www.nrel.gov/publications.
Figure 4. Upper bound – energy consumption of mobile fluid power in relation to the total
transportation sector (ORNL 2016a)
3.2 Lower Bound Assessment of Energy Consumption
The analysis conducted by ORNL and the NFPA determined an energy consumption of 0.36 quads of energy per year for the same mobile off-road market segment. The energy consumption was based on measured agriculture and construction technology data provided by OEMs and was divided by the market size. The measured data included population, fuel consumption rate, vehicle class, operating hours, percentage of power to hydraulics, and overall system efficiency. The two industry segments consumed 0.25 quads of energy, which was divided by 69% to account for the entire mobile market (Love et al. 2012). No alternative data was found to compare the same level of detail; therefore, the resulting 0.36 quads of energy consumed per year from the study is still a reasonable lower boundary.
Therefore, the energy consumption range of fluid power systems by the mobile off-road industry is estimated between 0.36 – 1.8 quads per year, which is 1.3% – 6.5% of the energy consumed by the transportation sector (27.8 quads of energy) in 2016 (ORNL 2016a).

7 This report is available at no cost from the National Renewable Energy Laboratory (NREL) at www.nrel.gov/publications.
Figure 5. Lower bound - energy consumption of mobile fluid power in relation to the total transportation sector (ORNL 2016a)

4 Sources of Mobile Fluid Power System Inefficiencies
The primary components in mobile fluid power system architecture include the power source (engine) and the hydraulic drive system, which is generally comprised of a pump, valves for throttling pressure and flow, and hoses and pipes for fluid transfer and hydraulic actuators. Each component experiences individual losses, and there are parasitic losses from the power source as well (see Figure 6).
4.1 Architecture Inefficiencies Most mobile equipment using fluid power has a single pump that drives several outputs. The load demands of these outputs vary significantly with the duty cycle. The peak load requirement of flow and pressure of the highest demand output component (usually the hydraulic motor and/or actuating cylinder) provides the pump demand resulting in the greatest load requirement dictating the engine and pump operation, even if most of the other output components do not need as large of a power supply. It is common for pumps to have a high efficiency at peak load, approximately 85%-90%, but their efficiency will drop to 40%-50% at low-load operating conditions. When the available hydraulic power exceeds demand during operation, the hydraulic control and distribution system normally use throttling valves to dispose unneeded pressure and flow before feeding the lower load output components. This valve throttling strategy results in the largest source of inefficiency, dumping energy as waste heat.
Figure 6. Sources of machine fuel efficiency of common hydraulic fluid power systems (Love et al. 2012)
8 This report is available at no cost from the National Renewable Energy Laboratory (NREL) at www.nrel.gov/publications.

9 This report is available at no cost from the National Renewable Energy Laboratory (NREL) at www.nrel.gov/publications.
4.2 Operator Inefficiencies Operator control and feedback are critical to many of the mobile equipment applications, such as excavators, and the hydraulic control system/haptic feedback is very complex. This directly impacts equipment effectiveness, productivity, and efficiency on the jobsite. Operators expect consistent and quick response to input controls, such as hydraulic motor output and actuating cylinder output, and most hydraulic systems cannot respond quickly enough to ramp up power only as load demand is encountered. The input control systems operate with high pressures and reserve flow capacity. As a result, operator control requirements with current system architectures are inherently inefficient, trading off energy efficiency for equipment effectiveness and time efficiency.

10 This report is available at no cost from the National Renewable Energy Laboratory (NREL) at www.nrel.gov/publications.
5 Barriers of Efficiency Improvements 5.1 Architecture and End Use Diversity Due to the large variation in mobile fluid power equipment in the off-road market and the unique fluid power subsystem architectures, end uses, versatility, and operating conditions, system efficiency improvements generally require an application-specific evaluation and solution. Although common sources of inefficiencies in the typical architectures that have been identified, a single solution that can broadly improve efficiency across the entire mobile fluid power sector is not likely. Therefore, each architecture and operating condition set requires a large amount of resources to identify the highest source(s) of efficiency losses and develop a unique solution for improvement. As most applications have low volumes of specific types equipment, OEMs usually cannot justify the costs to develop and commercialize such individual solutions. Industry consensus is that equipment with high energy consumption, such as excavators and wheel loaders, could merit investment for efficiency improvements as they consume a lot of fuel and have high annual operating hours. A modular and/or scalable solution that could be implemented in multiple pieces of equipment, spreading development costs across the market would greatly benefit the industry.
5.2 Measuring Performance The diverse application and versatility of use of equipment utilizing fluid power result in multiple modes of operation. These various modes of operation make it difficult to standardize testing as well as to compare and measure performance of the fluid power systems, components, and fluids. Industry consensus is that the current low specific equipment type volumes and the large diversity prove to be too costly to dedicate resources in characterizing all the duty cycles. Quantifying the actual work performed is non-trivial, as aspects like characterizing the composition of and resistance in moving soil is challenging. In addition to the high volumes of varying duty cycles, instrumentation of a fluid power system downstream of the engine is challenging as most of the parameters that require monitoring are within operating components (for example, the fluid properties inside of the cylinder) where instrumentation techniques require further development. While many component and subsystem level design and testing standards exist (see Appendix A), there are currently no commonly accepted standardized test methods for evaluating equipment level efficiency over a duty cycle. Understanding the statistical significance of measured differences is also an area of need related to performance validation, as there have not been enough data collected to determine the significances to date. Without these initial parameters of duty cycle characterization, measurement of performance technique and understanding of variances, a baseline methodology to compare performance at system, component, and fluid levels cannot be defined.
5.3 Customer Acceptance Mobile off-road technologies must comply with criteria emission regulations as a function of engine power output (currently EPA Tier 4), but there are no key regulatory drivers for developing and adopting new technologies to increase efficiency for fluid power systems. In addition, common customer payback requirements of investing in new technologies must be less than 18 months for the costs to be justified. Traditional customer culture is also hesitant in adopting new technologies because they want to avoid perceived reliability and durability risks associated with early adoption. Another large potential barrier is the disconnect of fuel operating

11 This report is available at no cost from the National Renewable Energy Laboratory (NREL) at www.nrel.gov/publications.
cost for end users from purchasing decisions by equipment leasing companies (especially prevalent in the construction industry).5
5 Sources prefer to remain anonymous.

12 This report is available at no cost from the National Renewable Energy Laboratory (NREL) at www.nrel.gov/publications.
6 Conclusions The DOE’s VTO support of early-stage research and development of sustainable transportation technologies to ensure energy dominance in the United States requires the improvement of vehicle efficiencies, reducing dependency on imported resources, and reducing pollution. The mobile off-road fluid power market currently consumes approximately 0.36 quads to 1.8 quads of energy per year. This potentially accounts for 1.3% – 6.5% of the energy consumed by the entire transportation sector per year.
The mobile off-road fluid power sector includes a wide range of hydraulically powered equipment, with diverse and versatile operating conditions, and varying per unit fuel consumption rate. Based on 2014 hydraulic power component unit sales of off-road construction, agriculture, material handling, mining, and oil and gas equipment, the agriculture and construction segments dominate the mobile off-road fluid power market by volume.
A study conducted by ORNL and the NFPA estimated a lower bound of the energy consumed by mobile fluid power systems of 0.36 quads as calculated from data provided by industry. Estimates of fuel consumed by the mobile off-road fluid power market from the EPA MOVES model provided an upper bound estimate of annual energy consumption of 1.8 quads. Therefore, the range of energy consumed by the mobile off-road fluid power sector is estimated as 0.36 – 1.8 quads per year.
Information gathered from interviews with industry and academia concluded that most of the inefficiencies of mobile fluid power systems typically result from throttling losses necessary in traditional mobile fluid power system architectures. The off-road transportation sector must meet engine-output based criteria emissions regulations, but there are no regulating actions requiring OEMs to invest in new architecture development to improve the fuel efficiency of mobile off-road fluid power systems. The diversity of the market and end uses of the equipment also complicate the development and implementation of standardized testing to quantify system performance and measure efficiencies. Mobile off-road fluid power systems in the construction and agriculture segments are estimated to be approximately 30% efficient on average (including engine efficiency), but efficiency varies significantly between individual equipment types and duty cycles. Development costs to improve efficiency of mobile off-road fluid power systems challenge OEMs if they cannot apply the technologies across multiple platforms, with larger production volumes. In addition, customer adoption challenges include low equipment purchase or lease price concerns, payback periods of less than two years, and demonstration of reliability and durability for new architectures. Common equipment, such as excavators and wheel loaders, merit efficiency improvement investments as they consume a large amount of fuel, have high hours of operation, and have a large market volume. However, the current economics, low market volumes of specific equipment types, and current regulation compliance challenge OEM investment for new architecture research, development, and commercialization.

13 This report is available at no cost from the National Renewable Energy Laboratory (NREL) at www.nrel.gov/publications.
References Lawrence Livermore National Laboratory. 2016. "Energy Flow Charts." (2016). Retrieved
August 6, 2017, from Lawrence Livermore National Laboratory: https://flowcharts.llnl.gov/commodities/energy
Love, Lonnie J., Eric Lanke, E., &and Pete Alles, P. (2012). Estimating the Impact (Energy, Emissions and Economics) of the U.S. Fluid Power Industry. Report No. ORNL/TM-2011/14. Oak Ridge: Oak Ridge National Laboratory. https://info.ornl.gov/sites/publications/Files/Pub28014.pdf
National Fluid Power Association. (2015). 2015 Annual Report on the U.S. Fluid Power Industry. NFPA. Retrieved June 27, 2017, from National Fluid Power Association: http://www.nfpa.com/fluidpower/annual-report-on-fluidpower-industry.aspx
Oak Ridge National Laboratory. 2016a. "Table 2.8 Transportation Energy Use by Mode, 2012–2014." Retrieved July 12, 2017, from Transportation Energy Data Book. http://cta.ornl.gov/data/index.shtml
Oak Ridge National Laboratory. 2016b. "Table 2.11 Off-highway Transportation-related Fuel Consumption from the Nonroad Model, 2014." Retrieved July 12, 2017, from Transportation Energy Data Book. http://cta.ornl.gov/data/chapter2.shtml
U.S. Energy Information Administration. 2017, April. Gasoline and Diesel Fuel Update. Retrieved June 27, 2017, from U.S. Energy Information Administration, https://www.eia.gov/petroleum/gasdiesel/
U.S. Energy Information Administration. 2017, April. Monthly Energy Review. Retrieved June 29, 2017, from U.S. Energy Information Administration, https://www.eia.gov/totalenergy/data/monthly/pdf/flow/css_2016_energy.pdf
14 This report is available at no cost from the National Renewable Energy Laboratory (NREL) at www.nrel.gov/publications.
Bibliography Andruch, J., and J. Lumkes. 2011. Design, Simulation and Control of Hydraulic System
Topographies with Integrated Energy Recovery. Purdue University.
Caterpillar.(2017. HOW THE HYBRID EXCAVATOR SYSTEM WORKS. Retrieved 2017, from http://www.cat.com/en_US/articles/solutions/construction/how-the-cat-336ehhybridsystemworks.html
Center for Compact and Efficient Fluid Power.(2016. Preliminary Final Report 2016. Retrieved June 27, 2017, from CCEFP: http://www.ccefp.org/wp-content/uploads/2015/12/v.2-CCEFP-Preliminary-Final-Report-Y10_REDUCED.pdf
Federal Highway Administration. 2013. "Table MF-24 – Highway Statistics 2013 – Policy" November 7. Retrieved June 29, 2017: file:///C:/Users/llynch/AppData/Roaming/Zotero/Zotero/Profiles/ldepx5zo.default/zotero/storage/GQMGWEFI/mf24.html
Korane, K. 2016, January 19. How hydraulic fluids affect energy efficiency. Retrieved June 27, 2017, from Mobile HydraulicsTips: http://www.mobilehydraulictips.com/how-hydraulic-fluids-affect-energy-efficiency/
Liang, X., and T. Virvalo. 2000. An Energy Recovery System for a Hydraulic Crane. Tampere, Finland: IMechE.
National Fluid Power Association. 2015. "Education Partners NFPA." Retrieved June 27, 2017: http://www.nfpa.com/education/schoolmembership.aspx

15 This report is available at no cost from the National Renewable Energy Laboratory (NREL) at www.nrel.gov/publications.
Appendix A Upper Bound Energy Calculations
Off-Hwy Transportation Related Fuel Consumption from the EPA MOVES2014a Model
Diesel (trillion Btu)
Gasoline (trillion Btu)
Liquefied Petroleum Gas
(trillion Btu)
Agriculture 599.3 8.6 0 Construction & Mining 967.6 11.3 1.9 Industrial 137.8 9 207.1 Logging 22.4 1.8 0
TOTAL OF EACH 1727.1 30.7 209
TOTAL OF ALL FUELS 1966.8
Upper Bound of Energy Consumption Calculation
1.97E+15 Btu's of fuel consumed based on EPA MOVES2014a Model
1.87E+15 95% of fuel using mobile hydraulics (removing stationary applications)
1E-15 quad/Btu
1.87 quads consumed by mobile hydraulics applications
1.78 quads resulting from 95% of fuel used for powering fluid power system

16 This report is available at no cost from the National Renewable Energy Laboratory (NREL) at www.nrel.gov/publications.
Mobile Fluid Power Workshop Key Observations Research Need Key Observations
Characterization of duty cycles Industry feedback stated it was too costly to develop a duty cycle per application due to low volumes and wide diversity
Diverse application and versatility of use result in multiple modes of operation
Instrumentation of the fluid power system (downstream of engine) is challenging
Simulation and modeling require more operating data for development and analysis
Definition and measurement of performance and efficiency
Unable to compare performance due to varying test methods, environmental conditions (rocks, dirt, payload characteristics etc.), varying operator practice
Need to understand the statistical significance of measured differences
Industry feedback confirmed a need for baseline protocol to compare performance at a system level, components level, and fluid level
Development and definition of standardized equipment level test methods
Difficult in standardizing equipment level test methods due to diverse applications and operating modes
Concerns of how standardized testing may be used
New technologies to increase power density of stored energy
Increasing the power density of energy storage is required, as fluid power has high specific power needs or requirements to begin with
Rate of energy capture, storage, and reuse is equally important
Industry feedback stated a need to reduce the packaging of concepts, and develop scalable and modular concepts for multiple use across multiple applications
New architectures to recover and apply stored energy
Hybrid concepts with increased power density, light weight, compact packaging, and low cost
Holistic view is critical, as operator control and productivity must be maintained
OEMs have insight as to what applications may benefit most from hybridization and understand how to hybridize; the challenge is most often changing these systems at reasonable cost (vs. benefit)
17 This report is available at no cost from the National Renewable Energy Laboratory (NREL) at www.nrel.gov/publications.
Research Need Key Observations
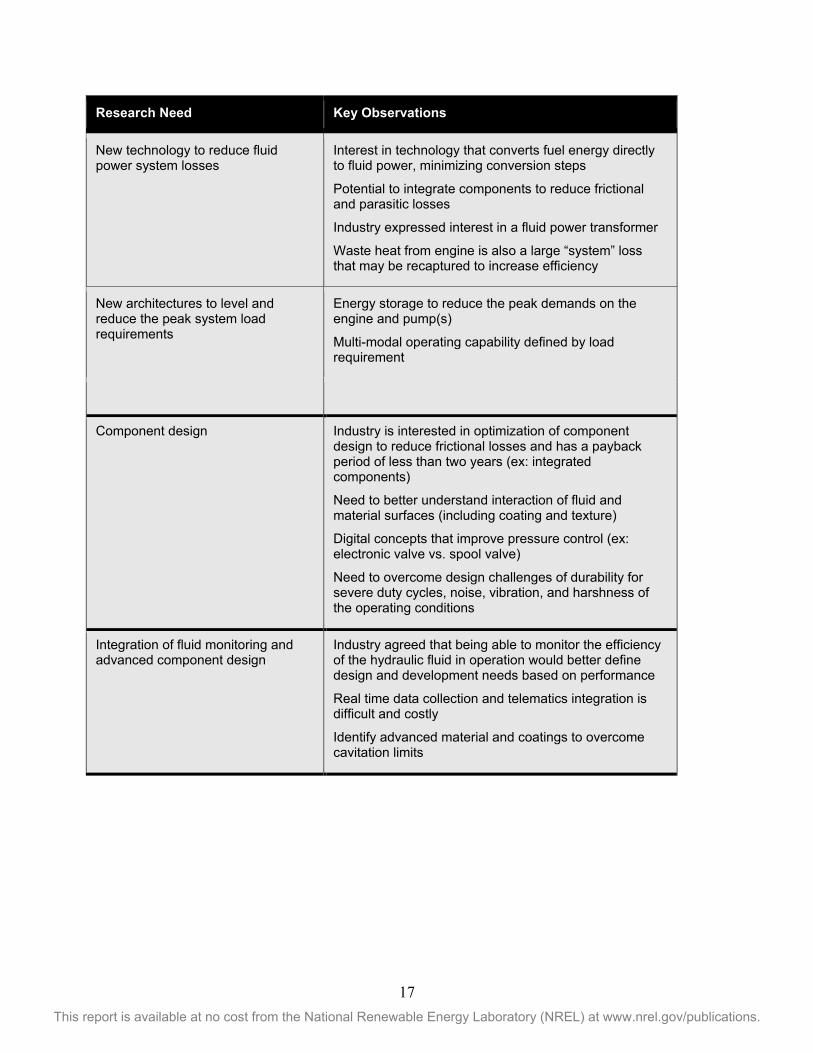
New technology to reduce fluid power system losses
Interest in technology that converts fuel energy directly to fluid power, minimizing conversion steps
Potential to integrate components to reduce frictional and parasitic losses
Industry expressed interest in a fluid power transformer
Waste heat from engine is also a large “system” loss that may be recaptured to increase efficiency
New architectures to level and reduce the peak system load requirements
Energy storage to reduce the peak demands on the engine and pump(s)
Multi-modal operating capability defined by load requirement
Component design Industry is interested in optimization of component design to reduce frictional losses and has a payback period of less than two years (ex: integrated components)
Need to better understand interaction of fluid and material surfaces (including coating and texture)
Digital concepts that improve pressure control (ex: electronic valve vs. spool valve)
Need to overcome design challenges of durability for severe duty cycles, noise, vibration, and harshness of the operating conditions
Integration of fluid monitoring and advanced component design
Industry agreed that being able to monitor the efficiency of the hydraulic fluid in operation would better define design and development needs based on performance
Real time data collection and telematics integration is difficult and costly
Identify advanced material and coatings to overcome cavitation limits

18 This report is available at no cost from the National Renewable Energy Laboratory (NREL) at www.nrel.gov/publications.
Research Need Key Observations
Fluid development and evaluation Hydraulic fluid development must balance all system design factors
Need to understand the viscosity impacts from the entire wide range of various operating conditions
Need to understand tribo-chemical interactions between formulated fluids (additives and base fluids), near-surface properties (mechanical, texture, microstructure, and chemical), and tribological environment to optimize performance.
Extending the lifecycle of the hydraulic fluid to eliminate the need of replacing the fluid and prevent degradation requires fundamental knowledge of degradation mechanisms
Co-development of fluids and components will increase component and system efficiency
Develop an environmentally friendly hydraulic solution to eliminate risks if leaked and disposal requirements
Develop standardized lab scale and component test methods to validate and compare performance under consistent prototypical conditions.

19 This report is available at no cost from the National Renewable Energy Laboratory (NREL) at www.nrel.gov/publications.
Fluid Power Testing Standards ISO 10767-1:2015, Hydraulic fluid power -- Determination of pressure ripple levels generated in systems and components -- Part 1: Method for determining source flow ripple and source impedance of pumps ISO 10770-1:2009, Hydraulic fluid power – Electrically modulated hydraulic control valves – Part 1: Test methods for four-way directional flow control valves (second edition) ISO 10770-2:2012, Hydraulic fluid power -- Electrically modulated hydraulic control valves - Part 2: Test methods for three-port directional flow control valves [second edition] ISO 11170:2013, Hydraulic fluid power — Sequence of tests for verifying performance characteristics of filter elements (third edition) ISO 11171:2010, Hydraulic fluid power – Calibration of automatic particle counters for liquids (second edition] ISO 15086-3:2008, Hydraulic fluid power - Determination of fluid-borne noise characteristics of components and systems - Part 3: Measurement of hydraulic impedance ISO 16908:2014, Hydraulic filter element test methods -- Thermal conditioning and cold start-up simulation ISO 18413:2015, Hydraulic fluid power -- Cleanliness of components -- Inspection document and principles related to contaminant extraction and analysis, and data reporting ISO 19879:2010, Metallic tube connections for fluid power and general use – Test methods for hydraulic fluid power connections [second edition] ISO 3723:2015, Hydraulic Fluid Power-Filter Elements-Method for end load test ISO 4409:2007, Hydraulic fluid power – Positive-displacement pumps, motors and integral transmissions – Methods of testing and representing basic steady-state performance (second edition) ISO 4411:2008, Hydraulic fluid power – Valves – Determination of pressure differential/flow characteristics (second edition) ISO/TR 19972-1:2009, Hydraulic fluid power – Methods to assess the reliability of hydraulic components – Part 1: General procedures and calculation method ISO/TS 13725:2016, Hydraulic fluid power – Cylinders – Method for determining the buckling load (Technical Specification) ISO 10767-2:1999, Hydraulic fluid power – Determination of pressure ripple levels generated in systems and components – Part 2: Simplified method for pumps ISO 15086-2:2000, Hydraulic fluid power – Determination of fluid-borne noise characteristics of components and systems – Part 2: Measurement of speed of sound in a fluid in a pipe ISO 16860:2005, Hydraulic fluid power – Filters – Test method for differential pressure devices ISO 16889:2008, Hydraulic fluid power - Filters – Multi-pass method for evaluating filtration performance of a filter element ISO 16902-1:2003, Hydraulic fluid power – Test code for the determination of sound power levels of pumps using sound intensity techniques: Engineering method – Part 1: Pumps ISO 3722:1976, Hydraulic fluid power – Fluid sample containers – Qualifying and controlling cleaning methods ISO 3724:2007, Hydraulic fluid power – Filter elements – Determination of resistance to flow fatigue using particulate contaminant (second edition) ISO 4021:1992, Hydraulic fluid power – Particulate contamination analysis – Extraction of fluid samples from lines of an operating system (second edition) ISO 4392-1:2002, Hydraulic fluid power – Determination of characteristics of motors – Part 1: At constant low speed and at constant pressure (third edition) ISO 4392-2:2002, Hydraulic fluid power – Determination of characteristics of motors – Part 2: Startability (third edition) ISO 4405:1991, Hydraulic fluid power – Fluid contamination – Determination of particulate contamination by the gravimetric method ISO 7986:1997, Hydraulic fluid power – Sealing devices – Standard test methods to assess the performance of seals used in oil hydraulic reciprocating applications ISO 9110-1:1990, Hydraulic fluid power – Measurement techniques – Part 1: General measurement principles ISO 9110-2:1990, Hydraulic fluid power – Measurement techniques – Part 2: Measurement of average steady-state pressure in a closed conduit ISO 2941:2009, Hydraulic fluid power – Filter elements – Verification of collapse/burst pressure rating ISO 8426:2008, Hydraulic fluid power – Positive displacement pumps and motors – Determination of derived capacity (second edition)

20 This report is available at no cost from the National Renewable Energy Laboratory (NREL) at www.nrel.gov/publications.
ISO 11943:1999, Hydraulic fluid power – On-line automatic particle-counting systems for liquids – Method of calibration and validation ISO 18413:2002, Hydraulic fluid power – Cleanliness of parts and components – Inspection document and principles related to contaminant collection, analysis and data reporting ISO 7241-2:2000, Hydraulic fluid power – Quick-action couplings – Part 2: Test methods (second edition) ISO 10100:2001, Hydraulic fluid power – Cylinders – Acceptance tests (second edition) ISO 10767-3:1999, Hydraulic fluid power – Determination of pressure ripple levels generated in systems and components – Part 3: Method for motors ISO 10770-3:2007, Hydraulic fluid power – Electrically modulated hydraulic control valves – Part 3: Test methods for pressure control valves ISO 11500:2008, Hydraulic fluid power — Determination of particulate contamination level of a liquid sample by automatic particle counting using the light extinction principle (second edition) ISO 15086-1:2001, Hydraulic fluid power – Determination of the fluid-borne noise characteristics of components and systems – Part 1: Introduction ISO 17559:2003, Hydraulic fluid power – Electrically controlled hydraulic pumps – Test methods to determine performance characteristics ISO 2942:2004, Hydraulic fluid power – Filter elements – Verification of fabrication integrity and determination of the first bubble point ISO 2943:1998, Hydraulic fluid power – Filter elements – Verification of material compatibility with fluids (second edition) ISO 3938:1986, Hydraulic fluid power – Contamination analysis – Method for reporting analysis data ISO 3968:2001, Hydraulic fluid power – Filters – Evaluation of differential pressure versus flow characteristics (second edition) ISO 4392-3:1993, Hydraulic fluid power – Determination of characteristics of motors – Part 3: At constant flow and at constant torque ISO 4407:2002, Hydraulic fluid power – Fluid contamination – Determination of particulate contamination by the counting method using an optical microscope (second edition) ISO 4412-1:1991, Hydraulic fluid power – Test code for determination of airborne noise levels – Part 1: Pumps (second edition) ISO 4412-2:1991, Hydraulic fluid power – Test code for determination of airborne noise levels – Part 2: Motors (second edition) ISO 4412-3:1991, Hydraulic fluid power – Test code for determination of airborne noise levels – Part 3: Pumps – Method using a parallelepiped microphone array ISO 6403:1988, Hydraulic fluid power – Valves controlling flow and pressure – Test methods ISO 6605:2002, Hydraulic fluid power – Hoses and hose assemblies – Test methods (second edition) ISO/TR 10771-2:2008, Hydraulic fluid power – Fatigue pressure testing of metal pressure-containing envelopes – Part 2: Rating methods ISO/TR 16144:2002, Hydraulic fluid power – Calibration of liquid automatic particle counters – Procedures used to certify the standard reference material SRM 2806 (type 3 technical report)