estimating cost savings attributed to improvements in...
TRANSCRIPT

Transportation Research Record 1064
CONCLUSION
The technique for multipath transit network analysis as presented in this paper and as installed in the TAP is a significant improvement to the generally accepted algorithms. It provides substantially more data for mode-choice modeling and is capable of posting the results of that analysis on individual lines. It also handles the mode-of-access issues related to subzone distributions and competing access and egress locations. These improvements are costeffective. The model applications developed for the TAP process are no more expensive to use than a single application of the UTPS counterparts. The
41
technique achieves the objective of improved theoretical modeling at a reasonable cost of time and computer resources.
The opinions and viewpoints expressed in this paper are those of the author and do not necessarily reflect the viewpoints, programs, or policies of any federal, state, or local agency.
Publication of this paper sponsored by Cammi ttee on Public Transportation Planning and Development.
Estimating Cost Savings Attributed to Improvements in
Railcar Reliability and Maintainability for the
Chicago Transit Authority
W. DIEW ALD and D. MUOTOH
ABSTRACT
The findings of an analysis of railcar fleet reliability and maintainability for the Chicago Transit Authority (CTA) and the development of cost models to assess the cost effectiveness of railcar rehabilitation and replacement program alternatives are presented. Data files and extensive discussions with CTA maintenance personnel provided the basic data on maintenance and operations; detailed cost data for each railcar series were also provided by the CTA. Reduction of the data yielded reliability-maintainability factors such as mean time between failures, mean time between maintenance, mean time between inspections, mean time to repair, mean time to maintain, and mean time to restore. Using this information and a previously developed modeling approach, models for estimating cost savings attributed to improvements in mean time to maintain and mean time between maintenance were prepared for the 2200, 2400, and 2600 Series of railcars for the CTA fleet. Models for estimating fleet capital cost savings as a result of improved railcar reliability and maintainability were also prepared. Specific suggestions for using these models in maintenance practice to estimate cost savings from alternative actions were presented,
The authors recently completed a project for the Chicago Transit Authority (CTA) that was aimed at answering a number of questions regarding current CTA railcar maintenance practices and evaluating alternative programs that include overhauls, rehabilitation, and replacement <!>·As part of the project, the authors carried out an analysis of CTA fleet reliability and maintainability to establish the cost effectiveness of rehabilitation and replacement pro-
Lea, Elliott, McGean and Company, 600 West Service Road, Suite 320, Dulles International Airport, P.O. Box 17030, Washington, D.C. 20041.
gram alternatives; this aspect of the project is reported on in this paper.
RAILCAR PERFORMANCE EVALUATION
Transit properties generally collect the same basic types of information relating to transit vehicle operation and maintenance (~).These include data on revenue service incidents, periodic inspections, and maintenance activities. Vehicle maintenance data are also generated in the same basic manner at most properties: a vehicle problem is reported in revenue service or is discovered during maintenance, the

42
vehicle is repaired, and information concerning the maintenance action is recorded. The range in the depth of detail pursued and the methodology used by the properties in recording this information, however, vary considerably.
Problems that occur in revenue service are either communicated orally by the train operator to central operations (i.e., 11 central 11 as such, or the tower having jurisdiction over the particular line) or, with some properties, recorded by the train operator onto a form that is passed on to maintenance. In the case of oral communication, the problem description is retransmitted by central operations to maintenance via telephone or computer terminal, and the information is transcribed onto a maintenance form to initiate a repair activity.
Although a preliminary indication of a suspected service vehicle failure may be recorded on an incident report, this information is based on observation and not equipment tear-out or repair. For this reason, this reported failure data cannot be used to determine actual equipment reliability without the associated maintenance data describing the repair.
Major deviations among properties begin at the reporting of primary repair data, that is, recording what was done to and on the vehicle to fix it. Some transit properties, for example, provide only a narrative summary of the repair activity, which is also recorded onto their respective incident forms. Other properties provide narrative data to describe each defect found and the repairs made. Defective parts or assemblies are identified by part number. One property's narrative defect data are later coded on the same form to assign a single entry from a "Fault Code Table" that best describes the mode of failure. Another property goes one step further similarly encoding the repair data. Other properties use a similar approach except that they deal exclusively with codes.
With few exceptions, the repair of components following removal from a vehicle cannot be related to the revenue incident through the existing data collection methods. Therefore, the reporting of vehicle reliability data stops at whatever the lowest replaceable unit might be for a vehicle subsystem. The structure of s.ome maintenance information systems is such that a link is provided between primary and secondary maintenance data. In general, secondary maintenance (maintenance performed in the shop on components that have been removed from the vehicle) statistics are kept by the properties for the purpose of production control and material and time-cost accounting.
Transit properties maintain permanent files of the hard-copy forms. One property also enters the data into a computerized data system via interactive terminals. Other properties keypunch their data for batch entry into their respective computer systems. Several properties use their computers for all processing and manipulation of data and for production of their various reports.
The investigation of existing sources of reliability information on transit vehicle equipment has indicated that
1. The total extent of data that would normally be collected to support the classical, detailed reliability analysis of transit equipment is not available for all potential data sources;
2. Only maintenance data that pertain to what was done to and on the vehicle itself (primary maintenance) can generally be correlated to a vehicle failure;
3. It is difficult to separate primary failures from secondary failures based on existing bases; and
4. Failure data are recorded to different levels
Transportation Research Record 1064
of equipment detail at different properties (e.g., only to subsystem level versus the component level).
Based on this characterization of failure data collected in the transit industry, it is important to establish a clear definition of revenue service reliability. The most common measure of hardware reliability is mean time (or .miles) between failures. However, an alternative statistical measure of reliability that more closely corresponds to the data that are actually available is mean miles between r eplacemen t.
The dynamic data that describe unscheduled maintenance activities do not, in many cases, include information in sufficient detail to accurately determine failure cause and effect. From the transit property viewpoint, it is only important to verify and record the fact that, whatever the apparent problem, a correction was made that returned the vehicle to revenue service availability. Data that are generated, therefore, most often present the unscheduled maintenance action that took place, and a description of components that were replaced.
Based on this characteri~atinn nf d~ta fnr vehicle repair, the most meaningful information that can be obtained includes unscheduled maintenance activities and related equipment replacement. Although these outputs do not specifically describe vehicle or equipment reliability, they will be proportional to hardware reliability values and, more important, describe major contributing factors to the cost of maintenance operations.
In most cases, the primary measure available for transit vehicle and equipment reliability-related analysis is the replacement of components and equipment on vehicles. Although it may not be possible to draw a direct correlation between equipment failures and replacements, the data that are available from transit properties record these change-outs with the greatest degree of accuracy and completeness. When this replacement information iR cnmhined with the generally available data on vehicle utilization (i.e., miles per reporting period by vehicle type), a measure of mean miles between replacements can be determined that combines both equipment reliability and replacements relating to apparent failures.
DATA AVAILABILITY AT THE CTA
In view of the preceding and other recent work in this area, the general statement can be made that the data items needed to carry out traditional reliability or maintainability analyses (or both) are not routinely collected at a majority of u.s. rail transit authorities. Where they are maintained at all, the format, frequency, and scope of these data items vary significantly between transit authorities so that substantial data reduction would be required to make an existing data bank meaningful. Because of the existing dearth in reliability and maintainability information, the task of rail transit performance evaluation is, to say the least, difficult. Many transit authorities maintain that the benefits from extensive and consistent data collection do not justify the expense needed to maintain such a data bank. The CTA has recently implemented a new maintenance management information system (MMIS) that is currently being "debugged." This program should be a valuable source for future maintenance and reliability information and data.
The CTA is no exception to the problems with reliability and maintainability information previously discussed. The only routinely collected maintenance information available is a chronological

Diewald and Muotoh
log of car failures or maintenance actions, or both. This log is accumulated on a car-by-car basis in a computer data file called the Railcar History. Railcar his- tories are usually available on-line for a period of 6 months after which they are transferred into a related data base (not on-line) called the VMT. (Note that the acronym originated with the CTA' s bus MMIS and actually stands for Vehicle Maintenance--Terminal in that system.)
CTA car histories include unscheduled and scheduled maintenance actions for individual cars in the fleet. The logs also contain brief descriptions of the types of failures experienced as well as times that indicate when the reports were logged in and out of the computer. Except for information about the cars that experienced particular failures, none of the data contained in this data file are helpful in establishing the reliability of the equipment. In addition, because times recorded in this data file are not indicative of actual repair times for failures, equipment maintainability could not be established on the basis of this file alone. Another problem with using the car history data relates to the problem of "wrong calls." Normally, when a car fails in service, the identity of the car that is logged in the railcar history is that of the lead car in a multiple-car train, although this car may not be the one that experienced the failure. This introduces significant problems with any attempt to study the performance of individual car series because the appropriate number of maintenance actions for a specific car cannot be accurately determined. The other problem involves the description of failures in the car histories. The computer operator only identifies maintenance actions on the basis of information received from line reports. Moreover, maintenance actions are logged by job numbers that correspond to major work categories established at the CTA. Hence, car failures are only related to major car subsystems. For example, the work category Propulsion (Code = 1000) includes work on traction motors or traction motor controls, or both; the category Car Body (Code = 2000) includes work on the car structure, windows, seats, destination signs, lighting systems, coupler and drawbar, and such activities as battery-charging, converter/motor generator/motor alternator repairs, and maintenance of safety equipment.
The VMT report, which is routinely compiled from car histories, also does not contain data on repair times. However, the reports go one step further than railcar histories in that they attempt to reconcile problems of wrong calls and incorrect failure descriptions by establishing two distinct segments of the report--one for "problem reported" and the other for "problem found."
The CTA keeps extensive maintenance cost information for each series of cars in the fleet. Maintenance costs are summarized monthly in the Vehicle Series Report under two major categories--maintenance performed at the rail terminals and maintenance performed at the shop areas (e.g., parts rebuilding). Monthly records for total rail maintenance for both labor and material functions can be generated from these data. Costs are generally broken down by car series when possible. When costs cannot be identified by vehicle series, they are listed as unassigned in the Vehicle Series Summary.
RESULTS OF DATA REDUCTION EFFORTS
Considerable data reduction was performed in order to use available data to establish current performance levels for each of the three car series under study. The data reduction effort was supplemented by information generated from extensive discussions with
43
CTA maintenance personnel as well as estimates and assumptions made by the study team. In general, data items were broken into three major categories--maintenance data, system operational data, and maintenance cost information.
Maintenance Data
Because VMTs were only available for the first half of 1984, railcar histories and VMTs were combined to reflect the performance of the 2200, 2400, and 2600 Series for a 1-year period. These data included all maintenance actions during the year for a randomly selected sample consisting of ten 2200-, ten 2400-, and eight 2600-Series cars. VMT data covered the period January-May 1984 and railcar histories covered the period June-December 1984.
Because neither of these records includes any information on repair times, the study team obtained three independent estimates of repair times for typical types of failure for each car series. CTA railcars are maintained at 11 inspection and maintenance shops. Repair times at these shops vary as a result of the differences in available manpower and facilities. Hence, any estimates of times must recognize these variations. Based on the independent estimates obtained from CTA maintenance personnel, repair times were generated for all failures experienced by each car in the sample. These times were then accumulated for the period under investigation. Information on all maintenance actions for the data sample is given in Table 1. The number of maintenance actions includes both unscheduled and scheduled maintenance (inspections). Repair times are based on
TABLE I Summary of Equipment Maintenance Actions for Railcar Sample
Data Item 2200 Series 2400 Series 2600 Series
Sample size JO 10 8 Number of failures 485 476 275 Number of inspections 71 64 48 Number· of maintenance actions 556 540 323 Repair time (hr) 430 330 182 Inspection time (hr) 284 256 192 Maintenance time (hr) 714 586 374
Note: The fleet size was comprised of 144 rail cars in the 2200 Series, 199 railcars in the 2400 Series, and 250 railcars in the 2600 Series at the time of the data collection.
an average of two men per repair action. Times for routine inspections are based on an estimate of 4 hr per inspection with six people performing each inspection activity.
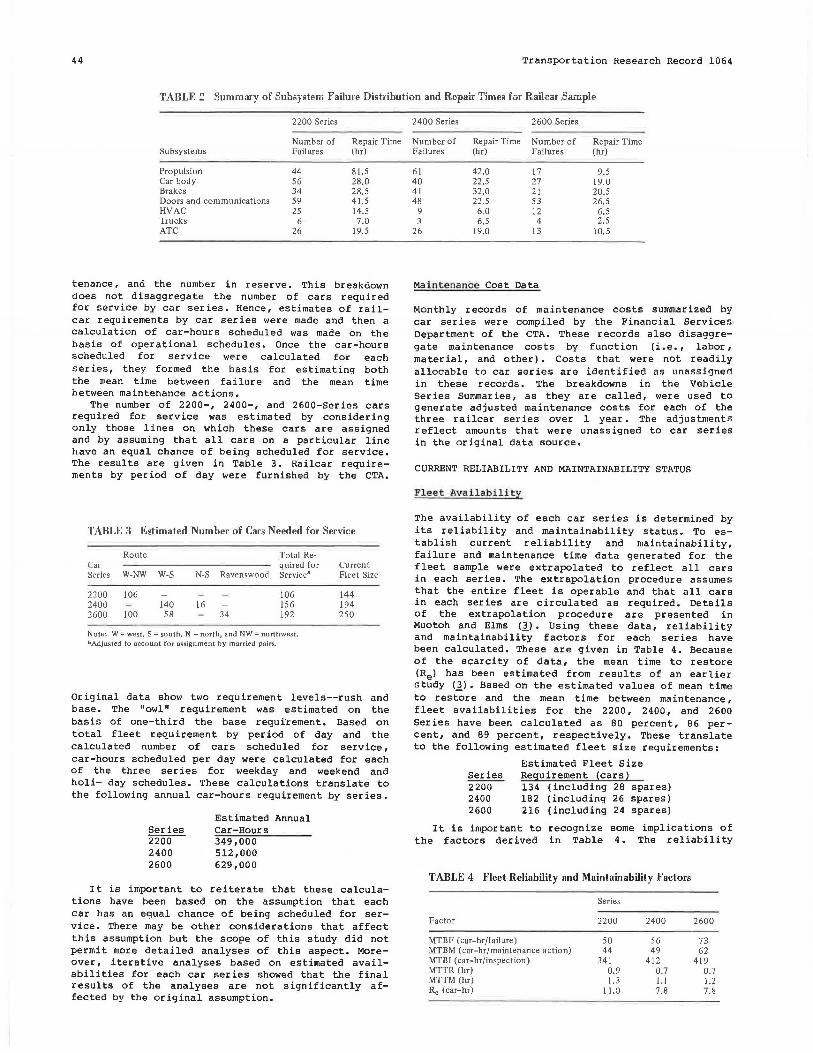
In addition to car maintenance actions, subsystem failure distribution and corresponding repair times were also generated. These are given in Table 2. Major subsystems covered include propulsion, car body, brakes, doors/communications, heating, ventilating, and air conditioning (HVAC) , truck, and automatic traffic control (ATC) in accordance with work categories established at CTA. In view of the extent of necessary data reduction effort, the subsystem failure and repair data are based on a sample size consisting of five 2200-, five 2400-, and four 2600-Series cars.
Sys t em Ope r at i o nal Da t a
system operational data obtained from the CTA include a breakdown by lines of the total number of cars required for service, the number scheduled for main-
44 Transportation Research Record 1064
TABLE 2 Summary of Subsystem Failure Distribution and Repair Times for Railcar .Sample
2200 Series
Number of Repair Time Subsystems Failures (hrj
Propulsion 44 81.5 Car body 56 28.0 Brakes 34 28.5 Doors and communications 59 41.5 HVAC 25 14.5 Trucks 6 7.0 ATC 26 19.5
tenance, and the number in reserve. This breakdown does not disaggregate the number of cars required for service by car series. Hence, estimates of railcar requirements by car series were made and then a calculation of car-hours scheduled was made on the basis of operational schedules. Once the car-hours scheduled for service were calculated for each series, they formed the basis for estimating both the mean time between failure and the mean time between maintenance actions.
The number of 2200-, 2400-, and 2600-Series cars required for service was estimated by considering only those lines on which these cars are assigned and by assuming that all cars on a particular line have an equal chance of being scheduled for service. The results are given in Table 3. Railcar requirements by period of day were furnished by the CTA.
TABLE 3 Estimated Number of Cars Needed for Service
Route Total Re-Car quired for Current Series W-NW W-S N-S Rav~nswooci Service8 Fleet Size
2200 106 106 144 2400 140 16 156 194 2600 100 58 34 192 250
Note: W =west, S =south, N =north, and NW= northwest. 8Adjusted to account for assjgnment by married pairs.
Original data show two requirement levels--rush and base. The "owl" requirement was estimated on the basis of one-third the base requirement. Based on total fleet requirement by period of day and the calculated number of cars scheduled for service, car-hours scheduled per day were calculated for each of the three series for weekday and weekend and holi- day schedules. These calculations translate to the following annual car-hours requirement by series.
Series ~ 2400 2600
Estimated Annual Car-Hours 349,000 512,000 629,000
It is important to reiterate that these calculations have been based on the assumption that each car has an equal chance of being scheduled for service. There may be other considerations that affect this assumption but the scope of this study did not permit more detailed analyses of this aspect. Moreover, iterative analyses based on estimated availabilities for each car series showed that the final results of the analyses are not significantly affected by the original assumption.
2400 Series 2600 Series
Number of Repair Time Number of Repair Time Faiiures (hrj Faiiures (hr)
61 42.0 17 9.5 40 22.5 27 19.0 41 32.0 21 20.5 48 22.5 53 26.5
9 6.0 12 6.5 3 6.5 4 2.5
26 19.0 13 10.5
Ma intenance Cost Data
Monthly records of maintenance costs summarized by car series were compiled by the Financial Services· Department of the CTA. These records also disaggregate maintenance costs by function (i.e., labor, material, and other). Costs that were not readily allocable to car series are identified as unassiqned in these records. The breakdowns in the Vehicle Series Summaries, as they are called, were used to generate adjusted maintenance costs for each of the three railcar series over 1 year. The adjustments reflect amounts that were unassigned to car series in the original data source.
CURRENT RELIABILITY AND MAINTAINABILITY STATUS
Fleet Availability
The availability of each car series is determined by its reliability and maintainability status. To establish current reliability and maintainability, failure and maintenance time data generated for the fleet sample were extrapolated to reflect all cars in each series. The extrapolation procedure assumes that the entire fleet is operable and that all cars in each series are circulated as required. Details of the extrapolation procedure are presented in Muotoh and Elms (3). Using these data, reliability and maintainability factors for each series have been calculated. These are given in Table 4. Because of the scarcity of data, the mean time to restore (Rel has been estimated from results of an earlier study (].). Based on the estimated values of mean time to restore and the mean time between maintenance, fleet availabilities for the 2200, 2400, and 2600 Series have been calculated as 80 percent, 86 percent, and 89 percent, respectively. These translate to the following estimated fleet size requirements:
Series 2200 2400 2600
Estimated Fleet Size Requirement (cars) 134 (including 28 spares) 182 (including 26 spares) 216 (including 24 spares)
It is important to recognize some implications of the factors derived in Table 4. The reliability
TABLE 4 Fleet Reliability and Maintainability Factors
Series
Factor 2200 2400 2600
MTBF (car-hr/failure) 50 56 73 MTBM (car-hr/maintenance action) 44 49 62 MTBI (car-hr/inspection) 341 412 419 MTTR (hr) 0.9 0.7 0.7 MTTM (hr) 1.3 1.] 1.2 Re (car-hr) 11.0 7.8 7.8

Diewald and Muotoh
(mean time between failures, or MTBF) of the 2600-Ser ies cars is considerably higher than for the older cars despite the fact that the 2600-Series cars appear to be less frequently inspected. The mean time to repair the 2200-Series cars is approximately 30 percent higher than for the other series.
Exami nation o f Subsys tem Re l i abi l i ty a nd Ma i nta inab ili ty
The evaluation of railcar performance has also been conducted by investigating the contribution of major subsystems to overall car reliability and maintainability (1). The three worst offenders, in order of severity, - are as follows for each of the three car series under study:
Subsystem Series 2200 2400 2600
Doors/communications, propulsion, brakes Propulsion, doors/communications, brakes Doors/ communications, brakes, propulsion
Car body is not considered in this ranking because this category includes miscellaneous i terns not directly allocable to a single subsystem. Notice that, generally, the three worst offenders are the same for each series and also reflect the results of the UMTA Transit Reliability Information Program (TRIP). The percent distribution of repair time and the mean time to repair each subsystem are given in Table 5. Notice that the mean time to repair the 2200-Series propulsion system is considerably higher than for the 2400 and 2600 Series. Repair times for all other subsystems are similar for all the car series . Expansion of the sample size, however, might provide more insight into differences among the series' subsystems.
TABLE 5 Distribution of Repair Time and Subsystem Maintainability
Percent of Total Repair Time (and MTTR)
2200 Series 2400 Series 2600 Series Subsystem (hr) (hr) (hr)
Propulsion 37 (l.9) 28 (0.7) 10 (0.6) Car body 13 (0.5) 15 (0.6) 20 (0.7) Brakes 13 (0.8) 21 (0.8) 22 (l.0) Doors/communications 19 (0.7) 15 (0.5) 28 (0.5) HVAC 7 (0.6) 4 (0.7) 7 (0.5) Trucks 3 (1.2) 4 (l.O) 2 (0.6) ATC 8 (0.8) 13 (0.7) l l (0.8)
Note: Numbers Jn parentheses are jn percent.
FLEET PERFORMANCE AND COST MODELS
Potential benefits from proposed improvements in railcar performance must be quantifiable so that these benefits can be compared with benefits from competing alternatives. This section presents a procedure that is used to estimate potential economic benefits that can be derived from improvements in CTA railcar reliability and maintainability. The procedure uses mathematical models that estimate both potential savings in maintenance cost as well as fleet capital cost savings. Operating cost savings that may result from reduction in service delays have not been addressed because these have been found to be minimal. Detailed development of these models is presented elsewhere (1,3).
The following paragraphs give a more detailed ex-
45
planation of the basis for both the maintenance cost savings model and the fleet capital cost savings model. Each of these models has been formulated for the 2200-, 2400-, and 2600-Series railcars based on CTA data; for the sake of brevity, only the results of the 2200-Series models are included herein.
BASIC RATIONALE FOR MODELS
Equipment breakdowns can result in system downtime, lost car-hours, higher levels of maintenance, and, consequently, increased operating and maintenance costs. Equipment breakdowns also result in higher capital costs because transit authorities must make allowances for car unavailability in new car acquisitions. This results not only in higher capital commitment for increased fleet size, but also in the increased cost needed to provide larger maintenance and storage facilities. By reducing railcar failure rates or car downtime, or both, operating costs will be reduced through reduced service delays, maintenance costs will drop as a result of lower labor and parts requirements, and fleet capital cost will also be lower because the need for spare cars would have been minimized. Two major areas that are relevant to this study include maintenance and fleet capital cost savings from improved railcar performance.
Maintenance Cost Savings Model
The maintenance cost model estimates both potential labor and spare parts cost savings from improved reliability and maintainability, Although labor cost savings are derived from reductions in failure rate or mean time to repair failed cars, or both, the spare parts cost savings result only from reduced failure rates. Because maintenance costs are incurred from all maintenance actions, the maintenance cost savings model takes account of both service- and nonservice-related failures.
The relationship for estimating potential maintenance cost savings based on unscheduled maintenance actions alone has been developed in a recent study <ll; the relationship is as follows:
where
Nf{KsRsl (Pf+ Pr)/(l +Pf)) + KuplPf/(l +Pf)] } (1)
unscheduled maintenance cost savings; total number of unscheduled maintenance actions for fleet during the period under investigation; unscheduled maintenance labor cost factor. This represents the cost per shop carhour and is expressed in dollars per carhour. It is given by Cu1/Ds where Cul = total labor cost for all unscheduled maintenance actions and Ds = shop time for unscheduled maintenance actions; MTTR = mean time to repair (car-hours) Ds/Nf; unscheduled maintenance parts cost factor. It relates spare parts cost due to unscheduled maintenance to number of unscheduled maintenance actions and is given by Cup/Nf, where Cup = cost of spare parts consumed in unscheduled maintenance and Nf is as previously defined;
Pf = improvement in MTBF = change in MTBF/initial MTBF; and
Pr = improvement in MTTR change in MTTR/initial MTTR.

46
By reformatting Equation 1 to reflect both scheduled and unscheduled maintenance actions, the total maintenance cost saving is given by
wher e
.,.,, I U D r In ... ml .. •m ... ,ml , .... m • (1 + Pm)] } + Cmpl (Pm/ ( 1
+ Pt}/(l +Pm)] + Kp[Pm Cm1[(Pm + Ptl/(l + Pmll
+ Pmll
6Cm total maintenance cost savings (unscheduled and scheduled),
Cml = total labor cost for unscheduled and scheduled maintenance,
(2)
total spare parts cost for unscheduled and scheduled maintenance, total number of maintenance actions (scheduled),
Km total maintenance labor cost tactor = Cm1/ Din (where Din = shop time for both unscheduled and scheduled maintenance actions),
Rm MTTM = mean time to maintain = Om/Nm, KP = total spare parts cost factor for scheduled
and unscheduled maintenance = Crop/Nm, Pm improvemen t in mean time before maintenance
(MTBM) = change in MTBM/initial MTBM, and Pt = improvement in MTTM = change in MTTM/ini
tial MTTM,
Fiee t Capital Cos t Sav i ngs Model
Savings in fleet capital cost are reflected in the reduction of the spare car requirement realized as a reldult of im~ruved car reliability and maintainability. Car-hours are lost because of failures occurring in service as well as failures detected when the car is in the shop for other maintenance. Hence, the fleet cost model also considers both service- and nonservice-related incidents.
The reduction in the spare car requirement, and consequently fleet cost, is directly related to the reduction in car downtime realized through improvements in car performance. The car-hours of downtime saved can be translated into the number of cars saved through the following relationship, the details of which have been explained elsewhere (~).
(3)
where
6Nc number of cars that can be saved, N0 number of cars required for service,
L mean time between maintenance actions, and Re = mean time to restore.
CALIBRATING AND USING THE MODELS
The relationships for maintenance cost savings and fleet capital cost reduction (number of cars saved) must be calibrated for each transit authority before they can be used to investigate benefits from performance improvements. Results of the data reduction efforts previously discussed have been used to calibrate these models for the CTA (1, Appendix El. While expressing cost directly as a f~nction of car reliability and maintainability factors, it should be pointed out that the results of this analysis are only indicative of the general level of savings that is achievable "through improved reliability and maintainability.
Transportation Research Record 1064
Potential Ma in tenance Cost Reduction
Maintenance cost savings for the three series can be obtained by calibrated equations for each series; the equation for the 2200 Series is as follows :
1,100,000[(Pm + Ptl/(l + Pmll + 1,700,000[Pm/(l + Pmll (4)
Recognizing that Pm is improvement in MTBM and Pt is improvement in MTTM, potential maintenance cost savings at any level of reliability or maintainability (or both) improvements can be examined by varying Pm or Pt (or both) in each of the preceding equations. A sensitivity analysis has been conducted by calculating potential cost savings for each series for varying levels of Pm and Pt . For each car series, cost savings are calculated first by keeping mean time between maintenance constant at a known level and varying t he mean time to maintain. A second analysis is then conducted by holding mean time to maintain constant and varying the mean time between maintenance.
To facilitate the use of the models, the <'.'alculated results can also be presented as a set of easy-to-use graphs that can be employed without reference to the mathematical formulation once the defining parameters have been established. Figures 1 and 2 show two sets of graphs relating improvements in MTBM and MTTM with associated potential savings in maintenance cost for the 2200-Series cars. Figure 1 shows variations in the MTTM at fixed levels of MTBM and Figure 2 shows variations in MTBM for fixed levels of MTTM. The vertical axes repr esent t he potential annual maintenance cost savings (dollars), while the horizontal axes represent the improvements in MTTM (Figure 1) and MTBM (Figure 2) expressed as percentages of their respective valuec before improvements. Either of these two sets of graphs can be used to analyze potential maintenance cost savings for improvements in reliability or maintainability of the 2200 Series of cars.
Consider Figure 1, which plots a set of linear relationships between cost savings and changes in MTTM for various levels of MTBM, The set of lines is
0 g 2000 IC
!! ~1100 1-----4-::--+--+::::,...-F'---l--:::,...-to=--+--=::l---'<::....f--~ z > c en ...,1200 U> 0 CJ w ~ 800 l-""""'---+--+--.,,,..4---+--+--b-~l---+---i c z w ~ c 400 t---t------lt----t-c:....,.- --t- --t--f-- -t---t-- -t :I ... c i z c
PERCENT IMPROVEMENT IN MTTM (pt)"
FIGURE I Maintenance cost savings for the 2200 Series-percent improvement in MTTM (pt).

Diewald and Muotoh
0 0 0
2000
M
!? 0 1800 Cl z > "' 0 I- 1200 0 0 0 w 0 800 z "' z w I-z ::;;: 400 :I ..I
"' ::> z z 0
"' 10 20 30 40 50 eo 70 80 90 100
PERCENT IMPROVEMENT IN MTBM (pm )
FIGURE 2 Maintenance cost savings for the 2200 Series-percent improvement in MTBM (Pm).
plotted only in the positive quadrant representing improvements in . MTTM (reduction in MTTM) and improvements in MTBM (increase in MTBM). Potential cost savings can be realized by either or both of these improvements by entering this chart with the percent improvement in MTBM or MTTM, or both, and reading the corresponding cost savings from the vertical axis. Notice that the maximum improvement in MTTM will correspond to the hypothetical case where it takes zero time to maintain a car, that is Pt ~
100 percent. On the other hand, maximum improvement in MTBM will occur when the car operates perpetually without the need for maintenance, that is, Pm = ~. For purposes of this analysis, the set of graphs is, however, bounded between Pm 100 percent (that is, doubling the MTBM) and Pt = 100 percent (zero time to maintain). Maximum annual maintenance cost savings for this hypothetical case is about $2 million and is given by the topmost line in Figure 1. For zero MTTM reduction <Pt = 0 percent) and a 100 percent increase in MTBM (that is, Pm = 100 percent), an annual savings of about $1.4 million (or half of estimated annual maintenance cost for the 2200 Series) could be obtained. Note that a 100 percent increase in MTBM is equivalent to a 50 percent reduction in number of maintenance actions.
It is important to recognize that the horizontal axis (change in MTTM) can be extended to the left (negative values) to represent increases in MTTM. Notice also that improving the MTBM can allow the MTTM to increase substantially without any maintenance cost penalty. For example, a 40 percent improvement in MTBM <Pm = 40 percent), without a change in MTTM, has the potential to save $800,000 in annual maintenance cost in the 2200 Series. Extending the Pm = 40 percen t line to intersect the horizontal axis indicates that a 40 percent improvement in MTBM would permit the MTTM to increase by up to twice the original value before costs are increased. In other words, by doubling the MTTM (to allow for more thorough inspection and repair of the 2200-Series cars) and thereby realizing a 40 percent improvement in MTBM, the overall annual maintenance cost will remain unchanged. A net maintenance cost savings can be realized if 40 percent improvement in MTBM is
47
achieved at less than double the current MTTM. Detailed implications of these results relative to the CTA maintenance program are discussed in a later section.
Potential Fleet Capital Cost Reduction
Potential fleet capital cost savings have been expressed in terms of the number of cars that can be saved in Equation 3. The calibrated equation for the 2200-Series is
6Nc = 28 <Pm + Pcl/(l + Pml (5)
Using the same approach of separately varying one parameter while keeping the other constant, the potential fleet size reduction at various levels of reliability and maintainability improvements can be determined for each car series (1). (It should be noted that the number of cars that can be saved is given as a fraction of the required number of spares estimated for each series.) The calculated results are shown graphically in Figures 3 and 4 for the 2200 Series. It should be noted that the maximum number of cars that can be saved converges to the number of spares estimated for each series. For a hypothetical 100 percent improvement in MTTM (that is, zero maintenance time), there will, theoretically, be no need for spares.
If the percent improvements in MTTM and MTBM are known for the 2200 Series, these values can be used to enter Figure 3 or 4 in order to determine the number of 2200-Ser ies cars that can be saved as a result of the improvements. These cars will be in addition to the number of cars (10) calculated as excess on the basis of current spare allowance. For example, consider a change in maintenance practice or subsystem modification (or both) that results in a modest 20 percent improvement in MTTM only. Figures 3 or 4 can be entered with Pt = 20 percent or Pm = 0 percent to obtain a savings of six 2200-Series cars. This means that the spare requirement can be reduced to 20 cars, down from 26 cars initially estimated for the series before this improvement. Hence, the total excess cars of the 2200 Series will be 18 cars
ti w _, "' IU > ;: 0 c ! z 0 ;: 0 ::> Q IU llC
10 20 30 40 so eo 10 80 eo 100
PERCENT IMPROVEMENT IN MTTM (pt)
FIGURE 3 Fleet cost savings for the 2200 Series-percent improvement in MTTM (p1).

48
u; IC C( (.)
1-w w ..I l'-
w > j: (.) C(
~ z 0 j: (.) ::I c w IC
70 80 90 100
PERCENT IMPROVEMENT IN MTBM (pm)
FIGURE 4 Fleet cost avin s for the 2200 Series-percent improvement in M'fll 1 (Pm).
based on the estimate of fleet requirement for this series.
IMPLICATIONS RELATIVE TO CTA MAINTENANCE PROGRAM
The following pan1yraphs demonstrate the implications of results from the models relative to the CTA maintenance program. It should be kept in mind that the data sample used to develop l11e mutlel was limited and that it would be desirable to expand on this data base before performing any extensive analyses with the models. However, the results that have been obtained can be considered indicative of the existing situation.
Unit Maintenance Cos t Factors
Unit maintenance cost factors for each car series have been estimated. These factors, which are direct derivatives of the development of the models, provide an indication of the cost-effectiveness of current CTA maintenance practice. The maintenance labor cost factor (km) relates labor cost for scheduled and unscheduled maintenance to total maintenance time for each car series. It represents the maintenance labor cost per car-hour of maintenance. The spare parts cost factor (kp) relates the parts cost for scheduled and unscheduled maintenance to the number of maintenance actions experienced by each car series. It represents the average parts cost per maintenance action.
Table 6 gives a comparison of the maintenance experience for each car series with related unit maintenance cost factors for the data and period examined. Notice that labor cost per maintenance carhour is highest for the 2600-Ser ies cars, followed by the 2400 Series, and then the 2200 Series. This is not completely surprising in view of the following: the newer cars have more sophisticated electronic components that (a) must operate in a harsh transit environment (i.e., electrical disturbances, vibrations, temperature variations, and dust and dirt), and (b) require an additional level of
Transportation Research Record 1064
TABLE 6 Comparative Maintenance Data and Maintenance Costs
Series
DC1.La H~rn 22uu 24UU 2600
Fleet size (cars) 144 194 250 Number of maintenance actions 8,006 10,476 10,094 Average number of maintenance
actions per car 56 54 40 Number of failures 6,984 9,234 8,594 Average number of failures per car 49 48 34 Mean time to maintain (hr) 1.3 I. I 1.2 Maintenance labor cost factor($
per car-hr) 107 167 188 Spare parts cost factor($ per
maintenance action) 212 191 109
troubleshooting time. In addition, the new cars have been experiencing excessive burn-in problems.
From the point of view of parts costs, however, the older 2200-Series car~ have the highest average parts cost per maintenance action. This can be partially explained by the fact that the parts on the older cars are worn and that there are likely to be more worn parts, many of which are large or expensive or unavailable except through a special order; on the other hand, the parts on the newer cars are still in their early life, should be readily available, and might be less expensive.
Rebuild Ve r s us Replace
As with most transit authorities, one of the primary considerations of the C'l'A in adopting a maintenance strategy concerns the choice between rehabilitating and replacing cars. The primary impetus for cons ltler lny the rebuilding or replacing of an aging fleet is deteriorating reliability accompanied by increasing maintenance costs and by worsening fleet availability. This issue has been raised at the CTA in connection with some of the fleet.
A preliminary evaluation of the rebuild-or-replace decision must be made to determine if rebuilding is an option for remedying acute reliability and maintainability problems. Rebuilding existing cars may not be considered an option for a number of reasons. First, new cars may be preferred if the current fleet, even at 100 percent availability, cannot meet peak service demand. Second, existing cars may require such extensive work that rebuilding cannot be considered. This was found to be the case with the 2000 Series. Third, rebuilding may not be attractive because of limitations in available facilities and manpower. Space for rebuilding and the storage of replacement or rebuilt parts may not be available on the transit authority property. Also, available manpower may be insufficient for the requirements of a rebuild program. The fourth major consideration in deciding if rebuilding is an option is the availability of funds. Budget restrictions may even rule out both replacing and rebuilding and the transit authority may be compelled to rely on existing cars.
If an examination of the foregoing considerations indicates that rebuilding is a viable option, then a more comprehensive financial analysis should be made to estimate the value to the property of each alternative--rebuild or replace (buy new) . Facility, rebuilding, logistics supply, and all overhead costs related to a rebuild program must be estimated. Because new railcars are regularly being ordered and delivered somewhere in this country, the cost of new cars can be easily estimated.

Diewald and Muotoh
Estimates of rebuild costs for specific railcar series are included in the CTA report on rapid transit car rehabilitation and purchase plan. To complete the rebuild-or-replace analysis, it is necessary to estimate the expected life of a rebuilt car and that of the new car in order to amortize the costs discussed previously. This economic analysis should also include the required maintenance costs for both alternatives. The cost-performance model discussed in this study can be used as part of this life cycle cost analysis to assist in making decisions between rebuilding or replacing CTA cars. The process involves the comparison of potential net benefits that can be realized by improving the performance and extending the life of an existing car against the net benefits from buying new and possibly more reliable equipment. To do this, each car series would have to be analyzed on the basis of its current reliability and maintainability.
The value of the models in this type of decision is the ability to perform "what if" analyses quickly and inexpensively. For example, estimates of the expected improvement in reliability and maintainability for a rebuilt fleet can be made in conjunction with the maintenance staff. The models for that fleet can then be used to generate estimates of maintenance cost savings. These cost savings can be compared to the rebuild costs to determine the value of the rebuild. Additional analyses can be made of the value of a new car purchase over time as compared to the value of a rebuild.
Equipment Retrof i t
On the basis of the data that were examined, the doors/communications, propulsion, and brakes subsystem areas were identified as the worst offenders for each of the three series studied. For example, the data show that the propulsion subsystem was the least reliable for the 2400 Series. It was estimated to account for about 27 percent of all unscheduled maintenance actions, a significantly high cause of failure for this particular fleet. Two things can be done to improve the reliability of this subsystem and, consequently, the overall performance of the 2400-Series cars. First, CTA may opt for a retrofit program that will reflect changes in the subsystem design; if only a few propulsion system components are causing much of the problem, it may be helpful if these are replaced. A second option, which may be more feasible, could involve changes in the existing maintenance practice for this subsystem.
If it is believed that a retrofit of a subsystem or a component would be helpful but the available information is not sufficient for making a commitment to retrofit the entire series or fleet, then it should be possible to perform a sample retrofit on a small number of railcars. The performance of the sample railcars can be monitored before and after the retrofit. using the performance measures, the cost models can then be exercised to determine estimates of maintenance cost savings. These savings can be compared with the retrofit cost to determine whether or not the retrofit will pay off.
Changes in Maintenance Practice
With regard to changes in existing maintenance practice, two courses of action can be taken, as discussed previously. The first alternative is to change the maintenance procedure (increase MTTM) and the second is to change the maintenance interval (decrease the mean time between inspections, or MTBI) • The three worst offenders for each of three series
49
were indicated previously. In addition, a summary of the subsystem reliability (MTBF) estimates is of interest in view of the related estimates of MTBI detailed in Diewald and Muotoh <.!.>· This summary is given in Table 7. The data indicate that for some of the worst offenders, the MTBF is less than the MTBI. For example, for the 2200 Series, three subsystems, doors/communications, car body, and propulsion, can be expected to fail between inspections. For the 2400 Series, there are four such subsystems and, for the newer 2600 Series, there are two.
TABLE 7 Summary of Subsystem Reliability Calculations for Sample Set by Railcar Series
Mean Time Between Failure (hr)
Subsystem 2200 Series 2400 Series 2600 Series
Doors/communication 205 275 190 Car body 216 330 373
(419). Propulsion 275 216 529
(348). Brakes 356 322 479
(412)a ATC 446 507 774 HVAC 485 1,467 839 Trucks 2,0l7 4,414 2,516
a1ndicates the calculated vaJue of mean time between inspection for the car series.
In view of the foregoing, it would be prudent to establish the nature of the problem with the identified subsystem so that appropriate adjustments can be made in either the inspection or repair procedures. This can involve documenting (through discussions with repairmen and maintenance supervision) the kinds and extent of repairs that are being required. Then, for some period, say l month, additional repair documentation on maintenance of the subsystem can be required. In addition, intensive investigations of failures and repairs for the subject subsystem can be conducted during the period. This documentation should form a sufficient basis for further action regarding inspection or repair procedures or schedules. Changes in maintenance actions include changes in the frequency of maintenance or changes in maintenance procedures or both.
As an example, consider the 2400-Series propulsion subsystem. At present, scheduled maintenance is performed as part of the routine 6,000-mi inspection for each car. Changes in existing maintenance practice can be accomplished by either changing the scheduled maintenance interval for this particular subsystem or changing the maintenance procedure. Recognizing that it may be impractical to do this on a fleet-wide basis, CTA could conduct a test on a test sample of the 2400 Series (say 20 cars) for a period of about 3 months. The scheduled maintenance frequency for the propulsion system of these sample cars could be increased to, say, 4,000-mi intervals. This may help in spotting more incipient failures before they cause service disruption. Then the impact on railcar performance and cost can be estimated through the cost model. Alternatively, the maintenance frequency could be decreased to 8,000 mi and a performance-cost analysis performed. (Inquiries by the authors indicated that the evolution of maintenance intervals at the Port Authority Transit Corporation, involving a purely trial-and-error approach, took about 4 years to find the optimum interval.)
Alternatively, more thorough inspection of the propulsion subsystem for these sample cars can be

50
conducted within the current 6,000-mi interval. These changes in maintenance schedules or procedures should be monitored to determine if the performance of the subsystem has been affected. Also, the additional cost (labor or material, or both) needed to accomplish such changes in schedules or procedures for maintaining the sample cars should be determined. Suppose it is found that these changes result in a 10 percent reduction in total number of maintenance actions experienced by the sample. If so, approximately $400 ,000 in annual maintenance cost can be saved (see Table 4). In addition, this could result in a lower fleet requirement. To justify the change in maintenance practice, these potential cost savings can then be compared with the estimated additional cost to effect such changes in maintenance for the entire fleet.
REFE!lliNCJ>S
1. w. Diewald and D. Muotoh. Rapid Transit Car Maintenance and Overhaul Analysis, Final Report. Chi-
Transportation Research Record 1064
cago Transit Authority, Chicago, Illinois, May 1985.
2. Rapid Rail Transit Vehicle Guidelines for the Operation and Use of the TRIP Data Bank. Contract DOT-TSC-1559. u.s. Department of Transportation, April 1979.
3. D. Muotoh and c. Elms. Cost Savings Potential From Improvement in Railcar Reliability and Maintain-ability. Report UMTA-It-06-0273-84-1. UMTA, U.S. Department of Transportation, April 1984.
Publication of this paper sponsored by Committee on Rail Transit Systems.