estimating concentrations of b(a)p in europe - population ... · in europe - population exposure...
TRANSCRIPT

HARMO 17, 9-12 May 2016, Budapest
Estimating concentrations of B(a)P
in Europe - population exposure
and health effects
Cristina Guerreiro, NILU
Jan Horálek, CHMI
Frank de Leeuw, RIVM
Florian Couvidat, INERIS

2
Status BaP conc.
Development in emissions
Mapping methodology (BaP)
Population exposure
Health effects
Discussion & conclusions
CEN/TC264/WG43: MQO
Outline of presentation

Status: 2012 BaP annual mean
3
BaP (ng/m3)
Source: EEA (2014)

Development in emissions
403/06/
Residential combustion emits 82 % of BaP, 64% of PAHs, and 49%
of PM2.5 total emissions in EU-28 in 2012
Increasing trend 2003-2012: 25% BaP, 26% PAHs, 11% PM2.5
Development residential comb. share of total EU emissions

Development in emissions
5
Residential combustion has seen an increase of:
• 27% in the use of biomass (wood)
• 12% if the use of solid fuels (coal)
in EU-28 2003-2012

Pollutant EU reference value Exposure estimate (%) WHO AQG Exposure estimate (%)
PM 2 . 5 year ( 25 ) 10 – 14 year ( 10 ) 94 – 96
PM 10 day ( 50 ) 21 – 30 year ( 20 ) 69 – 89
O 3 8 - hour ( 120 ) 14 – 17 8 - hour ( 100 ) 97 – 99
NO 2 year ( 40 ) 8 – 13 year ( 40 ) 8 – 13
BaP year ( 1 ng/m 3 ) 24 – 28 year (0.12 ng/m 3 ) 77 – 88
SO 2 day ( 125 ) < 1 day ( 20 ) 37 – 42
CO 8 - hour ( 10 ) < 2 8 - hour ( 10 ) < 2
Pb year ( 0 . 5 ) < 1 year ( 0 . 5 ) < 1
Benzene year ( 5 ) < 1 year ( 1 . 7 ) 10 – 12
Colour coding : < 5 % 5 - 50 % 50 - 75 % > 75 %
Population exposure in urban areas
6
Estimate for 2010 – 2012. Source: EEA (2014)
% of urban popul exposed to conc. above EU/WHO values

European exposure: Methodology I
BaP concentration map
Primarily data: measurement data
Secondary data: dispersion model output (EMEP / CHIMERE)
altitude (rural map)
meteorology (FF- rural map, T- urban map)
population density
The secondary data for the linear regression model were selected based on
their relation with measured AQ data. The Linear regression model is followed
by kriging of its residuals (residual kriging)
Measured and CTM data are logarithmically transformed, due to the lognormal
distribution of these data.
kriging – geostatistical method (i.e. knowledge of the spatial structure of air
quality field is utilized, using variogram)
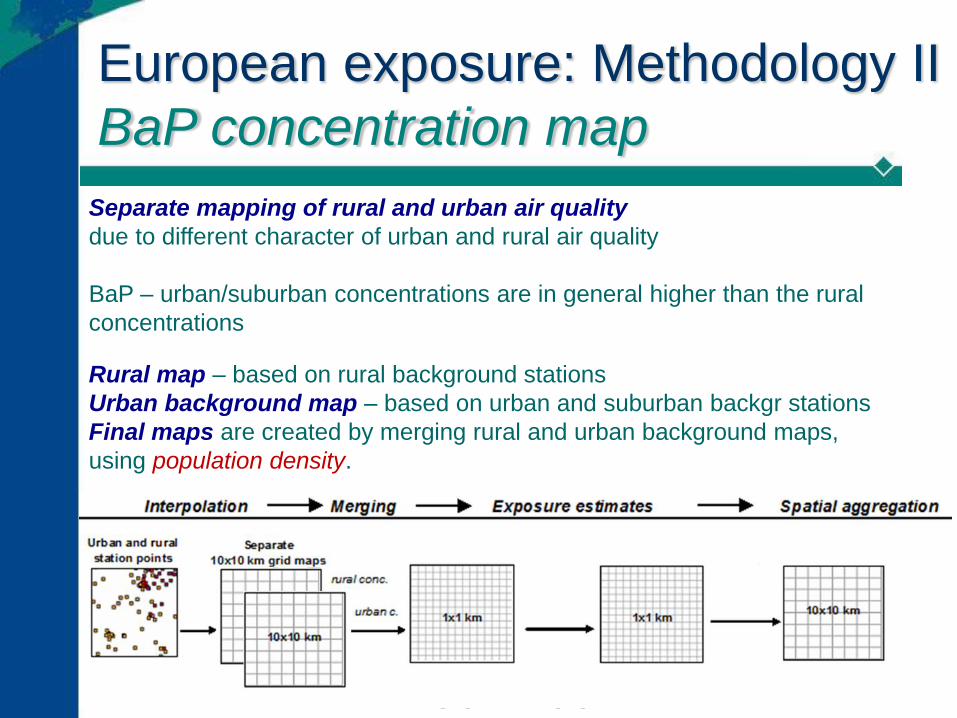
Separate mapping of rural and urban air quality
due to different character of urban and rural air quality
BaP – urban/suburban concentrations are in general higher than the rural
concentrations
Rural map – based on rural background stations
Urban background map – based on urban and suburban backgr stations
Final maps are created by merging rural and urban background maps,
using population density.
European exposure: Methodology II
BaP concentration map

Uncertainty estimates
cross-validation – the spatial interpolation is
calculated for each measurement point from all
available information except from the point in question.
Interpolation rel. standard error – should be < 0.6
9
Interpolation relative
standard error
Guerreiro et al., 2015

Interpolated BaP map (EMEP)
10Guerreiro et al., 2015

Interpolated BaP map (CHIMERE)
11Guerreiro et al., 2015

Population exposure to BaP
12
Only 12 % of the European
population live in areas with
BaP conc. under ref. level of
0.12 ng/m3 (increased cancer
incidence 1 /105 inhabitants)
20% live above the TV
Estimated lung cancer
incidence:
550 - 600 in Europe
BaP popul.
weighted conc.
< 0.12 0.12-0.4 0.4-0.6 0.6-1.0 1.0-1.5 > 1.5 (ng/m3)
EMEP 11,66 46,73 10,44 10,71 6,82 13,64 0,84
CHIMERE 12,57 46,12 9,78 11,00 6,14 14,28 0,92
> Target value > TV
BaP - annual mean, exposed population (%)
Guerreiro et al., 2015

Underestimated PAHs
health impacts
PAHs have several health impacts: lung cancer, skin and
bladder cancer, genotoxicity and mutagenicity; affects children’s'
cognitive development, & linked to cardiovascular morbidity and
mortality;
BaP is a marker for total exposure to carcinogenic PAHs & only
contributes to part of the total carcinogenic potential of PAHs;
Airborne PAHs are deposited on soil and water and may be
bioaccumulated in the food chain. In addition to inhalation
humans are also exposed to airborn PAHs through consumption
of food and water;
Concentrations and exposure to BaPs are underestimated in this
study, mainly due to the lack of measurement data.

Discussion
Biomass for domestic heating was the main
renewable energy technology in 2012 in EU28
(43% of RES).
Biomass heating plays a very important role in
meeting EU’s “20-20-20” targets.
The residential combustion sector is a main
contributor to exceedances of BaP and PM2.5
TVs in Europe.
These emissions significantly increase the risk
of respiratory disease (e.g. lung cancer), chronic
obstructive pulmonary disease and
cardiovascular disease. 14

Conclusion
There is a need to better spatial coverage of
BaP measurements, especially in countries with
expected high concentrations and few/no stations
Under CLRTAP, reporting BaP / PAH emissions is
voluntary only. There is a need for improved
BaP emissions inventories covering all
European countries.
CC & AP policies must be much better
coordinated;
15
New CEN/TC 264/WG 43:
Modelling Quality Objectives
Deliverable:
Technical Specification describing the methodology to define and
calculate:
Modelling Quality Objectives (MQO) and
Modelling Performance Indicators (MPI)
where these can be calculated on the basis of measurements
Scope:
Assessment purposes in the context of the AQ Directive
Pollutants covered PM2,5, PM10, NO2, O3
MS represented: AT, BE, DE, DK, FI, FR, NL, NO, SE, UK
16

Thank you for your attention!
Cristina Guerreiro ([email protected])
17
Guerreiro, C., Horálek, J., de Leeuw, F., Couvidat, F. (2016) Benzo(a)pyrene in
Europe: Ambient Air Concentrations, Population Exposure and Health Effects. J. of
Environmental Pollution, DOI: 10.1016/j.envpol.2016.04.081
http://authors.elsevier.com/authorforms/ENPO8670/d9c5760d253207b5e6c976bb2c210863