estimates of total phenolics content in peruvian …
TRANSCRIPT
ESTIMATES OF TOTAL PHENOLICS CONTENT IN PERUVIAN ECOTYPES OF
LUPIN (Lupinus mutabilis) (BITTER AND DEBITTERED)
Zuly Sabelino-Francia1A, Patricia Glorio-Paulet1
B, Luis Rodriguez-Saona2C, Felix Camarena 1D
1 Universidad Nacional Agraria La Molina, Perú. 2 Ohio State University. USA.
1
Objective
• Characterize the total phenolic content in 52 different Ecotypes of Peruvian Lupinus mutabilis.
• Evaluate the effect of water washing processing (for alkaloid removal) in the phenolics content that remains in ecotypes.
• Evaluate alternative methodologies in the phenolics content determinations, that could help in the characterization of thousand of ecotypes for Peruvian biodiversity. For example methods based in spectroscopy.
2
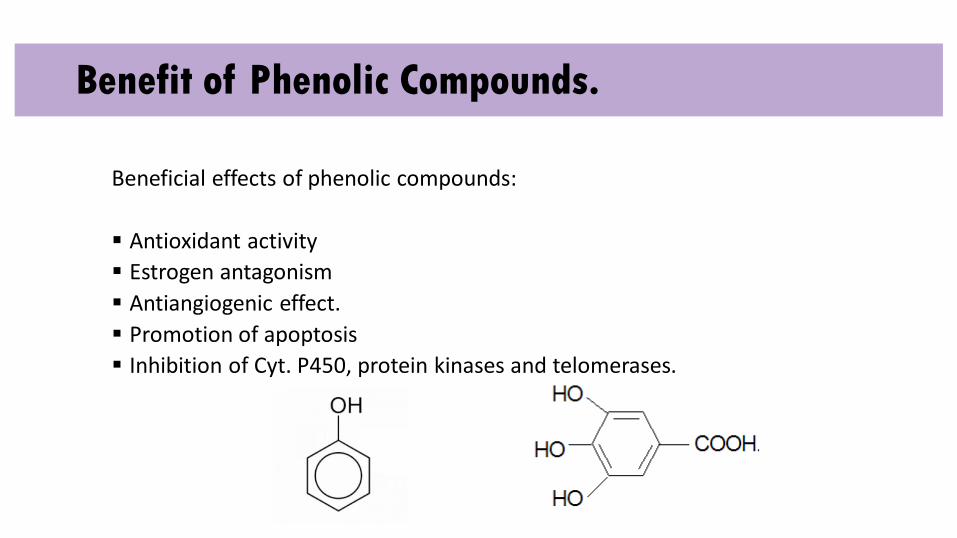
Benefit of Phenolic Compounds.
Beneficial effects of phenolic compounds:
Antioxidant activity
Estrogen antagonism
Antiangiogenic effect.
Promotion of apoptosis
Inhibition of Cyt. P450, protein kinases and telomerases.
• They are powerful inhibitors of HNO2 (nitrous acid) which decomposes nitrosamines and causes deamination of DNA bases, especially guanine.
• Phenolic compounds protect the gastrointestinal system in situations of excessive production of reactive nitrogenous species
Fuente: Cadenas y Packer, 2002. Handbook of Antioxidants. Second Edition. CRC Taylor y Francis.
Phenolic Compounds in plants
Materials and MethodsFor this research, 52 ecotypes of Lupinus mutabilis (called “Chocho” or “Tarwi” in Peru) were obtained as seeds.
5
6
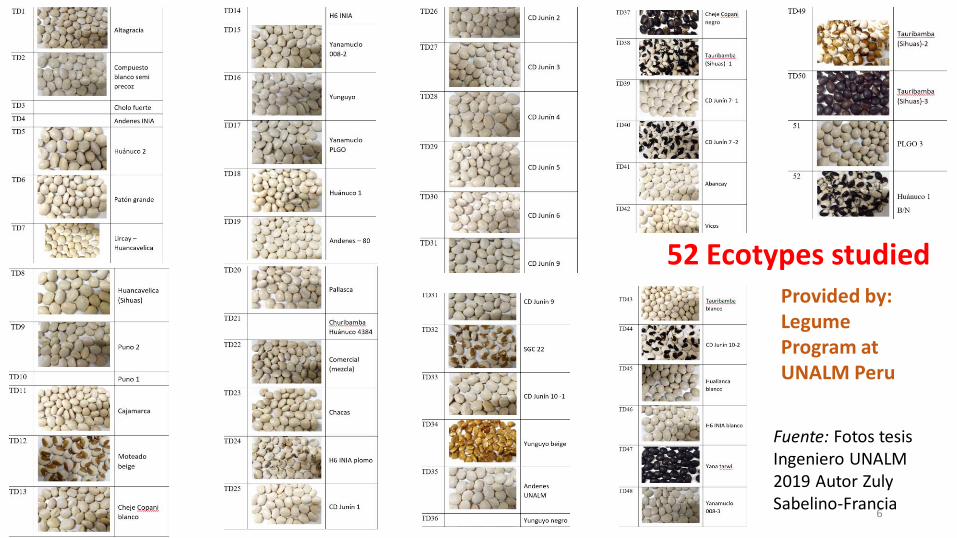
52 Ecotypes studied
Fuente: Fotos tesis Ingeniero UNALM 2019 Autor ZulySabelino-Francia
Provided by: Legume Program at UNALM Peru
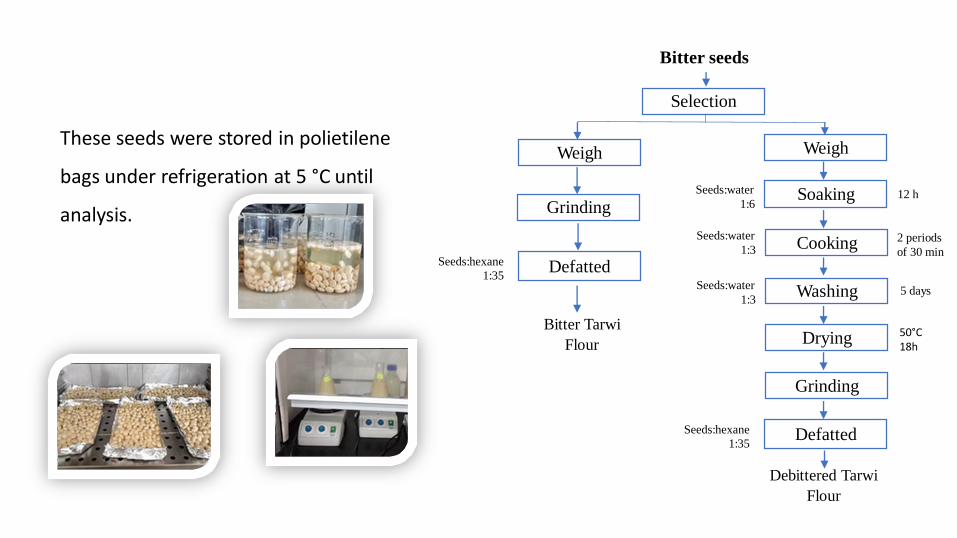
These seeds were stored in polietilene
bags under refrigeration at 5 °C until
analysis.
Weigh
Soaking
Cooking
Washing
Drying
Defatted
Grinding
Selection
Bitter seeds
Weigh
Defatted
Grinding
Bitter Tarwi
Flour
Debittered Tarwi
Flour
Seeds:hexane
1:35
Seeds:hexane
1:35
Seeds:water
1:3
Seeds:water
1:3
Seeds:water
1:6 12 h
5 days
2 periods
of 30 min
50°C 18h
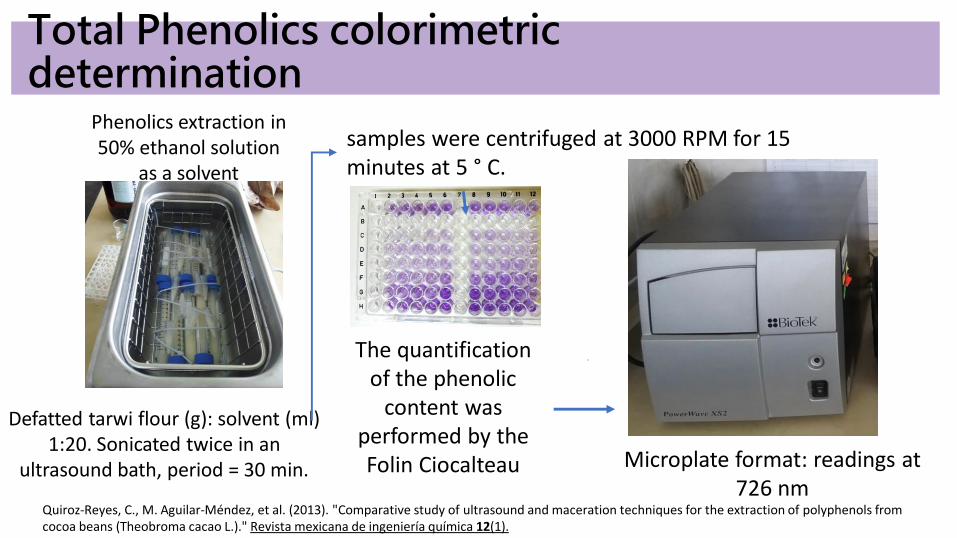
Total Phenolics colorimetricdetermination
Phenolics extraction in 50% ethanol solution
as a solvent
Defatted tarwi flour (g): solvent (ml) 1:20. Sonicated twice in an
ultrasound bath, period = 30 min.
The quantification of the phenolic
content was performed by the Folin Ciocalteau Microplate format: readings at
726 nm
samples were centrifuged at 3000 RPM for 15 minutes at 5 ° C.
Quiroz-Reyes, C., M. Aguilar-Méndez, et al. (2013). "Comparative study of ultrasound and maceration techniques for the extraction of polyphenols fromcocoa beans (Theobroma cacao L.)." Revista mexicana de ingeniería química 12(1).
0
100
200
300
400
500
600
T1
T2
T3
T4
T5
T6
T7
T8
T9
T1
0T
11
T1
2T
13
T1
4T
15
T1
6T
17
T1
8T
19
T2
0T
21
T2
2T
23
T2
4T
25
T2
6T
27
T2
8T
29
T3
0T
31
T3
2T
33
T3
4T
35
T3
6T
37
T3
8T
39
T4
0T
41
T4
2T
43
T4
4T
45
T4
6T
47
T4
8T
49
T5
0T
51
T5
2
Phen
olic
toat
al C
onte
nt
(mg g
allic
acid
/100g)
Ecotype codeBitter Lupinus mutabilis Debittered Lupinus mutabilis
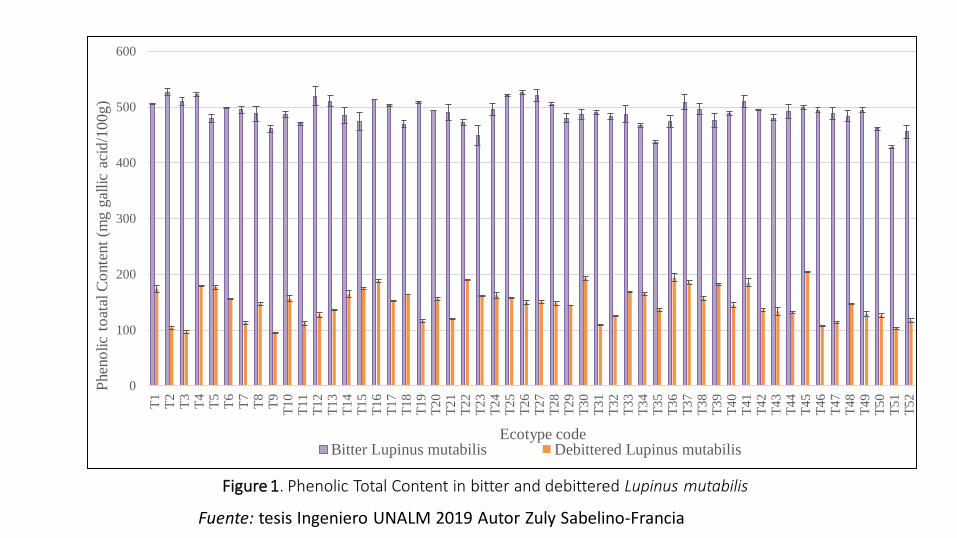
Figure 1. Phenolic Total Content in bitter and debittered Lupinus mutabilis
Fuente: tesis Ingeniero UNALM 2019 Autor Zuly Sabelino-Francia
Bitter* Debittered*
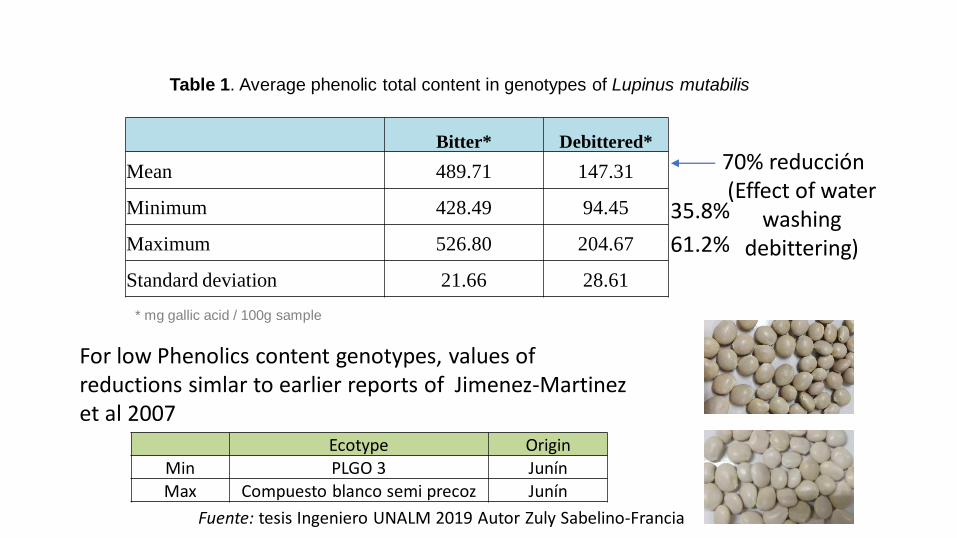
Mean 489.71 147.31
Minimum 428.49 94.45
Maximum 526.80 204.67
Standard deviation 21.66 28.61
Table 1. Average phenolic total content in genotypes of Lupinus mutabilis
* mg gallic acid / 100g sample
Ecotype OriginMin PLGO 3 JunínMax Compuesto blanco semi precoz Junín
70% reducción(Effect of water
washingdebittering)
35.8%
61.2%
For low Phenolics content genotypes, values ofreductions simlar to earlier reports of Jimenez-Martinezet al 2007
Fuente: tesis Ingeniero UNALM 2019 Autor Zuly Sabelino-Francia
Construction of MIR spectrum
For methanolic extracts and flours.
Other possibility for phenolics determinations….and other determinations
11
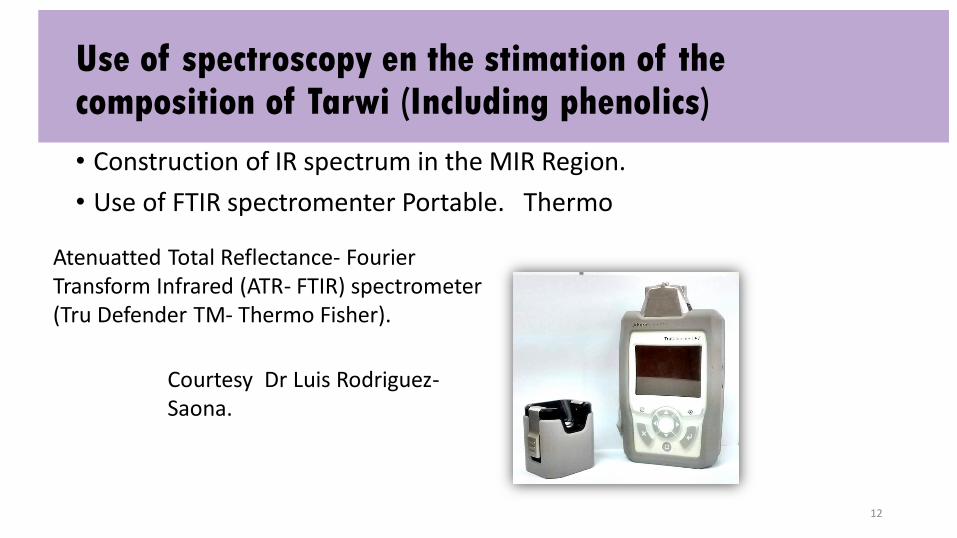
Use of spectroscopy en the stimation of thecomposition of Tarwi (Including phenolics)
• Construction of IR spectrum in the MIR Region.
• Use of FTIR spectromenter Portable. Thermo
12
Courtesy Dr Luis Rodriguez-Saona.
Atenuatted Total Reflectance- Fourier Transform Infrared (ATR- FTIR) spectrometer (Tru Defender TM- Thermo Fisher).
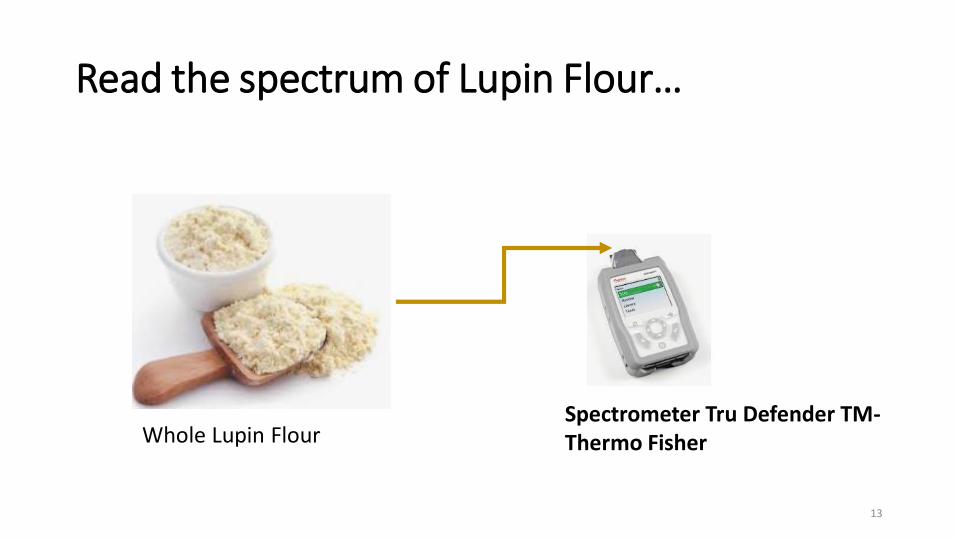
Read the spectrum of Lupin Flour…
13
Spectrometer Tru Defender TM-Thermo FisherWhole Lupin Flour
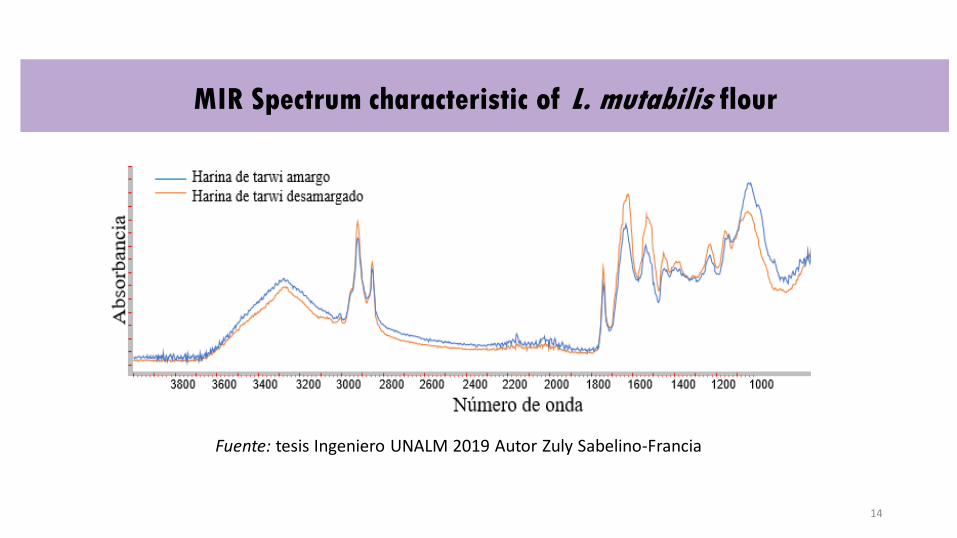
MIR Spectrum characteristic of L. mutabilis flour
14
Fuente: tesis Ingeniero UNALM 2019 Autor Zuly Sabelino-Francia
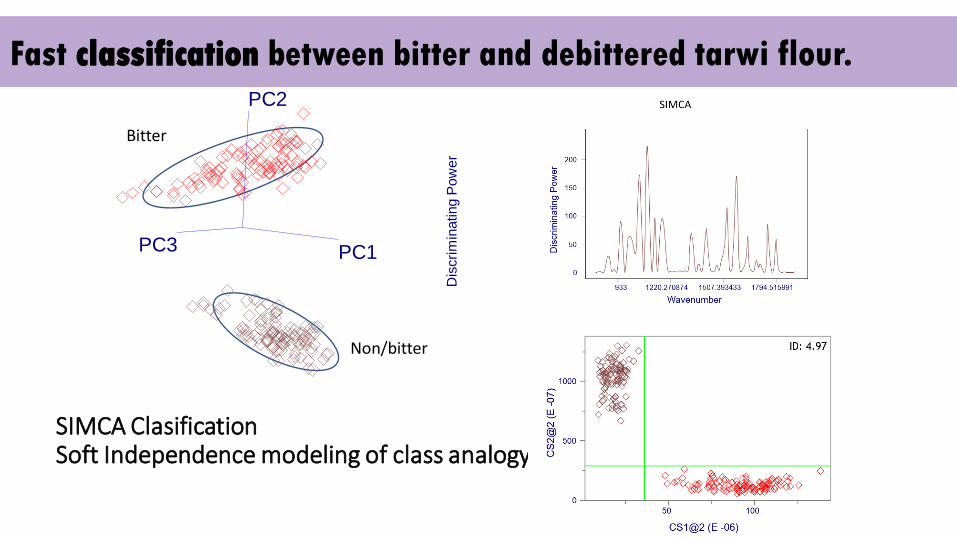
PC1
PC2
PC3
933 1220.270874 1507.393433 1794.515991
Wavenumber
Dis
cri
min
ating
Pow
er
Bitter
Non/bitter
SIMCA ClasificationSoft Independence modeling of class analogy
Fast classification between bitter and debittered tarwi flour.
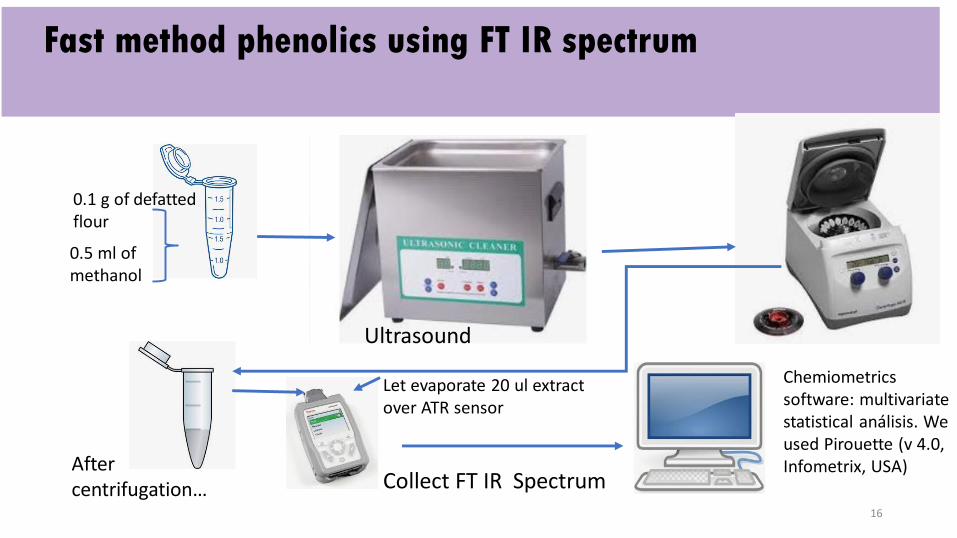
Fast method phenolics using FT IR spectrum
16
0.1 g of defatted flour
0.5 ml of methanol
After centrifugation…
Let evaporate 20 ul extractover ATR sensor
Chemiometricssoftware: multivariatestatistical análisis. Weused Pirouette (v 4.0, Infometrix, USA)
Collect FT IR Spectrum
Ultrasound
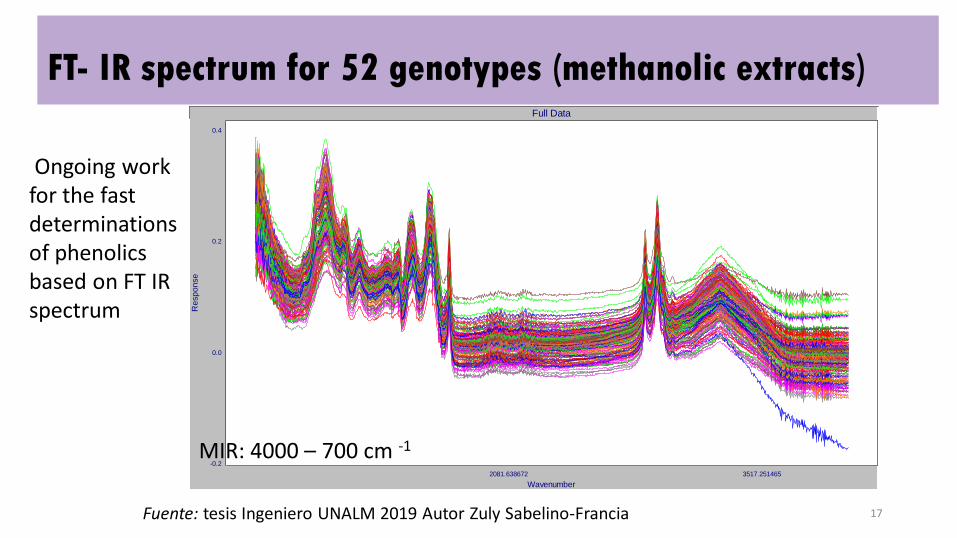
FT- IR spectrum for 52 genotypes (methanolic extracts)
17
Full Data
2081.638672 3517.251465
Wavenumber
-0.2
0.0
0.2
0.4
Re
sp
on
se
MIR: 4000 – 700 cm -1
Fuente: tesis Ingeniero UNALM 2019 Autor Zuly Sabelino-Francia
Ongoing workfor the fastdeterminationsof phenolicsbased on FT IR spectrum
480 500 520
Measured Phenolic Content
480
490
500
510
520
Pre
dic
ted P
henolic
Conte
nt
4
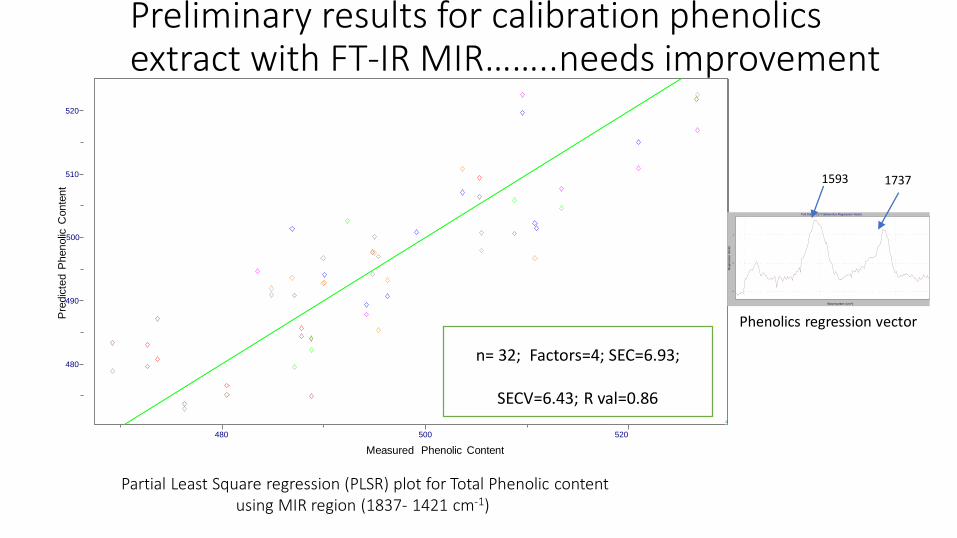
n= 32; Factors=4; SEC=6.93;
SECV=6.43; R val=0.86
Partial Least Square regression (PLSR) plot for Total Phenolic contentusing MIR region (1837- 1421 cm-1)
Preliminary results for calibration phenolicsextract with FT-IR MIR……..needs improvement
Full Data:PLS:Y1/phenolics:Regression Vector
Wavenumber (cm-1)
-1
0
1
Reg
ressio
n V
ecto
r
4
Phenolics regression vector
1593 1737
Conclusions
• The 52 bitter genotypes explored showed a variability in content ofphenolics of 21.6%. Values ranged between 428 and 526 mg Ac galico/100 g.
• Phenolic content decreased for all ecotypes analyzed after debittering. The type of phenolic that remains after debitteringneeds to be analyzed.
• The FT-IR spectroscopy to be improved would allow thecharacterization of high numbers of material in germoplasm Banks.
• FT-IR spectroscopy confirms important changes in compositionbetween bitter and unbitter siamples that allows a rapid clasificationof lupin flours.
19
Aknowledgements
• We acknowledge Dr. Luis Rodriguez-Saona for kindly provide the portable FT-IR (ATR-MIR Thermo) and to the PNIA project for Tarwidirected by Felix Camarena Mayta for funding.
20