estimates of the ultimate number of oil and gas fields
TRANSCRIPT
UNITED STATES DEPARTMENT OF INTERIOR
GEOLOGICAL SURVEY
Estimates of the ultimate number of oil and gas fields expected to be found
in the Minnelusa Play of the Power River Basin, Wyoming
by
Lawrence J. Drew John H. Schuenemeyer Richard D. Mast Gordon L.'Dolton
Open-File Report
This report is preliminary and has not been reviewed for conformity with U.S. Geological Survey editorial standards and stratigraphic nomenclature.
1987
Introduction
The purpose of this study is to devise a methodology for, and forecast
of- the ultimate volume of oil and gas expected to be found in the Minnelusa
play of the.Powder River Basin, Wyoming.
The Minnelusa Sandstone Play
The Minnelusa sandstone play, on the broad east flank of the Powder
River Basin, describes the occurrence of oil in a suite of primarily
stratigraphic traps in the upper part of the Pennsyivanian and Permian
Minnelusa formation. Reservoirs are principally quartzose aeolian dune
sandstones of Wolfcampian age within a complex cyclic sequence of carbonates
and sandstones of marine and non-marine origin.
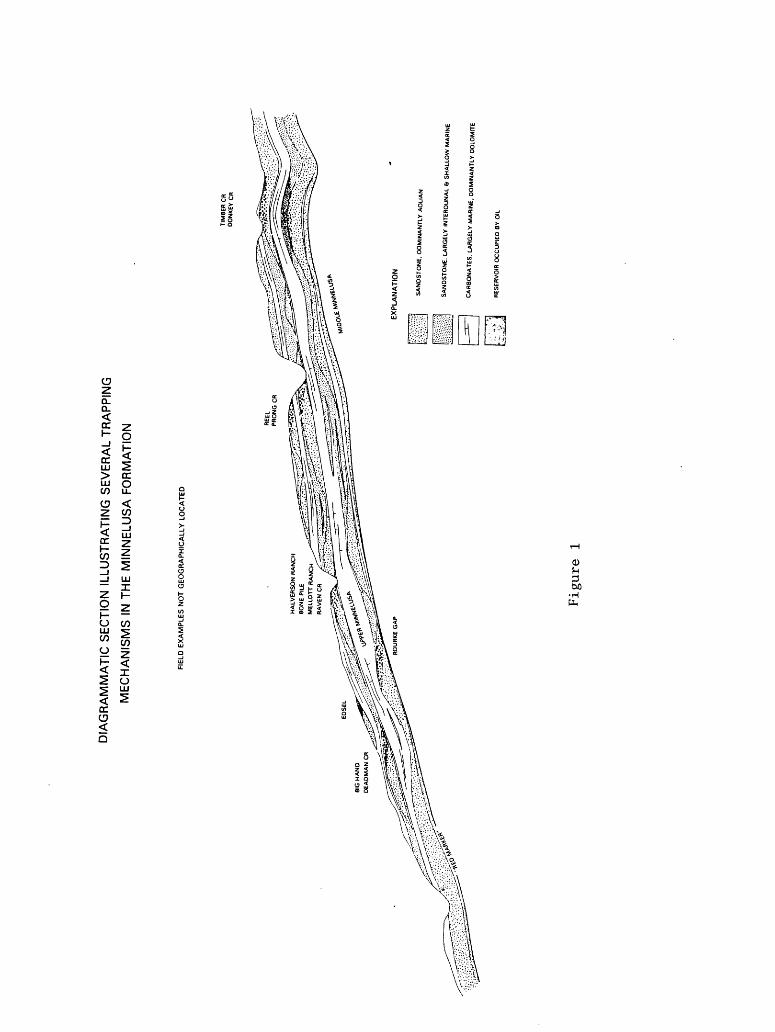
Some Minnelusa traps are associated with a regional unconformity at the
top of the formation. Others are formed by local variations in porosity and
permeability related to depositional and diagenetic factors particularly
of these (Van West, 1972; George, 1984; Fryberger, 1984) (Fig. 1). The play
is limited to areas underlain by sandstone reservoirs in the upper part of
the Minnesula formation, the "Upper Minnelusa" of industry usage. The oil
is believed to derive from dark marine shales in the underlying Desmoinesian
sequence (Clayton, 1984). To the south the play appears to be limited by
the widespread occurrence of evaporites in the upper part of the Minnelusa
in that area and their probable adverse effects on migration and reservoir
porosity.
Lack of any large scale structural features within the play, beyond the
bounding Black Hills monocline, emphasizes the importance of small scale
stratigraphic and structural controls on hydrocarbon entrapment, which are
readily documented in detailed studies. The significance of subtle larger
paleotectonic features, such as the Belle Fourche Arch of Slack (1981)
remains problematic.
The Study Area
For purpose of analysis, the Minnelusa is divided into two parts; one
is the region which is moderately or extensively explored; the second is the
remaining area which is very lightly explored. Statistical methodology will
be applied to the former area while estimation by analogy is used in the
latter. This report is concerned with estimates of undiscovered oil and ga
fields in the moderately to extensively explored portion of the Minnelusa
trend. Figure 2 shows the area of the Powder River Basin in which the
Minnelusa Play has been moderately to extensively explored by drilling of
wells. The symbols on the figure used to delineate the explored area of the
play and a description of the data used to construct the figure are given in
Appendix I. A brief description of the program logic used to construct the
map is also given in Appendix I. The computer program used was written by
David Root.
Description of the Data File
The study is based on 1,710 wildcat wells, beginning with one drilled
in 1930 and continuing with those drilled through December, 1981. During
this period, 151 oil fields but no gas fields were discovered. They
contained 381.5 million barrels of oil (BO) and ranged in size from a few
thousand BO to 51.7 million BO in the Raven Creek field, discovered in
March, 1960. Dissolved gas associated with these fields is very small and
is not included. The number of wildcat wells and discoveries by year is
presented in table 1.
From the results of the geologic analysis, the play was described,
geographically delineated, and the boundary digitized to provide a framework
for managing and editing stratigraphic, exploration, and geographic data for
use in resource assessment studies. Exploratory drill holes were then
mapped for the Minnelusa play, using data retrieved from the Well History
Control System (WHCS) from a file of over 30,000 exploration and development
wells in the basin. There were 1,710 exploratory tests for the Minnelusa
play. The data were carefully analyzed to insure that all discovered pools
in the Minnelusa play were represented by a single discovery well.
Finally, an example oil and gas field data file was created for the
Minnelusa play, using several sources, which summarizes published data for
each pool. This file contains information on 151 separate pools discovered
through 1981. It characterizes the geologic properties of each reservoir,
and it gives size data for pools, which were in part generated or verified
by independent extrapolation of ultimate recoveries from production data.
Principal sources of field data were PDS, WGA Powder River Basin Field
symposium (1981), and state production statistical summaries.
Analysis of the Historical Rates of Discovery
For purposes of analyses the 151 fields discovered through the end of
1981 were partitioned into size classes. The endpoints of each of these
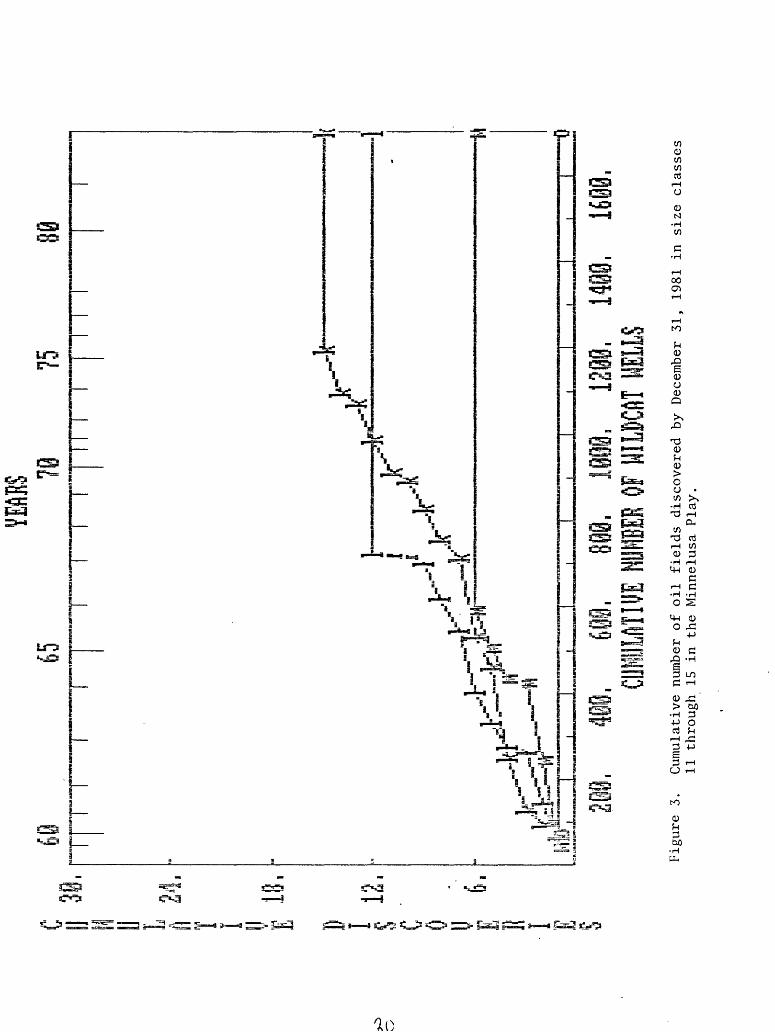
class intervals age given in table 2. In figure 3, the graphs of the
cumulative discovery curves for oil and gas fields in classes 11 through 15
(the letters 'k' through 'o') reveal that most of these largest fields were
discovered very early in the exploration history of the region. (The letter
k symbolized the data for field size class 11,1 field size class 12,...,
onto o for size class 15). For example, all the fields in the four largest
class had been discovered by early 1967 when only 727 wildcat wells had been
drilled in the region. No fields were discovered in size class 14. This
pattern of discovery, in which the largest fields are discovered early, is
widely observed in other plays.
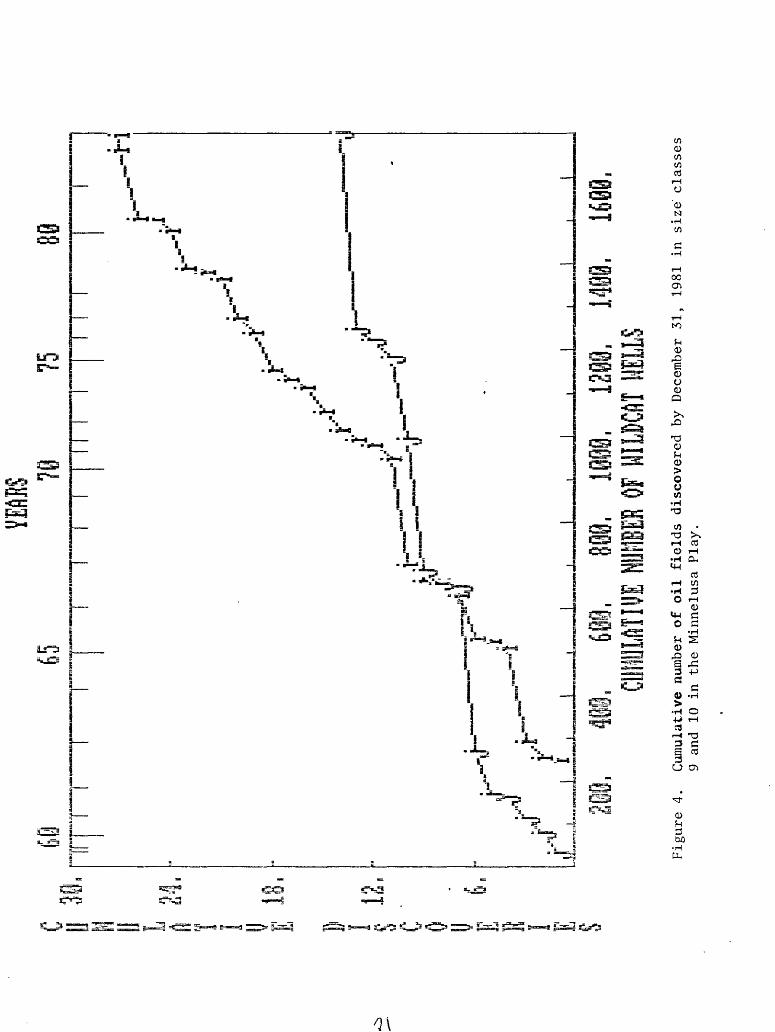
The cumulative discovery curve of size class 10 (the letter 'j') at
about 300 cumulative wildcat wells begins to show a rollover effect (Fig. 4).
The curve remains flat till 600 wells approximately, but then between 600
and 700 wells and again between 1200 and 1300 discoveries occur frequently.
The characteristics exhibited in this discovery curve are suggestive of a
multiple play. Leasing or other restrictions on drilling can sometimes
cause this periodic group of discoveries; however, the form of the discovery
curve in class 10 may be due to statistical fluctuation.
By contrast, the cumulative discovery graph for class 9 (0.76 x 10^ BO
to 1.52 x 10 6 BO; the letter 'i' in fig. 4) shows that fields of this size
are found at relatively even intervals throughout the discovery sequence.
It can be deduced from this observation that many more fields of this size
remain to be discovered in the study area. Class size 9 is the mode of the
distribution of discoveries with 27 fields having been discovered through
the end of 1981.
Estimating the Undiscovered Petroleum
Before an estimate of the number of oil and gas fields remaining to be
found can be made, a brief digression is made to note that the sudden
termination of the discoveries in class sizes 11 through 15 precluded the
use of a 'smooth curve' discovery process such-as the negative exponential,
Arps-Roberts model. For example, in size class 11 (the letter 'k') in
figure 3, fields were discovered at a more or less uniform rate through the
15th discovery which occurred in April, 1975, by the 1198th wildcat well.
No other discoveries in this class were made during the drilling of 412
additional wildcat wells. Because of the failure to discovery fields ini
these size classes during this period, we infer that the probability of
discoveries of additional fields is very small.
The lack of a well defined asymptotic behavior in the graph for the
cumulative discoveries for field size class 10 suggests that a number of
fields remain to be discovered in this size class. The nature of the size
class 10 data series makes it difficult to obtain statistically meaningful
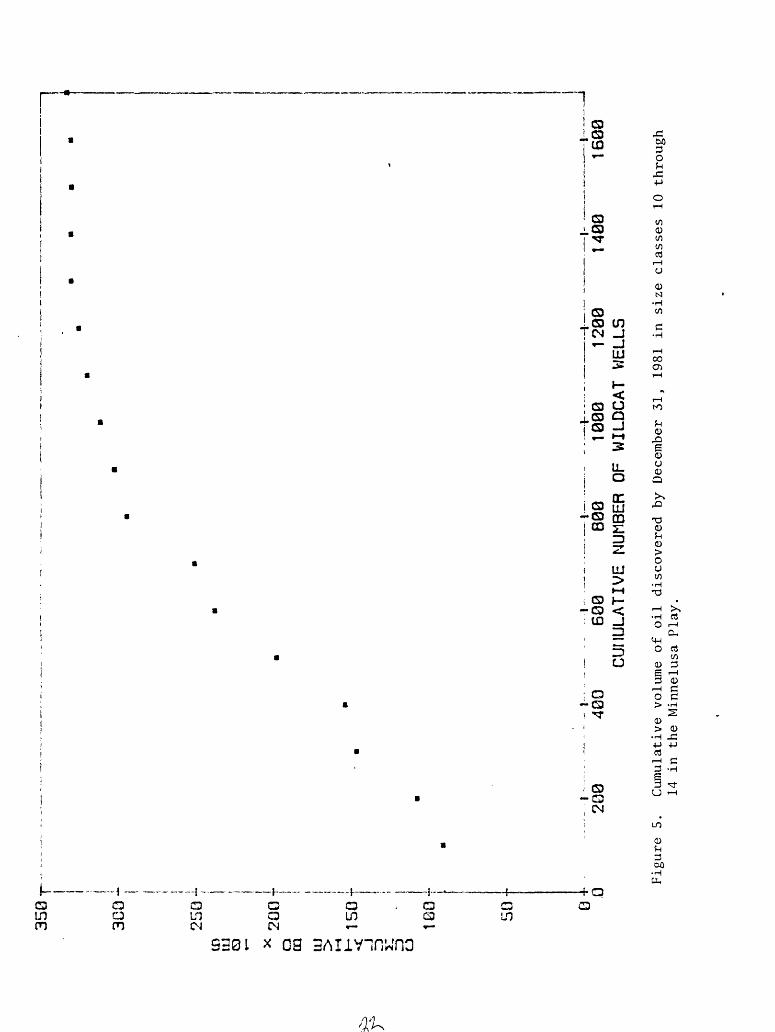
results using an Arps-Roberts type of approach. As an alternative, a
negative exponential model was fit to cumulative BO in size classes 10 and
greater. The cumulative BO discovered for each 100 wells for classes 10 and
greater versus cumulative wildcat wells is plotted in figure 5. The model
used to estimate the ultimate volume of BO in these size classes is:
U10G = uwH - exp(-kw))
where UIQG ^ s ultimate volume of on expected to be found in size classes
greater than or equal to 10 and Uw is the oil found by w wildcat wells in
these size classes. The ultimate UIQG and k were estimated by NLIN2
(Marquardt, 1963), a nonlinear least squares program and yielded UIQG =
361.1 x 10 6 BO. There were 332.8 x 10 6 BO found by 1,710 wildcat wells
through the end of 1981. Thus, 28.3 x 10^ BO is the estimated undiscovered
volume of oil in size classes 10 and greater. This BO was assigned to class
10 and resulted in 12.5 additional fields expected to be discovered (12.5 =
28.3/2.26, where 2.26 x 10^ BO is the average field size of discovered
deposits in class 10). A similar type of estimation procedure was used in a
study of the Permian basin (pages 22 to 28, USGS, 1980).
The oil and gas remaining to be discovered in the study area is
expected to be found in small fields. An estimate of the number of
remaining fields is obtained by assuming that the underlying field size
distribution follows a Pareto, or that the number of fields in the different
size classes has a geometric distribution and that the distribution of
discovered fields which appears to be lognormal in shape results from
economic truncation. For example, see Drew, Schuenemeyer, and Bawiec
(1982), and Schuenemeyer and Drew (1983). For the Minnelusa data it appears
that the economic truncation point is between classes 9 and 10 (at
approximately 1.52 x 10^ BO). As a consequence of economic truncation the
numbers of fields in smaller size classes (size class 9 and smaller) have
been under reported and thus it is not possible to obtain meaningful
estimates in these size classes using standard discovery process estimation
techniques.
When sufficient data are available, an estimate of the geometric ratio
r = Fj__^/Fj_, where Fj_ is the ultimate number of fields expected to be found
in size class i, is obtained directly. For this study, r = 1.65 was chosen
by analogy. In order that the number of fields expected to be found in size
class 9 and smaller does not depend exclusively on the estimated ultimate
number of fields in size class 10, a smoothed estimate of the F^ (F|) in
the larger (non-truncated) size classes is made. To preserve the expected
ultimate oil in size classes 10 through 13 set:
13(UIOG - UH»G) - F?S I n--13" 1
- 1=10
where U 10G - U 14G = (361.1 - 51.7) x 10 6 BO
= 309.4 x 10 6 BO
the expected ultimate oil in size classes 10 through 13, F*^ is the
smoothed estimate for the ultimate number of fields to be found in size
class 13, and yi is the mean BO in size class i. (Siz*e classes 14 and 15
were excluded from the smoothing process because they contained only one
field.) Solving the preceding equation, yields F*3 = 6.217 x 10 6 BO.
Since '
F?0 - r13-10F » 3
= 1.65 3 x 6.217 x 10 6 BO
= 2.79 x 10 6 BO
The smoothed estimates of the ultimate number of deposits expected to be
found are computed from the formula
Ff . r (10-l) F»0> i . 6> ...9
and are given in column 3 of table 3.
A result of this analysis is that 141.5 x 10^ BO is estimated to remain
to be discovered in the study area in field size class 10 down to and
including field size class 6 (95,000 to 3,040,000 BO). About 73 percent of
the total amount of oil and gas occurring in the Minnelusa in fields larger
than 95,000 BO has been discovered. The oil and gas that remains is
forecast to occur in 363.6 expected fields. From table 3, it can be seen
that the volume of oil and gas remaining to be found is uniformly
distributed through size classes 6 through 10. Forty percent of the BO
remaining to be found is expected to occur in the 306.1 smallest fields
(those in classes 6 and 7).
References
Clayton, J. L. t and Ryder, R. T. t 1984, Organic geochemistry and black
shales and oils in the Minnelusa Formation (Permian and Pennsylvanian) ,
Powder River Basin, Wyoming, in Woodward, J., Meissner, F.F., and
Clayton, J., L., eds., Hydrocarbon source rocks of the greater Rocky
Mountain Region, Rocky Mountain Association of Geologists, Denver,
Colorado, p. 231-254.
Drew, L. J., Schuenemeyer, J. H., and Bawiec, W. J., 1982, Estimation of the
future rates of oil and gas discoveries in the Western Gulf of Mexico,
U.S. Geological Survey Professional Paper 1252, 26 p.
Fryberger, S. G., 1984, The Permian Upper Minnelusa Formation, Wyoming:
Ancient example of an offshore-prograding eolian sand sea with
geomorphic facies, and system-boundary traps for petroleum, in 35th
Annual Field Conference, 1984, WGA Guidebook, p. 75-95.
George, G. R., 1984, Cyclic sedimentation and depositional environments of
the Upper Minnelusa Formation, central Campbell County, Wyoming, in
Goolsby, J., and Morton, D., The Permian and Pennsylvanian Geology of
Wyoming, Wyoming Geological Association, 35th Annual Field Conference,
1984, WGA Guidebook, p. 75~95.
Schuenemeyer, J. H., and Drew, L. J., 1983, A procedure to estimate the
parent population of the size of oil and gas fields as revealed by a
study of economic truncation, Journal of the International Association
for Mathematical Geology, v. 15, no. 1, p. 145-161.
Slack, P. B., 1981, Paleotectonics and hydrocarbon accumulation, Powder
River Basin, Wyoming, AAPG Bulletin, v. 65, no. 4, p. 730-743.
U.S. Geological Survey, 1980, Future supply of oil and gas from the Permian
Basin of west Texas, and Southeastern New Mexico, U.S. Geological
Survey Circular 828, 57 p.
Van West, F. P., 1972, Trapping mechanisms of Minnelusa oil accumulations,
northeastern Powder River Basin, Wyoming, The Mountain Geologist, v. 9,
no. 1, p. 3-20.
WGA, 1981, Power River Basin oil and gas fields, 2 vols., 2H1 pages.
10
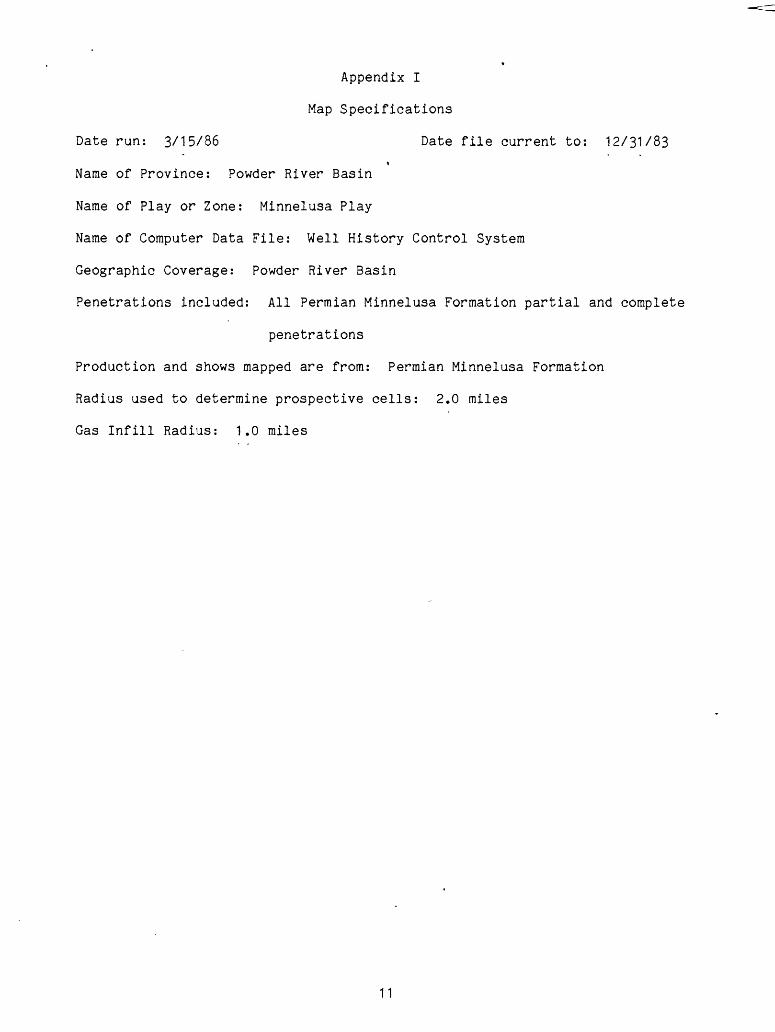
Appendix I
Map Specifications
Date run: 3/15/86 Date file current to: 12/31/83i
Name of Province: Powder River Basin
Name of Play or Zone: Minnelusa Play
Name of Computer Data File: Well History Control System
Geographic Coverage: Powder River Basin
Penetrations included: All Permian Minnelusa Formation partial and complete
penetrations
Production and shows mapped are from: Permian Minnelusa Formation
Radius used to determine prospective cells: 2.0 miles
Gas Infill Radius: 1.0 miles
11
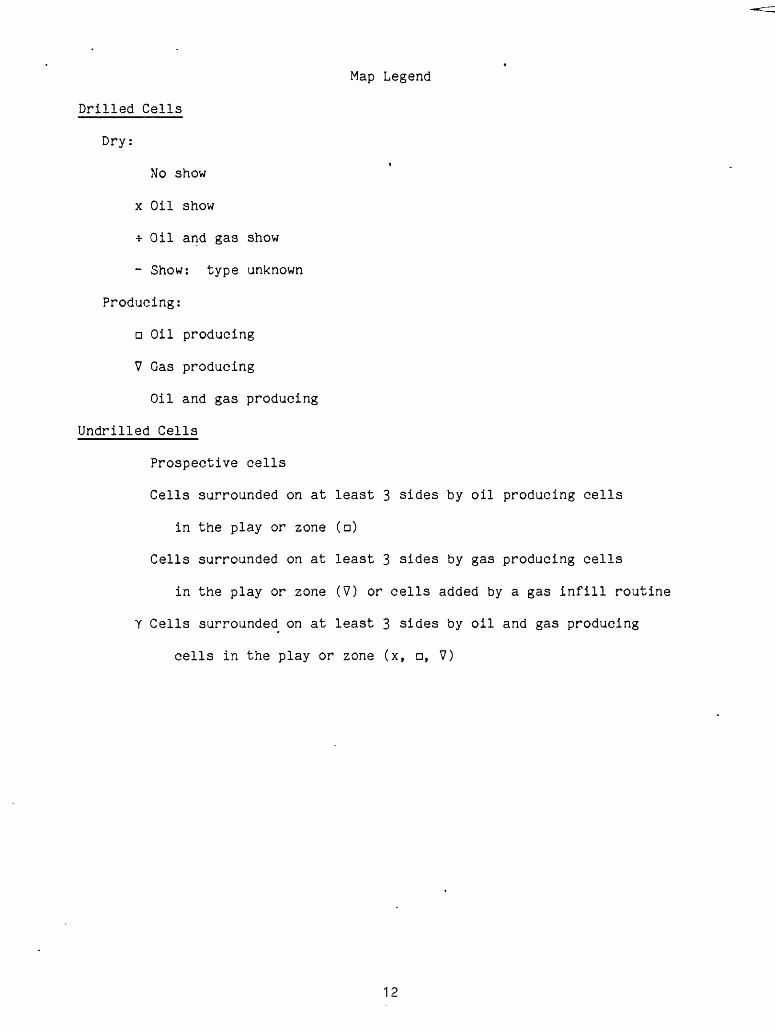
Map Legend
Drilled Cells
Dry:i
No show
x Oil show
* Oil and gas show
- Show: type unknown
Producing:
D Oil producing
V Gas producing
Oil and gas producing
Undrilled Cells
Prospective cells
Cells surrounded on at least 3 sides by oil producing cells
in the play or zone (a)
Cells surrounded on at least 3 sides by gas producing cells
in the play or zone (V) or cells added by a gas infill routine
Y Cells surrounded on at least 3 sides by oil and gas producing
cells in the play or zone (x, a, V)
12
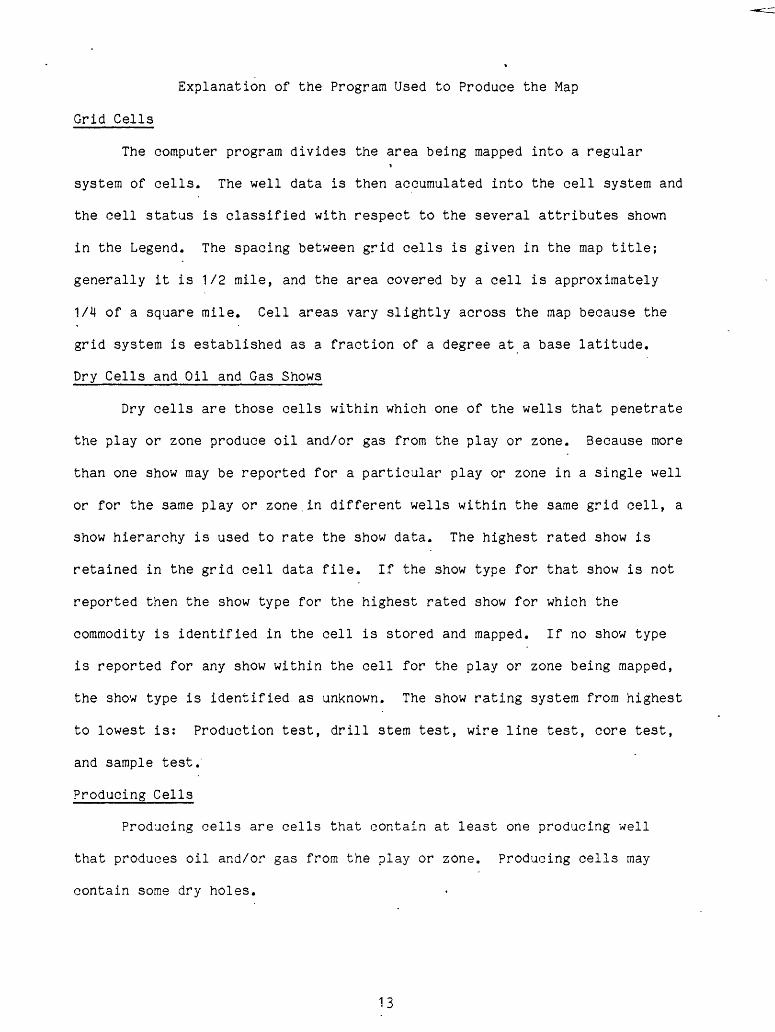
Explanation of the Program Used to Produce the Map
Grid Cells
The computer program divides the area being mapped into a regulari
system of cells. The well data is then accumulated into the cell system and
the cell status is classified with respect to the several attributes shown
in the Legend. The spacing between grid cells is given in the map title;
generally it is 1/2 mile, and the area covered by a cell is approximately
1/M of a square mile. Cell areas vary slightly across the map because the
grid system is established as a fraction of a degree at a base latitude.
Dry Cells and Oil and Gas Shows
Dry cells are those cells within which one of the wells that penetrate
the play or zone produce oil and/or gas from the play or zone. Because more
than one show may be reported for a particular play or zone in a single well
or for the same play or zone.in different wells within the same grid cell, a
show hierarchy is used to rate the show data. The highest rated show is
retained in the grid cell data file. If the show type for that show is not
reported then the show type for the highest rated show for which the
commodity is identified in the cell is stored and mapped. If no show type
is reported for any show within the cell for the play or zone being mapped,
the show type is identified as unknown. The show rating system from highest
to lowest is: Production test, drill stem test, wire line test, core test,
and sample test.
Producing Cells
Producing cells are cells that contain at least one producing well
that produces oil and/or gas from the play or zone. Producing cells may
contain some dry holes.
13
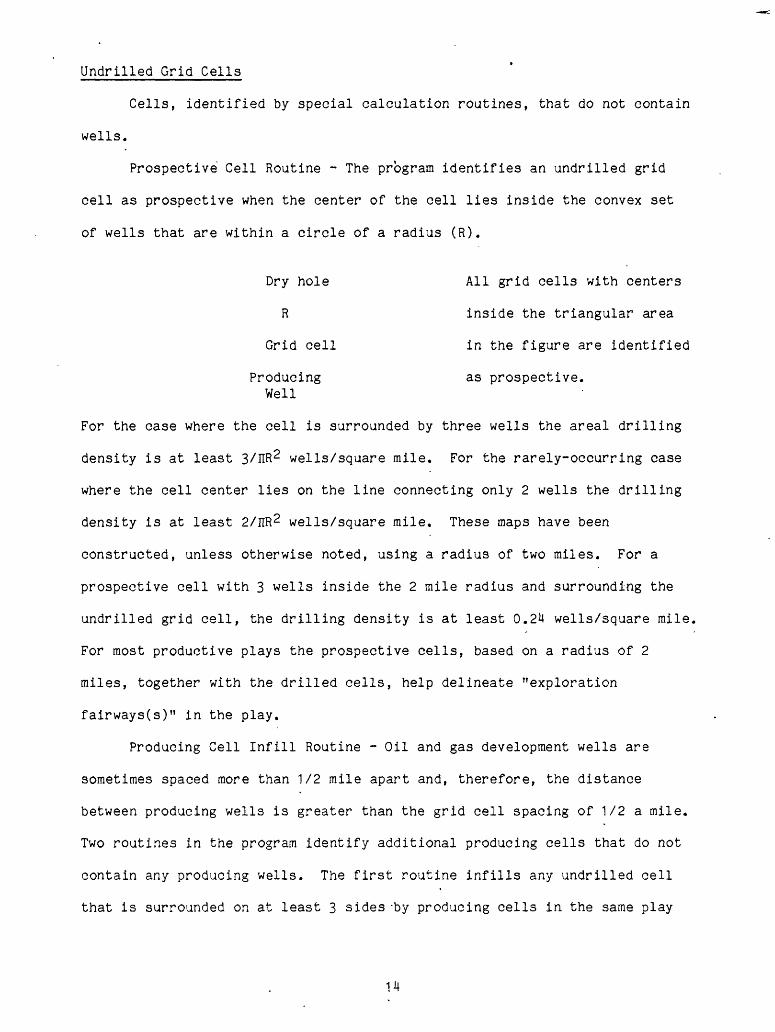
Undrilled Grid Cells
Cells, identified by special calculation routines, that do not contain
wells.
Prospective Cell Routine - The program identifies an undrilled grid
cell as prospective when the center of the cell lies inside the convex set
of wells that are within a circle of a radius (R).
Dry hole All grid cells with centers
R inside the triangular area
Grid cell in the figure are identified
Producing as prospective. Well
For the case where the cell is surrounded by three wells the areal drilling
density is at least 3/IIR2 wells/square mile. For the rarely-occurring case
where the cell center lies on the line connecting only 2 wells the drilling
density is at least 2/IIR2 wells/square mile. These maps have been
constructed, unless otherwise noted, using a radius of two miles. For a
prospective cell with 3 wells inside the 2 mile radius and surrounding the
undrilled grid cell, the drilling density is at least 0.2M wells/square mile.
For most productive plays the prospective cells, based on a radius of 2
miles, together with the drilled cells, help delineate "exploration
fairways(s)" in the play.
Producing Cell Infill Routine - Oil and gas development wells are
sometimes spaced more than 1/2 mile apart and, therefore, the distance
between producing wells is greater than the grid cell spacing of 1/2 a mile.
Two routines in the program identify additional producing cells that do not
contain any producing wells. The first routine infills any undrilled cell
that is surrounded on at least 3 sides -by producing cells in the same play
or zone. The commodity identified for these cells is determined by the
commodity or commodities produced in the surrounding cells. The second
routine, which follows the first routine, infills undrilled gas producingi
cells not identified by the first routine. The second routine operates in
the same way as the prospective cell routine but in this case uses only the
gas producing wells in the file. Normally a radius of 1 mile is used to
calculate the undrilled gas producing cells.
Drilling Statistics
The drilling statistics are for all wells that penetrate the play
zone. Care should be exercised in using these data because they may include
data for plays or zones that underlie the play or zone being mapped.
15
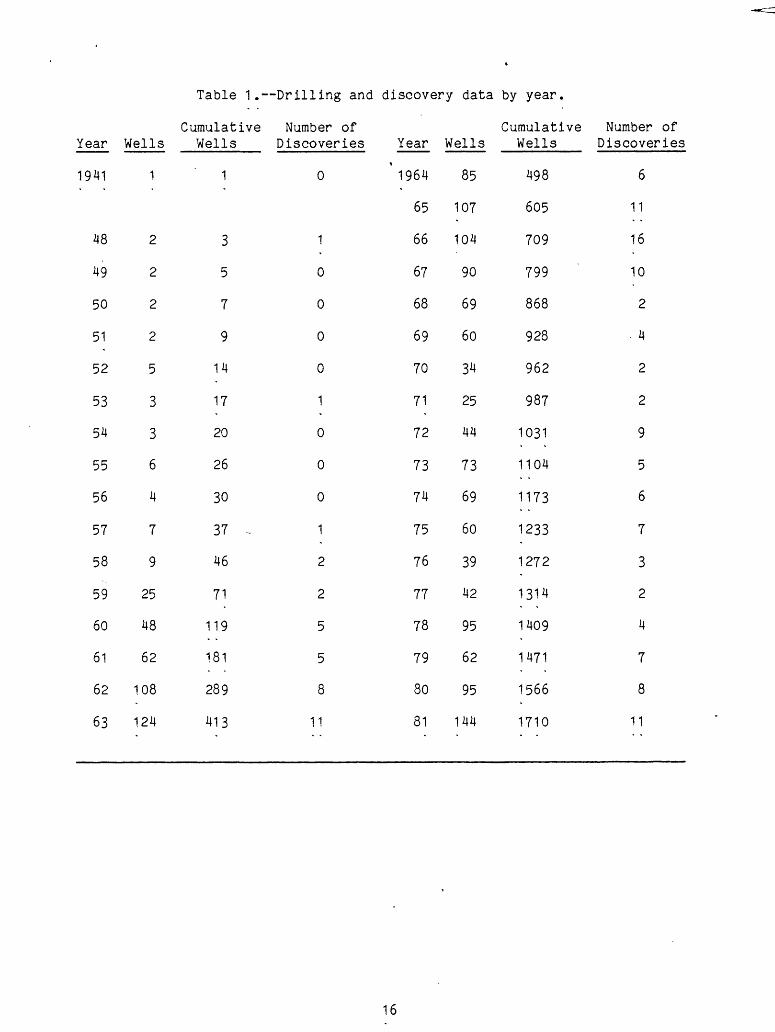
Table 1. Drilling and discovery data by year.
Cumulative Number of Cumulative Number ofYear
1941
48
49
50
51
52
53
54
55
56
57
58
59
60
61
62
63
Wells
1
2
2
2
2
5
3
3
6
4
7
9
25
48
62
108
124
Wells
1
3
5
7
9
14
17
20
26
30
37 -
46
71
119
181
289
413
Discoveries
0
1
0
0
0
0
1
0
0
0
1
2
2
5
5
8
11
Year
' 1964
65
66
67
68
69
70
71
72
73
74
75
76
77
78
79
80
81
Wells
85
107
104
90
69
60
34
25
44
73
69
60
39
42
95
62
95
144
Wells
498
605
709
799
868
928
962
987
1031
1104
1173
1233
1272
1314
1409
1471
1566
1710
Discoveries
6
11
16
10
2
. 4
2
2
9
5
6
7
3
2
4
7
8
11
16
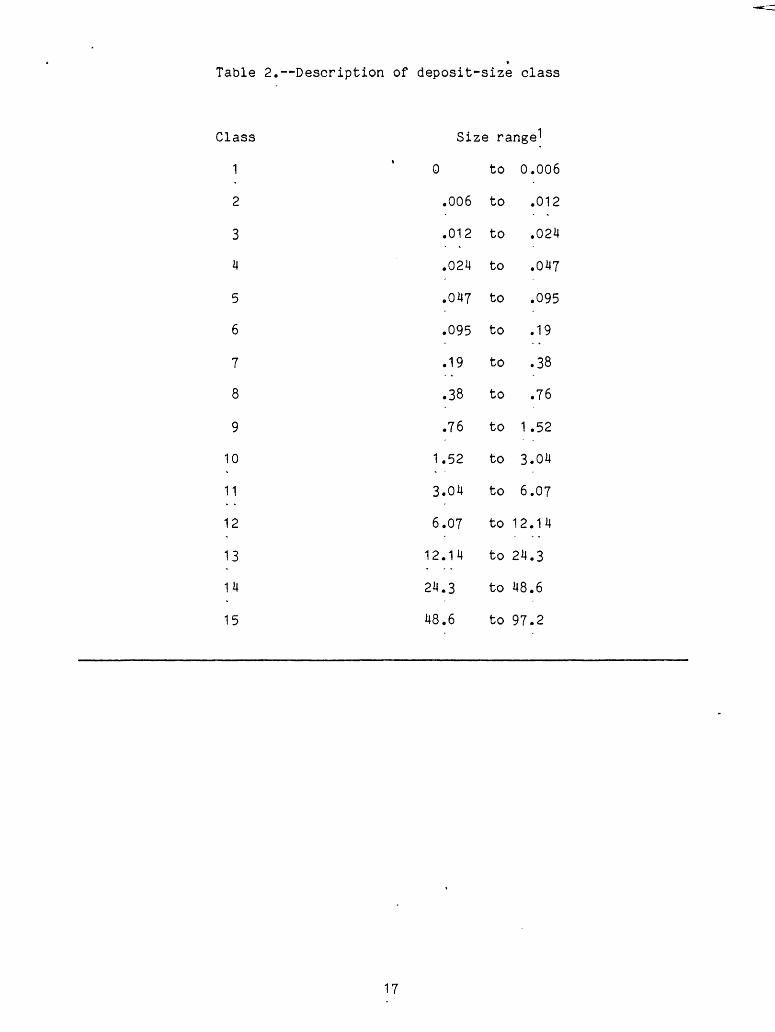
Table 2. Description of deposit-size class
Class Size range"!
1 0 to 0.006
2 .006 to .012
3 .012 to .024
4 .024 to .047
5 .047 to .095
6 .095 to .19
7 .19 to .38
8 .38 to .76
9 .76 to 1.52
10 1.52 to 3.04
11 3.04 to 6.07
12 6.07 to 12.14
13 12.14 to 24.3
14 24.3 to 48.6
15 48.6 to 97.2
17

Table 3. ~~Summary data and estimates of the ultimate number of oil and gas " fields by class size and contained resources for the Minnelusa trend.
Size class
6
7
8
9
10
11
12
13
14
15
Number of fields found by 1,710 wildcat wells
10
16
17
27
14
15
12
6
0
_ 1
151
Expected ultimate number of fields to be found
206.8*
125.3*
76.3*
46.0*
26.5
15
12
6
0
1
514.6
Expected total ultimate resource (BO x 106 )
30.0
32.2
43.8
54.7
59.9
58.5
96.7
94.2
0
51.7
521.7
Expected remaining resource (BO x 106 )
28.5
28.1
34.0
22.6
28.3
0.0
0.0
0.0
0.0
0.0
141.5
Percent of total resource remaining
20.1
19.9
24.0
16.0
20.0
0
0
0
0
_ 0
100.0
^Smoothed estimate F*> using r = 1.65.
DIA
GR
AM
MA
TIC
SE
CT
ION
ILL
US
TR
AT
ING
SE
VE
RA
L T
RA
PP
ING
ME
CH
AN
ISM
S I
N T
HE
MIN
NE
LUS
A F
OR
MA
TIO
N
FIE
LD
EX
AM
PL
ES
NO
T G
EO
GR
AP
HIC
AL
LY
LO
CA
TE
D
TIM
BE
R C
R
DO
NK
EY
CR
REE
L P
RO
NG
CR
HA
LVE
RS
ON
RA
NC
H
BO
NE
PIL
E
ME
LLO
TT R
AN
CH
R
AV
EN
CR
EX
PLA
NA
TIO
N
SA
ND
ST
ON
E.
OO
MIN
AN
TL
Y A
OLI
AN
SA
ND
ST
ON
E.
LAR
GE
LY I
NTE
RO
UN
AL
6 S
HA
LL
OW
MA
RIN
E
CA
RB
ON
ATE
S.
LAR
GE
LY M
AR
INE
, O
OM
INA
NT
LY
DO
LOM
ITE
RE
SE
RV
OIR
OC
CU
PIE
D B
Y O
IL
Fig
ure
1
30 y.
C '
0 u JU
<ii
TT
fl---
»i
.' r
«_
n>
.HL«
juiji
"
iiiM
iini*
iiiiia
iiiiia
niii
i>iii
iia»iit
iiiiii
iiMiii
iiiim
nia
<in
iiiiin
iBiin
i
75
Jr
H
Figure 3.
Cumulative nu
mber
of
oil fi
elds
discovered by December 31,
1981 in
si
ze cl
asse
s 11
th
roug
h 15
in
th
e Mi
nnel
usa
Play.
U II
1TTTT
UM
tjW
*W.t
MI1
|t«
mU
fB«
Nt<
>IM
Mff
i nil m
in i
n i
rji
iiiR
ii i i
iiiiin
iiiiii
nl
niM
iiiiii
iniii
iMiH
iJi
nuiii
Miii
iiiiii
Miin
iUnM
iimin
iiiB
iHiii
iJi niii
itiia
iiiiii
iMiii
iMln
iuiii
iiniii
iHiii
iiiJi
nin
aiiM
ianiM
iiiia
nii
75
J
/""
1
.A
,rr
M
Figu
re 4.
Cumulative nu
mber
of
oil
fiel
ds di
scov
ered
by
December 31
, 19
81 in
size classes
9 and
10 in
th
e Mi
nnel
usa
Play.
n H-
eraC
O-r
cn6DCD
CUMULATIVE BO x 1055-* KJ N3cn o inCD o o
U)a o
U)in CD ______j
cn
-P-H-
CD- CD
H- < 3 O
C3-To ;
c <t> (f>P O
n cr
p H-r~ cn :> CD- ( CD !
m
oCu
cr xoCDo ocr o
l»i CD CD- 03 CD !
o "n
n CD
00s:mr roj cn CD7
CD !
CD"CD i
ocOQsrcnl
§iL