esterline corporation 2004 annual report · esterline provides more than 10,000 solutions to the...
TRANSCRIPT

Esterline C
orporation 2004 Annual R
eport
Esterline provides more than 10,000 solutions to the aero- space industry. Solutions that reach from cockpit controls to the micromotors that actuate missile ailerons to sensors that provide real time in-flight data on hundreds of parameters. And for every problem we solve, customers look to Esterline to find new ways to apply our technologies, to solve new problems and help redefine the possible.
Esterline Corporation is a specialized manufacturing company principally serving aerospace and defense markets. Esterline isheadquartered in Bellevue, Washington, and is listed on the New York Stock Exchangewith the trading symbol ESL.
Esterline Corporation 2004 Annual Report
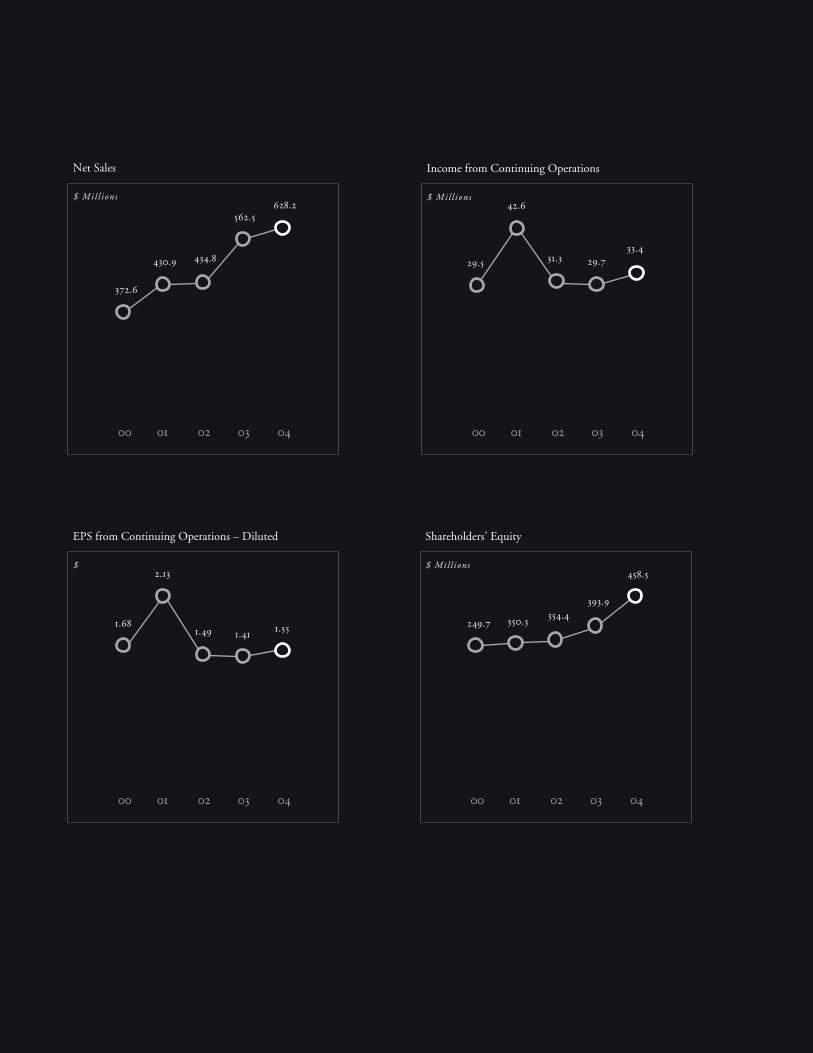
2.13
1.49 1.41 1.551.68
02 03 040100
430.9 434.8
562.5628.2
372.6
02 03 040100
350.3 354.4393.9
458.5
249.7
02 03 040100
Shareholders’ Equity
$ Mil l ions
42.6
31.3 29.733.4
29.5
02 03 040100
Net Sales
$ Mil l ions
Income from Continuing Operations
$ Mil l ions
EPS from Continuing Operations – Diluted
$
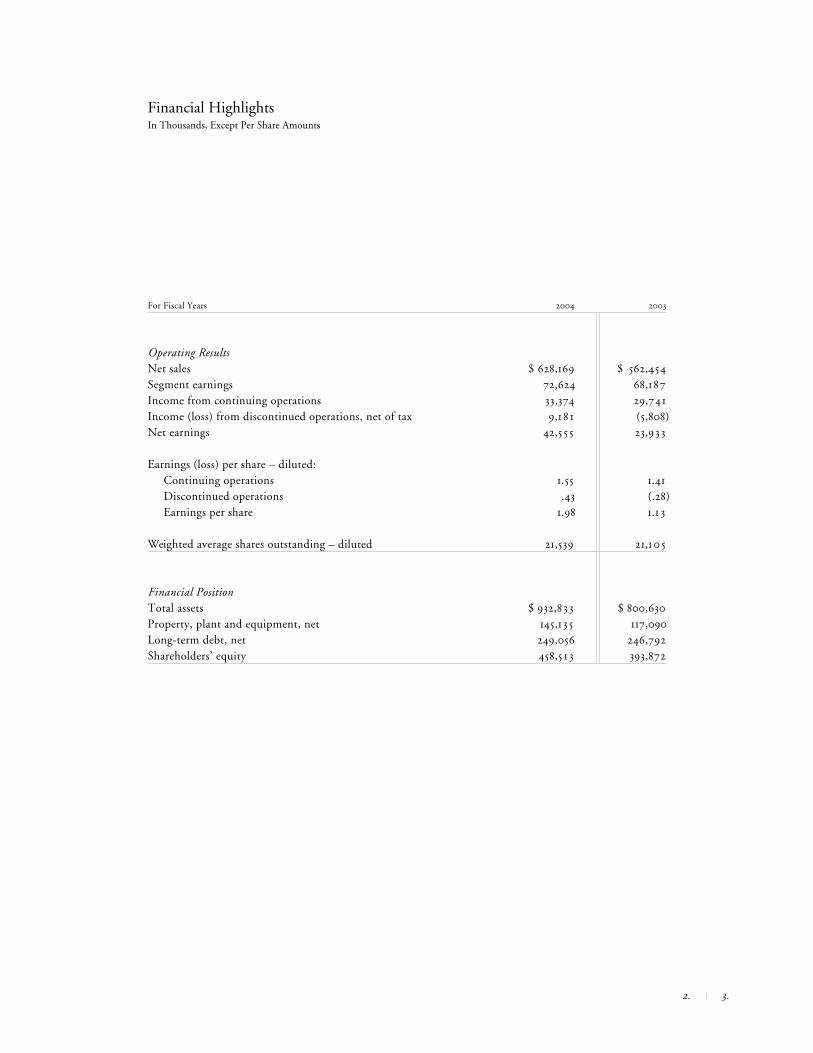
Financial HighlightsIn Thousands, Except Per Share Amounts
For Fiscal Years 2004 2003
Operating ResultsNet sales $ 628,169 $ 562,454Segment earnings 72,624 68,187Income from continuing operations 33,374 29,741Income (loss) from discontinued operations, net of tax 9,1 8 1 (5,808)Net earnings 42,555 23,933
Earnings (loss) per share – diluted: Continuing operations 1.55 1.41 Discontinued operations .43 (.28) Earnings per share 1.98 1.1 3
Weighted average shares outstanding – diluted 21,539 21,10 5
Financial PositionTotal assets $ 932,833 $ 800,630Property, plant and equipment, net 145,135 117,090Long-term debt, net 249,056 246,792Shareholders’ equity 458,5 1 3 393,872
2. | 3.
To our shareholders
The year 2004 will be remembered as the year Esterline entered a new era of sharp focus and exciting possibilities, a company building on core technologies.
The reason for this fundamental shift is simple: in 2004, we successfully sold the last of the operations that we discon-tinued in 2002. This sale frees us to focus resources on the business model we’ve chosen — aerospace and defense — while offering a very visible sign of an Esterline that is easier for investors to understand and more efficient for us to manage.
The impetus for change began in the late 1990s, when we set out to create a world-class aerospace and defense compa-ny that develops and manufactures highly engineered custom components. Step back a few years to the mid-90s and you would have seen an Esterline that was a diverse conglomerate addressing no fewer than ten separate industries. Aerospace and defense each accounted for just 17 percent of our business.
Since then, we have methodically di-vested non-core businesses from the original
Esterline portfolio and transformed our company into a well-balanced aerospace and defense manufacturer that, in fiscal 2004, produced income from continuing operations of $33.4 million, or $1.55 per diluted share, on sales of $628.2 million.
Aerospace and defense markets each now account for about 40 percent of our business, with the other 20 percent coming from related industrial applications of our core technologies.
To say that this strategy has enhanced our operations is an understatement. If you exclude all of the unrelated operations we have divested over the last decade, the compound annual sales growth rate of our underlying core business is better than 15 percent. This focus also has enabled Esterline to attain leading positions in every niche market we serve. And possibly most important, going forward from this point Esterline presents a much clearer face to both customers and investors.
Creating a better toolkit
We think of ourselves as offering our customers a toolkit of solutions, along with the technical expertise to devise new
solutions and tools as our customers’ needs change. To this end, we’re continu-ously enhancing our capabilities through both internal development and strategic acquisitions.
On the acquisition front, the equity offering we concluded in November puts us in a solid position to continue to take advantage of an attractive acquisition landscape. Since 1996, we have success-fully integrated nearly 30 acquisitions, the most recent of which was Leach Holding Corporation in the fourth quarter of 2004. Leach is a leading producer of high-perfor-mance electromechanical relays, solid-state switching devices, and advanced power dis-tribution assemblies primarily for aerospace applications. Leach is a perfect fit with Esterline. It adds more than $120 million to our top line and we expect it to be accretive to earnings in 2005.
It’s very important to understand that each one of the companies we have acquired was selected based on our custom-ers’ needs. We don’t buy just to buy, and we don’t buy to be big; we buy because taking that extra capability to customers will make their job easier and improve their position in their marketplace — and in turn, make us a more valued partner.
Our expanding capabilities have enabled us to apply our toolkit of solutions to a broader array of customer needs. The most exciting example is our first major project for the 7E7, Boeing’s new com-mercial jetliner. Esterline will act as the primary integrator for the new aircraft’s overhead panel control system. On the flight deck, pilots will use our system to monitor and control other important systems throughout the plane. We will manufacture or procure all necessary com-ponents, then assemble them into final control panels. Each system will contain electronics to communicate with a remote data concentrator that will also be supplied by Esterline. The data concentrator con-tains electronics and software that translates signals from components then sends those signals to the appropriate aircraft system. We will deliver this complete subsystem directly to Boeing as a prime contractor or Tier 1 supplier.
Similar to this win, we recently received a contract award to supply the sensor suite for the TP400M turboprop. This new engine will power the Airbus A400M Airlifter, Europe’s new tactical military transport aircraft. Rolls-Royce Deutschland, a member of Europrop
4. | 5.
International, the consortium responsible for the design and manufacture of the new power plant, awarded us the contract. Again, Esterline has the Tier 1 role to design and manufacture the majority of sensors, and manage the supply of the balance of required components through U.S. and European sub-tier partners.
These Tier 1 wins are firsts for Esterline, and are testimony to our growing capability and to the strength of the long-standing relationships we have built with our customers and suppliers over the years.
They also reflect our commitment to bring more value to our customers.
The power of leverage
When our operating units leverage relationships with other units within the company, they marry each others’ technol-ogy in ways that enable them to serve the customer much more effectively than either could alone.
These coordinated efforts benefit our customers even when units aren’t formally teaming up on a project. For example, when an Esterline applications engineer is working with a customer, he or she
has access to all of our operations’ capabili-ties to solve that customer’s needs. That can be components, groups of components, subassemblies, software — whatever it takes. Our engineers have a significant array of technical resources at their disposal. As a result, the solutions we offer our customers can be much more comprehensive.
This benefits Esterline shareholders in three ways. First, it enables us to do more business because the content per shipset escalates. Second, our expanded capability opens doors to new opportunities with each customer. Finally, with the extra volume, we can afford the kind of research and development that keeps us out front.
A world class lean enterprise
Many companies talk about lean manu-facturing — we live and breathe it. For us, lean isn’t just an approach to manufactur-ing. It’s a way of thinking about how we do business for the long term. It’s an approach that can help us dramatically lower costs, improve quality, and build credible com-petitive barriers to entry.
For lean to be successful, management must create an environment that honors
the quality and true value that people bring to the business. We must develop employ-ees who understand our lean philosophy: a strategy to engage people more and more in the business, to encourage their ideas, and put those ideas to work. By investing in training and actively involving our employees, we have developed some very creative ways to eliminate waste, to identify and fix quality problems, and to standard-ize tasks for continuous improvement.
Making our people a responsible part of a manufacturing team and giving them authority to change their own work for the better is critical to our success. That’s why during 2004 I traveled to all of our major locations and emphasized directly to the workforce the importance of creating a lean enterprise. During these visits, I made it clear that lean does not eliminate jobs — it creates capacity and opportunity as exem-plified in the recent wins I mentioned above.
I am convinced that this approach is a huge reason for our early successes. In just one example, we faced large production backups due to a bottleneck at a particu-lar machine. One solution was to spend hundreds of thousands of dollars to add another machine. Instead, we asked the machine operators, who struggled with the
problem every day, to develop a solution. They managed to cut machine setup times from 80 minutes down to only seven minutes. They did this by combining their thorough knowledge of the production line with lean techniques learned in company training sessions. Not only did this solution increase production and obviate the need to buy a new machine, but it also made these individuals more deeply invested in their work and the success of the business as a whole. As a result of successes like this, we can make commitments that no one will lose his or her job due to implementing lean.
And there are many examples like this happening across the company. We are dedicated to being a world class lean enterprise, and our employees will make it happen.
Moving ahead
Esterline’s fiscal 2004 represented another solid year. We made major capability strides. Our performance reflected good balance across all of our markets and oper-ating segments. The commercial aerospace industry is now clearly coming off the
6. | 7.
bottom of its cycle, and defense markets continue to look solid for us into the foreseeable future.
Looking forward, I’m optimistic about the coming year. Industry trends continue to work in our favor. Sales of spare parts to our airline customers are growing steadily, and new plane build rates have ramped up. The defense side of our business also remains solid, reflecting the thousands of components we provide for hundreds of critical defense platforms. As markets improve and we continue to successfully leverage our strategic and technological advantages, we’re in a strong position to consistently reduce operating expenses,
and increase margins. And, I’m encouraged by the acquisition landscape we see. With all things considered, I believe we will outperform others in our space.
There are now some 6,000 Esterline employees worldwide who are dedicated to making this company successful. People who every day find ways to put together capabilities, companies, lean concepts, and bright new ideas to solve our customers’ problems. Along the way, they are redefin-ing the possible and creating an enterprise that offers more value to our customers and to our shareholders.
We are building a company with a sin-gle-minded focus of being the best it can be.
Robert W. CreminChairman, President and Chief Executive Officer

Redefining the possible.

Esterline’s people redefine the possible, every day.

Whether it’s our custom micromotors that “twitch” missile fi ns or complete cockpit panel assemblies, all of our solutions have one thing in common: the highest caliber people in the industry. People with the spirit, dedication, and intelligence to see things the way they could be, not the way they are.
On the surface, we may deliver sensors or switches or seals to our customers, but our busi-ness ultimately is about people. With more than 6,000 of us around the globe — including more than 700 applications engineers — we’ve created a formidable network of solutions specialists to serve our customers. For example, when an engineer is working on a cockpit control panel, he or she has access other Esterline engineers who specialize in related power distribution
or sensor technology. This shared knowledge ensures a better outcome for our customer, and helps us grow.
The great respect we have for our people is the foundation of our business strategy and an important reason our lean manufacturing initiatives have enjoyed early success. We don’t infl ict a system on our people; we create an environment in which creative problem solv-ing thrives, then we turn ownership of a given process over to the people who know it best.
Along the way, one thing we’ve discovered is that if you expect the best from people, that’s exactly what you get.
Personnel pictured are from our Kirkhill-TA operations in
Southern California.
We expect the best from our people; that’s exactly what you get.
Esterline’s people redefi ne the possible, every day.

We add companies to be better, not bigger.

If two heads are better than one, imagine entire groups of great minds thinking as one. That’s the idea behind our acquisition strategy: As-sembling related companies with top notch engineering capability to be the very best in specialized targeted niche markets. Our strategy provides customers with superior solutions and enables us to win business that would otherwise have been out of reach.
A good case in point is our recent win to supply the entire sensor suite for a new military engine. This engine, built by an international consortium, will power the new Airbus A400M military transport aircraft. As a Tier 1 supplier, we will not only design and manufacture the majority
of sensors, but also manage the supply of all other sensor components. This win is a direct result of the increased capability from our successful integration of the individual companies that now make up our Sensors & Systems segment.
Esterline provides solutions for every kind of aircraft from Apache to Airbus. From entire suites of sensors designed to fi ne-tune fuel management systems, to specialized pressure sensors that can precisely establish an aircraft’s altitude.
And what really sets Esterline apart is our abil-ity to continually rise to the growing challenges of rapidly changing customer requirements.
This is what we mean by “better, not bigger.”
Each individual company we acquire connects with Esterline as a whole—
leading to solutions that could not be developed separately.
We add companies to be better, not bigger.

Our innovations reach into the cockpit in hundreds of ways—then they multiply.
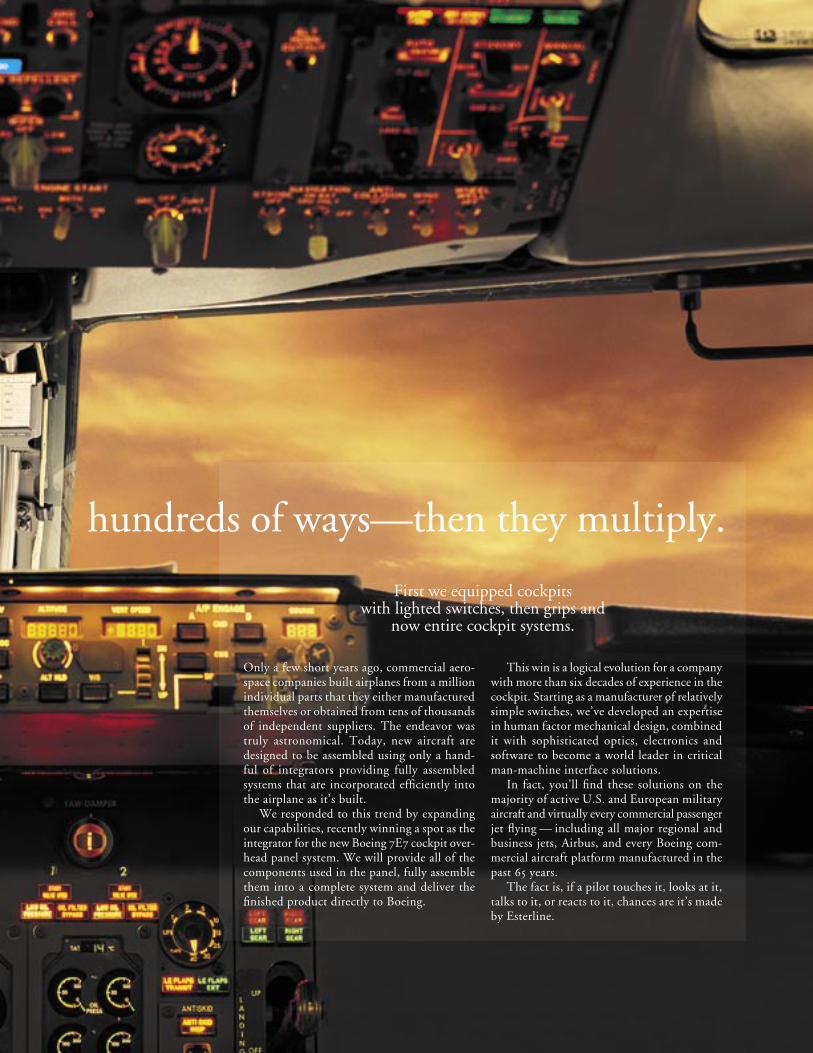
Only a few short years ago, commercial aero-space companies built airplanes from a million individual parts that they either manufactured themselves or obtained from tens of thousands of independent suppliers. The endeavor was truly astronomical. Today, new aircraft are designed to be assembled using only a hand-ful of integrators providing fully assembled systems that are incorporated effi ciently into the airplane as it’s built.
We responded to this trend by expanding our capabilities, recently winning a spot as the integrator for the new Boeing 7E7 cockpit over-head panel system. We will provide all of the components used in the panel, fully assemble them into a complete system and deliver the fi nished product directly to Boeing.
This win is a logical evolution for a company with more than six decades of experience in the cockpit. Starting as a manufacturer of relatively simple switches, we’ve developed an expertise in human factor mechanical design, combined it with sophisticated optics, electronics and software to become a world leader in critical man-machine interface solutions.
In fact, you’ll fi nd these solutions on the majority of active U.S. and European military aircraft and virtually every commercial passenger jet fl ying — including all major regional and business jets, Airbus, and every Boeing com-mercial aircraft platform manufactured in the past 65 years.
The fact is, if a pilot touches it, looks at it, talks to it, or reacts to it, chances are it’s made by Esterline.
First we equipped cockpits with lighted switches, then grips and
now entire cockpit systems.
Our innovations reach into the cockpit in hundreds of ways—then they multiply.
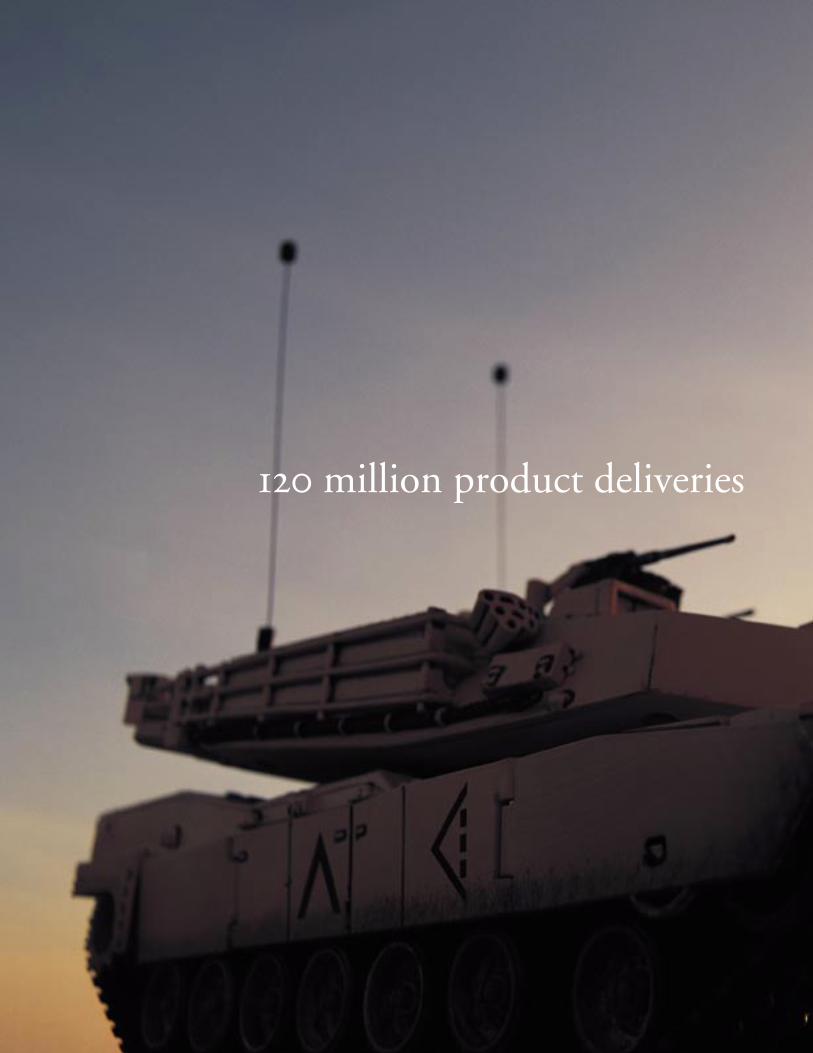
120 million product deliveries and counting.

Esterline’s ability to apply innovative solutions to unique requirements for the toughest conditions has made us the acknowledged world leader in energetic material research, development, and manufacture.
Our combustible ordnance products — more than 70 million delivered to date — have earned a sole source position on every tank, mortar, and artillery round produced for the Department of Defense. And our radar countermeasure chaff enjoys a similar status, with over 40 million delivered to date and employed throughout the U.S. military aircraft inventory.
Plus we are the largest U.S. producer of countermeasure fl ares — devices used to protect aircraft from heat-seeking missiles — with over 10 million produced to date. We provide the
majority of the U.S. military’s requirements for these products, and during the course of the year we expanded our countermeasure fl are business with a greater emphasis on customers in allied countries. Also, we were recently awarded the fi rst military contract in the U.S. to produce the newest generation fl are. Instead of simply falling away from the aircraft when deployed, these new fl ares fl y predetermined trajectories away from the aircraft to provide far greater decoy effectiveness against the most modern heat-seeking “smart” missiles.
While these business gains are gratifying, they are not nearly as rewarding as knowing that we are actively contributing to the preparedness of the United States and allied armed forces around the world.
When the U.S. and its allies need effective tools to defend freedom, they look to Esterline for proven solutions
and absolute reliability.
120 million product deliveries and counting.

The higher and faster they fly, the more they need us.
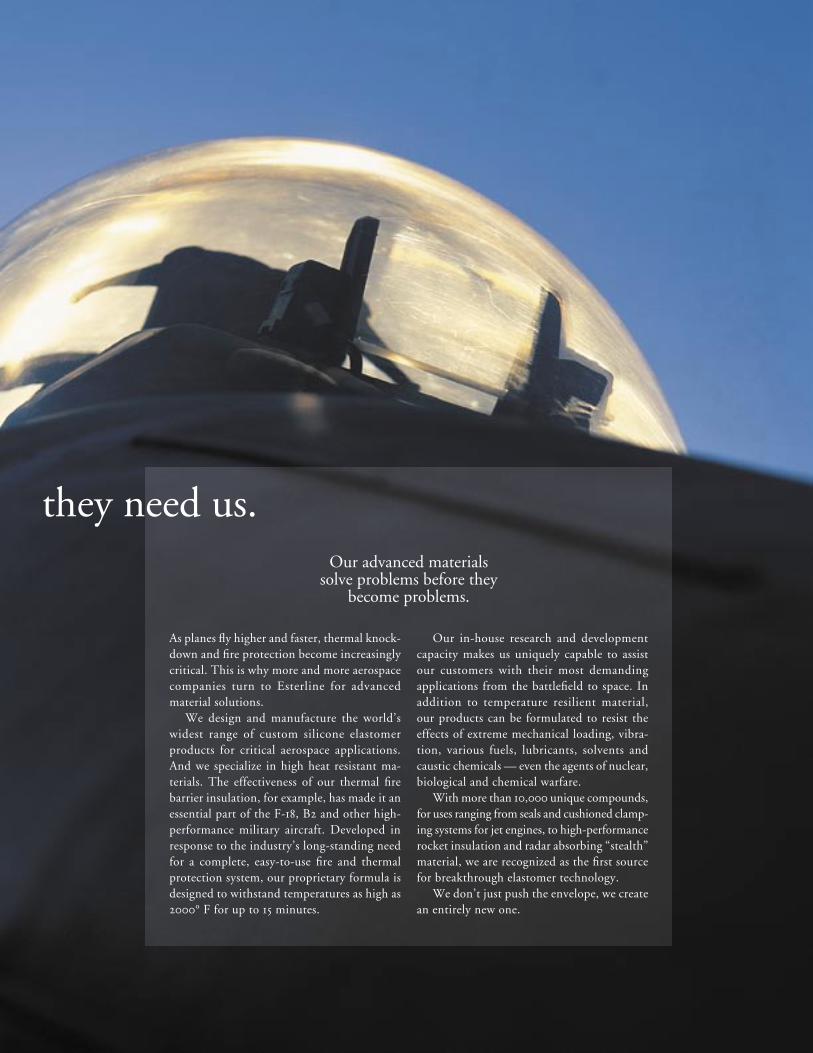
The higher and faster they fl y, the more they need us.
As planes fl y higher and faster, thermal knock-down and fi re protection become increasingly critical. This is why more and more aerospace companies turn to Esterline for advanced material solutions.
We design and manufacture the world’s widest range of custom silicone elastomer products for critical aerospace applications. And we specialize in high heat resistant ma-terials. The effectiveness of our thermal fi re barrier insulation, for example, has made it an essential part of the F-18, B2 and other high-performance military aircraft. Developed in response to the industry’s long-standing need for a complete, easy-to-use fi re and thermal protection system, our proprietary formula is designed to withstand temperatures as high as 2000° F for up to 15 minutes.
Our in-house research and development capacity makes us uniquely capable to assist our customers with their most demanding applications from the battlefi eld to space. In addition to temperature resilient material, our products can be formulated to resist the effects of extreme mechanical loading, vibra-tion, various fuels, lubricants, solvents and caustic chemicals — even the agents of nuclear, biological and chemical warfare.
With more than 10,000 unique compounds, for uses ranging from seals and cushioned clamp-ing systems for jet engines, to high-performance rocket insulation and radar absorbing “stealth” material, we are recognized as the fi rst source for breakthrough elastomer technology.
We don’t just push the envelope, we create an entirely new one.
Our advanced materials solve problems before they
become problems.

Management’s Discussion and Analysis p. 22Selected Financial Data p. 36Consolidated Statements p. 38Notes to Consolidated Statements p. 45Directors and Officers p. 84Investor Information p. 85Operations p. 86
Contents

Management’s Discussion and Analysis p. 22Selected Financial Data p. 36Consolidated Statements p. 38Notes to Consolidated Statements p. 45Directors and Officers p. 84Investor Information p. 85Operations p. 86
Contents

2004 Financial Review
Esterline
Overview
We view and operate our businesses in three segments: Avionics & Controls, Sensors & Systems and Advanced Materials. The Avionics & Controls segment designs and manufactures technology interface systems for military and commercial aircraft and land- and sea-based military vehicles, secure communications systems, specialized medical equipment, and other industrial applications. The Sensors & Systems segment produces high-precision temperature and pressure sensors, fluid control components, micro-motors, motion control sensors, and other related systems, principally for aerospace and defense customers. The Advanced Materials segment develops and manufactures high-performance elastomer products used in a wide range of com-mercial aerospace and military applications and combustible ordnance components and electronic warfare countermeasure devices for military customers. Sales in all segments include domestic, international, defense and commercial customers.
Our current business and strategic plan focuses on the continued development of our products in three key technology segments: avionics and controls, sensors and systems and specialized high-performance elastomers and other complex materials, principally for aerospace and defense markets. We are concentrating our efforts to expand our capabilities in these markets and to anticipate the global needs of our customers and respond to such needs with comprehensive solutions. These efforts focus on continuous research and new product devel-opment, acquisitions and establishing strategic realignments of operations to expand our capabilities as a more comprehensive supplier to our customers across our entire product offering. In fiscal 2004, we completed two important acquisitions. We acquired all of the outstanding capital stock of Leach Holding Corporation (Leach), a $119 million (sales) manufacturer of electrical power switching, control and data communication devices for the aerospace industry, for approximately $145.0 million in cash before acquisition costs and an adjustment for the change in working capital from December 31, 2003 to closing. In addition, we acquired all of the outstanding capital stock of AVISTA, Incorporated (AVISTA), a $10 million (sales) Wisconsin-based developer of embedded avionics software, for approximately $6.5 million.
We sell our commercial aerospace products as original equipment to aircraft manufacturers and sell replace-ment parts and spares to aftermarket repair and service providers. The attacks of September 11, 2001 and the ongoing concerns of global terrorism have impacted the profitability of the commercial aerospace industry and continue to impact our near-term outlook for original equipment manufacturer (OEM) sales and aftermarket business from aircraft operators. We believe, however, that improved security and safety measures over time will restore passenger confidence. Recently, certain airline operating measures, such as available seat miles, revenue passenger miles and active fleet have shown improvement. We believe our commercial and regional aircraft business will benefit from increased passenger traffic in the future. In addition, we believe the long-term demand for business jets will support a recovery in this market.
On July 25, 2002, our Board of Directors adopted a formal plan for the sale of the assets and operations of our Automation segment. As a result, the consolidated financial statements present the Automation segment as a discontinued operation. In fiscal 2002, we recorded an after-tax loss from discontinued operations of $25.0 million. An additional charge of $5.8 million, net of a $3.5 million tax benefit, was recorded in fiscal 2003 for losses in our discontinued operations. This additional charge was precipitated by prolonged weakness in electron-ics, telecommunications and heavy equipment markets, which led to higher operating losses and longer than expected holding periods for the discontinued operations. On July 23, 2003, we sold the assets of our Excellon Automation subsidiary. On August 31, 2004, we sold the stock of W. A. Whitney Co. for $10.0 million in cash. Upon the final disposition of our discontinued operations, we recorded an $8.0 million gain, net of $4.5 million in tax, including the reversal of estimated reserves, which were recognizable upon the sale of the business.
Management’s Discussion and Analysis of Financial Condition and Results of Continuing Operations
Results of Continuing Operations
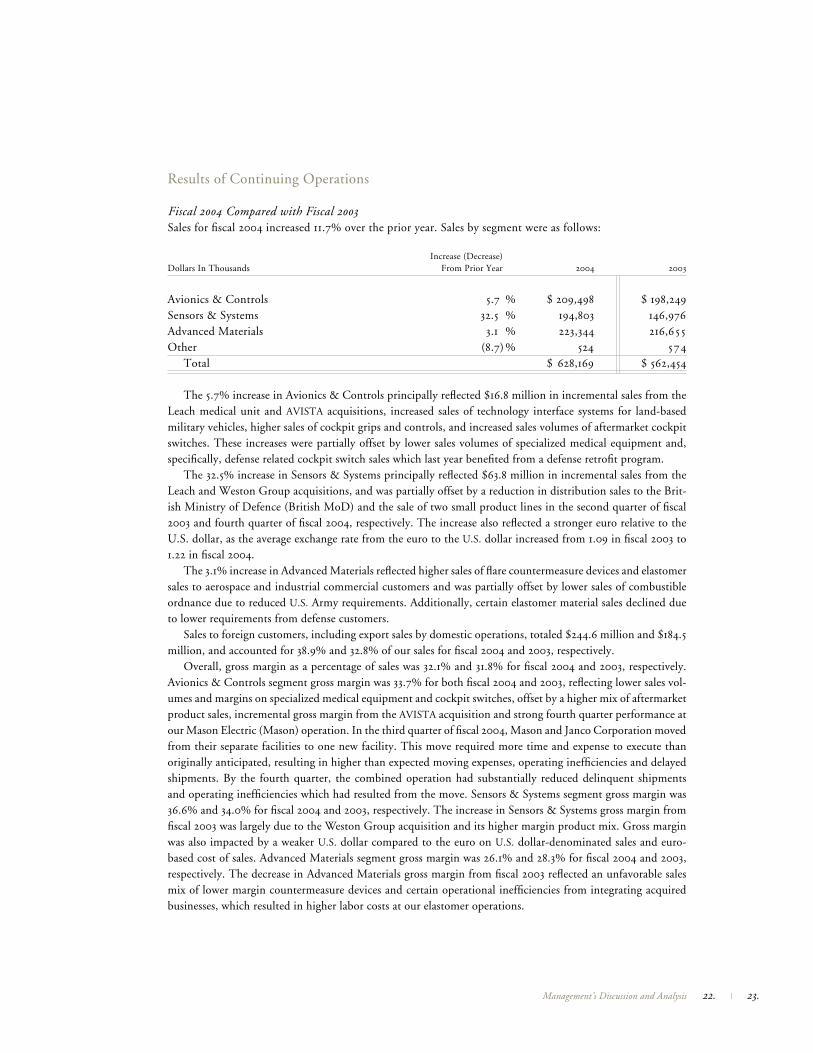
Fiscal 2004 Compared with Fiscal 2003Sales for fiscal 2004 increased 11.7% over the prior year. Sales by segment were as follows:
Increase (Decrease)Dollars In Thousands From Prior Year 2004 2003
Avionics & Controls 5.7 % $ 209,498 $ 198,249Sensors & Systems 32.5) % 194,803 146,976Advanced Materials 3.1) % 223,344 216,655Other (8.7) % ,524 ,574 Total $ 628,169 $ 562,454
The 5.7% increase in Avionics & Controls principally reflected $16.8 million in incremental sales from the Leach medical unit and AVISTA acquisitions, increased sales of technology interface systems for land-based military vehicles, higher sales of cockpit grips and controls, and increased sales volumes of aftermarket cockpit switches. These increases were partially offset by lower sales volumes of specialized medical equipment and, specifically, defense related cockpit switch sales which last year benefited from a defense retrofit program.
The 32.5% increase in Sensors & Systems principally reflected $63.8 million in incremental sales from the Leach and Weston Group acquisitions, and was partially offset by a reduction in distribution sales to the Brit-ish Ministry of Defence (British MoD) and the sale of two small product lines in the second quarter of fiscal 2003 and fourth quarter of fiscal 2004, respectively. The increase also reflected a stronger euro relative to the U.S. dollar, as the average exchange rate from the euro to the U.S. dollar increased from 1.09 in fiscal 2003 to 1.22 in fiscal 2004.
The 3.1% increase in Advanced Materials reflected higher sales of flare countermeasure devices and elastomer sales to aerospace and industrial commercial customers and was partially offset by lower sales of combustible ordnance due to reduced U.S. Army requirements. Additionally, certain elastomer material sales declined due to lower requirements from defense customers.
Sales to foreign customers, including export sales by domestic operations, totaled $244.6 million and $184.5 million, and accounted for 38.9% and 32.8% of our sales for fiscal 2004 and 2003, respectively.
Overall, gross margin as a percentage of sales was 32.1% and 31.8% for fiscal 2004 and 2003, respectively. Avionics & Controls segment gross margin was 33.7% for both fiscal 2004 and 2003, reflecting lower sales vol-umes and margins on specialized medical equipment and cockpit switches, offset by a higher mix of aftermarket product sales, incremental gross margin from the AVISTA acquisition and strong fourth quarter performance at our Mason Electric (Mason) operation. In the third quarter of fiscal 2004, Mason and Janco Corporation moved from their separate facilities to one new facility. This move required more time and expense to execute than originally anticipated, resulting in higher than expected moving expenses, operating inefficiencies and delayed shipments. By the fourth quarter, the combined operation had substantially reduced delinquent shipments and operating inefficiencies which had resulted from the move. Sensors & Systems segment gross margin was 36.6% and 34.0% for fiscal 2004 and 2003, respectively. The increase in Sensors & Systems gross margin from fiscal 2003 was largely due to the Weston Group acquisition and its higher margin product mix. Gross margin was also impacted by a weaker U.S. dollar compared to the euro on U.S. dollar-denominated sales and euro-based cost of sales. Advanced Materials segment gross margin was 26.1% and 28.3% for fiscal 2004 and 2003, respectively. The decrease in Advanced Materials gross margin from fiscal 2003 reflected an unfavorable sales mix of lower margin countermeasure devices and certain operational inefficiencies from integrating acquired businesses, which resulted in higher labor costs at our elastomer operations.
22. | 23.Management’s Discussion and Analysis
Esterline
Selling, general and administrative expenses (which include corporate expenses) increased to $117.7 million in fiscal 2004 compared with $107.8 million in the prior year. The increase in selling, general and administrative expenses primarily reflected incremental selling, general and administrative expenses from the Leach, Weston Group and AVISTA acquisitions partially offset by expense reductions at Sensors & Systems and our Advanced Materials elastomer operations. As a percentage of sales, selling, general and administrative expenses were 18.7% and 19.2% in fiscal 2004 and 2003, respectively.
Research, development and related engineering spending increased to $27.7 million, or 4.4% of sales, in fiscal 2004 compared with $19.5 million, or 3.5% of sales, in the prior year. This is consistent with our philosophy of continually investing in new products and capabilities regardless of the business cycle. Additionally, the increase in research, development and related engineering expense reflects the requirement to fund development for new programs for our OEM customers.
Segment earnings (which exclude corporate expenses) increased 6.5% during fiscal 2004 to $72.6 million compared to $68.2 million in the prior year. Avionics & Controls segment earnings increased 11% during fiscal 2004 to $33.1 million. This increase in Avionics & Controls reflected incremental earnings from the AVISTA acquisition, higher sales of controls and grips, and technology interface systems for land-based military vehicles. Avionics & Controls earnings were impacted by the shipment of acquired inventories of the Leach medical unit, which were valued at fair market value at acquisition in accordance with generally accepted accounting principles. Sensors & Systems segment earnings increased 5.3% to $10.6 million. This increase in Sensors & Systems was primarily due to incremental earnings from the Weston Group acquisition and the impact of the shipment in fiscal 2003 of acquired inventories of the Weston Group, which were valued at fair market value at acquisition. Sensors & Systems earnings also reflected $4.5 million in severance and early retirement expense, including legal expenses covering 55 employees in engineering, production, quality, research and development and administration functions. Sensors & Systems earnings reflected a decline in temperature and pressure sensors sales and sales to the British MoD for which we act as a distributor, as well as higher selling and engineering development expenses for motion control products. Furthermore, Sensors & Systems earnings were impacted by the shipment of acquired inventories of the Leach acquisition, which were valued at fair market value at acquisition, as well as the effect of a weaker U.S. dollar relative to the euro on U.S. dollar-denominated sales and euro-based operating expenses. Advanced Materials segment earnings increased 1.3% to $29.5 million. This 1.3% increase in Advanced Materials reflected mixed results. Combustible ordnance and countermeasure opera-tions were impacted by lower sales volumes of higher margin combustible ordnance and increased maintenance expenses at our flare countermeasure operation. Additionally, our elastomer material operations were impacted by acquisition integration expenses, production inefficiencies and higher workers’ compensation expenses, while earnings from our specialized metal finishing unit were favorably impacted by the elimination of redundant facilities, improved cost control and increased sales prices.
During the fourth quarter of fiscal 2004, we sold a product line in our Sensors & Systems segment and recorded a gain of $3.4 million. During the third quarter of fiscal 2003, we recorded a foreign currency gain of approximately $2.7 million upon the settlement of foreign currency forward contracts related to the completion of the Weston acquisition. These gains are reflected in Other Expense, Net.
Interest income increased to $2.0 million during fiscal 2004 compared with $0.9 million in the prior year, reflecting interest earned on a U.S. income tax refund. Interest expense increased to $17.3 million during fiscal 2004 compared with $12.0 million in the prior year, due to the full year effect of the issuance of $175.0 mil-lion in 7.75% Senior Subordinated Notes due June 15, 2013. In September 2003, we entered into an interest rate swap agreement on $75.0 million of our Senior Subordinated Notes due in 2013. The swap agreement exchanged the fixed interest rate for a variable interest rate on $75.0 million of the $175.0 million principal amount outstanding.
The effective income tax rate for continuing operations for fiscal 2004 was 25.3% compared with 30.5% in fiscal 2003. On February 4, 2004, we received a Notice of Proposed Adjustment (NOPA) from the Internal Revenue Service covering the audit of research and development tax credits for fiscal years 1997 through 1999.
As a result of the NOPA and the expectation of a similar result for fiscal years 2000 through 2003, we revised our estimated liability for income taxes during the first quarter of fiscal 2004. The revision resulted in a $1.9 million reduction of previously estimated tax liabilities. The effective tax rate differed from the statutory rate in fiscal 2004 and 2003, as both years benefited from various tax credits. The current year’s results benefited from the 18-month extension by the U.S. Congress of the Research and Experimentation Credit from June 30, 2004 to December 31, 2005. We expect this extension to benefit us in fiscal 2005 as well. In addition, the U.S. Congress passed a bill that phases out certain export incentives beginning in fiscal 2005, which will slightly increase our effective tax rate. We expect this increase to be more than offset beginning in fiscal 2006 by the phase-in of tax incentives for domestic manufacturing. While one of the provisions of this tax bill allows for the repatriation of undistributed earnings of foreign subsidiaries at potentially favorable rates, our accumulated earnings of foreign subsidiaries are considered indefinitely reinvested.
Income from continuing operations was $33.4 million, or $1.55 per share on a diluted basis, compared with $29.7 million, or $1.41 per share, in the prior year. Net earnings were $42.6 million, or $1.98 per share on a diluted basis in fiscal 2004, compared with net earnings of $23.9 million, or $1.13 per share, in the prior year. Net earnings in fiscal 2004 included net income of $9.2 million, or $.43 per share, from discontinued opera-tions. Net earnings in fiscal 2003 included a loss of $5.8 million, or ($.28) per diluted share, from discontinued operations.
New orders for fiscal 2004 were $760.4 million compared with $581.6 million for fiscal 2003. Avionics & Controls orders for fiscal 2004 increased 34.8% from the prior year period and reflected the acquisition of the Leach medical unit and AVISTA and a $7.3 million cockpit panel retrofit order. Sensors & Systems orders for fiscal 2004 increased 83.9% from the prior year period and reflected the acquisitions of Leach and Weston. Ad-vanced Materials orders for fiscal 2004 decreased 6.2% from the prior year period and reflected lower program requirements for combustible ordnance. Backlog at the end of fiscal 2004 was $433.1 million compared with $300.9 million at the end of the prior year. The increase in backlog principally reflects the Leach acquisition. Approximately $70.6 million is scheduled to be delivered after fiscal 2005. Backlog is subject to cancellation until delivery.
Fiscal 2003 Compared with Fiscal 2002
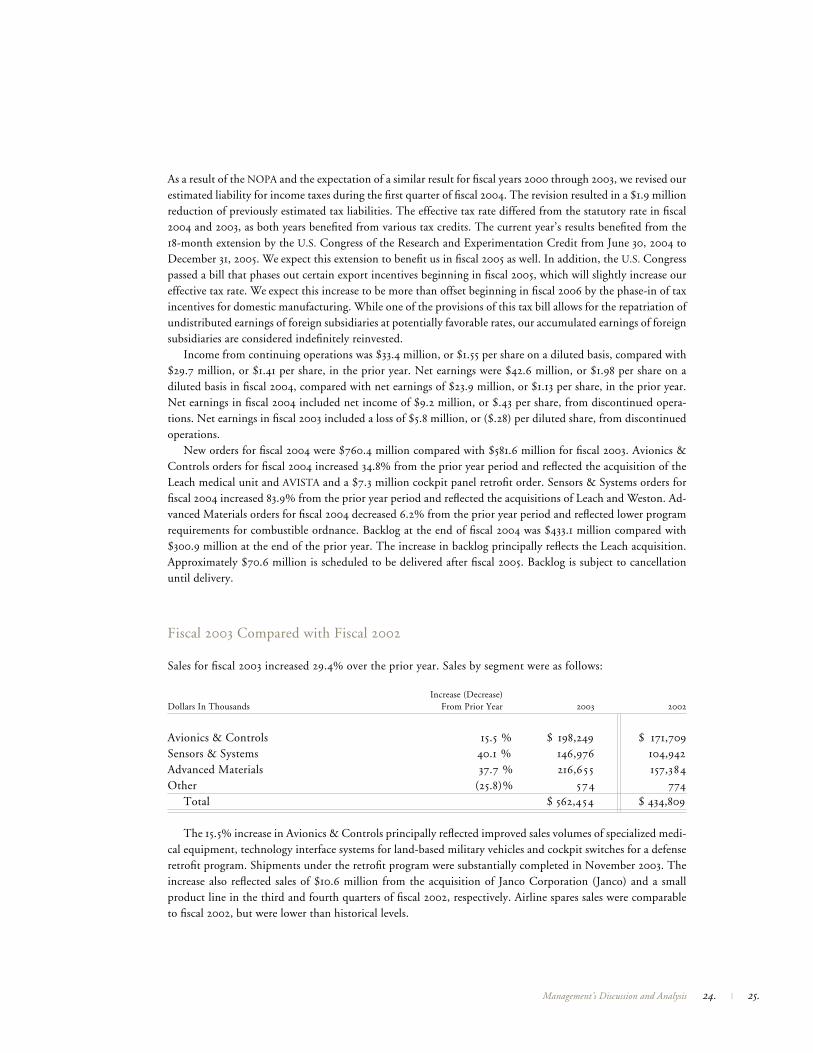
Sales for fiscal 2003 increased 29.4% over the prior year. Sales by segment were as follows:
Increase (Decrease)Dollars In Thousands From Prior Year 2003 2002
Avionics & Controls 15.5)% $ 198,249 $ 171,709Sensors & Systems 40.1)% 146,976 104,942Advanced Materials 37.7)% 216,655 157,384Other (25.8) % ,574 ,774 Total $ 562,454 $ 434,809
The 15.5% increase in Avionics & Controls principally reflected improved sales volumes of specialized medi-cal equipment, technology interface systems for land-based military vehicles and cockpit switches for a defense retrofit program. Shipments under the retrofit program were substantially completed in November 2003. The increase also reflected sales of $10.6 million from the acquisition of Janco Corporation (Janco) and a small product line in the third and fourth quarters of fiscal 2002, respectively. Airline spares sales were comparable to fiscal 2002, but were lower than historical levels.
24. | 25.Management’s Discussion and Analysis
Esterline
The 40.1% increase in Sensors & Systems principally reflected $25.5 million in incremental sales from the Weston Group and BVR Aero Precision Corporation (BVR) acquisitions in the third and first quarters of fiscal 2003, respectively. The increase also reflected a stronger euro relative to the U.S. dollar, as the average exchange rate from the euro to the U.S. dollar increased from 0.92 in fiscal 2002 to 1.09 in fiscal 2003. Sales were also bolstered by increased sales volumes of a product line for which we act as a distributor to the British MoD. These shipments to the British MoD were completed in May 2003. The increase in Sensors & Systems sales was partially offset by lower aftermarket spares sales.
The 37.7% increase in Advanced Materials reflected incremental sales totaling $55.6 million from the acquisi-tion of Burke Industries’ Engineered Polymers Group (Polymers Group) in the third quarter of fiscal 2002 and the Electronic Warfare Passive Expendables Division of BAE SYSTEMS North America (Countermeasures) in the fourth quarter of fiscal 2002. Sales were also enhanced by increased sales of combustible ordnance components. These sales increases were partially offset by lower sales of elastomer material to commercial aerospace and industrial/commercial customers, principally reflecting the downturn in both markets as well as the suspension of NASA’s shuttle flights.
Sales to foreign customers, including export sales by domestic operations, totaled $184.5 million and $140.1 million, and accounted for 32.8% and 32.2% of our sales for fiscal 2003 and 2002, respectively.
Overall, gross margin as a percentage of sales was 31.8% and 32.6% for fiscal 2003 and 2002, respectively. Avionics & Controls segment gross margin was 33.7% and 32.7% for fiscal 2003 and 2002, respectively. The increase in Avionics & Controls gross margin from fiscal 2002 was due to solid sales to military OEMs, higher sales of input devices to medical and defense customers and improved cost control. Sensors & Systems segment gross margin was 34.0% and 38.7% for fiscal 2003 and 2002, respectively. The decrease in Sensors & Systems gross margin from fiscal 2002 was largely due to the effect of a weaker U.S. dollar compared to the euro on U.S. dollar-denominated sales and euro-based cost of sales and the increased sales of a product line for which we acted as a distributor and realized lower margins. In addition, Sensors & Systems gross margin was impacted by the shipment of acquired inventories of the Weston Group, which were valued at fair market value at acquisi-tion in accordance with generally accepted accounting principles. Advanced Materials segment gross margin was 28.3% and 27.8% for fiscal 2003 and 2002, respectively. The increase in Advanced Materials gross margin reflected higher sales volumes as well as improved product mix, and was partially offset by decreased recovery of fixed costs at our specialized metal finishing unit.
Selling, general and administrative expenses (which include corporate expenses) increased to $107.8 mil-lion in fiscal 2003 compared with $79.1 million in the prior year. As a percentage of sales, selling, general and administrative expenses were 19.2% and 18.2% in fiscal 2003 and 2002, respectively. The increase in selling, general and administrative expenses primarily reflected increased amortization of intangible assets, incremental expenses from acquisitions completed in fiscal 2002 and 2003, the effect of a stronger euro relative to the U.S. dollar on selling, general and administrative expenses of our Sensors & Systems business, and increased pension and medical expenses.
Research, development and related engineering spending increased to $19.5 million, or 3.5% of sales, in fiscal 2003 compared with $15.4 million, or 3.5% of sales, in the prior year. This is consistent with our philosophy of continually investing in new products and capabilities regardless of the business cycle.
Segment earnings (which exclude corporate expenses) increased 15.0% during fiscal 2003 to $68.2 million compared to $59.3 million in the prior year. Avionics & Controls segment earnings increased 12.4% during fiscal 2003 to $29.8 million. This increase reflected earnings from increased sales of specialized medical equipment, technology interface systems for land-based military vehicles, and cockpit switches to military OEMs, and was partially offset by higher selling, general and administrative expenses. Sensors & Systems segment earnings decreased 18.3% during fiscal 2003 to $10.1 million. This decrease in Sensors & Systems was primarily due to the effect of a weaker U.S. dollar relative to the euro on U.S. dollar-denominated sales and euro-based operating expenses, integration expenses and the impact of the shipment of acquired inventories of the Weston Group, which were valued at fair market value at acquisition in accordance with generally accepted accounting prin-ciples. Advanced Materials segment earnings increased 33.1% during fiscal 2003 to $29.1 million. This increase
was principally from acquisitions and was partially offset by a three-week shutdown of a countermeasure facility in the second quarter of fiscal 2003. In addition, Advanced Materials earnings were impacted by lower sales of elastomer products to aerospace and industrial commercial customers, integration expenses and operating losses at our specialized metal finishing unit.
On June 11, 2003, we acquired a group of companies referred to as the Weston Group for U.K. £55.0 mil-lion in cash (approximately $94.6 million based on the closing exchange rate and including acquisition costs). We hedged the U.K. £55.0 million cash price using foreign currency forward contracts and recorded a foreign currency gain of approximately $2.7 million at closing of the acquisition and settlement of foreign currency forward contracts.
Interest income decreased to $0.9 million during fiscal 2003 compared with $1.8 million in the prior year, reflecting the use of cash and cash equivalents for acquisitions and a decline in prevailing interest rates. Inter-est expense increased to $12.0 million during fiscal 2003 compared with $7.1 million in the prior year, due to the issuance of $175.0 million in 7.75% Senior Subordinated Notes due June 15, 2013. In September 2003, we entered into an interest rate swap agreement on $75.0 million of our Senior Subordinated Notes due in 2013. The swap agreement exchanged the fixed interest rate for a variable interest rate on $75.0 million of the $175.0 million principal amount outstanding.
The effective income tax rate for continuing operations for fiscal 2003 was 30.5% compared with 25.1% in fiscal 2002. The effective tax rate differed from the statutory rate in fiscal 2003 and 2002, as both years benefited from various tax credits. In addition, in fiscal 2002, we recognized a $2.9 million reduction in income taxes associated with the favorable resolution of ongoing income tax audits. Additionally, the relative effect of export tax benefits and research and development tax credits was higher in fiscal 2002 due to the reduction in income from continuing operations before income taxes.
Income from continuing operations was $29.7 million, or $1.41 per share on a diluted basis, compared with $31.3 million, or $1.49 per share, in the prior year. Net earnings were $23.9 million, or $1.13 per share on a diluted basis in fiscal 2003, compared with a net loss of $1.3 million, or ($.06) per share, in the prior year. Net earnings in fiscal 2003 included a loss of $5.8 million, or ($.28) per diluted share, from discontinued operations. The net loss in fiscal 2002 included a loss from discontinued operations of $25.0 million, or ($1.19) per diluted share and a $7.6 million charge, or ($.36) per diluted share, for the cumulative effect of an accounting change as a result of the adoption of Financial Accounting Standards Board No. 142, “Goodwill and Other Intangible Assets” (Statement No. 142).
Orders received in fiscal 2003 increased 17.5% to $581.6 million from $495.0 million in the prior year. Backlog at the end of fiscal 2003 was $300.9 million compared with $281.7 million at the end of the prior year. Backlog increased sequentially from the fourth quarter of fiscal 2002 to the third quarter of fiscal 2003, principally re-flecting the increase in combustible ordnance orders and the acquisition of the Weston Group on June 11, 2003. The acquisition of the Weston Group represented approximately $15.4 million of the increase in backlog from fiscal 2002. Avionics & Controls backlog declined sequentially from the end of the fourth quarter of fiscal 2002 to October 31, 2003, reflecting lower orders for cockpit switches, panels and displays.
Liquidity and Capital Resources
Working Capital and Statement of Cash FlowsCash and cash equivalents at the end of fiscal 2004 totaled $29.5 million, a decrease of $114.7 million from the prior year, including a $12.8 million decrease in short-term investments. Net working capital decreased to $170.5 million at the end of fiscal 2004 from $222.4 million at the end of the prior year. Sources of cash flows from operating activities principally consist of cash received from the sale of products offset by cash payments for material, labor and operating expenses. Cash flows from operating activities were $62.3 million and $64.9 million in fiscal 2004 and 2003, respectively. The decrease principally reflected lower cash receipts
26. | 27.Management’s Discussion and Analysis
Esterline
from accounts receivable collections and increased payments for inventories, partially offset by higher net earnings, depreciation and amortization, a U.S. income tax refund, and the timing of making income tax payments. The increase in cash flows used by investing activities primarily reflected the acquisition of Leach in the fourth fiscal quarter of 2004, partially offset by the proceeds from the sale of W. A. Whitney and a product line in the Sensors & Systems segment. The decrease in cash provided by financing activities prin-cipally reflected the issuance of $175.0 million of Senior Subordinated Notes in the prior year’s third fiscal quarter and the repayment of $30.0 million of the 1999 Senior Notes in fiscal 2004.
Capital ExpendituresNet property, plant and equipment was $145.1 million at the end of fiscal 2004 compared with $117.1 million at the end of the prior year. Capital expenditures for fiscal 2004 were $22.1 million (excluding acquisitions) and included machinery and equipment and enhancements to information technology systems. Capital expenditures are anticipated to approximate $22.0 million for fiscal 2005. We will continue to support expansion through investments in infrastructure including machinery, equipment, buildings and information systems.
Debt FinancingTotal debt decreased $22.5 million from the prior year to $257.1 million at the end of fiscal 2004. Total debt outstanding at the end of fiscal 2004 consisted of $175.0 million under our Senior Subordinated Notes, $70.0 million under our 1999 Senior Notes and $12.1 million under our credit facility and various foreign currency debt agreements, including capital lease obligations. The Senior Subordinated Notes are due June 15, 2013 at an interest rate of 7.75%. In September 2003 we entered into an interest rate swap agreement on $75.0 million of our Senior Subordinated Notes due in 2013. The swap agreement exchanged the fixed interest rate for a variable interest rate on $75.0 million of the $175.0 million principal amount outstanding. The 1999 Senior Notes have maturities ranging from 5 to 10 years and interest rates from 6.00% to 6.77%; $30.0 mil-lion of the Senior Notes matured and was paid in November 2003. We believe cash on hand, funds generated from operations and other available debt facilities are sufficient to fund operating cash requirements and capital expenditures through fiscal 2005. In addition, we believe we have adequate access to capital markets to fund future acquisitions.
Pension ObligationsOur pension plans, which principally include a U.S. pension plan maintained by Esterline and U.S. and non-U.S. plans maintained by Leach, are under-funded $24.0 million at October 29, 2004. This under-funding resulted from the acquisition of Leach and assumption of its under-funded pension plans. We account for pension expense using the end of the fiscal year as our measurement date and we make actuarially computed contributions to our pension plans as necessary to adequately fund benefits. Our funding policy is consistent with the minimum funding requirements of ERISA. In fiscal 2004, operating cash flow included $0.5 million of cash funding to these pension plans. We expect pension funding requirements to be approximately $2.4 million to $2.8 million in fiscal 2005, which will be made to the Leach pension plans; the U.S. Esterline pen-sion plan is not expected to require any contributions in 2005. The rate of increase in future compensation levels is consistent with our historical experience and salary administration policies. The expected long-term rate of return on plan assets is based on long-term target asset allocations of 70% equity and 30% fixed in-come. We periodically review allocations of plan assets by investment type and evaluate external sources of information regarding long-term historical returns and expected future returns for each investment type and, accordingly, believe an 8.5% assumed long-term rate of return on plan assets is appropriate. Current alloca-tions are consistent with the long-term targets.
We made the following assumptions with respect to our pension obligation in 2004 and 2003:
2004 2003
Principal assumptions as of fiscal year end:Discount rate 6.0% 6.5%Rate of increase in future compensation levels 4.5% 4.5%Assumed long-term rate of return on plan assets 8.5% 8.5%
We use a discount rate for expected returns that is based on a point-in-time estimate as of each fiscal year end measurement date. Although future changes to the discount rate are unknown, had the discount rate increased or decreased by 25 basis points, pension liabilities in total would have decreased $4.3 million or increased $4.5 million, respectively. We are not aware of any legislative or other initiatives or circumstances that will signifi-cantly impact our pension obligations in fiscal 2005.
Research and Development ExpenseFor the three years ended October 29, 2004, research and development expense has averaged 3.8% of sales. In fiscal 2004, we began bidding and winning new aerospace programs which will result in increased company-funded research and development. We estimate that research and development expense will range between 4.5% to 5% of sales in fiscal 2005.
AcquisitionsOn August 27, 2004, we acquired all of the outstanding capital stock of Leach Holding Corporation (Leach), a $119 million (sales) manufacturer of electrical power switching, control, and data communication devices for the aerospace industry, for approximately $145.0 million in cash before acquisition costs and an adjust-ment for the change in working capital from December 31, 2003 to closing, pursuant to an Agreement and Plan of Merger dated as of July 8, 2004. Leach also manufactures medical diagnostic, therapeutic and patient monitoring devices, and analytical, optical and biosensor instruments for medical, laboratory and industrial applications. The acquisition expands our capabilities in providing solutions to our customers’ complex engi-neering requirements. The aerospace business is included in the Sensors & Systems segment and the medical business is included in the Avionics & Controls segment. We used existing cash and our credit facilities to finance the acquisition.
On December 1, 2003, we acquired all of the outstanding capital stock of AVISTA, a $10 million (sales) Wis-consin-based developer of embedded avionics software, for approximately $6.5 million. A contingent purchase price is payable to the seller in December 2004 and 2005 based upon the achievement of financial results as defined in the Stock Purchase Agreement. The December 2004 purchase price adjustment is approximately $3.3 million, which will be recorded in the first quarter of fiscal 2005 as additional consideration for the acquired assets. AVISTA provides a software engineering center to support our customers with such applications as primary flight displays, flight management systems, air data computers and engine control systems. AVISTA is included in our Avionics & Controls segment.
On June 11, 2003, we acquired the Weston Group from The Roxboro Group PLC for U.K. £55.0 million in cash (approximately $94.6 million based on the closing exchange rate and including acquisition costs). The acquisition was financed with a portion of the proceeds from the issuance of $175.0 million in 7.75% Senior Subordinated Notes due June 15, 2013. In addition, the existing $50 million revolving line of credit was replaced with a $60 million revolving line of credit. In November 2003, $30.0 million of long-term Senior Notes, Series A, was paid according to terms from available cash and cash equivalents.
28. | 29.Management’s Discussion and Analysis
Esterline
Equity OfferingOn August 3, 2004, we filed a shelf registration statement on Form S-3 registering $300.0 million of equity and debt securities, which was declared effective on August 25, 2004. The shelf registration statement enables us to issue equity and debt securities in response to market conditions. On November 24, 2004 we completed a public offering of 3.7 million shares of common stock, including shares sold under the underwriters’ over-allotment option, priced at $31.25 per share, generating net proceeds of approximately $109 million, of which $5.0 million was used to pay off existing credit facilities. The funds provide additional financial resources for acquisitions and general corporate purposes.
Contractual ObligationsThe following table summarizes our outstanding contractual obligations as of fiscal year end.
Less than 1-3 4-5 After 5In Thousands Total 1 year years years years
Long-term debt $ 250,087 $ 2,800 $ 31,265 $ 40,875 $ 175,1 47Credit facilities 6,977 6,977 — — —Operating lease obligations 53,995 8,945 16,063 11,581 17,406Purchase obligations Not recorded on balance sheet 70,1 87 63,1 1 8 6,360 ,709 — Pension(1) 2,400 2,400 — — — Recorded on balance sheet 134,905 134,905 — — —Total contractual obligations $ 518,5 5 1 $ 219,145 $ 53,688 $ 53,165 $ 192,5 5 3
(1) Our pension plan funding policy is consistent with the minimum funding requirements of ERISA. This table reflects the amount of our expected pension funding under our U.S. plans in fiscal 2005.
Seasonality
The timing of our revenues is impacted by the purchasing patterns of our customers and, as a result, we do not generate revenues evenly throughout the year. Moreover, our first fiscal quarter, November through Janu-ary, includes significant holiday vacation periods in both Europe and North America. This leads to decreased order and shipment activity; consequently, first quarter results are typically weaker than other quarters and not necessarily indicative of our performance in subsequent quarters.
Disclosures About Market Risk
Interest Rate RisksOur debt obligations are principally at a fixed rate and, accordingly, we are not subject to interest rate risk on these obligations. However, we are subject to interest rate risk on $75.0 million of our Senior Subordi-nated Notes due in 2013. We hold an interest rate swap agreement, which exchanged the fixed interest rate for a variable rate on $75.0 million of the $175.0 million principal amount outstanding under our Senior Subordinated Notes due in 2013. The following table provides information about our derivative financial instruments and other financial instruments that are sensitive to changes in interest rates. For long-term debt, the table presents principal cash flows and the related weighted-average interest rates by contractual maturities. For our interest rate swap, the table presents notional amounts and, as applicable, the interest rate by contractual maturity date.
30. | 31.Management’s Discussion and Analysis
Dollars In Thousands Long-term Debt – Fixed Rate Interest Rate Swap Principal Average Notional Average AverageMaturing in: Amount Rates Amount Pay Rate(1) Receive Rate
2005 $ 1,0 3 1 7.4 % $ — * 7.75%2006 30,763 6.4 % — * 7.75%2007 502 7.0 % — * 7.75%2008 438 7.0 % — * 7.75%2009 40,437 6.8 % — * 7.75%Thereafter 175,147 7.75% 75,000 * 7.75%Total $ 248,3 1 8 $ 75,000 Fair Value at 10/29/2004 $ 271,069 $ 1,769
(1) The average pay rate is LIBOR plus 2.56%.
Currency RisksTo the extent that sales are transacted in a foreign currency, we are subject to foreign currency fluctuation risk. Furthermore, we have assets denominated in foreign currencies that are not offset by liabilities in such foreign currencies. Although we own significant operations in France, Germany and the United Kingdom, historically we have not experienced material gains or losses due to interest rate or foreign exchange fluctua-tions. In fiscal 2004, the foreign exchange rate for the euro increased 10.5% relative to the U.S. dollar.
The following tables provide information about our derivative financial instruments, including foreign cur-rency forward exchange agreements and certain firmly committed sales transactions denominated in currencies other than the functional currency. The information about certain firmly committed sales contracts and derivative financial instruments is in U.S. dollar equivalents. For forward foreign currency exchange agreements, the table presents the notional amounts at the current exchange rate and weighted-average contractual foreign currency exchange rates by contractual maturity dates. The table does not include firmly committed transactions that have not been hedged.
Firmly Committed Sales Contracts/Operations with Foreign Functional CurrencyPrincipal Amount by Expected MaturityAverage Foreign Currency Exchange Rate (USD/Foreign Currency)
In Thousands Euro U.K. Pound Firmly Committed Firmly Committed Sales Contracts Sales ContractsFiscal Years United States Dollar United States Dollar
2005 $ 18,199 $ 10,8 162006 5,205 10 12007 5,452 1492008 3 —2009 2 —Total $ 28,861 $ 11,066
Esterline
Derivative Contracts/Operations with Foreign Functional Currency Notional Amount by Expected Maturity Average Foreign Currency Exchange Rate (USD/Foreign Currency) (1) Dollars In Thousands
Related Forward Contracts to Sell U.S. Dollar for Euro
United States DollarFiscal Years Notional Amount Avg. Contract Rate
2005 $ 13,340 1.2042006 1,700 1.218Total $ 15,040
Fair Value at 10/29/2004 $ 855
Related Forward Contracts to Sell U.S. Dollar for U.K. Pound
United States DollarFiscal Years Notional Amount Avg. Contract Rate
2005 $ 10,575 1.7822006 900 1.754Total $ 11,475
Fair Value at 10/29/2004 $ 241
(1) The Company has no derivative contracts after fiscal 2006.
Critical Accounting Policies
Our financial statements and accompanying notes are prepared in accordance with accounting principles generally accepted in the United States. Preparing financial statements requires management to make estimates and assumptions that affect the reported amounts of assets, liabilities, revenue and expenses. Actual results may differ from estimates under different assumptions or conditions. These estimates and assumptions are affected by our application of accounting policies. Our critical accounting policies include revenue recogni-tion, accounting for the allowance for doubtful accounts receivable, accounting for inventories at the lower of cost or market, accounting for goodwill and intangible assets in business combinations, impairment of goodwill and intangible assets, accounting for legal contingencies, and accounting for income taxes.
Revenue RecognitionWe recognize revenue when the title and risk of loss have passed to the customer, there is persuasive evidence of an agreement, delivery has occurred or services have been rendered, the price is determinable, and the collectibility is reasonably assured. We recognize product revenues at the point of shipment or delivery in accordance with the terms of sale. Sales are net of returns and allowances. Returns and allowances are not significant because products are manufactured to customer specification and are covered by the terms of the product warranty.
Dollars In Thousands
Related Forward Contracts to Sell U.S. Dollar for Euro
Allowance for Doubtful AccountsWe establish an allowance for doubtful accounts for losses expected to be incurred on accounts receivable balances. Judgment is required in estimation of the allowance and is based upon specific identification, col-lection history and creditworthiness of the debtor.
InventoriesWe account for inventories on a first-in, first-out or average cost method of accounting at the lower of its cost or market as required under Accounting Research Bulletin No. 43 (ARB No. 43). The application of ARB No. 43 requires judgment in estimating the valuation of inventories. Such valuations require judgment in estimating future demand, selling prices and cost of disposal.
Goodwill and Intangible Assets in Business CombinationsWe account for business combinations, goodwill and intangible assets in accordance with Financial Accounting Standards No. 141, “Business Combinations” (Statement No. 141) and Financial Accounting Standards No. 142, “Goodwill and Other Intangible Assets” (Statement No. 142). Statement No. 141 specifies the types of acquired intangible assets that are required to be recognized and reported separately from goodwill.
Impairment of Goodwill and Intangible AssetsStatement No. 142 requires goodwill and certain intangible assets to be no longer amortized, but instead be tested for impairment at least annually. We are also required to test goodwill for impairment between annual tests if events occur or circumstances change that would more likely than not reduce our enterprise fair value below its book value. These events or circumstances could include a significant change in the business climate, including a significant sustained decline in an entity’s market value, legal factors, operating performance indicators, competition, sale or disposition of a significant portion of the business, or other factors.
The valuation of reporting units requires judgment in estimating future cash flows, discount rates and esti-mated product life cycles. In making these judgments, we evaluate the financial health of the business, including such factors as industry performance, changes in technology and operating cash flows.
Statement No. 142 outlines a two-step process for testing goodwill for impairment. The first step (Step One) of the goodwill impairment test involves estimating the fair value of a reporting unit. Statement No. 142 defines fair value (Fair Value) as “the amount at which an asset (or liability) could be bought (or incurred) or sold (or settled) in a current transaction between willing parties, that is, other than in a forced liquidation sale.” A reporting unit is generally defined at the operating segment level or at the component level one level below the operating segment, if said component constitutes a business. The Fair Value of a reporting unit is then compared to its carrying value, which is defined as the book basis of total assets less total liabilities. In the event a report-ing unit’s carrying value exceeds its estimated Fair Value, evidence of potential impairments exists. In such a case, the second step (Step Two) of the impairment test is required, which involves allocating the Fair Value of the reporting unit to all of the assets and liabilities of that unit, with the excess of Fair Value over allocated net assets representing the Fair Value of goodwill. An impairment loss is measured as the amount by which the carrying value of the reporting unit’s goodwill exceeds the estimated Fair Value of goodwill.
As we have grown through acquisitions, we have accumulated $247.8 million of goodwill and $22.5 million of indefinite-lived intangible assets out of total assets of $932.8 million at October 29, 2004. As a result, the amount of any annual or interim impairment could be significant and could have a material adverse effect on our reporting financial results for the period in which the charge is taken.
We performed our impairment review for fiscal 2004 as of August 1, 2004, and our Step One analysis indicates that no impairment of goodwill exists in any of the Company’s reporting units. All but one of the reporting units passes the Step One by what we believe to be a significant margin. The remaining reporting unit, which has goodwill totaling $63.2 million, passes Step One by a less significant margin. Our Step One test was based upon a market and discounted cash flow valuation method. If events or circumstances change and if goodwill in this reporting unit is determined to be impaired, an amount of up to $63.2 million could be written off to expense.
32. | 33.Management’s Discussion and Analysis
Esterline
Impairment of Long-lived AssetsWe account for the impairment of long-lived assets to be held and used in accordance with Financial Ac-counting Standards No. 144, “Accounting for the Impairment or Disposal of Long-Lived Assets” (Statement No. 144). Statement No. 144 requires that a long-lived asset to be disposed of be reported at the lower of its carrying amount or fair value less cost to sell. For business segments disposed of prior to the implementation of Statement No. 144 in fiscal 2003, namely the Automation segment, we accounted for discontinued opera-tions in accordance with Accounting Principles Board Opinion No. 30, “Reporting the Results of Operations –Reporting the Effects of Disposal of a Segment of a Business and Extraordinary, Unusual and Infrequently Occurring Events and Transactions” (APB No. 30). APB No. 30 requires that if a loss is expected, it should be recorded at the measurement date when management commits to a plan to dispose of a segment of a business. The loss from discontinuance is based upon estimates of net realizable value and estimated losses from the measurement date to the expected disposal date. Judgment is required to estimate the selling price, selling expenses and future losses of the segment.
ContingenciesWe are party to various lawsuits and claims, both as plaintiff and defendant, and have contingent liabilities arising from the conduct of business. We are covered by insurance for general liability, product liability, workers compensation and certain environmental exposures, subject to certain deductible limits. We are self-insured for amounts less than our deductible and where no insurance is available. Financial Accounting Standards No. 5, “Accounting for Contingencies,” requires that an estimated loss from a contingency should be accrued by a charge to income if it is probable that an asset has been impaired or a liability has been incurred and the amount of the loss can be reasonably estimated. Disclosure of a contingency is required if there is at least a reasonable possibility that a loss has been incurred. We evaluate, among other factors, the degree of probability of an unfavorable outcome and the ability to make a reasonable estimate of the amount of loss.
Income TaxesWe account for income taxes in accordance with Financial Accounting Standards No. 109, “Accounting for Income Taxes.” The objectives of accounting for income taxes are to recognize the amount of taxes payable or refundable for the current year and deferred tax liabilities and assets for the future tax consequences of events that have been recognized in our financial statements or tax returns. Judgment is required in assessing the future tax consequences of events that have been recognized in our financial statements or tax returns. Variations in the actual outcome of these future tax consequences could materially impact our financial position and results of operations.
Recent Accounting Pronouncements
In December 2004, the Financial Accounting Standards Board issued Statement of Financial Accounting Standards No. 123R, “Share-Based Payment,” which is effective for public companies for interim or annual periods beginning after June 15, 2005. This statement will have a significant impact on our consolidated statements of operations, as we will be required to expense the fair value of our stock option grants and stock purchases under our employee stock purchase plan rather than disclose the impact on our consolidated net income within our footnotes as is our current practice. We intend to comply with the standard upon its effectiveness; however, we do not believe that the impact would be materially different from our pro forma disclosures as described in Note 1 to the Consolidated Financial Statements of Esterline Technologies Cor-poration appearing on page 45.
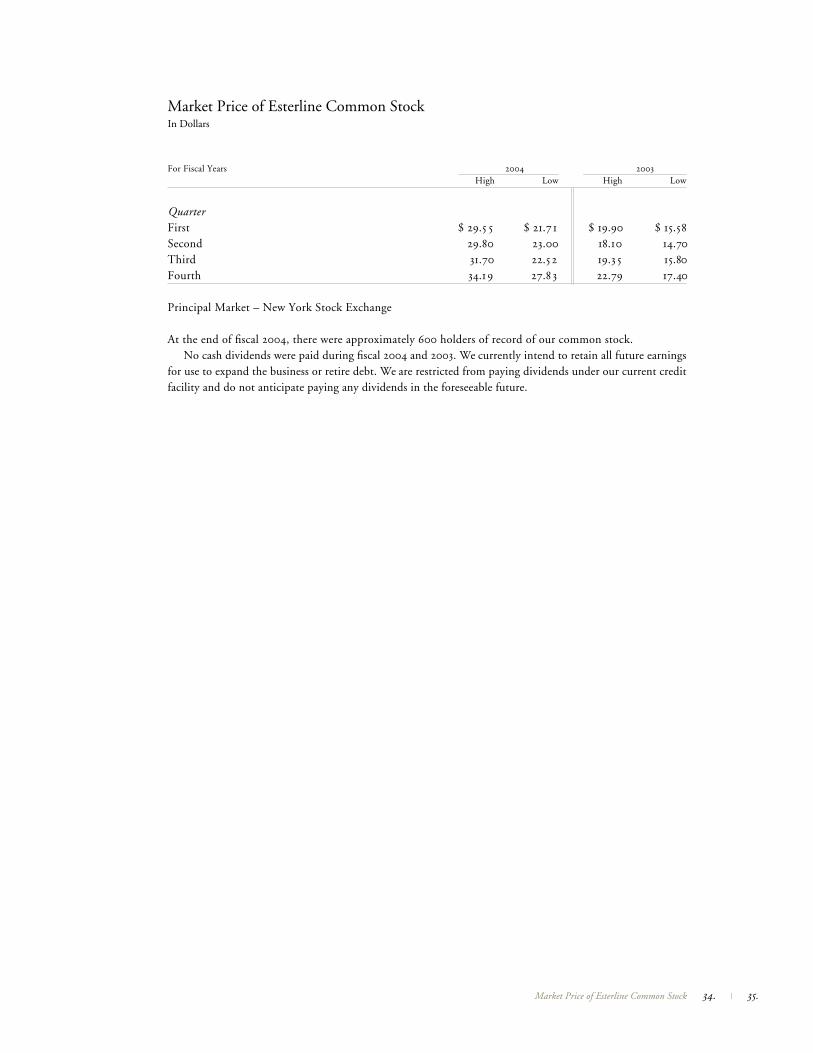
For Fiscal Years 2004 2003 High Low High Low
QuarterFirst $ 29.5 5 $ 21.7 1 $ 19.90 $ 15.58Second 29.80 23.00 18.10 14.70Third 31.70 22.5 2 19.3 5 15.80Fourth 34.1 9 27.8 3 22.79 17.40
Principal Market – New York Stock Exchange
At the end of fiscal 2004, there were approximately 600 holders of record of our common stock.No cash dividends were paid during fiscal 2004 and 2003. We currently intend to retain all future earnings
for use to expand the business or retire debt. We are restricted from paying dividends under our current credit facility and do not anticipate paying any dividends in the foreseeable future.
Market Price of Esterline Common StockIn Dollars
34. | 35.Market Price of Esterline Common Stock
Esterline
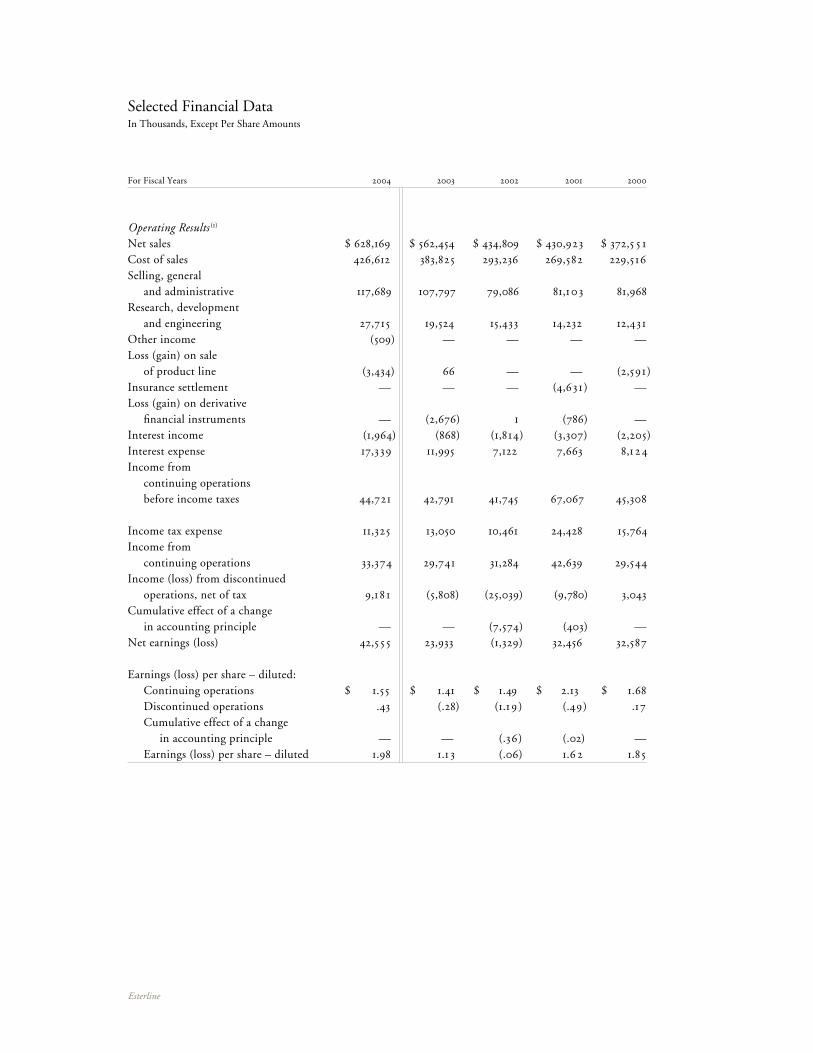
For Fiscal Years 2004 2003 2002 2001 2000
Operating Results (1)
Net sales $ 628,169 $ 562,454 $ 434,809 $ 430,923 $ 372,5 5 1Cost of sales 426,612 383,825 293,236 269,582 229,516Selling, general and administrative 117,689 107,797 79,086 81,10 3 81,968Research, development and engineering 27,715 19,524 15,433 14,232 12,431Other income (509) — — — —Loss (gain) on sale of product line (3,434) 66 — — (2,591)Insurance settlement — — — (4,631) —Loss (gain) on derivative financial instruments — (2,676) 1 (786) —Interest income (1,964) (868) (1,814) (3,307) (2,205)Interest expense 17,339 11,995 7,122 7,663 8,1 24Income from continuing operations before income taxes 44,721 42,791 41,745 67,067 45,308
Income tax expense 11,325 13,050 10,461 24,428 15,764Income from continuing operations 33,374 29,741 31,284 42,639 29,544Income (loss) from discontinued operations, net of tax 9,1 8 1 (5,808) (25,039) (9,780) 3,043Cumulative effect of a change in accounting principle — — (7,574) (403) —Net earnings (loss) 42,5 5 5 23,933 (1,329) 32,456 32,587
Earnings (loss) per share – diluted: Continuing operations $ 1.55 $ 1.41 $ 1.49 $ 2.13 $ 1.68 Discontinued operations .43 (.28) (1.1 9 ) (.49) .17 Cumulative effect of a change in accounting principle — — (.36) (.02) — Earnings (loss) per share – diluted 1.98 1.1 3 (.06) 1.6 2 1.85
Selected Financial DataIn Thousands, Except Per Share Amounts
For Fiscal Years 2004 2003 2002 2001 2000
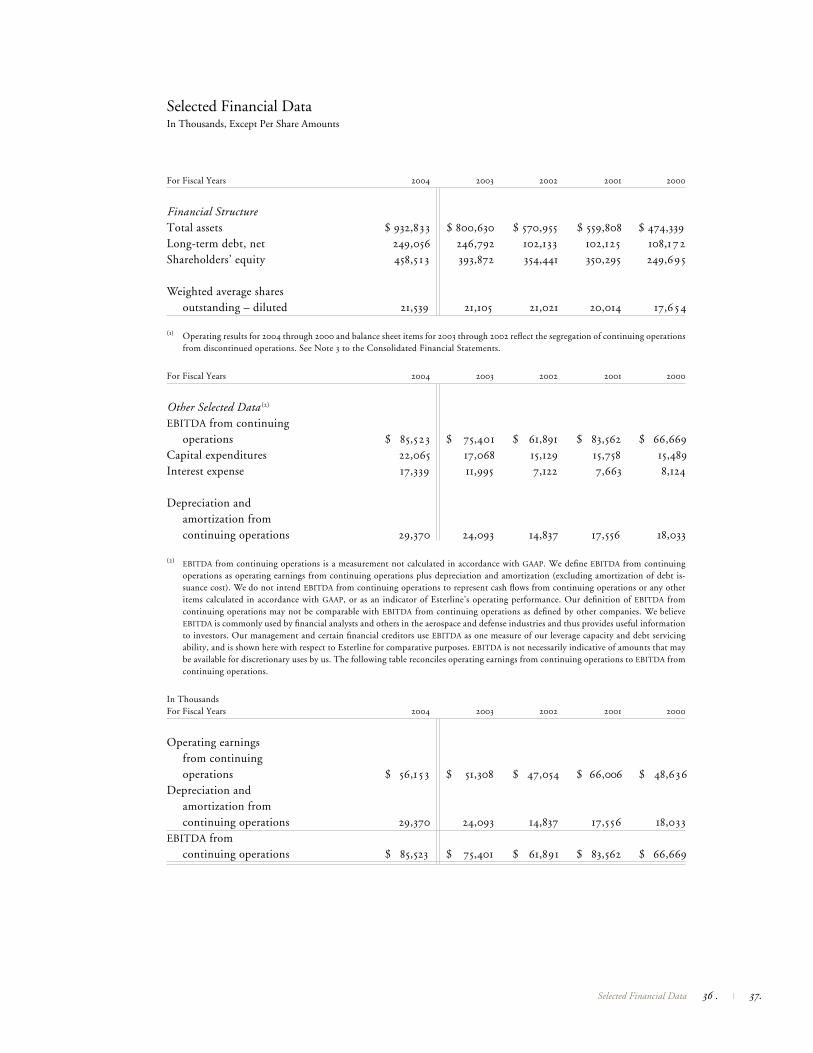
Financial StructureTotal assets $ 932,833 $ 800,630 $ 570,955 $ 559,808 $ 474,339Long-term debt, net 249,056 246,792 102,133 102,125 108,172Shareholders’ equity 458,5 1 3 393,872 354,441 350,295 249,695
Weighted average shares outstanding – diluted 21,539 21,105 21,021 20,014 17,6 54
(1) Operating results for 2004 through 2000 and balance sheet items for 2003 through 2002 reflect the segregation of continuing operations from discontinued operations. See Note 3 to the Consolidated Financial Statements.
For Fiscal Years 2004 2003 2002 2001 2000
Other Selected Data (2)
EBITDA from continuing operations $ 85,523 $ 75,401 $ 61,891 $ 83,562 $ 66,669Capital expenditures 22,065 17,068 15,129 15,758 15,489Interest expense 17,339 11,995 7,122 7,663 8,124
Depreciation and amortization from continuing operations 29,370 24,093 14,837 17,556 18,033
(2) EBITDA from continuing operations is a measurement not calculated in accordance with GAAP. We define EBITDA from continuing operations as operating earnings from continuing operations plus depreciation and amortization (excluding amortization of debt is-suance cost). We do not intend EBITDA from continuing operations to represent cash flows from continuing operations or any other items calculated in accordance with GAAP, or as an indicator of Esterline’s operating performance. Our definition of EBITDA from continuing operations may not be comparable with EBITDA from continuing operations as defined by other companies. We believe EBITDA is commonly used by financial analysts and others in the aerospace and defense industries and thus provides useful information to investors. Our management and certain financial creditors use EBITDA as one measure of our leverage capacity and debt servicing ability, and is shown here with respect to Esterline for comparative purposes. EBITDA is not necessarily indicative of amounts that may be available for discretionary uses by us. The following table reconciles operating earnings from continuing operations to EBITDA from continuing operations.
In ThousandsFor Fiscal Years 2004 2003 2002 2001 2000
Operating earnings from continuing operations $ 56,1 5 3 $ 51,308 $ 47,054 $ 66,006 $ 48,636Depreciation and amortization from continuing operations 29,370 24,093 14,837 17,556 18,033EBITDA from continuing operations $ 85,523 $ 75,401 $ 61,891 $ 83,562 $ 66,669
Selected Financial DataIn Thousands, Except Per Share Amounts
36 . | 37.Selected Financial Data
Esterline
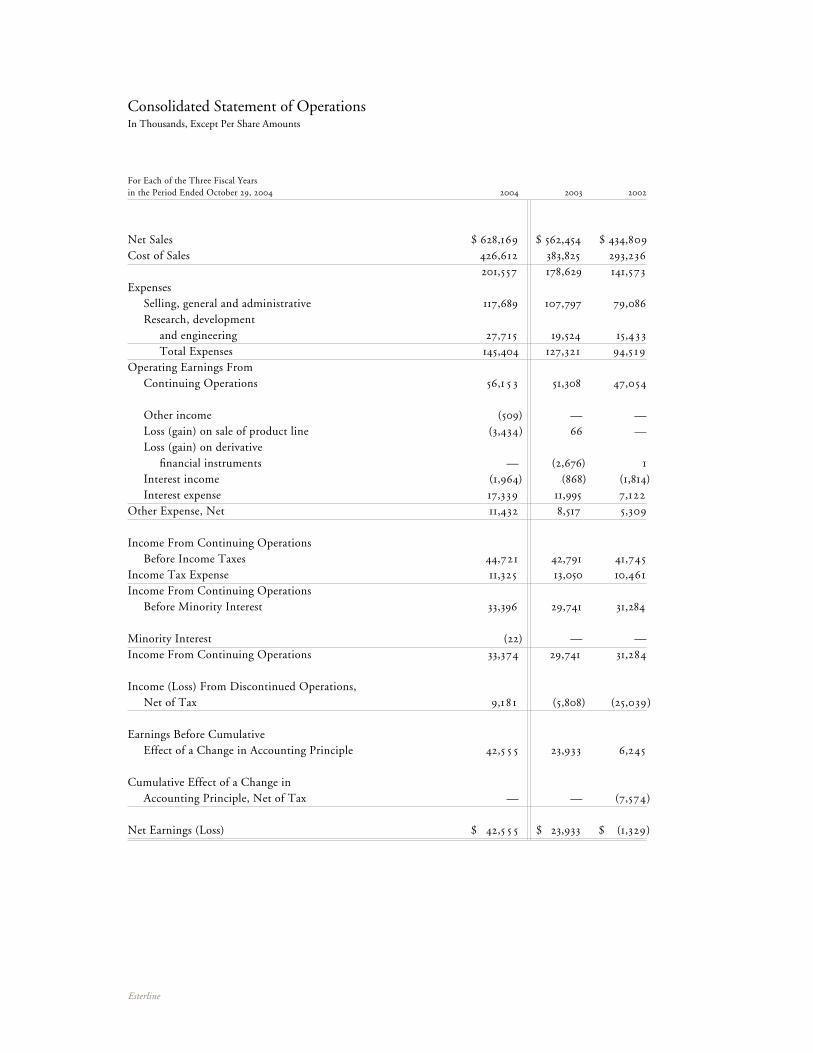
For Each of the Three Fiscal Yearsin the Period Ended October 29, 2004 2004 2003 2002
Net Sales $ 628,169 $ 562,454 $ 434,809Cost of Sales 426,612 383,825 293,236 201,557 178,629 141,573Expenses Selling, general and administrative 117,689 107,797 79,086 Research, development and engineering 27,715 19,524 15,4 3 3 Total Expenses 145,404 127,321 94,5 19Operating Earnings From Continuing Operations 56,1 5 3 51,308 47,054
Other income (509) — — Loss (gain) on sale of product line (3,434) 66 — Loss (gain) on derivative financial instruments — (2,676) 1 Interest income (1,964) (868) (1,814) Interest expense 17,339 11,995 7,122Other Expense, Net 11,432 8,517 5,309
Income From Continuing Operations Before Income Taxes 44,721 42,791 41,745Income Tax Expense 11,325 13,050 10,461Income From Continuing Operations Before Minority Interest 33,396 29,741 31,284
Minority Interest (22) — —Income From Continuing Operations 33,374 29,741 31,284
Income (Loss) From Discontinued Operations, Net of Tax 9,1 8 1 (5,808) (25,039)
Earnings Before Cumulative Effect of a Change in Accounting Principle 42,5 5 5 23,933 6,245
Cumulative Effect of a Change in Accounting Principle, Net of Tax — — (7,574)
Net Earnings (Loss) $ 42,5 5 5 $ 23,933 $ (1,329)
Consolidated Statement of OperationsIn Thousands, Except Per Share Amounts
For Each of the Three Fiscal Yearsin the Period Ended October 29, 2004 2004 2003 2002
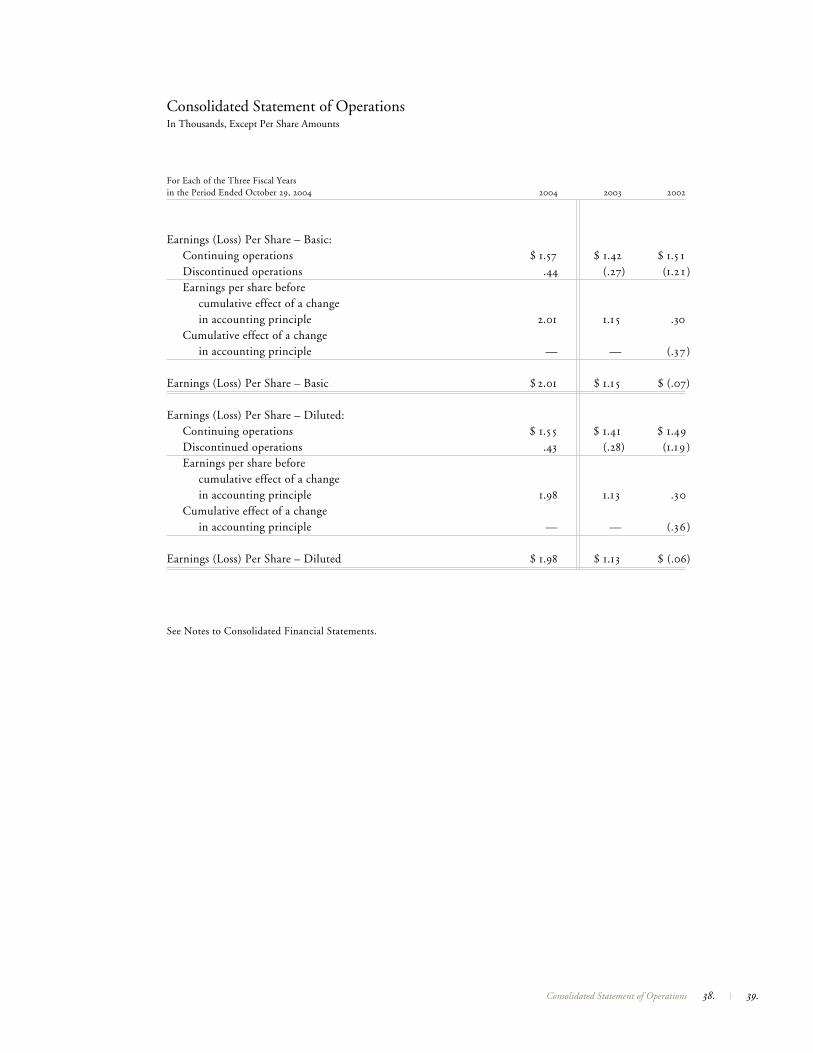
Earnings (Loss) Per Share – Basic: Continuing operations $ 1.57 $ 1.42 $ 1.5 1 Discontinued operations .44 (.27) (1.2 1 ) Earnings per share before cumulative effect of a change in accounting principle 2.01 1.1 5 .30 Cumulative effect of a change in accounting principle — — (.37)
Earnings (Loss) Per Share – Basic $ 2.01 $ 1.1 5 $ (.07)
Earnings (Loss) Per Share – Diluted: Continuing operations $ 1.5 5 $ 1.41 $ 1.49 Discontinued operations .43 (.28) (1.1 9 ) Earnings per share before cumulative effect of a change in accounting principle 1.98 1.13 .30 Cumulative effect of a change in accounting principle — — (.36)
Earnings (Loss) Per Share – Diluted $ 1.98 $ 1.13 $ (.06)
See Notes to Consolidated Financial Statements.
Consolidated Statement of OperationsIn Thousands, Except Per Share Amounts
38. | 39.Consolidated Statement of Operations
Esterline
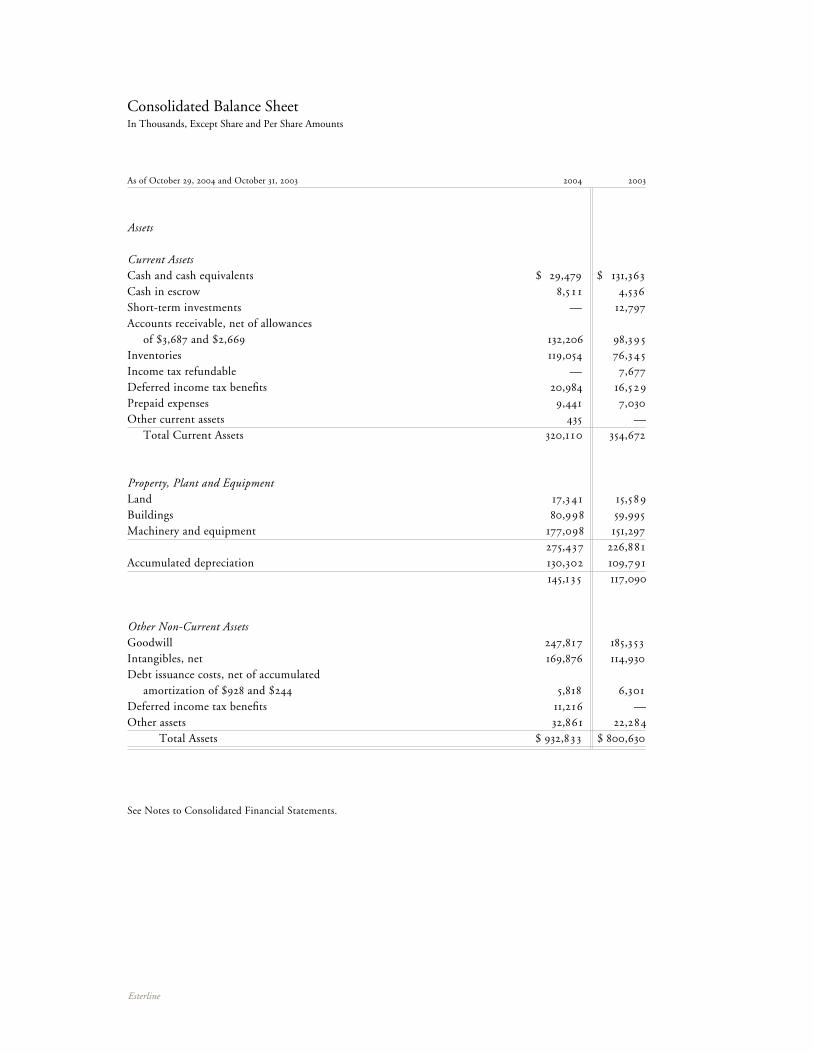
As of October 29, 2004 and October 31, 2003 2004 2003
Assets
Current AssetsCash and cash equivalents $ 29,479 $ 131,363Cash in escrow 8,5 1 1 4,536Short-term investments — 12,797Accounts receivable, net of allowances of $3,687 and $2,669 132,206 98,39 5Inventories 119,054 76,34 5Income tax refundable — 7,677Deferred income tax benefits 20,984 16,5 29Prepaid expenses 9,441 7,030Other current assets 435 — Total Current Assets 320,1 10 354,672
Property, Plant and EquipmentLand 17,34 1 15,5 89Buildings 80,998 59,995Machinery and equipment 177,098 151,297 275,437 226,88 1Accumulated depreciation 130,302 109,791 145,1 3 5 117,090
Other Non-Current AssetsGoodwill 247,817 185,353Intangibles, net 169,876 114,930Debt issuance costs, net of accumulated amortization of $928 and $244 5,818 6,301Deferred income tax benefits 11,216 —Other assets 32,861 22,284 Total Assets $ 932,8 3 3 $ 800,630
See Notes to Consolidated Financial Statements.
Consolidated Balance SheetIn Thousands, Except Share and Per Share Amounts
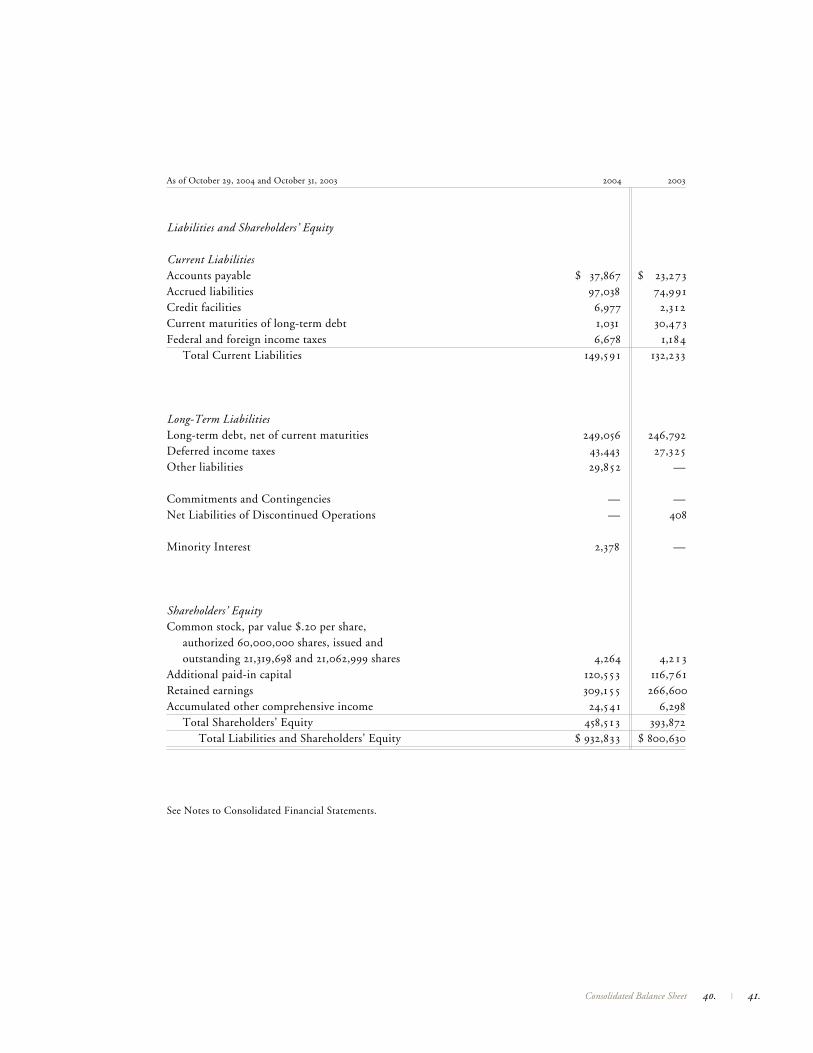
As of October 29, 2004 and October 31, 2003 2004 2003
Liabilities and Shareholders’ Equity
Current LiabilitiesAccounts payable $ 37,867 $ 23,273Accrued liabilities 97,038 74,991Credit facilities 6,977 2,3 1 2Current maturities of long-term debt 1,031 30,473Federal and foreign income taxes 6,678 1,184 Total Current Liabilities 149,59 1 132,233
Long-Term LiabilitiesLong-term debt, net of current maturities 249,056 246,792Deferred income taxes 43,443 27,325Other liabilities 29,852 —
Commitments and Contingencies — —Net Liabilities of Discontinued Operations — 408
Minority Interest 2,378 —
Shareholders’ EquityCommon stock, par value $.20 per share, authorized 60,000,000 shares, issued and outstanding 21,319,698 and 21,062,999 shares 4,264 4,2 1 3Additional paid-in capital 120,5 5 3 116,761Retained earnings 309,1 5 5 266,600Accumulated other comprehensive income 24,54 1 6,298 Total Shareholders’ Equity 458,5 1 3 393,872 Total Liabilities and Shareholders’ Equity $ 932,833 $ 800,630
See Notes to Consolidated Financial Statements.
40. | 41.Consolidated Balance Sheet
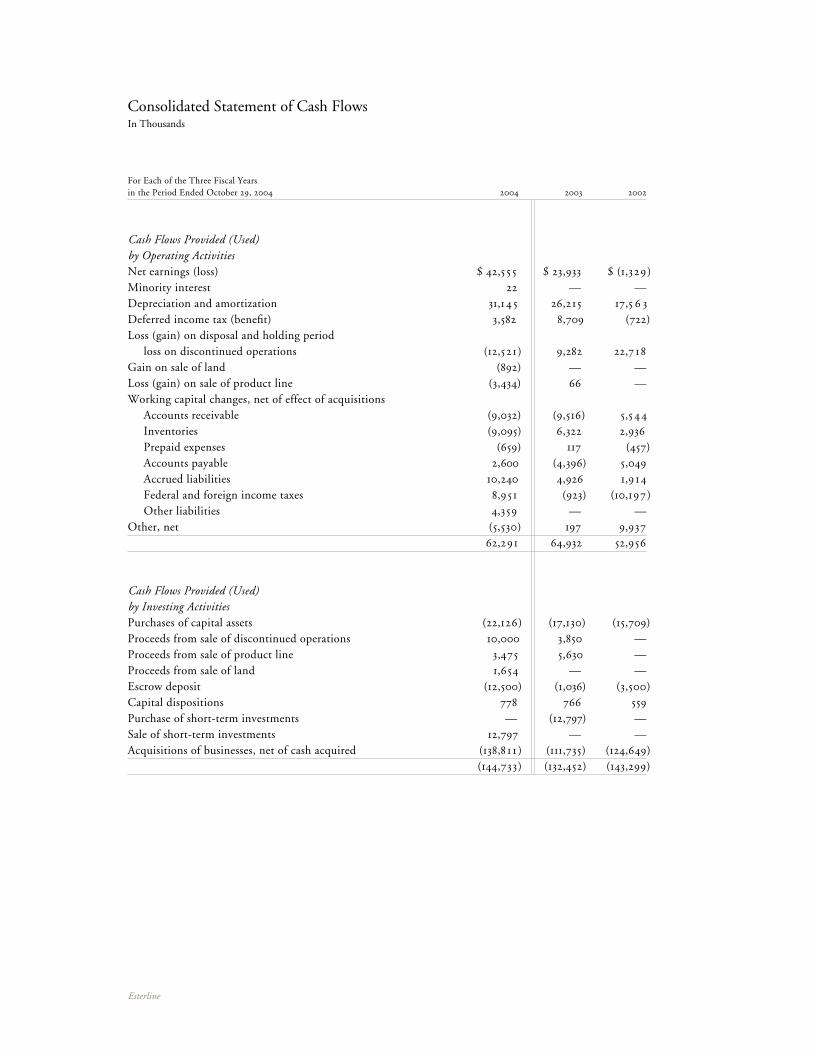
Esterline
For Each of the Three Fiscal Yearsin the Period Ended October 29, 2004 2004 2003 2002
Cash Flows Provided (Used) by Operating ActivitiesNet earnings (loss) $ 42,555 $ 23,933 $ (1,329)Minority interest 22 — —Depreciation and amortization 31,1 4 5 26,215 17,5 6 3Deferred income tax (benefit) 3,582 8,709 (722)Loss (gain) on disposal and holding period loss on discontinued operations (12,521) 9,282 22,7 1 8Gain on sale of land (892) — —Loss (gain) on sale of product line (3,434) 66 —Working capital changes, net of effect of acquisitions Accounts receivable (9,032) (9,516) 5,544 Inventories (9,095) 6,322 2,936 Prepaid expenses (659) 117 (457) Accounts payable 2,600 (4,396) 5,049 Accrued liabilities 10,240 4,926 1,9 14 Federal and foreign income taxes 8,951 (923) (10,197) Other liabilities 4,359 — —Other, net (5,530) 197 9,937 62,291 64,932 52,956
Cash Flows Provided (Used)by Investing ActivitiesPurchases of capital assets (22,126) (17,130) (15,709)Proceeds from sale of discontinued operations 10,000 3,850 —Proceeds from sale of product line 3,475 5,630 —Proceeds from sale of land 1,654 — —Escrow deposit (12,500) (1,036) (3,500)Capital dispositions 778 766 559Purchase of short-term investments — (12,797) —Sale of short-term investments 12,797 — —Acquisitions of businesses, net of cash acquired (138,8 1 1 ) (111,735) (124,649) (144,733) (132,452) (143,299)
Consolidated Statement of Cash FlowsIn Thousands
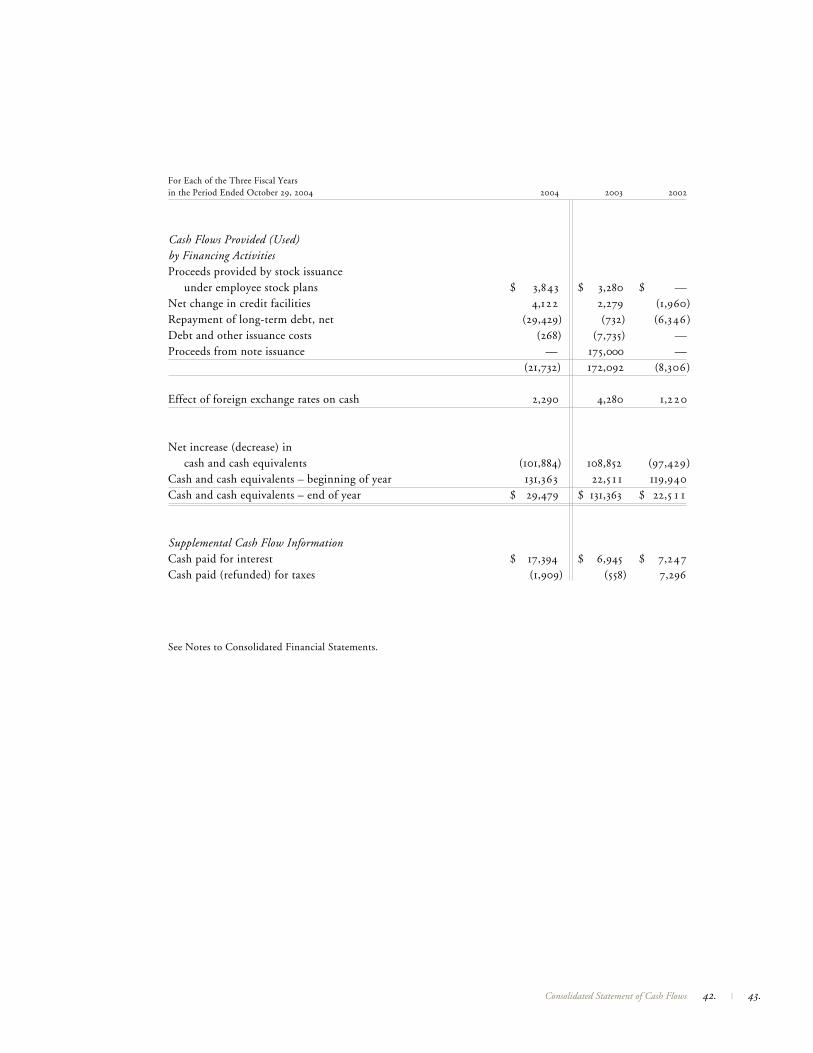
For Each of the Three Fiscal Yearsin the Period Ended October 29, 2004 2004 2003 2002
Cash Flows Provided (Used)by Financing ActivitiesProceeds provided by stock issuance under employee stock plans $ 3,843 $ 3,280 $ —Net change in credit facilities 4,122 2,279 (1,960)Repayment of long-term debt, net (29,429) (732) (6,346)Debt and other issuance costs (268) (7,735) —Proceeds from note issuance — 175,000 — (21,732) 172,092 (8,306)
Effect of foreign exchange rates on cash 2,290 4,280 1,220
Net increase (decrease) in cash and cash equivalents (101,884) 108,852 (97,429)Cash and cash equivalents – beginning of year 131,363 22,5 1 1 119,940Cash and cash equivalents – end of year $ 29,479 $ 131,363 $ 22,5 1 1
Supplemental Cash Flow InformationCash paid for interest $ 17,394 $ 6,945 $ 7,247Cash paid (refunded) for taxes (1,909) (558) 7,296
See Notes to Consolidated Financial Statements.
42. | 43.Consolidated Statement of Cash Flows
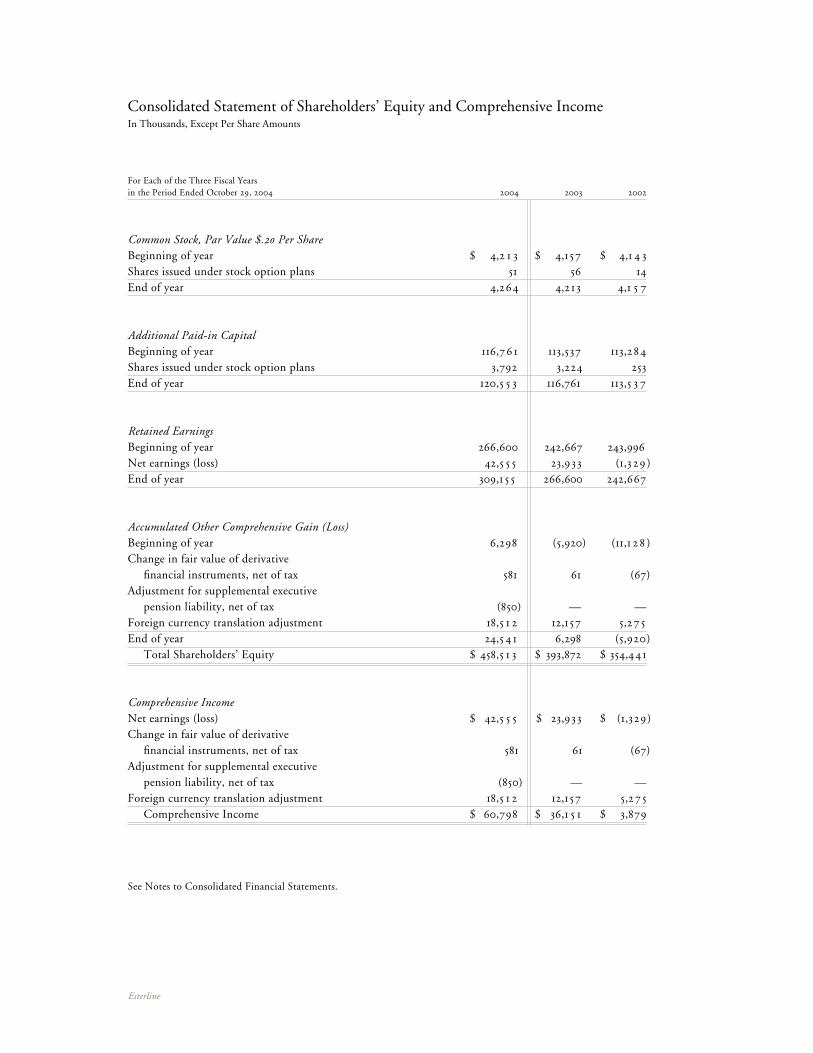
Esterline
For Each of the Three Fiscal Yearsin the Period Ended October 29, 2004 2004 2003 2002
Common Stock, Par Value $.20 Per ShareBeginning of year $ 4,2 1 3 $ 4,157 $ 4,1 4 3Shares issued under stock option plans 51 56 14End of year 4,264 4,213 4,1 5 7
Additional Paid-in CapitalBeginning of year 116,76 1 113,537 113,284Shares issued under stock option plans 3,792 3,224 253End of year 120,5 5 3 116,761 113,5 3 7
Retained EarningsBeginning of year 266,600 242,667 243,996Net earnings (loss) 42,5 5 5 23,933 (1,3 29 )End of year 309,1 5 5 266,600 242,667
Accumulated Other Comprehensive Gain (Loss)Beginning of year 6,298 (5,920) (11,1 2 8 )Change in fair value of derivative financial instruments, net of tax 581 61 (67)Adjustment for supplemental executive pension liability, net of tax (850) — —Foreign currency translation adjustment 18,5 1 2 12,157 5,27 5End of year 24,5 4 1 6,298 (5,920) Total Shareholders’ Equity $ 458,5 1 3 $ 393,872 $ 354,44 1
Comprehensive IncomeNet earnings (loss) $ 42,5 5 5 $ 23,933 $ (1,329)Change in fair value of derivative financial instruments, net of tax 581 61 (67)Adjustment for supplemental executive pension liability, net of tax (850) — —Foreign currency translation adjustment 18,5 1 2 12,157 5,27 5 Comprehensive Income $ 60,798 $ 36,1 5 1 $ 3,879
See Notes to Consolidated Financial Statements.
Consolidated Statement of Shareholders’ Equity and Comprehensive IncomeIn Thousands, Except Per Share Amounts
1. Accounting Policies
Nature of OperationsEsterline Technologies Corporation (the Company) designs, manufactures and markets highly engineered products. The Company serves the aerospace and defense industry, primarily in the United States and Europe. The Company also serves the industrial/commercial and medical markets.
Principles of Consolidation and Basis of PresentationThe consolidated financial statements include the accounts of the Company and all subsidiaries. All significant intercompany accounts and transactions have been eliminated. Classifications have been changed for certain amounts in prior periods to conform with the current year’s presentation. The Company’s fiscal year ends on the last Friday of October.
Management EstimatesTo prepare financial statements in conformity with accounting principles generally accepted in the United States, management is required to make estimates and assumptions that affect the reported amounts of as-sets and liabilities, disclosure of contingent assets and liabilities at the date of the financial statements, and the reported amounts of revenues and expenses during the reporting period. Actual results could differ from those estimates.
Revenue RecognitionThe Company recognizes revenue when the title and risk of loss have passed to the customer, there is persuasive evidence of an agreement, delivery has occurred or services have been rendered, the price is determinable, and the collectibility is reasonably assured. The Company recognizes product revenues at the point of ship-ment or delivery in accordance with the terms of sale. Sales are net of returns and allowances. Returns and allowances are not significant because products are manufactured to customer specification and are covered by the terms of the product warranty.
Financial InstrumentsFair Value of Financial Instruments The Company’s financial instruments consist primarily of cash and cash equivalents, accounts receivable, accounts payable, short-term borrowings, long-term debt, foreign currency forward contracts, and an interest rate swap agreement. The carrying amounts of cash and cash equivalents, accounts receivable, and accounts payable approximate their respective fair values because of the short-term maturities or expected settlement dates of these instruments. The fair market value of the Company’s long-term debt and short-term borrowings was estimated at $271.1 million and $294.9 million, at fiscal year end 2004 and 2003, respectively. These estimates were derived using discounted cash flows with interest rates currently available to the Company for issuance of debt with similar terms and remaining maturities.
Foreign Currency Exchange Risk Management The Company is subject to risks associated with fluctua-tions in foreign currency exchange rates from the sale of products in currencies other than its functional currency. The Company’s policy is to hedge a portion of its forecasted transactions using forward exchange contracts, with maturities up to fifteen months. These forward contracts have been designated as cash flow hedges. The portion of the net gain or loss on a derivative instrument that is effective as a hedge is reported as a component of other comprehensive income in shareholders’ equity and is reclassified into earnings in the same period during which the hedged transaction affects earnings. The remaining net gain or loss on the derivative in excess of the present value of the expected cash flows of the hedged transaction is recorded in earnings immediately. If a derivative does not qualify for hedge accounting, or a portion of the hedge is deemed ineffective, the change in fair value is recorded in earnings. The amount of hedge ineffectiveness
Notes to Consolidated Financial Statements
44. | 45.Notes to Consolidated Financial Statements
Esterline
has not been material in any of the three fiscal years in the period ended October 29, 2004. At October 29, 2004 and October 31, 2003, the notional value of foreign currency forward contracts was $26.5 million and $11.1 million, respectively. The fair value of these contracts at October 29, 2004 and October 31, 2003 was an asset of $1,096,000 and $173,000, respectively. The Company does not enter into any forward contracts for trading purposes.
Interest Rate Risk Management Depending on the interest rate environment, the Company may enter into interest rate swap agreements to convert the fixed interest rates on notes payable to variable interest rates or terminate any swap agreements in place. These interest rate swap agreements have been designated as fair value hedges. Accordingly, gain or loss on swap agreements as well as the offsetting loss or gain on the hedged portion of notes payable are recognized in interest expense during the period of the change in fair values. The Company attempts to manage exposure to counterparty credit risk by only entering into agreements with major financial institutions which are expected to be able to fully perform under the terms of the agree-ment. In September 2003, the Company entered into an interest rate swap agreement on $75.0 million of its Senior Subordinated Notes due in 2013. The swap agreement exchanged the fixed interest rate for a variable interest rate on $75.0 million of the $175.0 million principal amount outstanding. The fair market value of the Company’s interest rate swap was a $1,769,000 asset and a $235,000 liability at October 29, 2004 and October 31, 2003, respectively. The fair market value was estimated by discounting expected cash flows using quoted market interest rates.
Foreign Currency TranslationForeign currency assets and liabilities are translated into their U.S. dollar equivalents based on year-end exchange rates. Revenue and expense accounts are translated at average exchange rates. Aggregate exchange gains and losses arising from the translation of foreign assets and liabilities are included in shareholders’ equity as a component of comprehensive income. Foreign currency transaction gains and losses are included in results of operations and have not been significant in amount in any of the three fiscal years in the period ended October 29, 2004.
Cash Equivalents and Cash in EscrowCash equivalents consist of highly liquid investments with maturities of three months or less at the date of purchase. Fair value of cash equivalents approximates carrying value. Cash in escrow represents amounts held in escrow pending finalization of a purchase transaction.
Short-term InvestmentsShort-term investments consist of highly liquid investments with maturities of more than three months at the date of purchase. Short-term investments are classified as trading securities and, accordingly, are reported at fair value with unrealized gains and losses included in earnings.
Accounts ReceivableAccounts receivable are recorded at the net invoice price for sales billed to customers. Accounts receivable are considered past due when outstanding more than normal trade terms allow. An allowance for doubtful accounts is established when losses are expected to be incurred. Accounts receivable are written off to the allowance for doubtful accounts when the balance is considered to be uncollectible.
InventoriesInventories are stated at the lower of cost or market using the first-in, first-out (FIFO) or average cost method. Inventory cost includes material, labor and factory overhead.
Property, Plant and Equipment, and DepreciationProperty, plant and equipment is carried at cost and includes expenditures for major improvements. Depre-ciation is generally provided on the straight-line method based upon estimated useful lives ranging from 3 to 30 years. Depreciation expense was $21,609,000, $17,510,000 and $13,106,000 for fiscal years 2004, 2003 and 2002, respectively.
Debt Issuance CostsCosts incurred to issue debt are deferred and amortized as interest expense over the term of the related debt using a method that approximates the effective interest method.
Long-lived AssetsThe carrying amount of long-lived assets is reviewed periodically for impairment. An asset (other than goodwill and indefinite lived intangible assets) is considered impaired when estimated future cash flows are less than the carrying amount of the asset. In the event the carrying amount of such asset is not deemed recoverable, the asset is adjusted to its estimated fair value. Fair value is generally determined based upon estimated discounted future cash flows.
Goodwill and IntangiblesBeginning in fiscal 2002 with the adoption of Statement No. 142, goodwill is no longer amortized, but instead tested for impairment at least annually. When a reporting unit’s carrying value exceeds its estimated fair value, an impairment test is required. This test involves allocating the fair value of the reporting unit to all of the assets and liabilities of that unit, with the excess of fair value over allocated net assets representing the fair value of goodwill. An impairment loss is measured as the amount by which the carrying value of goodwill exceeds the estimated fair value of goodwill. Prior to fiscal 2002, goodwill was amortized on a straight-line basis over the period of expected benefit which ranged from 10 to 40 years.
Intangible assets are amortized using the straight-line method over their estimated period of benefit, ranging from 2 to 20 years. The Company periodically evaluates the recoverability of intangible assets and takes into account events or circumstances that warrant revised estimates of useful lives or that indicate that an impair-ment exists.
Indefinite lived intangible assets (other than goodwill) are tested annually for impairment or more frequently on an interim basis if circumstances require. This test is comparable to the impairment test for goodwill de-scribed above.
EnvironmentalEnvironmental exposures are provided for at the time they are known to exist or are considered probable and reasonably estimable. No provision has been recorded for environmental remediation costs which could result from changes in laws or other circumstances currently not contemplated by the Company. Costs provided for future expenditures on environmental remediation are not discounted to present value.
Stock-based CompensationThe Company accounts for its stock-based compensation plans in accordance with Accounting Principles Board Opinion No. 25. Additional disclosures as required under Financial Accounting Standards No. 123, “Accounting for Stock-Based Compensation” (Statement No. 132), are included below. The Black-Scholes option-pricing model was used to calculate the estimated compensation expense that would have been rec-
46. | 47.Notes to Consolidated Financial Statements
Esterline
ognized under these guidelines.As prescribed by Statement No. 123, including compensation cost for the Company’s stock option and em-
ployee stock purchase plans, pro forma disclosures for fiscal years 2004, 2003 and 2002 would have been:
In Thousands, Except Per Share Amounts 2004 2003 2002
Net earnings (loss) as reported $ 42,5 5 5 $ 23,933 $ (1,329)Pro forma net earnings (loss) 40,566 22,396 (2,896)
Basic earnings (loss) per share as reported $ 2.01 $ 1.1 5 $ (.07)Pro forma basic earnings (loss) per share 1.91 1.07 (.14)
Diluted earnings (loss) per share as reported $ 1.98 $ 1.1 3 $ (.06)Pro forma diluted earnings (loss) per share 1.88 1.06 (.14)
The weighted average Black-Scholes value of options granted during fiscal years 2004, 2003 and 2002 was $13.85, $11.96 and $11.26, respectively. The assumptions used in the Black-Scholes option-pricing model for fiscal years 2004, 2003 and 2002 were as follows:
2004 2003 2002
Volatility 53.1 % 66.3 % 65.6 %Risk-free interest rate 3.12 – 3.84% 2.88 – 3.94% 2.79 – 4.03%Expected life (years) 5 – 8 5 – 8 5 – 8Dividends – – –
Product WarrantiesEstimated product warranty expenses are recorded when the covered products are shipped to customers and rec-ognized as revenue. Product warranty expense is estimated based upon the terms of the warranty program.
Earnings Per ShareBasic earnings per share is computed on the basis of the weighted average number of common shares outstand-ing during the year. Diluted earnings per share also includes the dilutive effect of stock options. The weighted average number of shares outstanding used to compute basic earnings per share was 21,195,000, 20,900,000 and 20,751,000 for the fiscal years 2004, 2003 and 2002, respectively. The weighted average number of shares outstanding used to compute diluted earnings per share was 21,539,000, 21,105,000 and 21,021,000 for the fiscal years 2004, 2003 and 2002, respectively.
Recent Accounting PronouncementsIn December 2004, the Financial Accounting Standards Board issued Statement of Financial Accounting Standards No. 123R, “Share-Based Payment,” which is effective for public companies for interim or annual periods beginning after June 15, 2005. This statement will have a significant impact on the Company’s con-solidated statements of operations, as the Company will be required to expense the fair value of its stock option grants and stock purchases under its employee stock purchase plan rather than disclose the impact on the consolidated net income within the footnotes as is the Company’s current practice. Management intends to comply with the standard upon its effectiveness; however, management does not believe that the impact would be materially different from the above pro forma disclosures under “Stock-Based Compensation.”
2. Accounting Changes
Effective at the beginning of fiscal 2002, the Company adopted Statement No. 142. Under the new Statement, goodwill and intangible assets deemed to have indefinite lives are no longer amortized, but are subject to annual impairment tests in accordance with the Statement. The Company conducted its initial impairment tests and determined that goodwill associated with a reporting unit in the Avionics & Controls segment was impaired as a result of applying Statement No. 142. Due to increased competition in the electronic input industry, principally from companies headquartered in Asia, operating profits and cash flows were lower in fiscal 2001 for this reporting unit. Based upon this trend, the earnings forecast for the next five years was lowered. A goodwill impairment loss of $7,574,000, net of an income tax benefit of $1,542,000, or ($.36) per diluted share, was recognized and reported as a cumulative effect of a change in accounting principle upon the adoption of Statement No. 142 in the first quarter of fiscal 2002. The fair value of the affected reporting unit was estimated using a combination of the present value of expected cash flows and a market approach.
3. Discontinued Operations
On July 25, 2002, the Board of Directors adopted a formal plan for the sale of the assets and operations of the Company’s Automation segment. As a result, the consolidated financial statements present the Automation segment as a discontinued operation. The Company recorded an after-tax loss from discontinued operations of $5.8 million and $25.0 million in fiscal 2003 and 2002, respectively. On July 23, 2003, the Company sold the assets of its Excellon Automation subsidiary. On August 31, 2004, the Company sold the stock of W. A. Whitney for $10.0 million in cash. Upon the final disposition of its discontinued operations, the Company recorded an $8.0 million gain, net of $4.5 million in tax, including the reversal of estimated reserves, which were recognizable upon the sale of the business.
Sales of the Automation segment were $16,892,000, $22,942,000 and $32,896,000 in fiscal years 2004, 2003 and 2002, respectively. The operating results of the discontinued segment for fiscal years 2004, 2003 and 2002 consist of the following:
In Thousands 2004 2003 2002
Income (loss) before taxes $ 1,824 $ — $ (16,343)Tax expense (benefit) 657 — (6,071)
Net income (loss) 1,167 — (10,272)Gain (loss) on disposal, including tax expense (benefit) of $4,507, $(3,474) and $(7,951) 8,014 (5,808) (14,767)Income (loss) from discontinued operations $ 9,181 $ (5,808) $ (25,039)
48. | 49.Notes to Consolidated Financial Statements
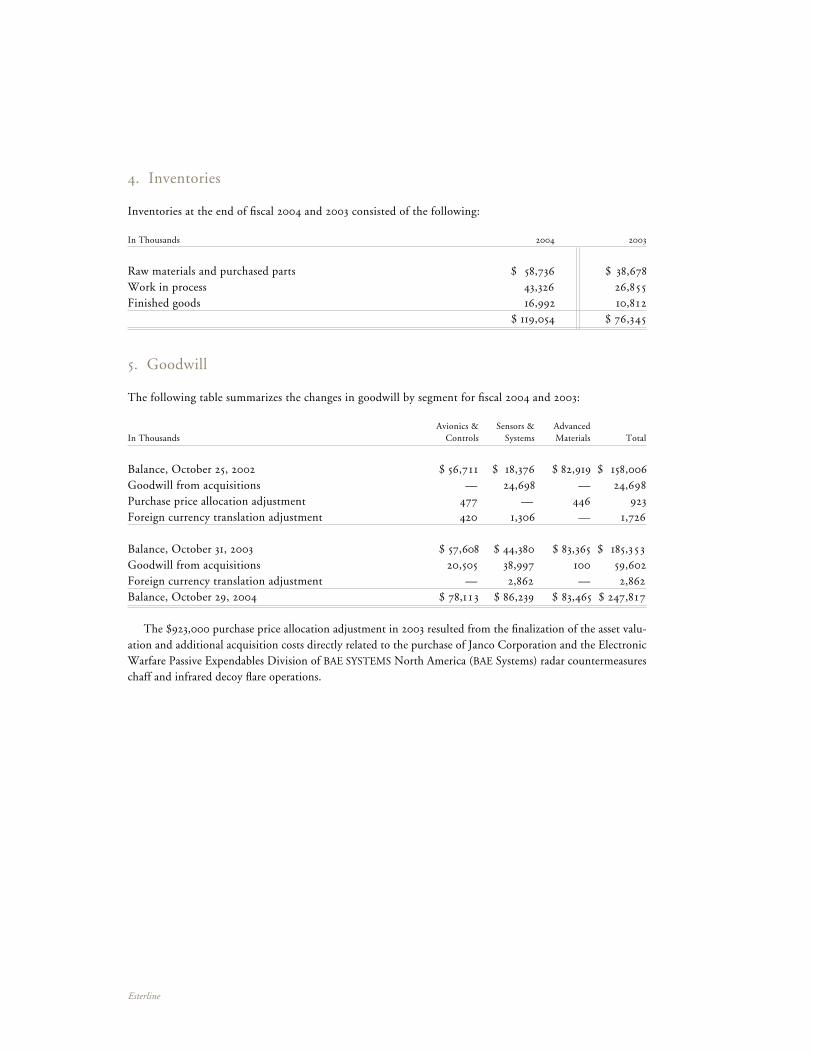
Esterline
4. Inventories
Inventories at the end of fiscal 2004 and 2003 consisted of the following:
In Thousands 2004 2003
Raw materials and purchased parts $ 58,736 $ 38,678Work in process 43,326 26,855Finished goods 16,992 10,812 $ 119,054 $ 76,345
5. Goodwill
The following table summarizes the changes in goodwill by segment for fiscal 2004 and 2003:
Avionics & Sensors & Advanced In Thousands Controls Systems Materials Total
Balance, October 25, 2002 $ 56,711 $ 18,376 $ 82,919 $ 158,006Goodwill from acquisitions — 24,698 — 24,698Purchase price allocation adjustment 477 — 446 923Foreign currency translation adjustment 420 1,306 — 1,726
Balance, October 31, 2003 $ 57,608 $ 44,380 $ 83,365 $ 185,3 5 3Goodwill from acquisitions 20,505 38,997 100 59,602Foreign currency translation adjustment — 2,862 — 2,862Balance, October 29, 2004 $ 78,1 1 3 $ 86,239 $ 83,465 $ 247,817
The $923,000 purchase price allocation adjustment in 2003 resulted from the finalization of the asset valu-ation and additional acquisition costs directly related to the purchase of Janco Corporation and the Electronic Warfare Passive Expendables Division of BAE SYSTEMS North America (BAE Systems) radar countermeasures chaff and infrared decoy flare operations.
6. Intangible Assets
Intangible assets at the end of fiscal 2004 and 2003 were as follows:
2004 2003 Weighted Gross Gross Average Years Carrying Accum. Carrying Accum. In Thousands Useful Life Amount Amort. Amount Amort.
Amortized Intangible Assets Programs 18 $ 134,657 $ 12,698 $ 100,020 $ 5,803 Core technology 16 8,979 1,465 8,709 827 Patents and other 7 35,488 17,6 1 1 21,462 16,448 Total $ 179,124 $ 31,774 $ 130,1 9 1 $ 23,078
Indefinite-lived Intangible Assets Trademark $ 22,526 $ 7,817
Amortization of intangible assets was $8,533,000, $6,248,000 and $1,522,000 in fiscal years 2004, 2003 and 2002, respectively.
Estimated amortization expense related to intangible assets for each of the next five fiscal years is as follows:
In ThousandsFiscal Year
2005 $ 10,50 12006 10,2832007 10,0962008 9,8362009 9,090
7. Accrued Liabilities
Accrued liabilities at the end of fiscal 2004 and 2003 consisted of the following:
In Thousands 2004 2003
Payroll and other compensation $ 39,316 $ 30,091Casualty and medical 11,940 9,348Interest 6,338 7,667Warranties 6,633 5,387State and other tax accruals 9,001 6,623Acquisition related payments 8,510 1,005Other 15,300 14,870 $ 97,038 $ 74,991
50. | 51.Notes to Consolidated Financial Statements
Esterline
8. Other Liabilities
Other liabilities at the end of fiscal 2004 and 2003 consisted of the following:
In Thousands 2004 2003
Pension obligation $ 24,852 $ —Acquisition related payments 5,000 — $ 29,852 $ —
9. Retirement Benefits
Pension benefits are provided for approximately 50% of all U.S. employees under the Esterline contributory pension plan or the Leach noncontributory defined benefit pension plan.
Under the Esterline plan, pension benefits are based on years of service and five-year average compensation or under a cash balance formula, with annual pay credits ranging from 2% to 6% of salary. Esterline amended its defined benefit plan to add a cash balance formula effective January 1, 2003. Participants elected either to continue earning benefits under the current plan formula or to earn benefits under the cash balance formula. Effective January 1, 2003, all new participants are enrolled in the cash balance formula. Esterline also has an unfunded supplemental retirement plan for key executives providing for periodic payments upon retirement.
Under the Leach noncontributory defined benefit pension plan, benefits are based on an employee’s years of service and the highest five consecutive years’ compensation during the last ten years of employment. Leach’s non-U.S. subsidiaries have retirement plans covering substantially all of its employees. Benefits become vested after ten years of employment and are due in full upon retirement, disability or death of the employee. Leach also has a supplemental retirement plan which provides supplemental pension benefits to key management in addition to amounts received under the Company’s existing retirement plan.
The Company accounts for pension expense using the end of the fiscal year as its measurement date. In addition, the Company makes actuarially computed contributions to these plans as necessary to adequately fund benefits. The Company’s funding policy is consistent with the minimum funding requirements of ERISA. The Esterline plan will require no contributions in fiscal 2005. Effective December 2003, the Leach plan was frozen and employees no longer accrue benefits for future services. The accumulated benefit obligation and projected benefit obligation for the Leach plans are $40,406,000 and $40,520,000, respectively, with plan assets of $19,562,000 as of October 29, 2004. The accrued benefit liabilities for these Leach plans are $20,992,000 at October 29, 2004. Contributions to the Leach plans totaled $523,000 in fiscal 2004 and will be in the range of $2,400,000 to $2,800,000 in fiscal 2005.
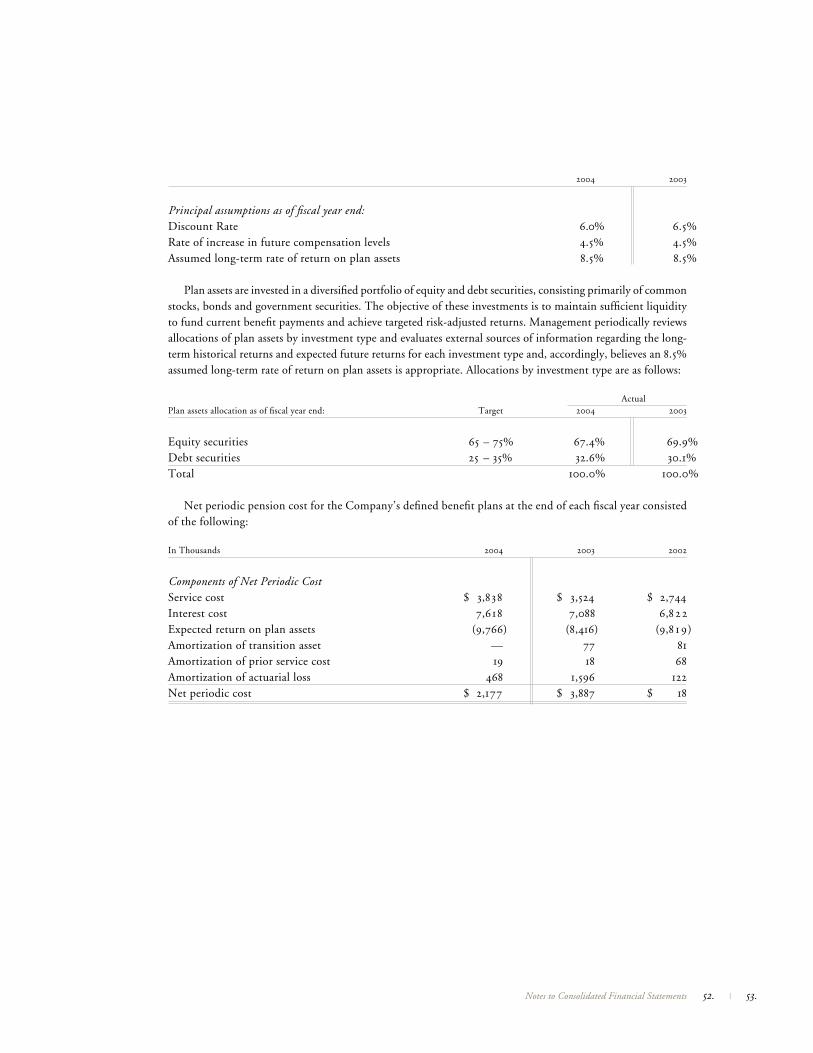
2004 2003
Principal assumptions as of fiscal year end:Discount Rate 6.0% 6.5%Rate of increase in future compensation levels 4.5% 4.5%Assumed long-term rate of return on plan assets 8.5% 8.5%
Plan assets are invested in a diversified portfolio of equity and debt securities, consisting primarily of common stocks, bonds and government securities. The objective of these investments is to maintain sufficient liquidity to fund current benefit payments and achieve targeted risk-adjusted returns. Management periodically reviews allocations of plan assets by investment type and evaluates external sources of information regarding the long-term historical returns and expected future returns for each investment type and, accordingly, believes an 8.5% assumed long-term rate of return on plan assets is appropriate. Allocations by investment type are as follows:
ActualPlan assets allocation as of fiscal year end: Target 2004 2003
Equity securities 65 – 75% 67.4% 69.9%Debt securities 25 – 35% 32.6% 30.1%Total 100.0% 100.0%
Net periodic pension cost for the Company’s defined benefit plans at the end of each fiscal year consisted of the following:
In Thousands 2004 2003 2002
Components of Net Periodic CostService cost $ 3,838 $ 3,524 $ 2,744Interest cost 7,618 7,088 6,822Expected return on plan assets (9,766) (8,416) (9,8 1 9)Amortization of transition asset — 77 81Amortization of prior service cost 19 18 68Amortization of actuarial loss 468 1,596 122Net periodic cost $ 2,177 $ 3,887 $ 18
52. | 53.Notes to Consolidated Financial Statements
Esterline
The funded status of the defined benefit pension plans at the end of fiscal 2004 and 2003 were as follows:
In Thousands 2004 2003
Benefit ObligationBeginning balance $ 114,196 $ 107,337Service cost 3,838 3,524Interest cost 7,620 7,088Actuarial loss 7,300 3,194Acquisitions 40,542 —Amendments — (487)Benefits paid (7,168) (6,460)Ending balance $ 166,328 $ 114,196
Plan Assets – Fair ValueBeginning balance $ 115,202 $ 102,107Actual gain on plan assets 14,577 19,5 1 9Acquisitions 19,141 —Company contributions 559 36Benefits paid (7,168) (6,460)Ending balance $ 142,3 1 1 $ 115,202
Reconciliation of Funded Status to Net Amount RecognizedFunded status – plan assets relative to benefit obligation $ (24,017) $ 1,006Unrecognized net actuarial loss 17,910 15,8 3 8Unrecognized prior service costs (benefit) (12) 6Unrecognized net loss (31) —Net amount recognized $ (6,150) $ 16,850
Amount Recognized in the Consolidated Balance SheetPrepaid benefit cost $ 17,647 $ 18,980Accrued benefit liability (25,277) (2,1 30 )Intangible assets 141 —Accumulated other comprehensive income 1,339 —Net amount recognized $ (6,150) $ 16,850
The accumulated benefit obligation for all pension plans was $159,689,514 at October 29, 2004 and $105,795,633 at October 31, 2003.
Estimated future benefit payments expected to be paid from the plan or from our assets are as follows:
In Thousands
2005 $ 9,8402006 10,5882007 11,0372008 11,6162009 12,0462010-2014 65,590
Employees may participate in certain defined contribution plans. The Company’s contribution expense under these plans totaled $5,796,000, $4,790,000 and $3,227,000 in fiscal 2004, 2003 and 2002, respectively.
In ThousandsFiscal Year
10. Income Taxes
Income tax expense from continuing operations for each of the fiscal years consisted of:
In Thousands 2004 2003 2002
CurrentU.S. Federal $ 9,250 $ 11,1 8 1 $ 7,8 5 1State 1,000 600 (123)Foreign ,284 2,230 3,423 10,5 34 14,011 11,1 5 1DeferredU.S. Federal 4,010 (1,939) (386)State 860 (202) 22Foreign (4,079) 1,180 (326) 791 (961) (690)Income tax expense $ 11,3 2 5 $ 13,050 $ 10,461
U.S. and foreign components of income from continuing operations before income taxes for each of the fiscal years were:
In Thousands 2004 2003 2002
U.S. $ 37,639 $ 35,868 $ 31,890Foreign 7,082 6,923 9,8 5 5Income from continuing operations, before income taxes $ 44,721 $ 42,791 $ 41,745
Primary components of the Company’s deferred tax assets (liabilities) at the end of the fiscal year resulted from temporary tax differences associated with the following:
In Thousands 2004 2003
Reserves and liabilities $ 14,783 $ 13,896NOL carryforwards 13,677 —Employee benefits 3,740 3,28 1Other 1,1 5 8 — Total deferred tax assets 33,358 17,177
Depreciation and amortization (27,094) (13,061)Intangibles and amortization (13,067) (6,875)Retirement benefits (4,440) (6,194)Other — (1,843) Total deferred tax liabilities (44,601) (27,973) Net deferred tax liabilities $ (11,243) $ (10,796)
54. | 55.Notes to Consolidated Financial Statements
Esterline
In connection with the Leach acquisition, the Company assumed a U.S. net operating loss (NOL) of $38.6 million which can be carried forward to subsequent years, subject to limitations under Internal Revenue Code Section 382. Approximately $2.5 million of the $13.7 million tax benefit associated with the NOL carryforward is included in current deferred income tax benefits, and $11.2 million is reported as non-current deferred income tax benefits, reflecting the amount of the NOL that is expected to be utilized in fiscal years ending after October 2005. The NOL expires beginning in 2022.
The tax benefit received by the Company upon exercise of non-qualified employee stock options was $2.9 mil-lion, $0.9 million and $0.5 million in fiscal 2004, 2003 and 2002, respectively.
No valuation allowance was considered necessary on deferred tax assets.A reconciliation of the U.S. federal statutory income tax rate to the effective income tax rate for each of the
fiscal years was as follows:
2004 2003 2002
U.S. statutory income tax rate 35.0% 35.0% 35.0%State income taxes 1.5 0.9 (0.2)Foreign taxes (5.0) (0.7) 0.5Export sales benefit (1.5) (1.9) (2.4)Pass-through entities 6.0 — — Foreign tax credits (5.7) — —Research & development credits (8.0) (4.9) (7.1 )Tax accrual adjustment 2.1 1.9 (0.3 )Other, net 0.9 0.2 (0.4)Effective income tax rate 25.3% 30.5% 25.1 %
The effective tax rate differed from the statutory rate in fiscal 2004, 2003 and 2002, as all years benefited from various tax credits and export sales incentives. In fiscal 2004 and 2002, the Company recognized a $1.9 million and $2.9 million reduction in income taxes, respectively, associated with the favorable resolution of ongoing income tax audits.
No provision for federal income taxes has been made on accumulated earnings of foreign subsidiaries, since such earnings are considered indefinitely reinvested.
11. Debt
Long-term debt at the end of fiscal 2004 and 2003 consisted of the following:
In Thousands 2004 2003
7.75% Senior Subordinated Notes, due June 2013 $ 175,000 $ 175,0006.77% Senior Notes, due November 2008 40,000 40,0006.40% Senior Notes, due November 2005 30,000 30,0006.00% Senior Notes, due November 2003 — 30,000Other 3,3 1 8 2,500 248,3 1 8 277,500
Fair value of interest rate swap agreement 1,769 (235)Less current maturities 1,0 3 1 30,473Carrying amount of long-term debt $ 249,056 $ 246,792
In June 2003, the Company sold $175.0 million of 7.75% Senior Subordinated Notes due in 2013 and requiring semi-annual interest payments in December and June of each year until maturity. The net proceeds from this offering were used to acquire the Weston Group from The Roxboro Group PLC for U.K. £55.0 million in cash (approximately $94.6 million based on the closing exchange rate and including acquisition costs) and for general corporate purposes, including the repayment of debt and possible future acquisitions. The Senior Subordinated Notes are general unsecured obligations of the Company and are subordinated to all existing and future senior debt of the Company. In addition, the Senior Subordinated Notes are effectively subordinated to all existing and future senior debt and other liabilities (including trade payables) of the Company’s foreign subsidiaries. The Senior Subordinated Notes are guaranteed, jointly and severally, by all the existing and future domestic subsidiar-ies of the Company unless designated as an “unrestricted subsidiary” under the indenture covering the Senior Subordinated Notes. The Senior Subordinated Notes are subject to redemption at the option of the Company, in whole or in part, on or after June 28, 2008 at redemption prices starting at 103.875% of the principal amount plus accrued interest during the period beginning June 28, 2003 and declining annually to 100% of principal and accrued interest on June 15, 2011. Any time prior to June 15, 2006, the Company may redeem up to 35% of the aggregate principal amount of the Senior Subordinated Notes with the proceeds of one or more public equity offerings at a redemption price of 107.75% of the principal amount plus accrued interest.
In September 2003, the Company entered into an interest rate swap agreement on $75.0 million of its Senior Subordinated Notes due in 2013. The swap agreement exchanged the fixed interest rate for a variable interest rate on $75.0 million of the $175.0 million principal amount outstanding. The variable interest rate is based upon LIBOR plus 2.56% and was 4.87% at October 29, 2004. The fair market value of the Company’s interest rate swap was a $1,769,000 asset at October 29, 2004 and was estimated by discounting expected cash flows using quoted market interest rates.
56. | 57.Notes to Consolidated Financial Statements
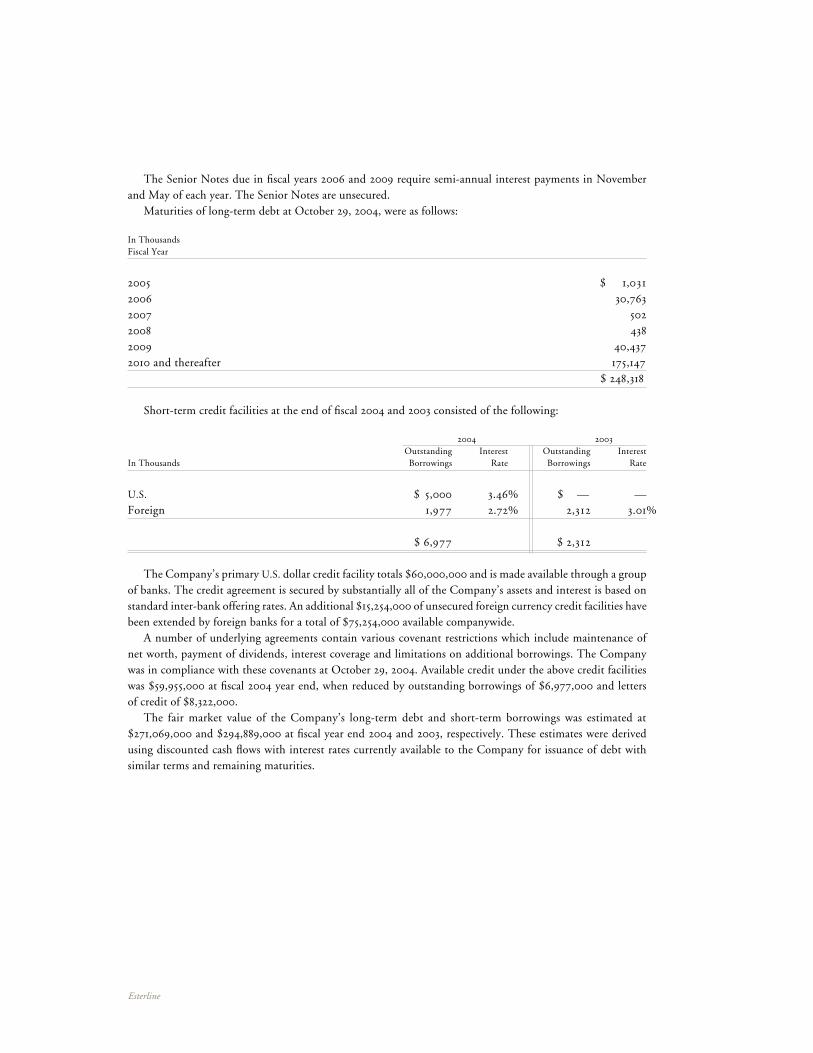
Esterline
The Senior Notes due in fiscal years 2006 and 2009 require semi-annual interest payments in November and May of each year. The Senior Notes are unsecured.
Maturities of long-term debt at October 29, 2004, were as follows:
In ThousandsFiscal Year
2005 $ 1,0312006 30,7632007 5022008 4382009 40,4372010 and thereafter 175,147 $ 248,318
Short-term credit facilities at the end of fiscal 2004 and 2003 consisted of the following:
2004 2003 Outstanding Interest Outstanding InterestIn Thousands Borrowings Rate Borrowings Rate
U.S. $ 5,000 3.46% $ — —Foreign 1,977 2.72% 2,312 3.01%
$ 6,977 $ 2,312
The Company’s primary U.S. dollar credit facility totals $60,000,000 and is made available through a group of banks. The credit agreement is secured by substantially all of the Company’s assets and interest is based on standard inter-bank offering rates. An additional $15,254,000 of unsecured foreign currency credit facilities have been extended by foreign banks for a total of $75,254,000 available companywide.
A number of underlying agreements contain various covenant restrictions which include maintenance of net worth, payment of dividends, interest coverage and limitations on additional borrowings. The Company was in compliance with these covenants at October 29, 2004. Available credit under the above credit facilities was $59,955,000 at fiscal 2004 year end, when reduced by outstanding borrowings of $6,977,000 and letters of credit of $8,322,000.
The fair market value of the Company’s long-term debt and short-term borrowings was estimated at $271,069,000 and $294,889,000 at fiscal year end 2004 and 2003, respectively. These estimates were derived using discounted cash flows with interest rates currently available to the Company for issuance of debt with similar terms and remaining maturities.
58. | 59.Notes to Consolidated Financial Statements
12. Commitments and Contingencies
Rental expense for operating leases totaled $9,482,000, $7,961,000 and $6,493,000 in fiscal years 2004, 2003 and 2002, respectively.
At October 29, 2004, the Company’s rental commitments for noncancelable operating leases with a duration in excess of one year were as follows:
In ThousandsFiscal Year
2005 $ 8,9452006 8,50 52007 7,5 5 82008 6,1 3 72009 5,4442010 and thereafter 17,406 $ 53,995
The Company is a party to various lawsuits and claims, both as plaintiff and defendant, and has contingent liabilities arising from the conduct of business, none of which, in the opinion of management, is expected to have a material effect on the Company’s financial position or results of operations. The Company believes that it has made appropriate and adequate provisions for contingent liabilities.
Approximately 670 U.S.-based employees or 17% of total U.S.-based employees were represented by various labor unions. In October 2004, a collective bargaining agreement covering about 250 employees expired and a successor agreement was reached with the labor union. Additionally, a collective bargaining agreement covering about 100 employees is currently being negotiated, and a third agreement covering about 100 employees will expire in April 2005. Management believes that the Company has established a good relationship with these employees and their union. The Company’s European operations are subject to national trade union agreements and to local regulations governing employment.
13. Employee Stock Plans
In March 2002, the Company’s shareholders approved the establishment of an Employee Stock Purchase Plan (ESPP) under which 300,000 shares of the Company’s common stock are reserved for issuance to employees. The plan qualifies as a noncompensatory employee stock purchase plan under Section 423 of the Internal Rev-enue Code. Employees are eligible to participate through payroll deductions subject to certain limitations.
At the end of each offering period, usually six months, shares are purchased by the participants at 85% of the lower of the fair market value on the first day of the offering period or the purchase date. During fiscal 2004, employees purchased 58,861 shares at a fair market value price of $22.23 per share, leaving a balance of 186,187 shares available for issuance in the future. As of October 29, 2004, deductions aggregating $553,724 were accrued for the purchase of shares on December 15, 2004.
The Company also provides a nonqualified stock option plan for officers and key employees. At the end of fiscal 2004, the Company had 2,013,250 shares reserved for issuance to officers and key employees, of which 575,250 shares were available to be granted in the future.
The Board of Directors authorized the Compensation Committee to administer option grants and their terms. Awards under the 2004 plan may be granted to eligible employees of the Company over the 10-year period ending March 3, 2014. Options granted become exercisable over a period of four years following the date of grant and expire on the tenth anniversary of the grant. Option exercise prices are equal to the fair market value of the Company’s common stock on the date of grant.
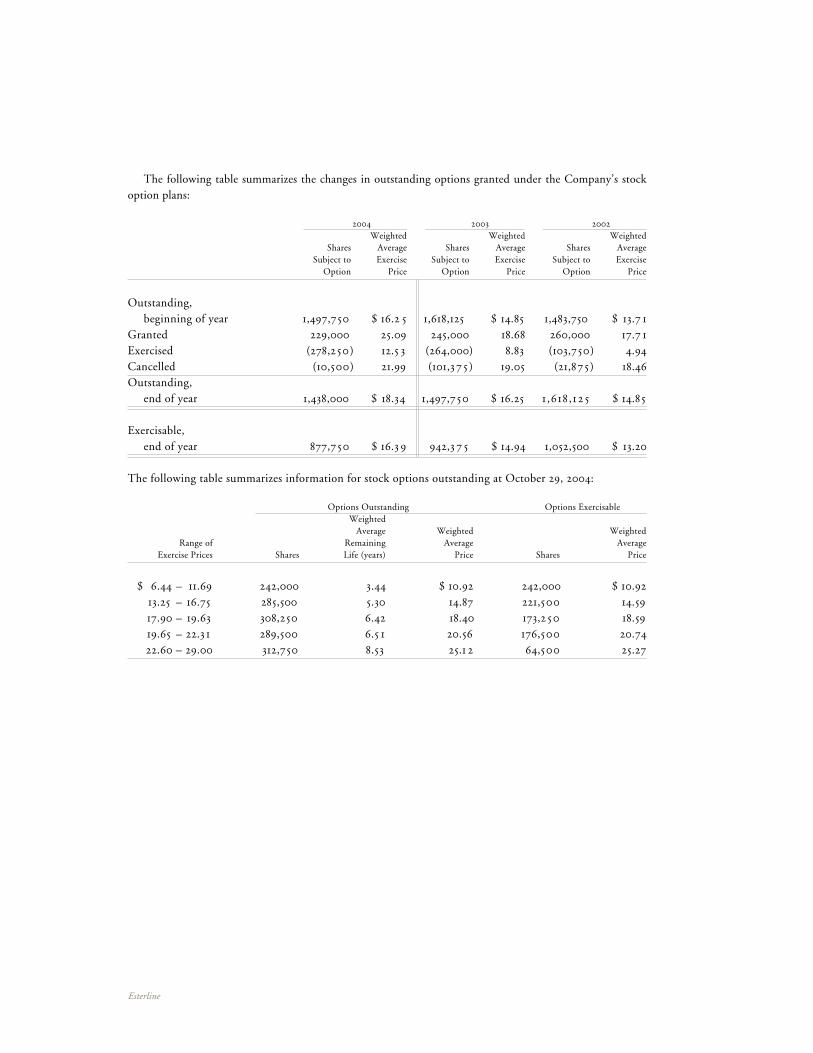
Esterline
The following table summarizes the changes in outstanding options granted under the Company’s stock option plans:
2004 2003 2002 Weighted Weighted Weighted Shares Average Shares Average Shares Average Subject to Exercise Subject to Exercise Subject to Exercise Option Price Option Price Option Price
Outstanding, beginning of year 1,497,750 $ 16.2 5 1,618,125 $ 14.85 1,483,750 $ 13.7 1Granted 229,000 25.09 245,000 18.68 260,000 17.7 1Exercised (278,250) 12.5 3 (264,000) 8.83 (103,750) 4.94Cancelled (10,500) 21.99 (101,37 5 ) 19.05 (21,875) 18.46Outstanding, end of year 1,438,000 $ 18.34 1,497,750 $ 16.25 1,618,1 2 5 $ 14.85
Exercisable, end of year 877,750 $ 16.3 9 942,3 7 5 $ 14.94 1,052,500 $ 13.20
The following table summarizes information for stock options outstanding at October 29, 2004:
Options Outstanding Options Exercisable Weighted Average Weighted Weighted Range of Remaining Average Average Exercise Prices Shares Life (years) Price Shares Price
$ 6.44 – 11.69 242,000 3.44 $ 10.92 242,000 $ 10.92 13.25 – 16.75 285,500 5.30 14.87 221,500 14.59 17.90 – 19.63 308,250 6.42 18.40 173,2 50 18.59 19.65 – 22.3 1 289,500 6.5 1 20.56 176,500 20.74 22.60 – 29.00 312,750 8.53 25.1 2 64,500 25.27
14. Capital Stock
The authorized capital stock of the Company consists of 25,000 shares of preferred stock ($100 par value), 475,000 shares of serial preferred stock ($1.00 par value), each issuable in series, and 60,000,000 shares of common stock ($.20 par value). At the end of fiscal 2004, there were no shares of preferred stock or serial preferred stock outstanding.
On November 24, 2004 the Company completed a public offering of 3.7 million shares of common stock, including shares sold under the underwriters’ over-allotment option, priced at $31.25 per share, generating net proceeds of approximately $109 million, of which $5.0 million was used to pay off existing credit facilities. The funds provide additional financial resources for acquisitions and general corporate purposes.
Effective December 5, 2002, the Board of Directors adopted a Shareholder Rights Plan, providing for the distribution of one Series B Serial Preferred Stock Purchase Right (Right) for each share of common stock held as of December 23, 2002. Each Right entitles the holder to purchase one one-hundredth of a share of Series B Serial Preferred Stock at an exercise price of $161.00, as may be adjusted from time to time.
The Right to purchase shares of Series B Serial Preferred Stock is triggered once a person or entity (together with such person’s or entity’s affiliates) beneficially owns 15% or more of the outstanding shares of common stock of the Company (such person or entity, an Acquiring Person). When the Right is triggered, the holder may purchase one one-hundredth of a share of Series B Serial Preferred Stock at an exercise price of $161.00 per share. If after the Rights are triggered, (i) the Company is the surviving corporation in a merger or similar trans-action with an Acquiring Person, (ii) the Acquiring Person beneficially owns more than 15% of the outstanding shares of common stock or (iii) the Acquiring Person engages in other “self-dealing” transactions, holders of the Rights can elect to purchase shares of common stock of the Company with a market value of twice the exercise price. Similarly, if after the Rights are triggered, the Company is not the surviving corporation of a merger or similar transaction or the Company sells 50% or more of its assets to another person or entity, holders of the Rights may elect to purchase shares of common stock of the surviving corporation or that person or entity who purchased the Company’s assets with a market value of twice the exercise price.
15. Acquisitions and Divestitures
AcquisitionsOn August 27, 2004, the Company acquired all of the outstanding capital stock of Leach Holding Corporation (Leach), a $119 million (sales) manufacturer of electrical power switching, control and data communication devices for the aerospace industry for approximately $145.0 million (approximately $147.0 million including acquisition costs) before an adjustment for the change in working capital from December 31, 2003 to closing, pursuant to an Agreement and Plan of Merger dated as of July 8, 2004 (Agreement). Leach also manufactures medical diagnostic, therapeutic and patient monitoring devices, and analytical, optical and biosensor instru-ments for medical, laboratory and industrial applications. The acquisition was funded with available cash and a draw on the Company’s credit facility.
An escrow account for $12.5 million was established under the Agreement, which is payable to the shareholders of Leach, subject to certain Leach shareholder indemnifications. The acquisition expands the Company’s ca-pabilities in providing solutions to its customers’ power distribution and diagnostic monitoring requirements.
The aerospace business is included in the Sensors & Systems segment and the medical business is included in the Avionics & Controls segment.
The following summarizes the estimated fair market value of the assets acquired and liabilities assumed at the date of acquisition. The allocation of the purchase price was based upon a preliminary valuation report and accordingly, the allocation is subject to refinement. The amount allocated to goodwill is not expected to be deductible for income tax purposes.
60. | 61.Notes to Consolidated Financial Statements
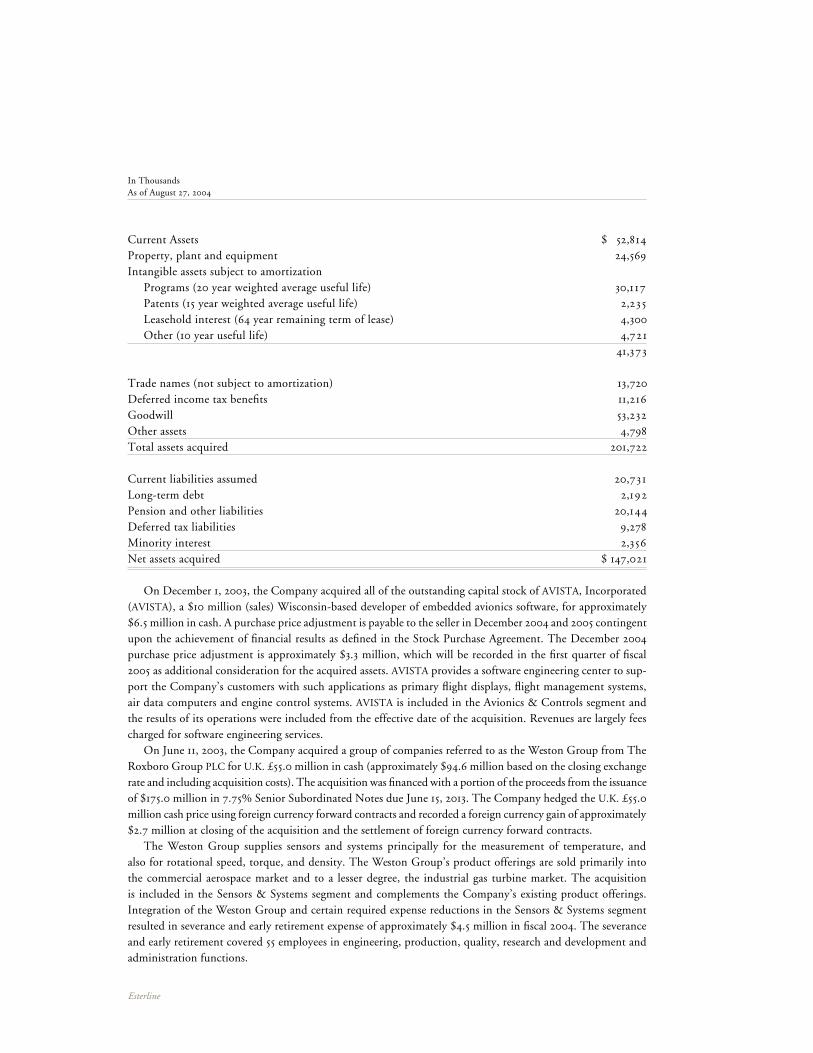
Esterline
In ThousandsAs of August 27, 2004
Current Assets $ 52,814Property, plant and equipment 24,569Intangible assets subject to amortization Programs (20 year weighted average useful life) 30,117 Patents (15 year weighted average useful life) 2,235 Leasehold interest (64 year remaining term of lease) 4,300 Other (10 year useful life) 4,721 41,373
Trade names (not subject to amortization) 13,720Deferred income tax benefits 11,216Goodwill 53,232Other assets 4,798Total assets acquired 201,722
Current liabilities assumed 20,731Long-term debt 2,192Pension and other liabilities 20,144Deferred tax liabilities 9,278Minority interest 2,356Net assets acquired $ 147,021
On December 1, 2003, the Company acquired all of the outstanding capital stock of AVISTA, Incorporated (AVISTA), a $10 million (sales) Wisconsin-based developer of embedded avionics software, for approximately $6.5 million in cash. A purchase price adjustment is payable to the seller in December 2004 and 2005 contingent upon the achievement of financial results as defined in the Stock Purchase Agreement. The December 2004 purchase price adjustment is approximately $3.3 million, which will be recorded in the first quarter of fiscal 2005 as additional consideration for the acquired assets. AVISTA provides a software engineering center to sup-port the Company’s customers with such applications as primary flight displays, flight management systems, air data computers and engine control systems. AVISTA is included in the Avionics & Controls segment and the results of its operations were included from the effective date of the acquisition. Revenues are largely fees charged for software engineering services.
On June 11, 2003, the Company acquired a group of companies referred to as the Weston Group from The Roxboro Group PLC for U.K. £55.0 million in cash (approximately $94.6 million based on the closing exchange rate and including acquisition costs). The acquisition was financed with a portion of the proceeds from the issuance of $175.0 million in 7.75% Senior Subordinated Notes due June 15, 2013. The Company hedged the U.K. £55.0 million cash price using foreign currency forward contracts and recorded a foreign currency gain of approximately $2.7 million at closing of the acquisition and the settlement of foreign currency forward contracts.
The Weston Group supplies sensors and systems principally for the measurement of temperature, and also for rotational speed, torque, and density. The Weston Group’s product offerings are sold primarily into the commercial aerospace market and to a lesser degree, the industrial gas turbine market. The acquisition is included in the Sensors & Systems segment and complements the Company’s existing product offerings. Integration of the Weston Group and certain required expense reductions in the Sensors & Systems segment resulted in severance and early retirement expense of approximately $4.5 million in fiscal 2004. The severance and early retirement covered 55 employees in engineering, production, quality, research and development and administration functions.
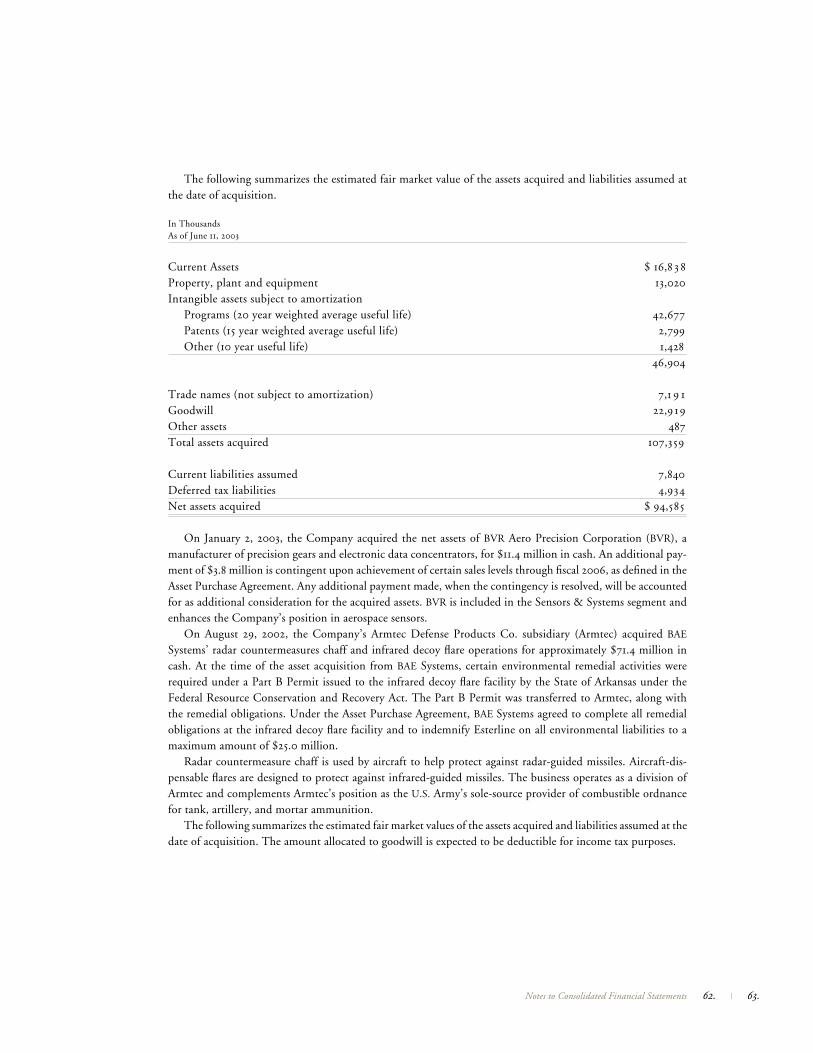
The following summarizes the estimated fair market value of the assets acquired and liabilities assumed at the date of acquisition.
In ThousandsAs of June 11, 2003
Current Assets $ 16,8 3 8Property, plant and equipment 13,020Intangible assets subject to amortization Programs (20 year weighted average useful life) 42,677 Patents (15 year weighted average useful life) 2,799 Other (10 year useful life) 1,428 46,904
Trade names (not subject to amortization) 7,1 9 1Goodwill 22,9 19Other assets 487Total assets acquired 107,359
Current liabilities assumed 7,840Deferred tax liabilities 4,934Net assets acquired $ 94,585
On January 2, 2003, the Company acquired the net assets of BVR Aero Precision Corporation (BVR), a manufacturer of precision gears and electronic data concentrators, for $11.4 million in cash. An additional pay-ment of $3.8 million is contingent upon achievement of certain sales levels through fiscal 2006, as defined in the Asset Purchase Agreement. Any additional payment made, when the contingency is resolved, will be accounted for as additional consideration for the acquired assets. BVR is included in the Sensors & Systems segment and enhances the Company’s position in aerospace sensors.
On August 29, 2002, the Company’s Armtec Defense Products Co. subsidiary (Armtec) acquired BAE Systems’ radar countermeasures chaff and infrared decoy flare operations for approximately $71.4 million in cash. At the time of the asset acquisition from BAE Systems, certain environmental remedial activities were required under a Part B Permit issued to the infrared decoy flare facility by the State of Arkansas under the Federal Resource Conservation and Recovery Act. The Part B Permit was transferred to Armtec, along with the remedial obligations. Under the Asset Purchase Agreement, BAE Systems agreed to complete all remedial obligations at the infrared decoy flare facility and to indemnify Esterline on all environmental liabilities to a maximum amount of $25.0 million.
Radar countermeasure chaff is used by aircraft to help protect against radar-guided missiles. Aircraft-dis-pensable flares are designed to protect against infrared-guided missiles. The business operates as a division of Armtec and complements Armtec’s position as the U.S. Army’s sole-source provider of combustible ordnance for tank, artillery, and mortar ammunition.
The following summarizes the estimated fair market values of the assets acquired and liabilities assumed at the date of acquisition. The amount allocated to goodwill is expected to be deductible for income tax purposes.
62. | 63.Notes to Consolidated Financial Statements
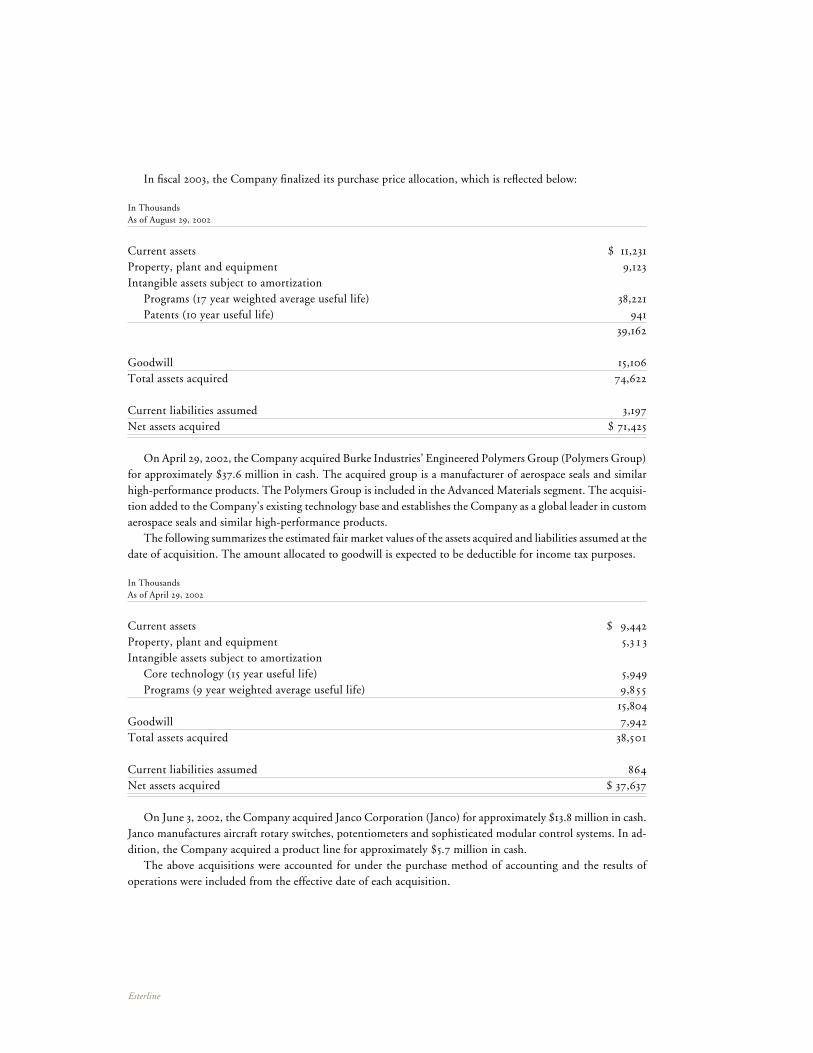
Esterline
In fiscal 2003, the Company finalized its purchase price allocation, which is reflected below:
In ThousandsAs of August 29, 2002
Current assets $ 11,231Property, plant and equipment 9,123Intangible assets subject to amortization Programs (17 year weighted average useful life) 38,221 Patents (10 year useful life) 941 39,162
Goodwill 15,106Total assets acquired 74,622
Current liabilities assumed 3,197Net assets acquired $ 71,425
On April 29, 2002, the Company acquired Burke Industries’ Engineered Polymers Group (Polymers Group) for approximately $37.6 million in cash. The acquired group is a manufacturer of aerospace seals and similar high-performance products. The Polymers Group is included in the Advanced Materials segment. The acquisi-tion added to the Company’s existing technology base and establishes the Company as a global leader in custom aerospace seals and similar high-performance products.
The following summarizes the estimated fair market values of the assets acquired and liabilities assumed at the date of acquisition. The amount allocated to goodwill is expected to be deductible for income tax purposes.
In ThousandsAs of April 29, 2002
Current assets $ 9,442Property, plant and equipment 5,3 1 3Intangible assets subject to amortization Core technology (15 year useful life) 5,949 Programs (9 year weighted average useful life) 9,855 15,804Goodwill 7,942Total assets acquired 38,501
Current liabilities assumed 864Net assets acquired $ 37,637
On June 3, 2002, the Company acquired Janco Corporation (Janco) for approximately $13.8 million in cash. Janco manufactures aircraft rotary switches, potentiometers and sophisticated modular control systems. In ad-dition, the Company acquired a product line for approximately $5.7 million in cash.
The above acquisitions were accounted for under the purchase method of accounting and the results of operations were included from the effective date of each acquisition.
DivestituresDuring the fourth quarter of fiscal 2004, the Company sold a product line in its Sensors & Systems segment and recorded a gain of $3.4 million. In the second quarter of fiscal 2003, the Company sold a product line in its Sensors & Systems segment and reported a net loss on sale of $66,000.
16. Business Segment Information
In the third quarter of fiscal 2002, the Company’s Board of Directors approved a plan providing for the dis-continuation of the Automation segment. Subsequent to that decision, management redefined the Company’s segments to correspond with the way the Company is now organized and managed. Accordingly, business seg-ment information includes the segments of Avionics & Controls, Sensors & Systems and Advanced Materials. Operations within the Avionics & Controls segment focus on technology interface systems for commercial and military aircraft, and similar devices for land- and sea-based military vehicles, secure communications systems, specialized medical equipment and other industrial applications. Sensors & Systems includes opera-tions that produce high-precision temperature and pressure sensors, electrical power switching, control and data communication devices, fluid and motion control components and other related systems principally for aerospace and defense customers. The Advanced Materials segment focuses on high-performance elastomer products used in a wide range of commercial aerospace and military applications, and combustible ordnance and electronic warfare countermeasure devices. Sales in all segments include domestic, international, defense and commercial customers.
Geographic sales information is based on product origin. The Company evaluates these segments based on seg-ment profits prior to net interest, other income/expense, corporate expenses and federal/foreign income taxes.
64. | 65.Notes to Consolidated Financial Statements
Esterline
Details of the Company’s operations by business segment for the last three fiscal years were as follows:
In Thousands 2004 2003 2002
SalesAvionics & Controls $ 209,498 $ 198,249 $ 171,709Sensors & Systems 194,803 146,976 104,942Advanced Materials 223,344 216,655 157,384Other 524 574 774 $ 628,169 $ 562,454 $ 434,809
Income From Continuing OperationsAvionics & Controls $ 33,079 $ 29,798 $ 26,50 1Sensors & Systems 10,621 10,090 12,3 52Advanced Materials 29,497 29,120 21,884Other (573) (821) (1,420) Segment Earnings 72,624 68,1 87 59,3 17Corporate expense (16,471) (16,879) (12,263)Gain (loss) on sale of product line 3,943 (66) —Gain (loss) on derivative financial instruments — 2,676 (1)Interest income 1,964 868 1,8 14Interest expense (17,339) (11,995) (7,122) $ 44,721 $ 42,791 $ 41,745
Identifiable AssetsAvionics & Controls $ 198,142 $ 144,492 $ 145,296Sensors & Systems 374,1 2 3 219,247 98,624Advanced Materials 267,8 1 1 262,001 257,408Other 2 2 2Discontinued operations — — 13,576Corporate (1) 92,7 5 5 174,888 56,049 $ 932,8 3 3 $ 800,630 $ 570,955
Capital ExpendituresAvionics & Controls $ 6,483 $ 2,744 $ 1,980Sensors & Systems 3,600 3,232 4,4 32Advanced Materials 11,492 8,857 8,497Other — — —Discontinued operations 61 62 580Corporate 490 2,235 220 $ 22,126 $ 17,130 $ 15,709
Depreciation and AmortizationAvionics & Controls $ 5,5 2 5 $ 4,964 $ 4,060Sensors & Systems 10,954 6,449 3,08 3Advanced Materials 12,394 11,982 7,1 5 6Other — — 4Discontinued operations 835 1,789 2,726Corporate 1,437 1,0 3 1 534 $ 31,1 4 5 $ 26,2 1 5 $ 17,56 3
(1) Primarily cash, prepaid pension expense (see Note 9) and deferred tax assets (see Note 10).
The Company’s operations by geographic area for the last three fiscal years were as follows:
In Thousands 2004 2003 2002
SalesDomesticUnaffiliated customers – U.S. $ 383,5 6 1 $ 377,947 $ 294,693Unaffiliated customers – export 88,989 62,077 51,044Intercompany 3,549 1,720 1,8 16 476,099 441,744 347,5 5 3
FranceUnaffiliated customers 58,788 54,857 54,944Intercompany 5,050 3,1 8 2 3,652 63,8 38 58,039 58,596
United KingdomUnaffiliated customers 90,5 3 1 61,998 20,3 5 4Intercompany 2,406 65 — 92,937 62,063 20,3 5 4 All Other ForeignUnaffiliated customers 6,300 5,5 7 5 13,774Intercompany 938 1,280 417 7,2 38 6,8 5 5 14,1 9 1
Eliminations (11,943) (6,247) (5,885) $ 628,169 $ 562,454 $ 434,809
Segment Earnings (1)
Domestic $ 66,680 $ 61,271 $ 49,120France 772 4,716 7,608United Kingdom 4,998 2,898 2,028All other foreign 174 (698) 561 $ 72,624 $ 68,187 $ 59,3 1 7
Identifiable Assets (2)
Domestic $ 432,36 5 $ 448,780 $ 420,895France 197,4 3 1 42,828 46,683United Kingdom 202,4 1 1 133,309 35,5 8 3All other foreign 7,8 7 1 825 11,745 $ 840,078 $ 625,742 $ 514,906
(1) Before corporate expense, shown on page 66.(2) Excludes corporate, shown on page 66.
66. | 67.Notes to Consolidated Financial Statements
Esterline
The Company’s principal foreign operations consist of manufacturing facilities located in France, Germany and the United Kingdom, and include sales and service operations located in Singapore and China. Sensors & Systems segment operations are dependent upon foreign sales, which represented $144.3 million, $117.0 million and $87.8 million of Sensors & Systems sales in fiscal 2004, 2003 and 2002, respectively. Intercompany sales are at prices comparable with sales to unaffiliated customers. U.S. Government sales as a percent of Advanced Materi-als and Avionics & Controls sales were 35.9% and 9.4%, respectively, in fiscal 2004 and 16.6% of consolidated sales. In fiscal 2003, U.S. Government sales as a percent of Advanced Materials and Avionics & Controls sales were 36.1% and 7.4%, respectively, and 16.8% of consolidated sales.
Product lines contributing sales of 10% or more of total sales in any of the last three fiscal years were as follows:
2004 2003 2002
Elastomeric products 16% 18% 20%Sensors 21% 16% 16%Aerospace switches and indicators 13% 15% 17%Combustible ordnance components 8% 10% 11%
17. Quarterly Financial Data (Unaudited)
The following is a summary of unaudited quarterly financial information:
In Thousands, Except Per Share AmountsFiscal Year 2004 Fourth Third Second First
Net sales $ 194,763 $ 150,614 $ 150,194 $ 132,598Gross margin 64,106 47,145 50,304 40,002
Income from continuing operations 15,233 (1) 7,023 9,240 1,878 (2)
Income from discontinued operations, net of tax 7,883 626 672 —Net earnings $ 23,116 (1) $ 7,649 $ 9,912 $ 1,878 (2)
Earnings per share – basic Continuing operations $ .7 1 $ .3 3 $ .44 $ .09 Discontinued operations (3) .3 7 .03 .03 —Earnings per share – basic (3) $ 1.08 $ .36 $ .47 $ .09
Earnings per share – diluted Continuing operations (3) $ .70 $ .33 $ .43 $ .09 Discontinued operations (3) .3 7 .03 .03 —Earnings per share – diluted (3) $ 1.07 $ .36 $ .46 $ .09
In Thousands, Except Per Share AmountsFiscal Year 2003 Fourth Third Second First
Net sales $ 160,326 $ 140,5 1 8 $ 135,2 8 1 $ 126,329Gross margin 53,680 45,706 40,570 38,673Income from continuing operations 9,412 8,444 (4) 6,042 (5) 5,843Loss from discontinued operations, net of tax — — (5,808) —Net earnings $ 9,412 $ 8,444 (4) $ 234 (5) $ 5,843
Earnings per share – basic Continuing operations $ .45 $ .40 $ .29 $ .28 Discontinued operations (3) — — (.28) —Earnings per share – basic (3) $ .45 $ .40 $ .01 $ .28
Earnings per share – diluted Continuing operations (3) $ .44 $ .40 $ .29 $ .28 Discontinued operations (3) — — (.28) —Earnings per share – diluted (3) $ .44 $ .40 $ .01 $ .28
(1) Included a $3.4 million gain on the sale of a product line in the Sensors & Systems segment.(2) Included $4.5 million in legal, severance and early retirement expense in the Sensors & Systems segment. Included a $1.9 million reduc-
tion of previously estimated tax liabilities associated with the receipt of a NOPA from the Internal Revenue Service.(3) The sum of the quarterly per share amounts may not equal per share amounts reported for year-to-date periods. This is due to changes
in the number of weighted average shares outstanding and the effects of rounding for each period.(4) Included the $2.7 million foreign currency gain recorded upon settlement of foreign currency forward contracts used to hedge the U.K.
£55.0 million cash price for the Weston Group. Included $929,000 in severance incurred in connection with the closing of facilities and termination of affected employees of a product line in the Sensors & Systems segment.
(5) Included an $863,000 gain on the sale of a product line in the Sensors & Systems segment.
18. Guarantors
The following schedules set forth condensed consolidating financial information as required by Rule 3-10 of Securities and Exchange Commission Regulation S-X for fiscal 2004, 2003 and 2002 for (a) Esterline Technologies Corporation (the Parent); (b) on a combined basis, the subsidiary guarantors (Guarantor Subsidiaries) of the Senior Subordinated Notes which include Advanced Input Devices, Inc., Amtech Automated Manufacturing Technology, Angus Electronics Co., Armtec Countermeasures Co., Armtec Defense Products Co., Auxitrol Co., AVISTA, Incorporated, Boyar-Schultz Corporation, BVR Technologies Co., Equipment Sales Co., EA Technologies Corporation, Esterline Technologies Holdings Limited, Fluid Regulators Corporation, H.A. Sales Co., Hauser Inc., Hytek Finishes Co., Janco Corporation, Kirkhill-TA Co., Korry Electronics Co., Leach Holding Corporation, Leach International Corporation, Leach Technology Group, Inc., Mason Electric Co., MC Tech Co., Memtron Technologies Co., Norwich Aero Products, Inc., Pressure Systems, Inc., Pressure Systems International, Inc., SureSeal Corporation, Surftech Finishes Co., UMM Electronics Inc., and (c) on a combined basis, the subsidiary non-guarantors (Non-Guarantor Subsidiaries), which include Auxitrol S.A., Auxitrol Technologies S.A., Auxitrol Asia PTE Ltd., Esterline Technologies DK Aps (Denmark), Esterline Technologies Ltd. (England), Esterline Technologies Ltd. (Hong Kong), Excellon Europa GmbH, Excellon France S.A.R.L., Guizhou Leach-Tianyi Aviation Electrical Company Ltd. (China), Leach International Asia-Pacific Ltd. (Hong Kong), Leach International Europe S.A. (France), Leach International Germany GmbH (Germany), Leach International Mexico S. de R.L. de C.V. (Mexico), Leach International U.K. (England), LRE Technologies Partner GmbH (Germany), Muirhead Aerospace Ltd., Norcroft Dynamics Ltd., Pressure Systems International Ltd., Weston Aero Ltd. (England), and Weston Aerospace, Ltd. (England). The guar-antor subsidiaries are direct and indirect wholly-owned subsidiaries of Esterline Technologies and have fully and unconditionally, jointly and severally, guaranteed the Senior Subordinated Notes.
68. | 69.Notes to Consolidated Financial Statements
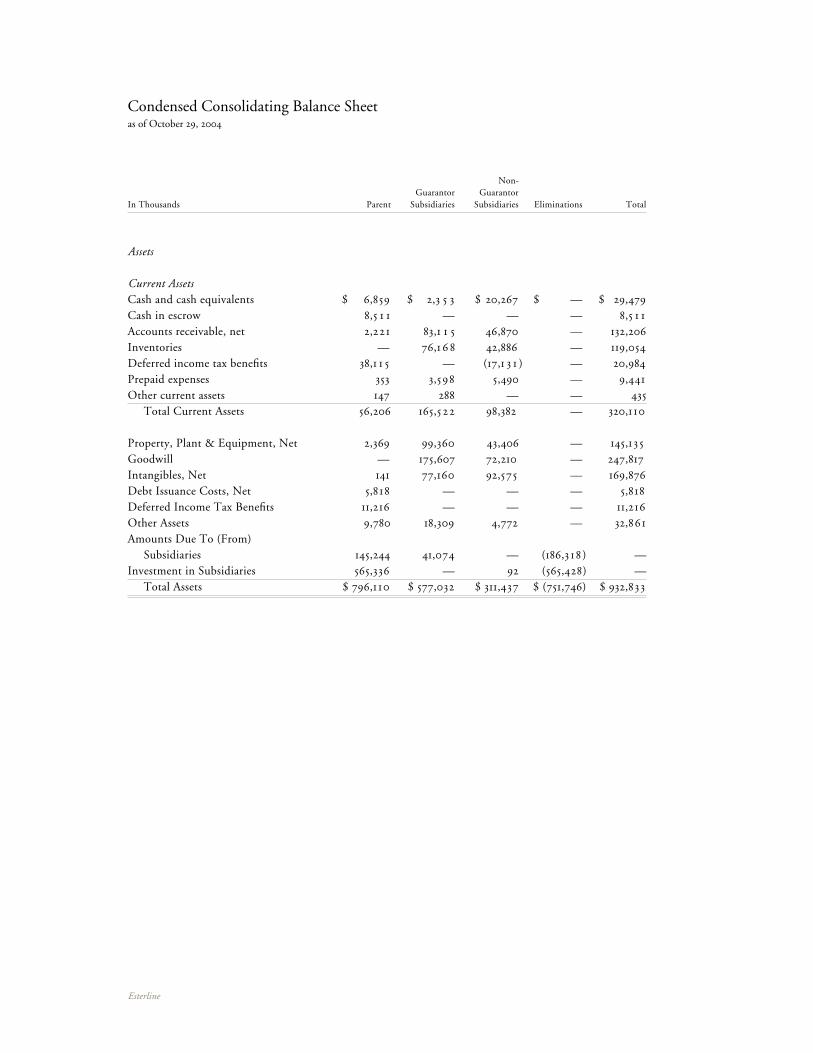
Esterline
Non- Guarantor Guarantor In Thousands Parent Subsidiaries Subsidiaries Eliminations Total
Assets
Current AssetsCash and cash equivalents $ 6,859 $ 2,3 5 3 $ 20,267 $ — $ 29,479Cash in escrow 8,5 1 1 — — — 8,5 1 1Accounts receivable, net 2,221 83,1 1 5 46,870 — 132,206Inventories — 76,1 6 8 42,886 — 119,054Deferred income tax benefits 38,1 1 5 — (17,1 3 1 ) — 20,984Prepaid expenses 353 3,598 5,490 — 9,441Other current assets 147 288 — — 435 Total Current Assets 56,206 165,5 22 98,382 — 320,110
Property, Plant & Equipment, Net 2,369 99,360 43,406 — 145,135Goodwill — 175,607 72,210 — 247,817Intangibles, Net 141 77,160 92,575 — 169,876Debt Issuance Costs, Net 5,818 — — — 5,818Deferred Income Tax Benefits 11,216 — — — 11,216Other Assets 9,780 18,309 4,772 — 32,861Amounts Due To (From) Subsidiaries 145,244 41,074 — (186,3 1 8 ) —Investment in Subsidiaries 565,336 — 92 (565,428) — Total Assets $ 796,110 $ 577,032 $ 311,437 $ (751,746) $ 932,833
Condensed Consolidating Balance Sheet as of October 29, 2004
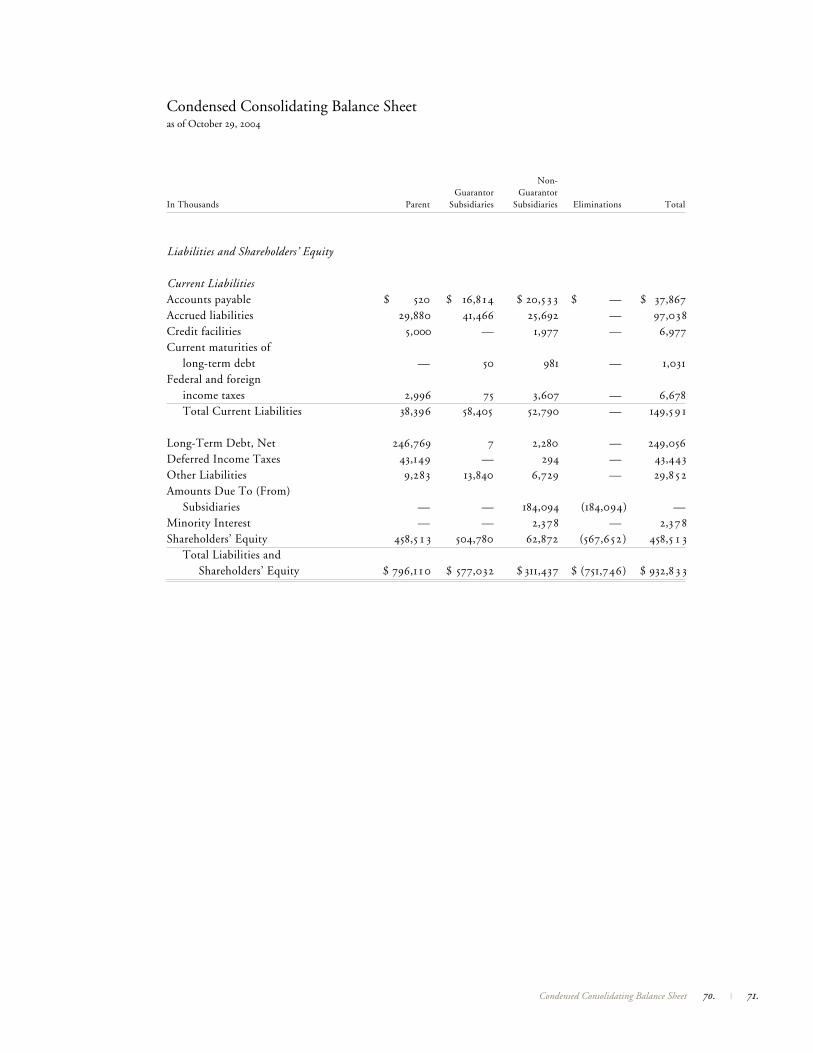
Non- Guarantor Guarantor In Thousands Parent Subsidiaries Subsidiaries Eliminations Total
Liabilities and Shareholders’ Equity
Current LiabilitiesAccounts payable $ 520 $ 16,8 14 $ 20,5 3 3 $ — $ 37,867Accrued liabilities 29,880 41,466 25,692 — 97,038Credit facilities 5,000 — 1,977 — 6,977Current maturities of long-term debt — 50 981 — 1,031Federal and foreign income taxes 2,996 75 3,607 — 6,678 Total Current Liabilities 38,396 58,405 52,790 — 149,5 9 1
Long-Term Debt, Net 246,769 7 2,280 — 249,056Deferred Income Taxes 43,149 — 294 — 43,443Other Liabilities 9,283 13,840 6,729 — 29,8 52Amounts Due To (From) Subsidiaries — — 184,094 (184,094) —Minority Interest — — 2,378 — 2,378Shareholders’ Equity 458,5 1 3 504,780 62,872 (567,652) 458,5 1 3 Total Liabilities and Shareholders’ Equity $ 796,1 1 0 $ 577,032 $ 311,437 $ (751,746) $ 932,8 3 3
Condensed Consolidating Balance Sheet as of October 29, 2004
70. | 71.Condensed Consolidating Balance Sheet
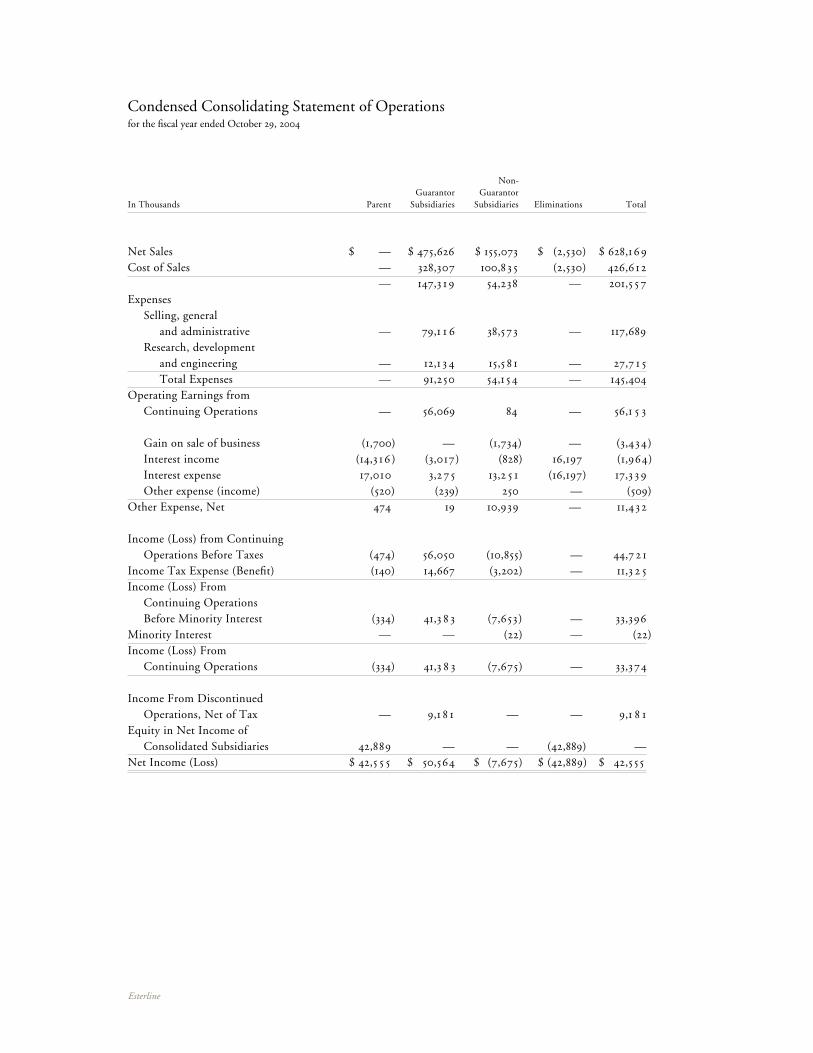
Esterline
Non- Guarantor Guarantor In Thousands Parent Subsidiaries Subsidiaries Eliminations Total
Net Sales $ — $ 475,626 $ 155,073 $ (2,530) $ 628,169Cost of Sales — 328,307 100,8 3 5 (2,530) 426,6 12 — 147,3 1 9 54,238 — 201,5 5 7Expenses Selling, general and administrative — 79,1 1 6 38,573 — 117,689 Research, development and engineering — 12,1 3 4 15,5 8 1 — 27,7 1 5 Total Expenses — 91,250 54,1 54 — 145,404Operating Earnings from Continuing Operations — 56,069 84 — 56,1 5 3
Gain on sale of business (1,700) — (1,734) — (3,434) Interest income (14,3 16 ) (3,017) (828) 16,197 (1,964) Interest expense 17,010 3,27 5 13,2 5 1 (16,197) 17,3 3 9 Other expense (income) (520) (239) 250 — (509)Other Expense, Net 474 19 10,939 — 11,4 32
Income (Loss) from Continuing Operations Before Taxes (474) 56,050 (10,855) — 44,7 2 1Income Tax Expense (Benefit) (140) 14,667 (3,202) — 11,3 2 5Income (Loss) From Continuing Operations Before Minority Interest (334) 41,3 8 3 (7,653) — 33,396Minority Interest — — (22) — (22)Income (Loss) From Continuing Operations (334) 41,3 8 3 (7,675) — 33,374
Income From Discontinued Operations, Net of Tax — 9,1 8 1 — — 9,1 8 1Equity in Net Income of Consolidated Subsidiaries 42,889 — — (42,889) —Net Income (Loss) $ 42,5 5 5 $ 50,564 $ (7,675) $ (42,889) $ 42,555
Condensed Consolidating Statement of Operations for the fiscal year ended October 29, 2004
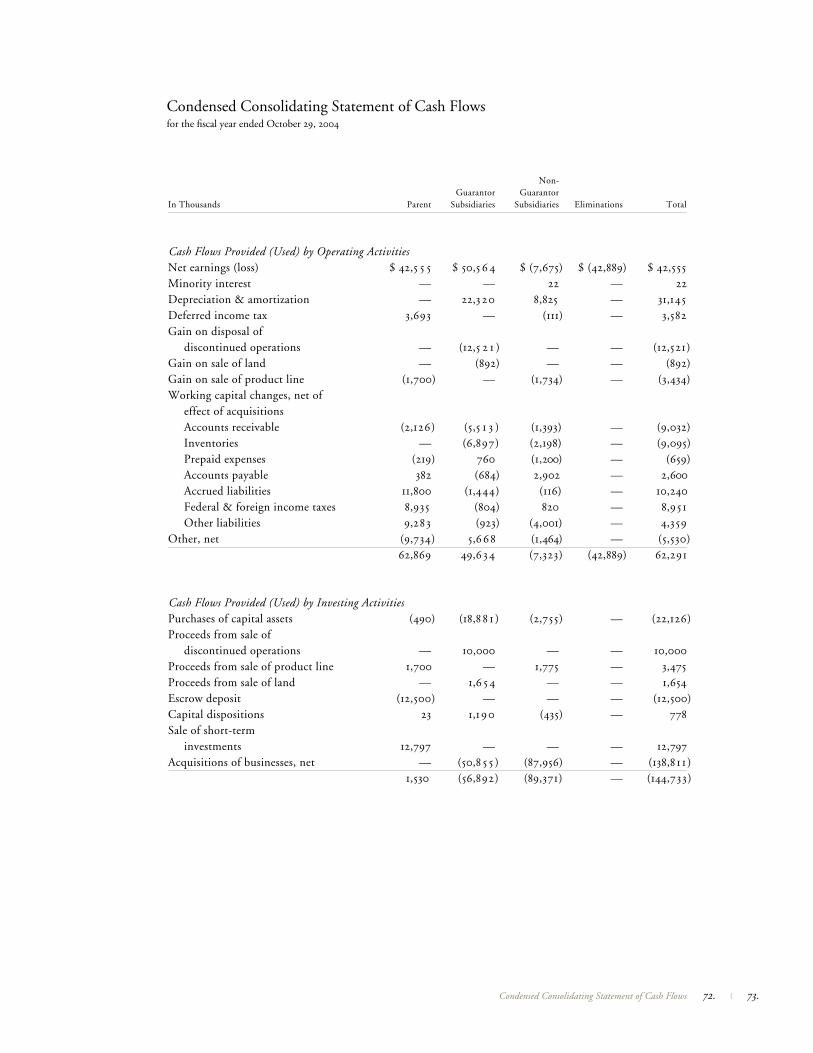
Non- Guarantor Guarantor In Thousands Parent Subsidiaries Subsidiaries Eliminations Total
Cash Flows Provided (Used) by Operating ActivitiesNet earnings (loss) $ 42,5 5 5 $ 50,5 6 4 $ (7,675) $ (42,889) $ 42,555Minority interest — — 22 — 22Depreciation & amortization — 22,320 8,825 — 31,145Deferred income tax 3,693 — (111) — 3,582Gain on disposal of discontinued operations — (12,5 2 1 ) — — (12,521)Gain on sale of land — (892) — — (892)Gain on sale of product line (1,700) — (1,734) — (3,434)Working capital changes, net of effect of acquisitions Accounts receivable (2,126) (5,5 1 3 ) (1,393) — (9,032) Inventories — (6,897) (2,198) — (9,095) Prepaid expenses (219) 760 (1,200) — (659) Accounts payable 382 (684) 2,902 — 2,600 Accrued liabilities 11,800 (1,444) (116) — 10,240 Federal & foreign income taxes 8,935 (804) 820 — 8,951 Other liabilities 9,283 (923) (4,001) — 4,359Other, net (9,734) 5,668 (1,464) — (5,530) 62,869 49,6 34 (7,323) (42,889) 62,291
Cash Flows Provided (Used) by Investing ActivitiesPurchases of capital assets (490) (18,8 8 1 ) (2,755) — (22,126)Proceeds from sale of discontinued operations — 10,000 — — 10,000Proceeds from sale of product line 1,700 — 1,775 — 3,475Proceeds from sale of land — 1,6 5 4 — — 1,654Escrow deposit (12,500) — — — (12,500)Capital dispositions 23 1,1 90 (435) — 778Sale of short-term investments 12,797 — — — 12,797Acquisitions of businesses, net — (50,8 5 5 ) (87,956) — (138,8 1 1 ) 1,530 (56,892) (89,371) — (144,733)
Condensed Consolidating Statement of Cash Flows for the fiscal year ended October 29, 2004
72. | 73.Condensed Consolidating Statement of Cash Flows
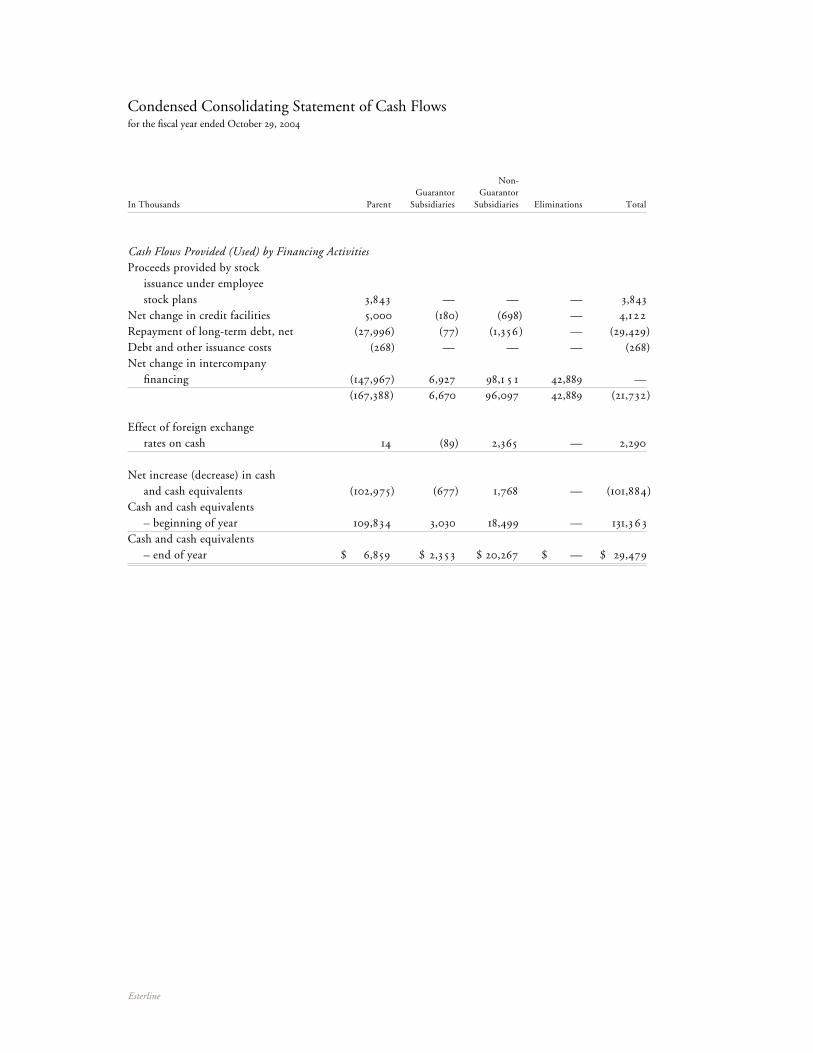
Esterline
Non- Guarantor Guarantor In Thousands Parent Subsidiaries Subsidiaries Eliminations Total
Cash Flows Provided (Used) by Financing ActivitiesProceeds provided by stock issuance under employee stock plans 3,843 — — — 3,843Net change in credit facilities 5,000 (180) (698) — 4,1 22Repayment of long-term debt, net (27,996) (77) (1,356) — (29,429)Debt and other issuance costs (268) — — — (268)Net change in intercompany financing (147,967) 6,927 98,1 5 1 42,889 — (167,388) 6,670 96,097 42,889 (21,732)
Effect of foreign exchange rates on cash 14 (89) 2,365 — 2,290
Net increase (decrease) in cash and cash equivalents (102,975) (677) 1,768 — (101,884)Cash and cash equivalents – beginning of year 109,834 3,030 18,499 — 131,3 6 3Cash and cash equivalents – end of year $ 6,859 $ 2,3 5 3 $ 20,267 $ — $ 29,479
Condensed Consolidating Statement of Cash Flows for the fiscal year ended October 29, 2004
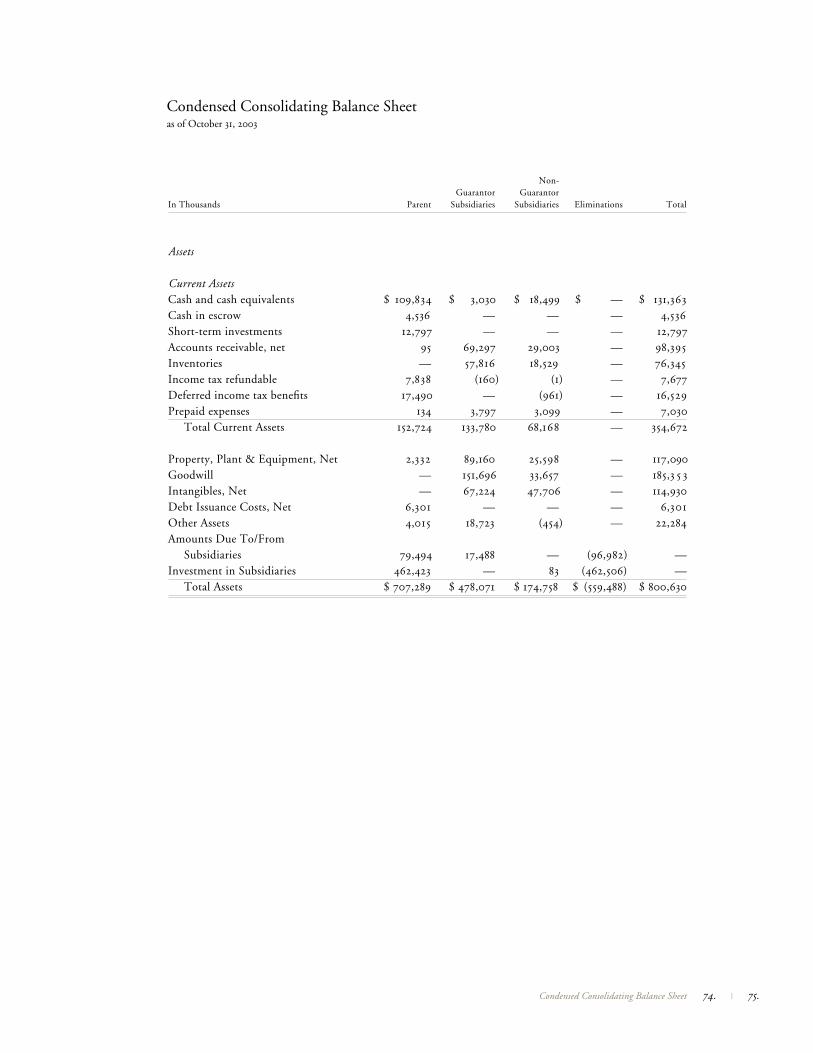
Non- Guarantor Guarantor In Thousands Parent Subsidiaries Subsidiaries Eliminations Total
Assets
Current AssetsCash and cash equivalents $ 109,834 $ 3,030 $ 18,499 $ — $ 131,363Cash in escrow 4,536 — — — 4,536Short-term investments 12,797 — — — 12,797Accounts receivable, net 95 69,297 29,003 — 98,395Inventories — 57,816 18,529 — 76,345Income tax refundable 7,838 (160) (1) — 7,677Deferred income tax benefits 17,490 — (961) — 16,529Prepaid expenses 134 3,797 3,099 — 7,030 Total Current Assets 152,724 133,780 68,168 — 354,672
Property, Plant & Equipment, Net 2,332 89,160 25,598 — 117,090Goodwill — 151,696 33,657 — 185,3 5 3Intangibles, Net — 67,224 47,706 — 114,930Debt Issuance Costs, Net 6,301 — — — 6,301Other Assets 4,015 18,723 (454) — 22,284Amounts Due To/From Subsidiaries 79,494 17,488 — (96,982) —Investment in Subsidiaries 462,423 — 83 (462,506) — Total Assets $ 707,289 $ 478,071 $ 174,758 $ (559,488) $ 800,630
Condensed Consolidating Balance Sheet as of October 31, 2003
74. | 75.Condensed Consolidating Balance Sheet
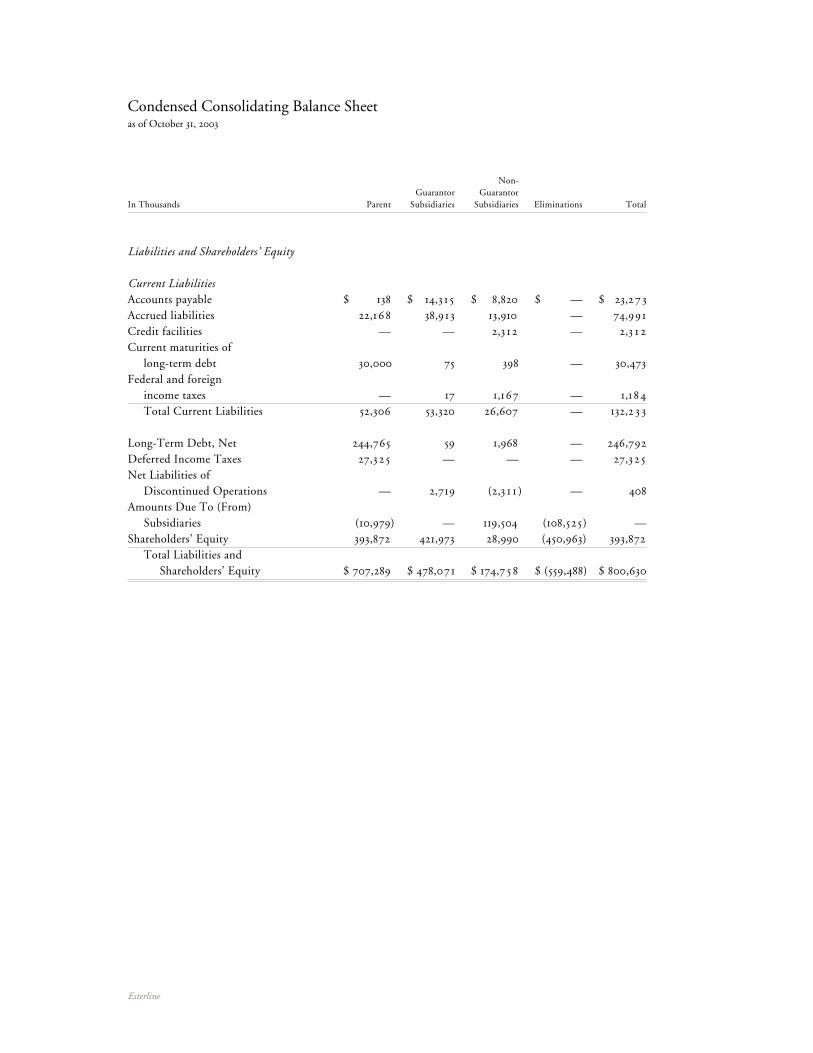
Esterline
Non- Guarantor Guarantor In Thousands Parent Subsidiaries Subsidiaries Eliminations Total
Liabilities and Shareholders’ Equity
Current LiabilitiesAccounts payable $ 138 $ 14,3 1 5 $ 8,820 $ — $ 23,273Accrued liabilities 22,168 38,913 13,910 — 74,991Credit facilities — — 2,3 1 2 — 2,3 1 2Current maturities of long-term debt 30,000 75 398 — 30,473Federal and foreign income taxes — 17 1,167 — 1,1 84 Total Current Liabilities 52,306 53,320 26,607 — 132,2 3 3
Long-Term Debt, Net 244,765 59 1,968 — 246,792Deferred Income Taxes 27,3 2 5 — — — 27,32 5Net Liabilities of Discontinued Operations — 2,719 (2,3 1 1 ) — 408Amounts Due To (From) Subsidiaries (10,979) — 119,504 (108,525) —Shareholders’ Equity 393,872 421,973 28,990 (450,963) 393,872 Total Liabilities and Shareholders’ Equity $ 707,289 $ 478,071 $ 174,7 5 8 $ (559,488) $ 800,630
Condensed Consolidating Balance Sheet as of October 31, 2003
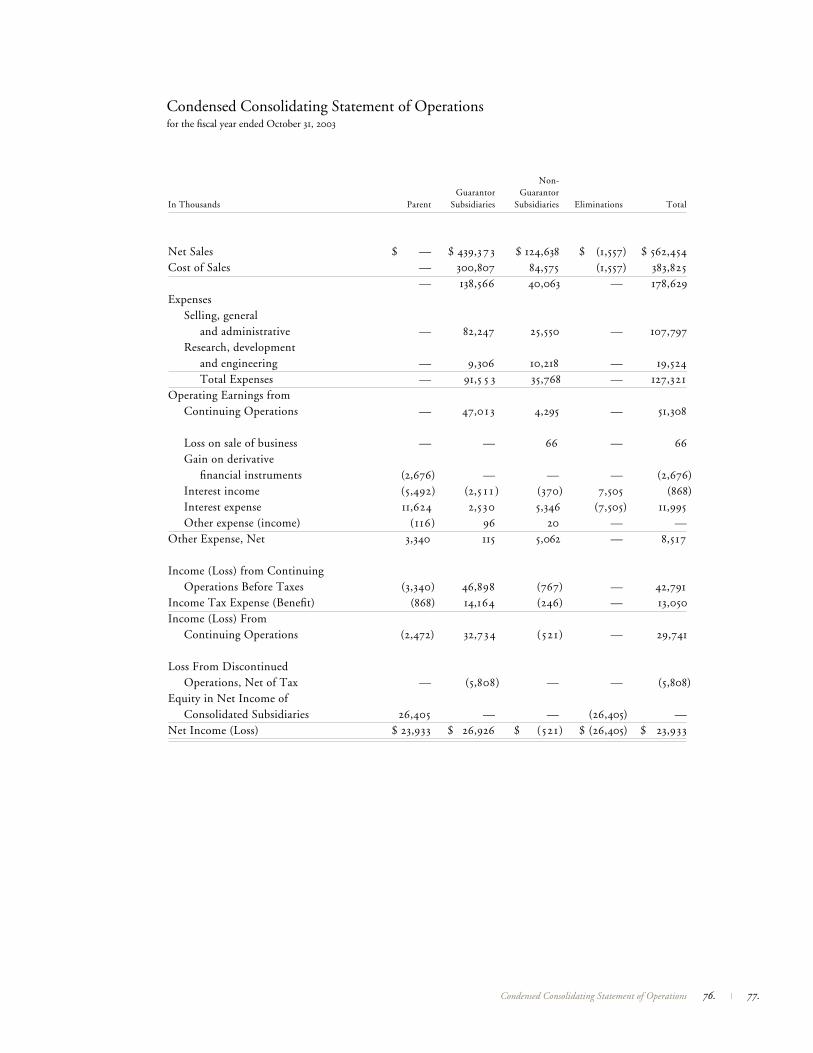
Non- Guarantor Guarantor In Thousands Parent Subsidiaries Subsidiaries Eliminations Total
Net Sales $ — $ 439,37 3 $ 124,638 $ (1,557) $ 562,454Cost of Sales — 300,807 84,575 (1,557) 383,825 — 138,566 40,063 — 178,629Expenses Selling, general and administrative — 82,247 25,550 — 107,797 Research, development and engineering — 9,306 10,218 — 19,524 Total Expenses — 91,5 5 3 35,768 — 127,321Operating Earnings from Continuing Operations — 47,0 1 3 4,295 — 51,308
Loss on sale of business — — 66 — 66 Gain on derivative financial instruments (2,676) — — — (2,676) Interest income (5,492) (2,5 1 1 ) (370) 7,505 (868) Interest expense 11,624 2,530 5,346 (7,505) 11,995 Other expense (income) (116) 96 20 — —Other Expense, Net 3,340 115 5,062 — 8,517
Income (Loss) from Continuing Operations Before Taxes (3,340) 46,898 (767) — 42,791Income Tax Expense (Benefit) (868) 14,164 (246) — 13,050Income (Loss) From Continuing Operations (2,472) 32,734 (521) — 29,741
Loss From Discontinued Operations, Net of Tax — (5,808) — — (5,808)Equity in Net Income of Consolidated Subsidiaries 26,405 — — (26,405) —Net Income (Loss) $ 23,933 $ 26,926 $ (521) $ (26,405) $ 23,933
Condensed Consolidating Statement of Operations for the fiscal year ended October 31, 2003
76. | 77.Condensed Consolidating Statement of Operations
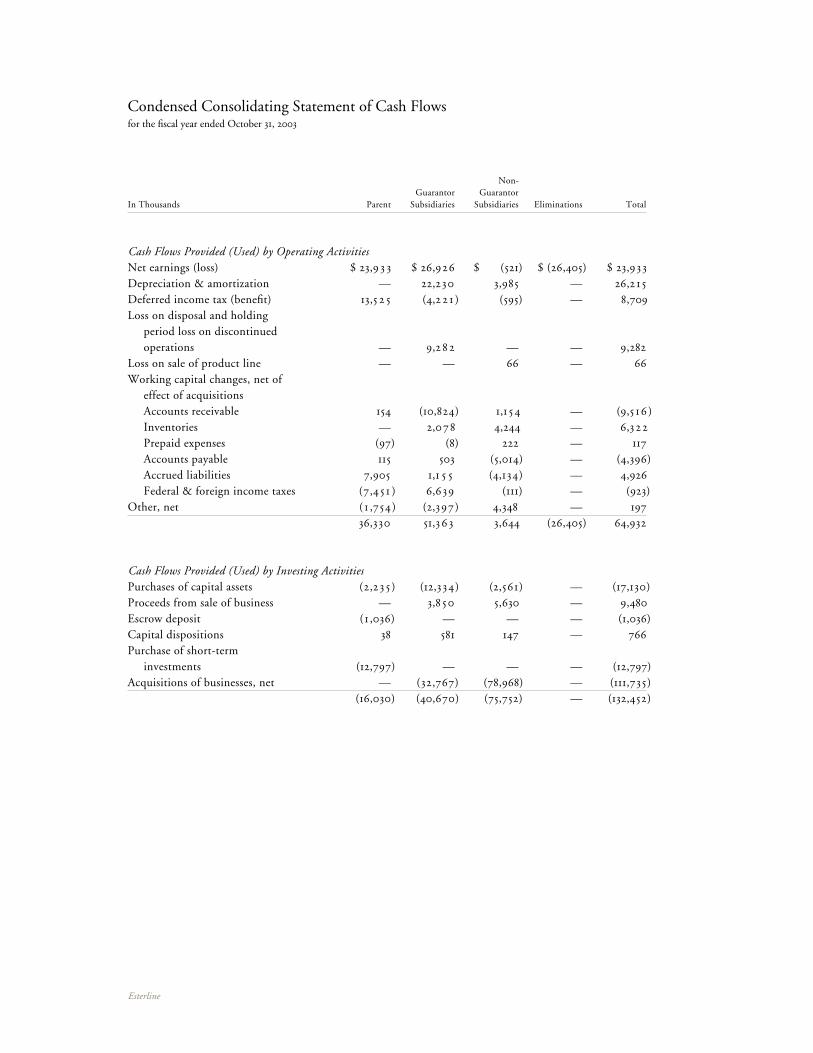
Esterline
Non- Guarantor Guarantor In Thousands Parent Subsidiaries Subsidiaries Eliminations Total
Cash Flows Provided (Used) by Operating ActivitiesNet earnings (loss) $ 23,9 3 3 $ 26,926 $ (521) $ (26,405) $ 23,933Depreciation & amortization — 22,230 3,985 — 26,2 1 5Deferred income tax (benefit) 13,5 2 5 (4,2 2 1 ) (595) — 8,709Loss on disposal and holding period loss on discontinued operations — 9,2 8 2 — — 9,282Loss on sale of product line — — 66 — 66Working capital changes, net of effect of acquisitions Accounts receivable 154 (10,824) 1,1 54 — (9,5 16 ) Inventories — 2,078 4,244 — 6,322 Prepaid expenses (97) (8) 222 — 117 Accounts payable 115 503 (5,014) — (4,396) Accrued liabilities 7,905 1,1 5 5 (4,134) — 4,926 Federal & foreign income taxes (7,4 5 1 ) 6,639 (111) — (923)Other, net ( 1 ,754 ) (2,397) 4,348 — 197 36,330 51,36 3 3,644 (26,405) 64,932
Cash Flows Provided (Used) by Investing ActivitiesPurchases of capital assets (2,2 3 5 ) (12,334) (2,561) — (17,130)Proceeds from sale of business — 3,8 50 5,630 — 9,480Escrow deposit ( 1 ,036) — — — (1,036)Capital dispositions 38 581 147 — 766Purchase of short-term investments (12,797) — — — (12,797)Acquisitions of businesses, net — (32,767) (78,968) — (111,735) (16,030) (40,670) (75,752) — (132,452)
Condensed Consolidating Statement of Cash Flows for the fiscal year ended October 31, 2003
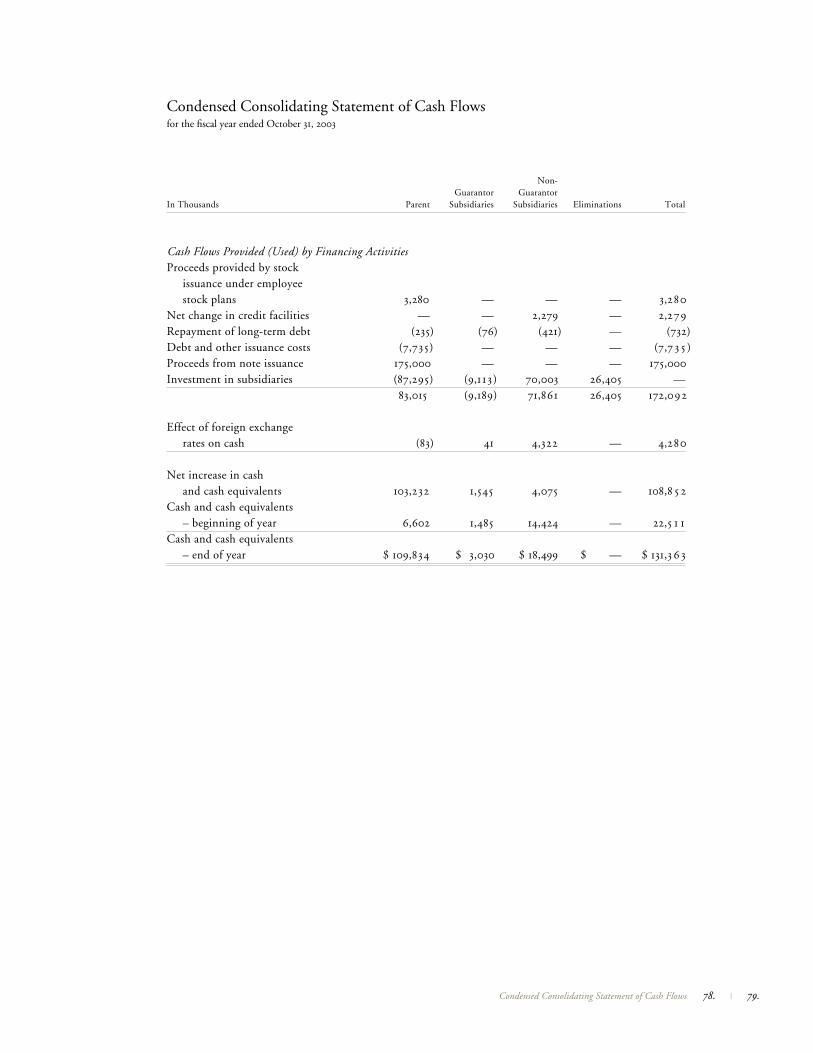
Non- Guarantor Guarantor In Thousands Parent Subsidiaries Subsidiaries Eliminations Total
Cash Flows Provided (Used) by Financing ActivitiesProceeds provided by stock issuance under employee stock plans 3,280 — — — 3,280Net change in credit facilities — — 2,279 — 2,279Repayment of long-term debt (235) (76) (421) — (732)Debt and other issuance costs (7,735) — — — (7,7 3 5 )Proceeds from note issuance 175,000 — — — 175,000Investment in subsidiaries (87,295) (9,1 13) 70,003 26,405 — 83,015 (9,189) 71,861 26,405 172,092
Effect of foreign exchange rates on cash (83) 41 4,322 — 4,280
Net increase in cash and cash equivalents 103,232 1,545 4,075 — 108,8 5 2Cash and cash equivalents – beginning of year 6,602 1,485 14,424 — 22,5 1 1Cash and cash equivalents – end of year $ 109,834 $ 3,030 $ 18,499 $ — $ 131,3 6 3
Condensed Consolidating Statement of Cash Flows for the fiscal year ended October 31, 2003
78. | 79.Condensed Consolidating Statement of Cash Flows
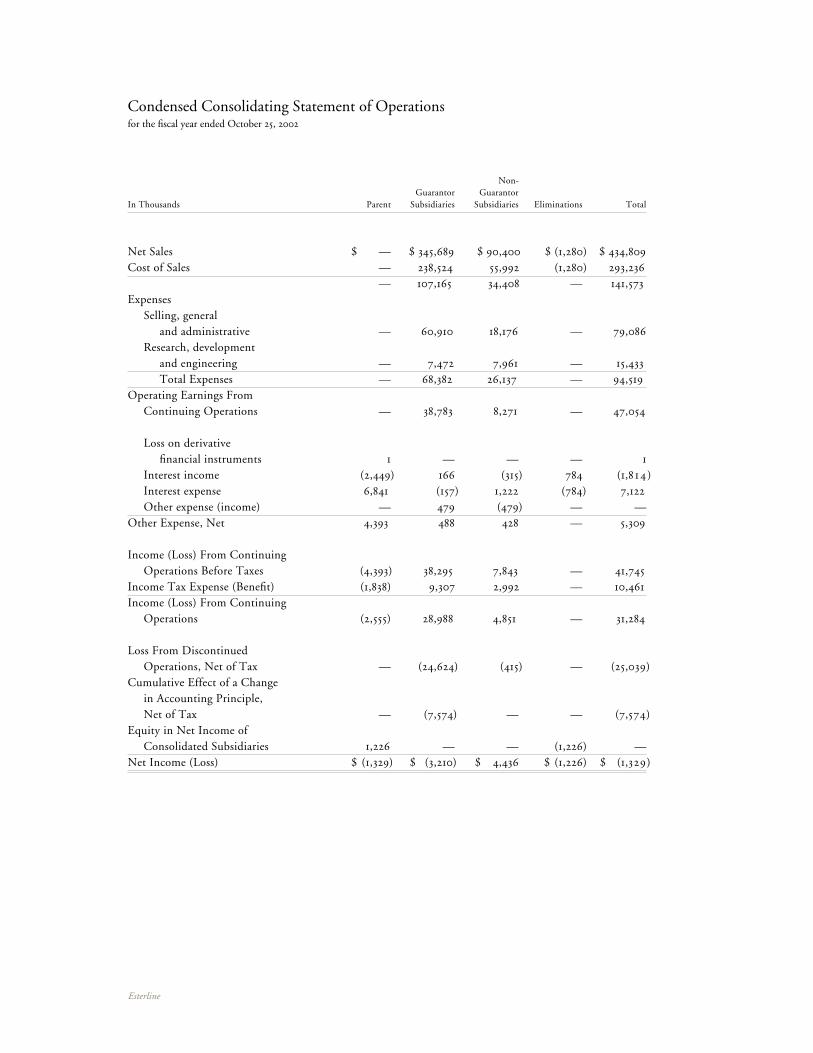
Esterline
Non- Guarantor Guarantor In Thousands Parent Subsidiaries Subsidiaries Eliminations Total
Net Sales $ — $ 345,689 $ 90,400 $ (1,280) $ 434,809Cost of Sales — 238,524 55,992 (1,280) 293,236 — 107,165 34,408 — 141,573Expenses Selling, general and administrative — 60,910 18,176 — 79,086 Research, development and engineering — 7,472 7,961 — 15,433 Total Expenses — 68,382 26,137 — 94,519Operating Earnings From Continuing Operations — 38,783 8,271 — 47,054
Loss on derivative financial instruments 1 — — — 1 Interest income (2,449) 166 (315) 784 (1,8 14 ) Interest expense 6,841 (157) 1,222 (784) 7,122 Other expense (income) — 479 (479) — —Other Expense, Net 4,393 488 428 — 5,309
Income (Loss) From Continuing Operations Before Taxes (4,393) 38,295 7,843 — 41,745Income Tax Expense (Benefit) (1,838) 9,307 2,992 — 10,461Income (Loss) From Continuing Operations (2,555) 28,988 4,851 — 31,284
Loss From Discontinued Operations, Net of Tax — (24,624) (415) — (25,039)Cumulative Effect of a Change in Accounting Principle, Net of Tax — (7,574) — — (7,574)Equity in Net Income of Consolidated Subsidiaries 1,226 — — (1,226) —Net Income (Loss) $ (1,329) $ (3,210) $ 4,436 $ (1,226) $ (1,329)
Condensed Consolidating Statement of Operations for the fiscal year ended October 25, 2002
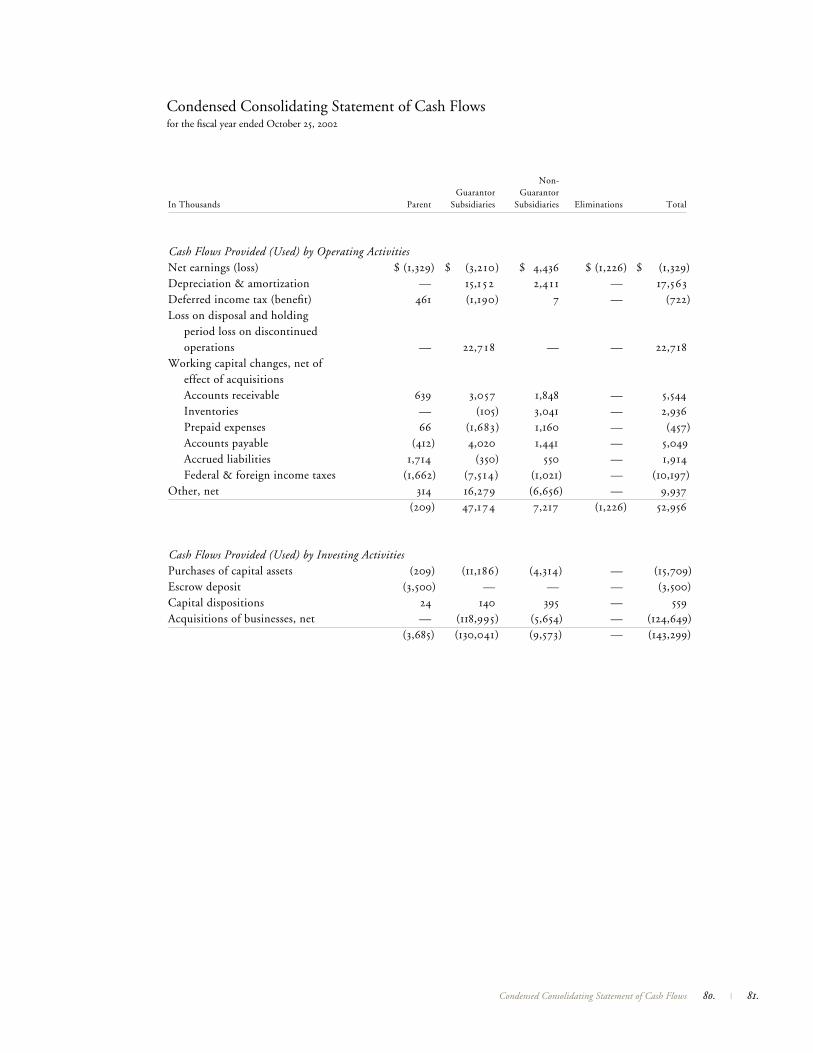
Non- Guarantor Guarantor In Thousands Parent Subsidiaries Subsidiaries Eliminations Total
Cash Flows Provided (Used) by Operating ActivitiesNet earnings (loss) $ (1,329) $ (3,210) $ 4,436 $ (1,226) $ (1,329)Depreciation & amortization — 15,1 5 2 2,4 1 1 — 17,563Deferred income tax (benefit) 461 (1,190) 7 — (722)Loss on disposal and holding period loss on discontinued operations — 22,7 1 8 — — 22,718Working capital changes, net of effect of acquisitions Accounts receivable 639 3,057 1,848 — 5,544 Inventories — (105) 3,041 — 2,936 Prepaid expenses 66 (1,683) 1,160 — (457) Accounts payable (412) 4,020 1,441 — 5,049 Accrued liabilities 1,714 (350) 550 — 1,914 Federal & foreign income taxes (1,662) (7,514) (1,021) — (10,197)Other, net 314 16,279 (6,656) — 9,937 (209) 47,174 7,217 (1,226) 52,956
Cash Flows Provided (Used) by Investing ActivitiesPurchases of capital assets (209) (11,186) (4,314) — (15,709)Escrow deposit (3,500) — — — (3,500)Capital dispositions 24 140 395 — 559Acquisitions of businesses, net — (118,995) (5,654) — (124,649) (3,685) (130,041) (9,573) — (143,299)
Condensed Consolidating Statement of Cash Flows for the fiscal year ended October 25, 2002
80. | 81.Condensed Consolidating Statement of Cash Flows
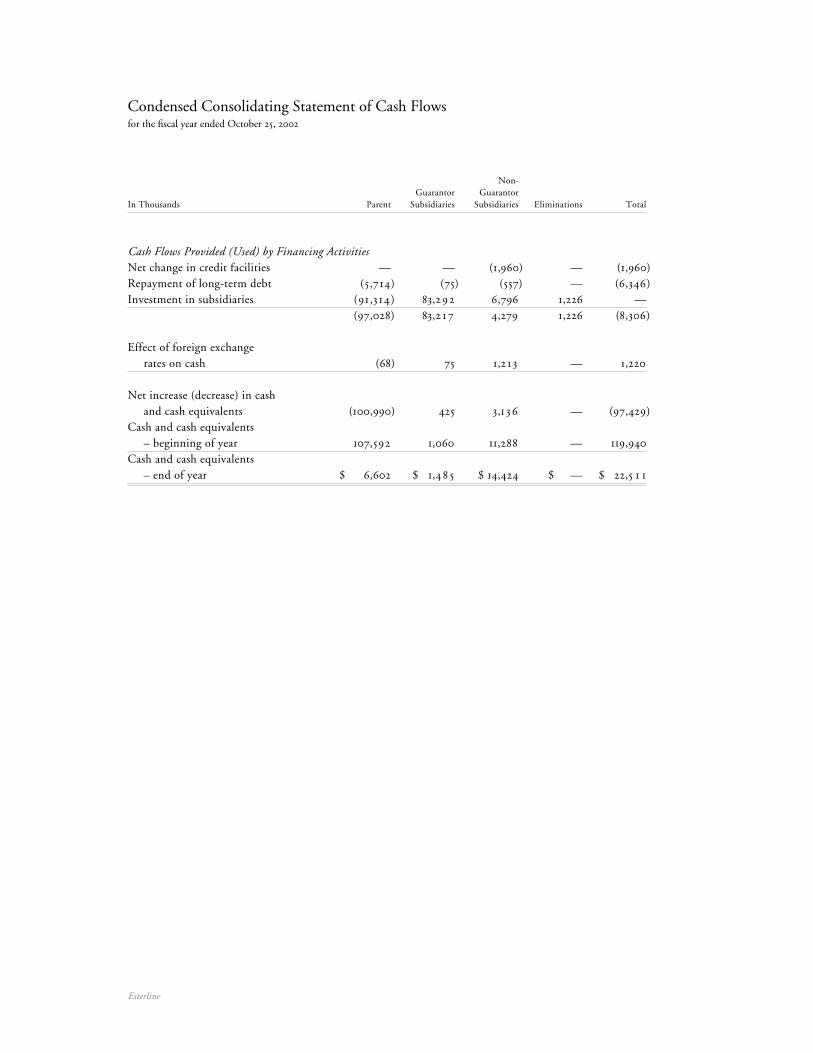
Esterline
Non- Guarantor Guarantor In Thousands Parent Subsidiaries Subsidiaries Eliminations Total
Cash Flows Provided (Used) by Financing ActivitiesNet change in credit facilities — — (1,960) — (1,960)Repayment of long-term debt (5,714) (75) (557) — (6,346)Investment in subsidiaries (91,3 14) 83,292 6,796 1,226 — (97,028) 83,2 1 7 4,279 1,226 (8,306)
Effect of foreign exchange rates on cash (68) 75 1,2 1 3 — 1,220
Net increase (decrease) in cash and cash equivalents (100,990) 425 3,1 36 — (97,429)Cash and cash equivalents – beginning of year 107,592 1,060 11,288 — 119,940Cash and cash equivalents – end of year $ 6,602 $ 1,4 8 5 $ 14,424 $ — $ 22,5 1 1
Condensed Consolidating Statement of Cash Flows for the fiscal year ended October 25, 2002
To the Shareholders and the Board of DirectorsEsterline Technologies CorporationBellevue, Washington
We have audited the accompanying consolidated balance sheets of Esterline Technologies Corporation as of October 29, 2004 and October 31, 2003, and the related consolidated statements of operations, shareholders’ equity and comprehensive income, and cash flows for each of the three years in the period ended October 29, 2004. These financial statements are the responsibility of the Company’s management. Our responsibility is to express an opinion on these financial statements based on our audits.
We conducted our audits in accordance with the standards of the Public Company Accounting Oversight Board (United States). Those standards require that we plan and perform the audit to obtain reasonable assur-ance about whether the financial statements are free of material misstatement. An audit includes examining, on a test basis, evidence supporting the amounts and disclosures in the financial statements. An audit also includes assessing the accounting principles used and significant estimates made by management, as well as evaluating the overall financial statement presentation. We believe that our audits provide a reasonable basis for our opinion.
In our opinion, the financial statements referred to above present fairly, in all material respects, the con-solidated financial position of Esterline Technologies Corporation at October 29, 2004 and October 31, 2003, and the consolidated results of its operations and its cash flows for each of the three years in the period ended October 29, 2004, in conformity with U.S. generally accepted accounting principles.
As discussed in Note 2 to the consolidated financial statements, effective October 27, 2001 the Company changed its method of accounting for goodwill in accordance with Statement of Financial Accounting Standards No. 142, “Goodwill and Other Intangible Assets”.
Seattle, WashingtonDecember 10, 2004
Report of Independent Registered Public Accounting Firm
82. | 83.Report of Independent Registered Public Accounting Firm

Esterline
Directors
Robert W. Cremin
Chairman, President, and Chief Executive OfficerEsterline Technologies
Richard R. Albrecht
Executive Vice President (Retired) Commercial Airplane GroupThe Boeing Company
Lewis E. Burns
Director/ConsultantDover Industries, Inc.
Ross J. Centanni
Chairman, President and Chief Executive OfficerGardner Denver, Inc.
John F. Clearman
Special Advisor to the Board (Retired)Milliman USA
Robert S. Cline
Chairman and Chief Executive Officer (Retired)Airborne Freight Corporation
Anthony P. Franceschini
Director, President, and Chief Executive OfficerStantec Inc.
Charles R. Larson
Admiral United States Navy (Retired)
Jerry D. Leitman
Chairman, President, and Chief Executive OfficerFuelCell Energy, Inc.
James L. Pierce
Chairman (Retired)ARINC Incorporated
Officers
Robert W. Cremin
Chairman, President and Chief Executive Officer
Stephen E. Barton
Group Vice President
Robert D. George
Vice President, Chief Financial Officer, Secretary and Treasurer
Marcia J. M. Greenberg
Vice PresidentHuman Resources
Larry A. Kring
Group Vice President
Stephen R. Larson
Vice PresidentStrategy and Technology
Directors and Officers
Corporate Headquarters
500 108th Avenue N.E.Bellevue, WA 98004(425) [email protected]
Stock Exchange Listing
New York Stock ExchangeSymbol – ESL
www.esterline.com
Transfer Agent and Registrar
Mellon Investor ServicesShareholder Services L.L.C.www.mellon-investor.com
Shareholder Relations(800) 522-6645
Outside of the U.S.(201) 329-8660
TDD Hearing Impaired(800) 231-5469
TDD Hearing ImpairedOutside of the U.S.(201) 329-8534
Shareholder CorrespondenceP.O. Box 3315South Hackensack, NJ 07606
Overnight Delivery85 Challenger RoadRidgefield Park, NJ 07660
Investor Information
Annual Meeting of Shareholders
The 2005 annual meeting of shareholders will be held at the Harbor Club – Bellevue, 777 108th Avenue N.E., Bellevue, WA, on Wednesday, March 2, 2005. The meeting will start at 10:00 a.m.
10-K report
A copy of Esterline’s annual report on Form 10-K filed with the Securities and Exchange Commission will be provided without charge upon written request to the corporate head- quarters, attention: Director, Corporate Communications or through our website.
Stock Held in Street Name
Esterline maintains a direct mailing list to help ensure that shareholders whose stock is held in street name (broker or similar accounts) receive information on a timely basis. If you would like your name added to this list, please send your request to the corporate headquarters, attention: Director, Corporate Communications.
Stock Exchange Certifications
Esterline has filed the CEO and CFO certifications required by section 302 of the Sarbanes-Oxley Act of 2002 as exhibits to its Annual Report on Form 10-K for the fiscal year ended October 29, 2004 and has submitted to the NYSE the annual CEO certification required by Section 303A.12 (a) of the NYSE listing standards.
84. | 85.Investor Information
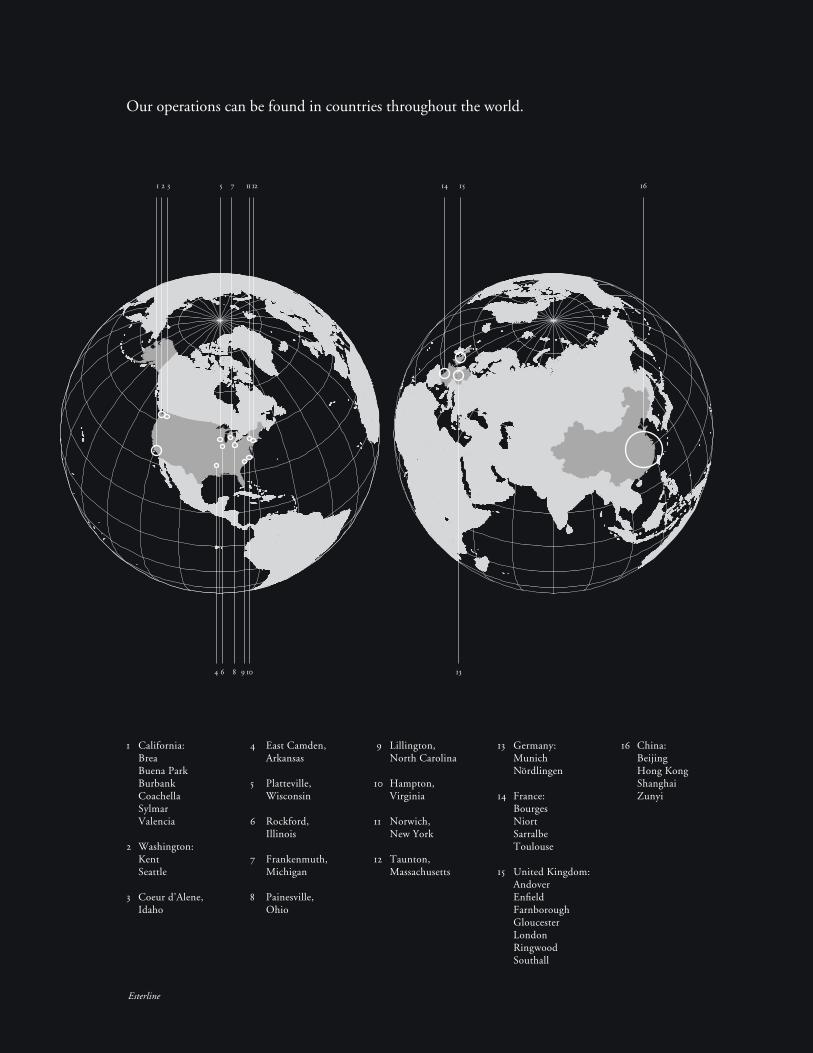
Esterline
Our operations can be found in countries throughout the world.
1 California: Brea Buena Park Burbank Coachella Sylmar Valencia 2 Washington: Kent Seattle
3 Coeur d’Alene, Idaho
4 East Camden, Arkansas
5 Platteville, Wisconsin
6 Rockford, Illinois
7 Frankenmuth, Michigan
8 Painesville, Ohio
16 China: Beijing Hong Kong Shanghai Zunyi
13 Germany: Munich Nordlingen 14 France: Bourges Niort Sarralbe Toulouse 15 United Kingdom: Andover Enfield Farnborough Gloucester London Ringwood Southall
9 Lillington, North Carolina
10 Hampton, Virginia
11 Norwich, New York
12 Taunton, Massachusetts
1 2 3 5 7 14 15
4 6 8 9 10
11 12
13
16
Esterline

Esterline provides more than 10,000 solutions to the aero- space industry. Solutions that reach from cockpit controls to the micromotors that actuate missile ailerons to sensors that provide real time in-flight data on hundreds of parameters. And for every problem we solve, customers look to Esterline to find new ways to apply our technologies, to solve new problems and help redefine the possible.
Esterline Corporation is a specialized manufacturing company principally serving aerospace and defense markets. Esterline isheadquartered in Bellevue, Washington, and is listed on the New York Stock Exchangewith the trading symbol ESL.
Esterline Corporation 2004 Annual Report

Esterline C
orporation 2004 Annual R
eport