estate capital edition 26 winter & spring 2017 investment
TRANSCRIPT

Winter & Spring 2017E D I T I O N 26
Inve ment Fund Due DiligenceShortli CriteriaOur Portfolio Sele ion
In The Overview:
Diversifi ed Inve ment PortfoliosRisk Related Asset AllocationRange of Returns
E S T A T E C A P I T A LI N V E S T M E N TP O R T F O L I O SO V E R V I E W

B A L A N C E D I N C O M E P O R T F O L I O
The Balanced Income Portfolio is a value style income and growth strategy. It is aimed at medium to long term investors who are seeking a sustainable level of income within a balanced portfolio along with a genuine prospect of income & capital growth.
The Balanced Income Portfolio performance isbenchmarked against the average performance ofthe IA Mixed Investment 20%–60% sector. TheBalanced Income Portfolio has a risk rating andinvestor profile of 4 out of 10.
ESTATE CAPITAL INVESTMENT PORTFOLIOS OVERVIEW 1 EDITION 26 Winter & Spring 2017
O V E R V I E W Winter & Spring 2017E D I T I O N 26
D E F E N S I V E P O R T F O L I O
The Defensive Portfolio is a blended style strategy.It is aimed at medium to long term investors whoare seeking a cautious investment that has agenuine prospect of capital growth above cashbased investments.
The Defensive Portfolio performance is benchmarked against the average performance of the IA Mixed Investment 0%–35% sector and has a risk rating and investor profile of 2 out of 10.
C O N S E R V A T I V E P O R T F O L I O
The Conservative Portfolio is a blended style strategy.It is aimed at medium to long term investors who areseeking a relatively cautious investment that has agenuine prospect of capital growth.
The Conservative Portfolio performance isbenchmarked against the average performance ofthe IA Mixed Investment 0%–35% sector and hasa risk rating and investor profile of 3 out of 10.
The Balanced Beta Portfolio is a passive growthstrategy. It is aimed at medium to long term investorswho are seeking above average capital growth froma balanced portfolio of mainly equity investments.
The Balanced Beta Portfolio performance isbenchmarked against the average performance ofthe IA Mixed Investment 20%–60% sector and hasa risk rating and investor profile of 5 out of 10. TheBalanced Beta Portfolio is the Estate Capital defaultportfolio for regular pension contributions.
B A L A N C E D B E T A P O R T F O L I O

S P E C U L A T I V E A L P H A P O R T F O L I O
B A L A N C E D H I G H E R I N C O M EP O R T F O L I O
B A L A N C E D A L P H A P O R T F O L I O
Financial Advice & Wealth Management 2
Overview
The Balanced Higher Income Portfolio is a valuestyle income and growth strategy. It is aimed at medium to long term investors who are seeking a sustainable level of high income within a balanced portfolio along with a genuine prospect of income and capital growth.
The Balanced Higher Income Portfolio performanceis benchmarked against the average performance ofthe IA Investment 40%–85% sector. The Balanced Higher Income Portfolio has a risk rating and investor profile of 6 out of 10.
The Balanced Alpha Portfolio is a growth stylestrategy. It is aimed at medium to long term investorswho are seeking above average capital growth froma balanced portfolio of mainly equity investments.
The Balanced Alpha Portfolio performance isbenchmarked against the average performance ofthe IA Mixed Investment 40%–85% sector andhas a risk rating and investor profile of 6 out of 10.
The Speculative Beta Portfolio is a passive growthstrategy. It is aimed at medium to long term investorswho are seeking above average capital growth froma balanced portfolio of mainly equity investments.
The Speculative Beta Portfolio performance isbenchmarked against the average performance ofthe IA Mixed Investment 40%–85% sector andhas a risk rating and investor profile of 7 out of 10.
S P E C U L A T I V E B E T A P O R T F O L I O
The Speculative Alpha Portfolio is a growth stylestrategy. It is aimed at medium to long terminvestors who are seeking above average capitalgrowth from a speculative portfolio of mainlyglobal equity investments.
The Speculative Alpha Portfolio performance isbenchmarked against the average performance ofthe IA Mixed Investment 40%–85% sector andhas a risk rating and investor profile of 8 out of 10.

Winter & Spring 2017
ESTATE CAPITAL INVESTMENT PORTFOLIOS OVERVIEW 3 EDITION 26 Winter & Spring 2017
O V E R V I E W E D I T I O N 26
The Estate Capital Investment Portfolios offer eightmodel investment strategies aimed at medium tolong term investors who seek capital growth andincome from a portfolio of leading investmentfunds. The portfolios can be used in full or as a coreholding in a broader bespoke portfolio.
The portfolios offer access to highly rated leadinginvestment fund managers who have in the pastprovided above average returns. The individual fundsthat make up our diversified portfolios are selectedupon the quality of the fund manager and theconsistency of past performance.
There is a wide range of asset classes across globalmarkets available to investors. Our Portfoliosbring together a diversity of equities, fixed interestsecurities, currencies, natural resources and property.The global balance of investment across differingasset classes is a primary driver of portfolio returnand enhanced security.
Investment Portfolios Active Funds - Alpha Portfolios
Our active investment portfolios bring together a blend of the leading UK fund managers. The managers we select represent the best in their asset class. Active investment managers will seek to out-perform their sector average through their analysis and understanding of the market.
Active management is implemented through either a growth or value strategy. Growth funds seek outperformance through stock selection based upon growth potential and momentum. Value funds seek outperformance through the selection of unpopular and undervalued stock that in time recover their true market value.
In addition to our active investment portfolios, we offer a range of passive portfolios. Passive funds replicate the stockholdings of an underlying index, such as the FTSE 100. Since these funds track the composition and performance of the underlying index, there are low levels of management and trading activity and so the funds have a lower total expense ratio. We have included index tracking funds in our lower risk portfolios and offer a passive only balanced and speculative portfolio. Passive funds do not operate on a growth or value basis unless the underlying index has a particular style.
Passive Funds - Beta PortfoliosInvestment Diversity

Financial Advice & Wealth Management 4
Overview
Risk Related Returns Risk Related Asset Allocation
Asset Allocation
An important decision when constructing a suitable investment portfolio is the level of risk you are prepared to accept. Risk is an unavoidable feature of all investment. As investment takes place amid uncertainty, investors need to take account of risk in their search for capital growth.
Once the acceptable level of market risk has been decided, the optimal mix of assets for a given risk profile can be identified. This is asset allocation.
It is commonly agreed from established researchthat asset allocation provides for more than 90% of total return for a managed investment portfolio. Asset allocation is the unquestionable driver of portfolio performance. It is more important than fund selection or market timing.
In order to reduce overall risk, a portfolio should seek to diversify its holdings across various types of investments, alternative areas of business and differing parts of the world economy. Individual ups and downs are cancelled out within a sufficiently diversified portfolio therefore reducing risk and driving return.
It is for these reasons that we have built our own risk related asset allocation graph to identify efficient portfolios. The Asset Allocation Graph identifies a suitable split of diversified assets for each risk tolerance.
The graph gives our current risk related asset allocation for a growth investor. The asset allocations are for risk levels 1 to 10, with 1 being the most cautious and 10 being the most speculative. These asset allocations are reviewed periodically and are subject to change.
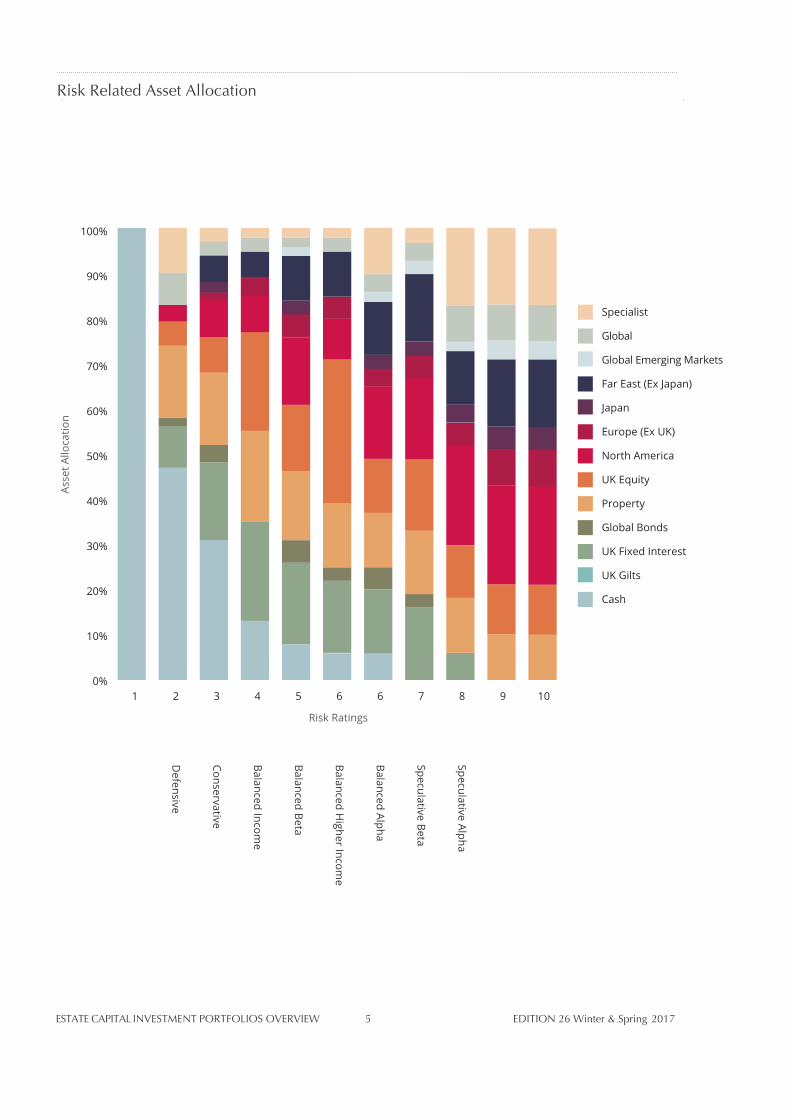
Risk Related Asset Allocation
ESTATE CAPITAL INVESTMENT PORTFOLIOS OVERVIEW 5 EDITION 26 Winter & Spring 2017
0%
10%
20%
30%
40%
50%
60%
70%
80%
90%
100%
1 2 3 4 5 6 6 7 8 9 01
Asse
t Allo
catio
n
Risk Ratings
Defensive
Conservative
Balanced Income
Balanced Beta
Balanced Higher Incom
e
Balanced Alpha
Speculative Beta
Speculative Alpha Specialist
Global
Global Emerging Markets
Far East (Ex Japan)
Japan
Europe (Ex UK)
North America
UK Equity
Property
Global Bonds
UK Fixed Interest
UK Gilts
Cash

Financial Advice & Wealth Management 6
Range of Return
-40%
-30%
-20%
-10%
0%
10%
20%
30%
40%
2
+11.06%
+3.45% +4.09% +4.57% +5.27% +5.27% +5.78% +6.36%
+2.55%
-5.96%
+17.45%
+21.45%
+25.30%
+29.36% +29.36%
+33.23%
+37.17%
3 4 5 6 6 7 8
-10.55%
-13.27%
-16.16%
-18.82% -18.82%
-21.68%
-24.46%
Rang
e of
Pot
entia
l Ret
urn
Risk Ratings
Expected Mean Return
Defensive
Conservative
Balanced Income
Balanced Beta
Balanced Higher Incom
e
Balanced Alpha
Speculative Beta
Speculative Alpha

The quality of fund management will have significant influence upon likely future returns. We filter the entire listing of UK retail investment funds and investment trusts by preferring funds that are rated Silver or Gold by Morningstar Analysts and are Rated by Rayner Spencer Mills. We will accept a Bronze rated fund to provide a required market exposure. Property funds and Passive funds are not comprehensively rated by both fund management ratings agencies. As Passive funds track an index their replication policy, tracking error, stock ownership and lending policy, as well as cost, are the assessment criteria we consider.
Rayner Spencer Mills operate both a quantitativeand qualitative measure in order to rate an investment fund. After initial screening for acceptable risk and performance characteristics, funds are judged upon – acceptable risk and reward parameters, robust fund management processes, a strong fund management team, total expense cost ratios, fund size, fund managers background, fund philosophy, fund managers process and resources and overall risk control. Rayner Spencer Millsinclude property funds in their ratings. Successful funds are awarded a Rated status. This rating is reviewed every three months.
Source: Rayner Spencer Mills website and publications.
Investment Management Morningstar Analyst Ratings
The Morningstar Analyst Ratings for investment funds is the summary expression of a forward looking analysis of the fund. Morningstar Analyst ratings are assigned to funds on a five tier scale running from Gold to Negative. The top three ratings, Gold, Silver and Bronze all indicate that our analysts think highly of the fund. The differences between them correspond to the level of analyst conviction in the funds ability to outperform its benchmark and peers within the context of the level of risk taken. The five pillars of success that funds are judged against are – The quality of the investment team, investment processes and performance objective, parent organisation, performance and price. Morningstar Analyst Ratings include passive funds in their ratings.
Gold Rating – These funds are the highest conviction recommendations and stand out as best of breed for their investment mandate. To earn a Gold rating, a fund must distinguish itself across all the five pillars of success that are the basis of the analysis.
Silver Rating – Funds that fall into this category are high conviction recommendations. They have notable advantages across several but perhaps not all of the five pillars.
Bronze Rating – These funds have advantages that clearly outweigh any disadvantages across the pillars, providing a conviction to award a positive rating.
Source: Morningstar website and publications.
ESTATE CAPITAL INVESTMENT OUTLOOK 7 EDITION 26 Winter & Spring 2017
Rayner-Spencer Mills Research

Financial Advice & Wealth Management 8
Consistent performance figures do not lie and quality fund management will express itself in above average and top quartile returns. We therefore point score quartile performance over 1 year, 2 years and 3 years, with a weighting to recent performance. We also point score 3 year, 5 year and 10 year actual average growth rates to reward long term consistent performance.
Quartile rankings are based on discrete performance over the specified measured period to month of publication on a sell to sell income reinvested basis. Fund and trust yields are based upon the gross dividend prediction of the fund manager.
The FE Crown Fund Rating™ enable investors to distinguish between funds that are consistently outperforming their respective benchmarks. The ratings take into account three key measures that influence overall performances: Stockpicking, risk control and consistent outperforming of relevant benchmarks. The methodology does not simply identify the best performers but those who achieve their results in a solid and intrinsically valuable way.
Investment Performance Funds Selection
The combined points score from several past quartile performance, actual annual and average growth rates from the past one, three, five and ten year performance, current yield and fund management confidence factors from leading fund rating agencies as well as the information ratio, alpha ratio and beta ratio for the selected funds will provide us with an overall merit rating. Each fund which passes through our initial screening process will receive a point score on our “Shortlist”. The highest scoring funds arethen usually but not exclusively selected into our “Purchase List” and then our portfolios.
Financial Express Crown Fund Ratings Risk Rated Returns
All selected investment portfolios are given a risk rating from 1 to 10 in order to match Portfolio selection to attitude to risk and reward.
The value of capital and income arising from an investment is not guaranteed. Stock and unit prices may go up as well as down and an investor may not get back the amount originally invested.
Top 10% of funds in sectorTop 76-90% of funds in sectorNext 51-75% of funds in sector Bottom 26-50% of funds in sector Bottom 25% of funds in sector
5*4*3*2*1*
Source: Money Management, December 2016.
Source: Money Management, December 2016. Morningstar
website and publications.

ESTATE CAPITAL INVESTMENT PORTFOLIOS OVERVIEW 9 EDITION 26 Winter & Spring 2017
E S T A T E C A P I T A L I N V E S T M E N T P O R T F O L I O SS H O R T L I S T
Sector Fund Group Fund Name Volatility Tracker Equity Bond Analysis Ratings RSM Crown Income 1Y 2Y 3Y 5Y 10Y Total Short 3 year Index Style Style Morning * Ratings Yield Quartile quartile quartile AGR AGR Score List
Asia Pacifi c Funds Fidelity Asia 4.2 B B R 5 1.2 4 4 3 11.8 13 157 Asia Pacifi c Funds Stewart Asia Pacifi c Leaders 3.5 G S R 5 1.1 1 4 4 12.9 14.5 153 SelectAsia Pacifi c Funds Invesco Perpetual Asian 4.5 B B R 4 1.4 4 2 4 12.4 12 143 Asia Pacifi c Funds Stewart Asia Pacifi c Sustainability 3.3 G S 5 0.8 3 4 4 17.6 16.4 140 Soft CloseAsia Pacifi c Funds Veritas Asian 3.6 G S 5 0.2 4 4 4 14.2 12.6 136 SelectAsia Pacifi c Funds M&G Asian 4.4 B B R 3 1.5 1 2 3 9.8 10.6 132 Asia Pacifi c Funds Schroder Asian Alpha Plus 4.1 B S R 3 1.3 3 3 3 12.5 129 Asia Pacifi c Funds Fidelity Emerging Asia 4.2 G R 5 0.8 3 4 4 12.6 129 SelectAsia Pacifi c Funds JOHCM Asia ex Japan 3.5 G B R 3 0.3 3 4 3 13.9 119 SelectAsia Pacifi c Funds Investec Asia ex Japan 4.5 B S 4 1.7 2 3 4 11.7 12.7 117 Asia Pacifi c Funds JOHCM Asia ex Japan Small & Mid 3.7 G R 5 0 1 4 4 16.2 116 SelectAsia Pacifi c Funds Aberdeen Asia Pacifi c Equity 4.1 V S R 2 1.5 1 1 2 7.4 10 105 Asia Pacifi c Funds L&G Pacifi c Index 4.2 FTSE World Pacifi c ex Japan B R 3 4 1 1 9.1 9.6 104 SelectAsia Pacifi c Funds Blackrock Pacifi c ex Japan Index 4.3 FTSE World Pacifi c ex Japan B R 2.8 4 1 1 9.2 9.5 103 SelectAsia Pacifi c Funds Matthews Asia Pacifi c Tiger 4.1 B S 4 0 2 4 4 12.5 101 Asia Pacifi c Funds Vanguard Pacifi c ex Japan Index 4.5 FTSE World Pacifi c ex Japan R 4 4 1 1 8.9 89 Asia Pacifi c Funds Aberdeen Asia Pacifi c & Japan 4 V S 2 1.3 1 1 3 9 9 77 Asia Pacifi c Funds T Rowe Price Asian ex Japan 4.1 B B 3 0 2 2 4 9.7 72 Asia Pacifi c Funds HSBC Pacifi c Index 4.3 FTSE World Pacifi c ex Japan 2.8 3 1 1 8.9 9 56 Asia Pacifi c Income Funds Schroder Asian Income 3.6 V B R 4 3.8 3 3 3 13 12.1 152 SelectAsia Pacifi c Income Funds Newton Asian Income 3.9 B R 4 4.1 3 1 2 11 12.4 132 China Funds First State Greater China Growth 4.7 G G R 3 1.2 3 3 1 13.7 15.5 151 SelectChina Funds Invesco Perpetual Hong Kong & China 4.9 B R 5 1.5 1 4 2 15.1 12.7 131 SelectChina Funds Henderson China Opportunities 5.1 G B 5 1.4 4 3 4 13.5 13.3 128 SelectChina Funds Schroder Greater China 4.8 B S 5 0 4 2 4 13.7 12.8 127 China Funds Fidelity China Consumer 5.1 B R 4 1.1 3 3 3 15.5 119 SelectChina Funds Fidelity China Focus 5.8 V B 4 1.4 3 4 2 13.6 101 SelectChina Funds GAM Star China Equity 6.6 G S 1 0 1 4 2 12.4 66 China Funds Aberdeen Global Chinese Equity 4.2 V 1 0 3 1 1 6.7 9.5 48 European Funds Blackrock European Dynamic 3.1 G S R 5 1.5 2 4 4 15.8 11.5 161 SelectEuropean Funds Jupiter European 3.1 G G R 5 0.5 1 4 4 15.6 11.5 160 SelectEuropean Funds JOHCM Continental Europe 3.1 B S R 5 0.2 3 3 4 13.4 9 151 SelectEuropean Funds Henderson European Growth 3.3 B R 5 2 4 3 4 14.3 8.9 147 European Funds FP Crux European Special Situations 3 G B R 5 1.8 4 3 3 15.4 146 European Funds Blackrock Continental Europe 3 B S R 4 1.7 2 4 2 13.9 9.4 146 European Funds Allianz Continental European 3.2 G S R 4 1 2 4 2 13.4 7.8 140 European Funds Threadneedle European Select 3.2 G B R 4 1.1 1 4 4 13.6 9.2 130 European Funds Fidelity European 3 G B R 3 1.9 3 2 4 12.2 6 126 European Funds Eden Tree Amity European 3.2 G R 4 2.2 3 3 1 11.8 7.6 124 European Funds Jupiter European Special Situations 3 B S R 3 1.3 1 3 2 12 7.7 122 European Funds Schroder European Opportunities 3 B B R 4 1.4 1 3 2 12.3 7.7 121 European Funds Schroder European 3.1 B S 4 2.5 4 2 3 13.9 116 European Funds Henderson European Select Opportunities 3.1 B S 4 1.9 2 2 4 13.7 8.3 112 European Funds Henderson European Focus 3.1 G S 4 1.7 1 2 4 14.5 6.5 104 European Funds L&G European Index 3.2 FTSE Dev Europe ex UK B R 3.4 3 1 3 11.2 5.9 102 SelectEuropean Funds Vanguard FTSE Developed Europe ex UK index 3.2 FTSE Dev Europe ex UK B R 2.3 2 1 3 11.7 85 European Funds Blackrock Continental Euro Equity Tracker 3.2 FTSE World Europe ex UK B 2.7 3 1 3 11.1 5.7 68 SelectEuropean Funds HSBC European Index 3.3 FTSE Dev Europe ex UK 2.7 2 1 3 11.3 5.6 52 European Income Funds Blackrock Continental European Income 2.7 B B 5 4.2 3 4 4 15.6 129 SelectEuropean Income Funds Schroder European Alpha Income 3.5 B R 5 3.3 4 3 4 131 SelectEuropean Income Funds Standard Life European Equity Income 3 B B R 3 3 4 2 3 12.8 130 European Smaller Co Funds Baring Europe Select Trust 3 B S R 4 1.3 4 2 3 18.7 12.4 158 European Smaller Co Funds Standard Life European Smaller Co 3.5 B R 5 0 3 4 2 20.0 128 Select

Financial Advice & Wealth Management 10
Sector Fund Group Fund Name Volatility Tracker Equity Bond Analysis Ratings RSM Crown Income 1Y 2Y 3Y 5Y 10Y Total Short 3 year Index Style Style Morning * Ratings Yield Quartile quartile quartile AGR AGR Score List
European Emerging Market Trust JP Morgan Emerging Europe Equity 5.6 V B 3 4.1 1.1 2.4 58 European Emerging Market Funds Jupiter Emerging European Opportunities 5.7 V 3 2.3 0.8 -0.3 36
Global Emerging Market Funds Aberdeen Emerging Markets 4.8 V S R 3 1.1 3 3 1 7.7 11.9 131 Soft CloseGlobal Emerging Market Funds Lazard Emerging Markets 5.2 B S R 3 1.7 4 1 2 7 9 131 SelectGlobal Emerging Market Trust JP Morgan Emerging Markets 4.8 G B R 3 1.3 4 2 2 6.6 8.4 122 Global Emerging Market Funds M&G Global Emerging Markets 5.1 B B R 3 1.8 4 1 1 6.8 110 Global Emerging Market Funds Schroder Global Emerging Markets 4.4 B B 4 1.3 3 3 2 7.3 8.6 98 SelectGlobal Emerging Market Funds Blackrock Emerging Markets Equity Tracker 4.8 FTSE All World Emerging R 2.1 3 2 3 6.3 79 SelectGlobal Emerging Market Funds Vanguard Emerging Markets Index 4.6 FTSE All World Emerging R 2.6 2 2 2 6 73 Global Emerging Market Funds Legal & General Global Emerging Markets Index 4.8 FTSE All World Emerging 2.2 3 2 3 6.1 49 Global Emerging Market Income Funds MI Somerset Emerging Market Dividend Growth 3.7 B B R 4 2.2 1 4 3 8.7 120 Global Emerging Market Income Fund JP Morgan Global Emerging Markets Income 4.6 G B 3 3.7 4 1 3 87 Global Emerging Market Funds Templeton Emerging Market Smaller Co 3.4 G B R 5 0 2 4 4 13.9 130 SelectGlobal Emerging Market Funds J P Morgan Emerging Market Smaller Co 4.1 G 5 3.2 4 4 4 12.8 117 Global Equity Income Funds Newton Global Income 3 B R 4 3.1 4 4 3 15.1 10.8 149 SelectGlobal Equity Income Funds Artemis Global Income 3 V B R 3 3.3 2 4 4 17.6 134 SelectGlobal Equity Income Funds Fidelity Global Dividend 2.8 V R 4 2.9 4 4 4 125 SelectGlobal Equity Income Funds Schroder Global Equity Income 3.4 B R 2 3.1 4 3 3 14.9 118 SelectGlobal Equity Income Funds M&G Global Dividend 3.7 B S R 1 3.2 4 1 2 12.2 118 Global Equity Income Funds Lazard Global Equity Income 3.4 B B R 1 4.8 3 1 2 9.6 108 Global Equity Income Funds Invesco Perpetual Global Equity Income 2.8 B R 2 3.3 1 3 2 14 99 Global Equity Income Funds Veritas Global Equity Income 3.6 B G 1 3.8 4 1 2 89 Global Equity Funds Fundsmith Equity 3.2 G B R 5 0.8 4 4 4 21.6 154 SelectGlobal Equity Funds Artemis Global Growth 2.9 B S R 4 1.8 2 4 4 17.1 9.1 153 SelectGlobal Equity Funds Fidelity Global Special Situations 3.4 G S R 3 0.5 4 4 4 17.1 7.8 149 SelectGlobal Equity Funds First State Global Listed Infrastructure 3.4 B B R 5 2.3 4 2 4 15.5 147 SelectGlobal Equity Funds Rathbones Global Opportunities 3.4 G S R 4 0.2 2 2 4 15.3 11.1 137 Global Equity Funds Old Mutual Global Equity 3.2 G R 4 0.6 3 4 4 19.5 9.9 136 SelectGlobal Equity Funds Investec Global Strategic Equity 3.4 B S R 3 0.8 3 2 4 16 8.2 136 Global Equity Funds Schroder QEP Global Core 3.1 G B R 3 1.6 4 2 4 14.8 127 Global Equity Funds Newton Global Equity 3.1 B B R 3 1.2 2 4 3 14.6 8.1 127 Global Equity Funds Vanguard FTSE Developed World ex UK Index 2.8 FTSE World ex UK G R 1.5 4 2 4 15.9 123 SelectGlobal Equity Funds Linsdell Train Global Equity 3.1 G 5 1.1 3 4 4 19.8 107 SelectGlobal Equity Funds M&G Global Leaders 3.5 B B R 1 1.3 4 2 1 12.5 6.3 107 Global Equity Funds GAM Global Diversifi ed 2.8 G S 5 0.6 2 2 1 14.6 7.3 107 Global Equity Funds Jupiter Ecology 3.1 G B R 2 0.7 3 2 1 12.2 7.2 107 Global Equity Funds Aberdeen World Equity 3.5 V S R 1 1.2 3 1 2 9.3 7.5 107 Global Equity Funds Dodge & Cox Worldwide Global Stocks 3.3 B G 3 0 4 1 4 16.1 106 Global Equity Funds F&C Responsible Global Equity 3.1 G R 2 0.9 2 4 2 14.5 8.8 106 Global Equity Funds Veritas Global Focus 3.1 G G 4 0.5 3 3 4 103 Global Equity Funds Aberdeen Ethical World Equity 3.7 V B R 1 1.2 4 1 1 7.9 6.0 98 Global Equity Funds BNY Mellon Long Term Global Equity 3.1 B S 3 1 3 3 2 13.8 97 Global Equity Funds Legal & General International Index 3.1 FTSE World ex UK R 2 4 2 4 14.8 95 SelectGlobal Equity Funds Stewart Investors Worldwide Sustainability 3.1 G R 3 0.5 4 3 1 95 Global Equity Funds Eden Tree Amity International 3.1 G R 1 2.1 3 1 1 9.8 9.5 92 Global Equity Funds Neptune Global Equity 3.8 B B R 1 0.7 1 3 3 7.3 5.8 89 Global Equity Funds Legal & General Global Health & Pharmacy Index 3.7 FTSE World Health 1.3 1 4 4 20.1 12.6 69 Select Global Equity Smaller Co Funds Standard Life Global Small Cap Equity 3.1 G R 3 0 3 4 1 90 Global Equity Smaller Co Funds Vanguard Global Small Cap Equity 2.9 MSCI World Small Cap R 1.3 4 2 3 16.1 91 SelectGlobal Equity Smaller Co Funds Invesco Perpetual Global Small Cap Equity 2.9 G B R 3 0.8 3 3 2 14.9 10.9 128 Select Japanese Funds Schroder Tokyo 3.8 B G R 3 0.8 3 2 4 15.6 7.6 145 Japanese Funds Lindsell Train Japanese Equity 4.5 G S 5 1.3 4 4 4 18.9 3.4 137 SelectJapanese Funds Aberdeen Japan Equity 4.1 G R 4 0.7 4 2 4 16.9 8.1 131 Japanese Funds Man GLG Japan Core Alpha 4.5 V G R 1 1.4 1 4 4 14.4 9.2 129 SelectJapanese Funds Legg Mason Japan Equity 6.5 B 5 0 4 4 1 31.7 10.2 124 SelectJapanese Funds Jupiter Japan Income 3.9 B S 3 3 3 4 2 14.2 6.8 118 SelectJapanese Funds Blackrock Japan Tracker 3.7 S R 1.5 2 2 3 14 5.5 103 SelectJapanese Funds Vanguard Japan Stock Index 3.6 S R 1.4 2 2 2 13.6 95 Japanese Funds Legal & General Japan Index 3.8 R 1.2 2 3 3 13.9 5.5 85 Japanese Funds Polar Capital Japan 4.1 V S 1 1 1 4 1 10.3 67
ESTATE CAPITAL INVESTMENT PORTFOLIOS SHORTLIST

ESTATE CAPITAL INVESTMENT PORTFOLIOS OVERVIEW 11 EDITION 26 Winter & Spring 2017
Sector Fund Group Fund Name Volatility Tracker Equity Bond Analysis Ratings RSM Crown Income 1Y 2Y 3Y 5Y 10Y Total Short 3 year Index Style Style Morning * Ratings Yield Quartile quartile quartile AGR AGR Score List
Japanese Smaller Co Funds Baillie Giff ord Japanese Smaller Co 4.7 G 4 0.4 4 4 3 25.3 11.1 116 Japanese Smaller Co Funds CF Morant Wright Japan 3.8 B S 3 0.8 3 4 2 15.1 8.1 109 Select
North American Funds Schroder US Mid Cap 3.3 B S R 4 0 4 4 2 19.4 13.2 159 SelectNorth American Funds Dodge & Cox Worldwide US Stocks 2.9 V G R 3 0 4 1 4 20.1 140 SelectNorth American Funds Old Mutual North American Equity 3.5 B B R 3 0.4 3 4 4 20.6 11.2 140 SelectNorth American Funds Legal & General US Index 3.1 FTSE World USA Index G R 1.6 3 3 4 19.1 11 136 SelectNorth American Funds Blackrock North American Equity Tracker 3.2 FTSE North America Index G R 1.6 3 2 3 18.1 11.1 129 North American Funds Vanguard US Equity Index 2.9 S&P US All Share G R 1.3 4 2 3 19.3 124 SelectNorth American Funds JP Morgan US 3.7 B S R 1 0.8 1 3 3 17.5 9.9 113 North American Funds Axa Framlington American Growth 3.9 G B R 2 0 1 4 2 15.9 11.6 110 North American Funds T. Rowe Price US Blue Chip Equity 3.9 B S 3 0 1 4 3 20.6 12.8 105 North American Funds HSBC American Index 3.5 S&P 500 Index G 1.6 3 3 3 19.1 10.6 104 SelectNorth American Funds Legg Mason Clear Bridge US Aggressive Growth 3.4 G S R 1 0 1 2 3 15.3 5.7 99 North American Funds Netixis Loomis Sayles US Equity Leaders 3.6 G S 4 0.2 4 4 2 97 North American Funds GAM North American Growth 3.8 B B 1 0.3 4 1 1 16.5 10.9 77 North American Funds Blackrock US Equity Tracker 3.3 FTSE North America Index R 1.6 3 3 4 76 North American Funds Artemis US Extended Alpha G R 0 4 4 70 North American Funds Franklin US Opportunities 4.1 V B 2 0 1 4 2 16.9 69 North American Funds Artemis US Select G R 0.2 1 4 53 North American Income Funds JP Morgan US Equity Income 3.4 V S R 2 1.9 3 2 2 18 124 SelectNorth American Income Funds Legg Mason Clear Bridge US Equity Income 3.2 V B 1 1.8 3 1 2 16 69 North American Smaller Co Funds T Rowe Price US Smaller Companies 3.7 B 5 0 4 3 4 19.9 12.9 117 SelectNorth American Smaller Co Funds Schroder US Smaller Companies 3.5 G S 3 0.1 3 4 4 17.8 12.2 117 SelectNorth American Smaller Co Funds Legg Mason Royce US Smaller Co Opps 4.2 B S R 1 0 4 1 1 16.6 9.4 114 Property Securities Funds Aberdeen Property Shares 3.6 R 5 2 1 4 2 12.8 -1 118 Property Securities Funds Blackrock Global Property Securities Tracker 4.1 Global REIT Equity Tracker R 2.1 4 2 3 14.3 93 SelectProperty Securities Funds First State Global Property Securities 3.4 R 3 1.9 3 4 3 12.9 7.4 124 SelectProperty Securities Funds Schroder Global Real Estate Securities 2.4 R 4.5 4 1 1 10.7 93 Property Securities Funds Standard Life Global REIT 3.7 R 1 1.6 1 3 3 7.8 78 Property Funds Aberdeen UK Property Feeder 1.7 R 2.4 1 4 4 4.5 77 Property Funds Aviva Property Trust 1.2 R 2.1 1 1 3 3.9 -1.7 59 Property Funds Henderson UK Property PAIF Feeder 1.3 R 3.3 1 3 3 5.6 -0.1 76 SelectProperty Funds L&G UK Property Feeder 1.9 R 2.7 1 2 2 3.7 65 Property Funds M&G Property Portfolio 1.9 R 3.2 1 3 4 4.4 0.6 77 SelectProperty Funds Threadneedle UK Property Trust 1.2 R 6 1 3 4 4.3 90 Select India Funds Goldman Sachs India Equity 5.6 G S R 4 19.7 102 SelectIndia Funds Franklin India 5.3 G S 3 0 14.3 13.7 72 SelectIndia Funds Aberdeen Global Indian Equity 5.3 G S 3 0 14.2 13.5 72 India Funds Jupiter India 6 G B 5 0.3 15.7 67 SelectIndia Funds Fidelity India Focus 5.3 G S 3 0 13 57 India Funds Stewart Indian Subcontinent 4.7 G B 5 0.2 51 Select Latin America Funds Aberdeen Latin America Equity 7.7 B S 3 1.2 2.3 52 SelectLatin America Funds Henderson Latin America 6.7 B 4 2.1 0.2 7 50 Latin America Funds Invesco Perpetual Latin America 6.9 B R 3 1.4 -0.6 6.2 67 SelectLatin America Funds Neptune Latin America 6.4 B 4 0.9 2.9 39 Latin America Funds Threadneedle Latin America 7.2 B 3 1.5 -1.7 5.5 35 Latin America Funds Stewart Latin America B R 0 Soft Close Russia Funds Neptune Russia and Greater Russia 8.1 B B R 3 1.9 -1.4 3 75 Russia Funds Baring Russia Equity 7.5 B 3 0 1.9 0.7 27 Specialist Funds - Health Care AXA Framlington Biotech 7.7 G 1 0 27.7 16.1 52 SelectSpecialist Funds - Health Care AXA Framlington Health 4.2 G 3 0.2 19.5 12.6 57 SelectSpecialist Funds - Health Care Polar Capital Healthcare Opportunities 4.7 G 4 0 25.7 58 Specialist Funds - Health Care Schroders Global Healthcare 3.9 G 3 0.7 1 3 4 20 12.4 86 Select Specialist Funds - Precious Metal Black Rock Gold & General 11.3 V G R 3 0.4 -6.4 4.8 84 SelectSpecialist Funds - Precious Metal Old Mutual Gold & Silver V 0
ESTATE CAPITAL INVESTMENT PORTFOLIOS SHORTLIST

Financial Advice & Wealth Management 12
Sector Fund Group Fund Name Volatility Tracker Equity Bond Analysis Ratings RSM Crown Income 1Y 2Y 3Y 5Y 10Y Total Short 3 year Index Style Style Morning * Ratings Yield Quartile quartile quartile AGR AGR Score List
ESTATE CAPITAL INVESTMENT PORTFOLIOS SHORTLIST
Specialist Funds - Resources First State Global Resources 7.3 V S R 5 1.3 4 1 1 -5.2 3.7 125 SelectSpecialist Funds - Resources Investec Enhanced Natural Resources 4.6 B R 5 1.5 0.5 78 Specialist Funds - Resources Guinness Global Energy 6.1 V S 3 0 4 1 1 1 75 Specialist Funds - Resources JP Morgan Natural Resources 7.7 B B R 3 1.6 -9.3 -0.1 63 SelectSpecialist Funds - Resources Black Rock World Mining 8.9 S 2 0 -9.6 -0.3 26 Specialist Funds - Resources Investec Global Energy 6.3 B 1 2.1 -2.1 3.2 20 Specialist Funds - Financial Jupiter Financial Opportunities 3.2 B R 3 1.1 13.1 6.2 79 Select Specialist Funds - Agriculture Sarasin Food and Agriculture Opps 3.1 B B 1 1.5 9.9 35 Short Term Money Markets Standard Life Short Term Money Markets 0 R 3 0 2 2 2 0 0.8 79 Short Term Money Markets Blackrock Cash 0 2 0.2 4 4 4 0.3 1.1 66 SelectShort Term Money Markets Fidelity Cash 0 3 0 3 3 3 0.1 1 61
Targeted Absolute Return Newton Real Return 1.5 V R 4 2.3 4.3 6 84 Targeted Absolute Return Blackrock UK Absolute 1.4 B R 4 0 3.6 4.1 70 Targeted Absolute Return Threadneedle Credit Opportunities 0.7 N R 3 2 3.5 68 Targeted Absolute Return Standard Life GARS 1.2 N R 2 1.3 3.7 56 Targeted Absolute Return Old Mutual Global Equity Absolute Return 1.1 B R 2 0 6.6 53 SelectTargeted Absolute Return Henderson UK Absolute Return 1 V 5 0.3 7 49 Targeted Absolute Return Odey Absolute Return 3.4 B 2 0 14 30 Global Fixed interest Funds Aviva Investors Global High Yield Bond 2.4 5 5.3 4 4 4 13.1 128 SelectGlobal Fixed interest Funds Newton International Bond 3.1 B R 3 0.8 4 3 2 5.4 7.7 121 Global Fixed interest Funds Schroder Global High Yield Bond 2.4 5 1.5 4 4 4 12.9 10.8 119 SelectGlobal Fixed interest Funds Schroder Global Corporate Bond 2.8 5 1.5 4 4 4 10.8 9.8 116 SelectGlobal Fixed interest Funds Templeton Global Bond 1.9 S R 1 5.4 1 1 4 2.3 105 Global Fixed interest Funds Loomis Sayles Multi Select Income 2.6 G 2 1.5 4 2 3 10.7 102 SelectGlobal Fixed interest Funds Invesco Perpetual Global Bond 1.4 B R 2 1.3 2 3 2 5.1 6.5 102 Global Fixed interest Funds PIMCO GIS Global Bond GBP 1.4 B 2 5.2 3 3 4 6.5 97 Global Fixed interest Funds Blackrock Overseas Corporate Bond 2.6 Barclays Global Agg Index B R 2 3 3 3 8.1 94 SelectGlobal Fixed interest Funds Vanguard Global Bond Index 0.8 Barclays Global Agg Index S R 1.6 1 4 4 4.2 92 Global Fixed interest Funds Royal London Global High Yield Bond 1.4 3 5.1 4 4 1 92 SelectGlobal Fixed interest Funds Templeton Global Total Return Bond 1.8 B R 1.8 3.6 1 1 3 2.7 91 Global Fixed interest Funds M&G Global High Yield Bond 1.6 B 3 3.5 2 2 2 6.5 5 87 Global Fixed interest Funds T Rowe Price Global High Yield Bond 2.5 4 1.5 4 3 4 84 Global Fixed interest Funds PIMCO GIS US High Yield Bond GBP 1.6 2 5.4 4 2 4 83 SelectGlobal Fixed interest Funds Royal London Global Short Duration Bond 0.4 3 6.4 1 4 2 82 SelectGlobal Fixed interest Funds Blackrock Overseas Government Bond 3.1 Barclays Global Agg Index R 0.8 4 3 1 5.5 78 SelectGlobal Fixed interest Funds Aberdeen Global Select High Yield Bond 1.7 3 4.5 1 1 3 5.2 3.9 72 European Fixed interest Funds Aberdeen Global Select European High Yield Bond 2.3 5 4.3 4 2 1 10.1 8.4 114 SelectEuropean Fixed interest Funds AXA European High Yield Bond 1.2 4 3.8 2 4 1 8.4 3.8 93 SelectEuropean Fixed interest Funds Threadneedle European High Yield Bond 2.4 B 3 3.4 3 1 1 7.2 82 European Fixed interest Funds M&G European Corporate Bond 2.3 B 3 1.5 2 1 1 5.8 7.2 73 European Fixed interest Funds PIMCO GIS Euro Income Bond GBP 2.4 2 4.1 3 1 1 6.2 67 Emerging Mkts Fixed interest Funds Pictet Global Emerging Debt 3.1 B 5 3 4 4 4 12.2 12.6 138 SelectEmerging Mkts Fixed interest Funds First State Emerging Market Bond 1.5 R 4 4.1 1 3 4 2.6 111 Emerging Mkts Fixed interest Funds PIMCO GIS Emerging Mkts Bond GBP 3.2 3 4.3 4 3 3 10.2 10.4 108 SelectEmerging Mkts Fixed interest Funds Templeton Emerging Markets Bond GBP 2.4 B 2 9.5 2 1 3 3.2 6.1 105 Emerging Mkts Fixed interest Funds L&G Emerging Market Government Bond US$ 3.1 R 3.8 3 4 3 89 Emerging Mkts Fixed interest Funds Investec Emerging Mkts Local Currency Debt 4.1 B 2 5.5 2 1 2 3.2 77 Emerging Mkts Fixed interest Funds L&G Emerging Market Government Bond LC R 30 Select UK Gilt Funds Newton Long Gilt 3.6 5 1.9 4 4 4 9.2 7.9 115 UK Gilt Funds Vanguard UK Government Bond Index 2.3 FTSE Actuaries Gilt Index G R 1.6 3 3 3 5.7 110 SelectUK Gilt Funds Blackrock UK Gilts All Stock Tracker 2.1 FTSE Actuaries Gilt Index S R 1.4 3 3 3 4.7 5.2 103 UK Gilt Funds Vanguard UK Long Duration Gilt Index 4 FTSE Actuaries Gilt Index R 1.5 4 4 4 8.3 94 UK Gilt Funds M&G Gilt and Fixed Interest Income 2.1 R 2 0.8 3 3 1 4.4 5.3 92 UK Gilt Funds Schroder Gilt and Fixed Interest 2.1 R 2 2.1 2 2 2 4.1 4.5 89 UK Gilt Funds L&G All Stock Gilt Index Trust 2.1 FTSE Actuaries Gilt Index B R 1.5 2 3 3 4.5 5.1 87 UK Gilt Funds Royal London UK Government Bond Trust 1.9 S 2 2.3 2 1 1 4.2 5 75 UK Gilt Funds Royal London Short Duration Gilt 0 R 0.7 1 1 44

Sector Fund Group Fund Name Volatility Tracker Equity Bond Analysis Ratings RSM Crown Income 1Y 2Y 3Y 5Y 10Y Total Short 3 year Index Style Style Morning * Ratings Yield Quartile quartile quartile AGR AGR Score List
ESTATE CAPITAL INVESTMENT PORTFOLIOS SHORTLIST
ESTATE CAPITAL INVESTMENT PORTFOLIOS OVERVIEW 13 EDITION 26 Winter & Spring 2017
UK Index Linked Gilt Funds AXA Sterling Index Linked Bond 3.4 4 0 4 4 4 11.5 92 SelectUK Index Linked Gilt Funds L&G All stocks Index Linked Gilt Index 3.3 FTSE Actuaries I L Gilt Index B R 0.2 2 2 2 10.2 8.4 84 SelectUK Index Linked Gilt Funds Newton Index Linked Bond 3.5 2 0.7 4 3 3 11.3 9.2 82 UK Index Linked Gilt Funds Blackrock Index Linked Gilt Tracker 3.7 FTSE Actuaries I L Gilt Index R 0.3 4 4 4 80 SelectUK Index Linked Gilt Funds Vanguard Infl ation Linked Gilt 3.2 Barclays UK I L Gilt Index R 0 3 3 2 10.4 74 UK Index Linked Gilt Funds M&G Index Linked Bond 3.3 1 0 2 4 1 10.6 8.7 57 UK Index Linked Gilt Funds Henderson Index Linked Bond 3.6 1 0.1 3 2 1 11.1 9 57 UK Corporate Bond Funds Fidelity Money Builder Income 1.6 G R 4 2.7 3 4 3 6.4 5.5 157 SelectUK Corporate Bond Funds Royal London Corporate Bond 1.6 S R 4 3.3 3 3 4 7.8 5 149 SelectUK Corporate Bond Funds Kames Investment Grade Bond 1.4 S R 4 2.6 2 4 4 7.7 5.6 144 SelectUK Corporate Bond Funds M&G Corporate Bond 1.5 S R 3 2.8 3 2 3 6.6 6.6 133 SelectUK Corporate Bond Funds Kames Ethical Corporate Bond 1.4 B R 4 2.7 2 4 2 6.5 4.3 128 UK Corporate Bond Funds Kames Sterling Corporate Bond 1.4 S R 3 2.5 2 3 2 7.2 4.6 126 UK Corporate Bond Funds Invesco Perpetual Corporate Bond 1 G R 2 3.2 1 2 1 6.7 5.5 120 UK Corporate Bond Funds Royal London Sterling Credit 1.6 R 4 3.2 2 4 4 114 UK Corporate Bond Funds M&G Strategic Corporate Bond 1.4 S R 2 2.4 2 1 2 6.1 7.2 111 UK Corporate Bond Funds Vanguard UK Inv Grade Corporate Bond Tracker 1.8 Iboxx Sterling Bond Index B R 2.7 4 4 4 7.3 109 SelectUK Corporate Bond Funds Blackrock Corporate Bond Tracker 1.8 Iboxx Sterling Bond Index B R 2.3 4 3 2 6.8 98 SelectUK Corporate Bond Funds L&G Sterling Corporate Bond 1.8 Iboxx Sterling Bond Index R 1.9 3 4 2 78 UK Corporate Bond Funds AXA Sterling Credit Short Duration Bond 0.3 R 2 1.4 1 1 1 2.7 68 UK Corporate Bond Funds Pimco UK Corporate Bond 1.8 B 0 4 4 4 8.4 66 SelectUK Corporate Bond Funds L&G Short Dated Sterling Corporate Bond Iboxx Sterling Bond Index R 2.1 1 1 51
UK High Yield Funds Baillie Giff ord High Yield Bond 1.6 B R 3 3.6 3 2 3 7.9 6.9 129 UK High Yield Funds Threadneedle High Yield Bond 1.2 B R 3 4 2 3 3 7 5.7 127 SelectUK High Yield Funds Schroder Monthly High Income 1.3 5 4.7 4 4 4 9 6.1 127 SelectUK High Yield Funds Invesco Perpetual High Yield 1.3 R 3 3.6 1 3 3 9.3 6.7 112 UK High Yield Funds Royal London Short Duration Global High Yield 0.4 R 3 6.4 1 4 2 112 SelectUK High Yield Funds Standard Life Higher Income 1.2 5 3.8 3 3 2 7.5 5.2 106 UK High Yield Funds Kames High Yield Bond 1.5 R 2 4.3 1 2 4 6.2 6.3 102 UK Strategic Bond Funds GAM Star Credit Opportunities 1.3 R 5 4.9 4 4 4 13 156 SelectUK Strategic Bond Funds Royal London Ethical Bond 1.5 R 5 3.2 4 4 4 7.5 142 SelectUK Strategic Bond Funds Royal London Sterling Extra Yield Bond 1.1 R 3 6.3 4 3 4 10.6 140 SelectUK Strategic Bond Funds Henderson Strategic Bond 1 S R 2 3.8 2 4 3 6.8 5.6 131 UK Strategic Bond Funds Artemis High Income 1.4 S R 1 4.8 2 3 4 9.7 5.6 129 SelectUK Strategic Bond Funds Fidelity Strategic Bond 1.2 S R 2 2.6 3 3 3 6 6.3 127 SelectUK Strategic Bond Funds Kames Strategic Bond 1.1 S R 1 2.2 4 4 2 5.3 4.4 123 UK Strategic Bond Funds Artemis Strategic Bond 1.1 S R 1 3.5 3 3 2 7.1 5.4 122 UK Strategic Bond Funds AXA Framlington Managed Income 1.2 S 2 4.3 4 3 4 8.8 4.2 115 SelectUK Strategic Bond Funds PIMCO GIS Diversifi ed Income 2.8 R 2 4.1 4 3 4 111 UK Strategic Bond Funds Invesco Perpetual Monthly Income Plus 1.1 S R 1 4.4 3 2 7.6 6.1 110 UK Strategic Bond Funds Henderson Fixed Interest Monthly Income 1.1 S 2 4.4 3 4 3 7 4.1 109 SelectUK Strategic Bond Funds M&G Optimal Income 1.1 S R 1 2.1 3 1 3 6.3 103 UK Strategic Bond Funds Twenty Four Dynamic Bond 1.2 R 1 4 1 4 4 7.9 96 UK Strategic Bond Funds Loomis Sayles Strategic Income 2.2 G 1 3 4 1 4 89 UK Strategic Bond Funds Royal London Short Duration Credit Bond 1.1 R 3 2.8 1 3 86 UK Strategic Bond Funds Legal & General Dynamic Bond 0.7 R 1 3.6 1 2 2 4.8 79 UK Strategic Bond Funds Man GLG Strategic Bond 1.1 B R 1 2.4 1 1 4 78 UK Strategic Bond Funds M&G Infl ation Linked Corporate Bond 0.9 1 0.3 1 1 1 2.5 24 UK Equity Funds Lindsell Train UK Equity 3.1 G G R 5 2.1 4 4 4 16.8 12.0 187 SelectUK Equity Funds JOHCM UK Opportunities 2.4 B S R 5 2.9 4 3 4 11.6 8.6 169 SelectUK Equity Funds Liontrust Special Situations 2.7 G B R 5 2 4 4 3 14.4 12.4 163 SelectUK Equity Funds Old Mutual UK Mid Cap 4.2 G S R 3 1.1 3 4 4 19.7 11.8 153 SelectUK Equity Funds Jupiter UK Special Situations 2.7 B S R 3 2.2 4 1 4 13.4 8.9 143 UK Equity Funds Investec UK Alpha 2.8 V B R 4 2.2 2 3 4 15.1 8.3 138 UK Equity Funds Schroder Recovery 3.2 V S R 2 2.1 4 1 4 15.4 8.8 137 UK Equity Funds AXA Framlington UK Select Opportunities 3.3 G G R 1 2.1 4 3 2 9.3 7.2 135 UK Equity Funds JOHCM UK Dynamic 3 B B R 3 4.1 4 1 4 14.0 135 SelectUK Equity Funds Artemis Special Situations 2.7 B G R 2 2.2 2 2 3 10.8 6.8 131 UK Equity Funds Royal London Sustainable Leaders 3 B B 5 2.3 3 4 4 15.3 7.6 126 SelectUK Equity Funds Investec UK Special Situations 2.9 V G R 1 2.5 3 1 2 9.7 6.8 123 UK Equity Funds Black Rock UK 3.2 B B R 3 1.8 2 4 2 9.8 4.6 119 UK Equity Funds Blackrock UK Equity Tracker 2.9 FTSE All Share Index S R 3.3 4 2 3 9.4 5.4 119 Select

Financial Advice & Wealth Management 14
UK Equity Funds Franklin UK Mid Cap Growth 3.9 B S R 1 1.7 1 4 3 13.6 11.1 119 UK Equity Funds Fidelity Special Situations 3.2 V B R 1 1.9 4 3 1 14.5 8.1 118 UK Equity Funds L&G UK Index 2.8 FTSE All Share Index S R 3.7 3 2 3 9.0 5.4 115 SelectUK Equity Funds Vanguard FTSE UK All Share Equity Index 2.7 FTSE All Share Index S R 3.3 4 2 3 9.4 114 UK Equity Funds Old Mutual UK Alpha 3.3 B S R 1 4 2 1 2 10.5 3.5 112 UK Equity Funds Kames UK Equity 2.9 B B R 2 0 3 3 3 9.7 6.5 108 UK Equity Funds Schroder UK Alpha Plus 2.8 B R 2 2.4 3 2 2 10.9 7.5 106 UK Equity Funds Jupiter UK Growth 4.4 B B R 1 1.9 1 4 4 12.1 5.9 106 UK Equity Funds Eden Tree Amity UK 2.6 B R 2 2.5 1 4 2 11.2 6.4 102 UK Equity Funds Standard Life UK Ethical 3.9 B B R 1 1.8 1 4 1 11.2 5.8 98 UK Equity Funds GAM UK Diversifi ed 2.7 V S 2 1.4 4 1 4 11.9 6.1 97 UK Equity Funds Invesco Perpetual UK Growth 3.3 V S 2 2.8 2 2 3 13.0 5.6 95 UK Equity Funds Standard Life UK Equity Unconstrained 4.3 B R 1 1 1 4 1 13.3 11.2 92 UK Equity Funds Kames Ethical Equity 3.7 B S 2 0 1 4 3 12.6 7.4 84 UK Equity Funds Blackrock 100 UK Equity Tracker 3 R 3.5 4 1 2 80 UK Equity Funds Blackrock Mid Cap UK Equity Tracker 3.2 FTSE 250 Index R 2.6 2 4 3 77 UK Equity Trust JOHCM UK Growth 2.9 B S 1 1.9 1 1 4 12.1 6.8 74 UK Equity Funds HSBC FTSE All Share Index 2.9 FTSE All Share Index 3.6 4 2 2 8.9 5.1 68 UK Equity Funds HSBC FTSE 100 Index 3 FTSE 100 Index 3.8 4 1 2 8.0 4.6 64 SelectUK Equity Funds HSBC FTSE 250 Index 3.2 FTSE 250 Index 2.8 1 4 3 13.1 7.7 63 SelectUK Equity Funds Artemis UK Select 3.6 B 1 2 1 4 3 10.2 5.7 62
UK Equity Income Funds Troy Trojan Income 2.4 B S R 5 3.6 4 4 4 11.9 8.9 177 Soft CloseUK Equity Income Funds Franklin UK Equity Income 2.6 V S R 5 5.4 4 2 4 12.1 6.7 176 SelectUK Equity Income Funds Royal London UK Equity Income 2.7 V S R 5 3.8 4 2 4 14.4 8.2 172 SelectUK Equity Income Funds Threadneedle UK Equity Income 2.6 V S R 5 3.8 4 2 4 13.0 8.2 170 SelectUK Equity Income Funds Rathbone Income 2.4 V B R 5 3.7 2 3 4 12.4 5.7 149 UK Equity Income Funds Evenlode Income 2.6 B R 5 3.4 4 3 4 14.9 146 UK Equity Income Funds Invesco Perpetual High Income 2.4 V B R 5 3.2 1 4 4 11.5 7.5 145 UK Equity Income Funds Threadneedle UK Equity Alpha Income 2.7 B B R 4 4.6 3 1 3 12.6 7.9 144 UK Equity Income Funds Invesco Perpetual UK Strategic Income 2.3 B B R 5 3.3 1 3 4 12.7 8.1 143 UK Equity Income Funds Miton Multi Cap Income 2.3 B R 5 4.1 1 4 4 17.2 138 SelectUK Equity Income Funds Invesco Perpetual Income 2.4 V B R 4 3.2 1 4 4 11.2 7.2 136 UK Equity Income Funds JOHCM UK Equity Income 3 V S R 2 4.6 3 1 2 11.9 7.7 135 Soft CloseUK Equity Income Funds Old Mutual UK Equity Income 2.9 B B R 3 4.4 2 2 4 12.5 6.2 133 UK Equity Income Funds Schroder Income 3.2 V B R 2 3.9 4 1 3 13.6 7.8 131 UK Equity Income Funds Marlborough Multi Cap Income 3 B R 4 4.8 1 4 4 14.6 131 SelectUK Equity Income Funds Artemis Income 2.6 B B R 3 4 3 1 3 11.0 6.8 130 UK Equity Income Funds Schroder Income Maximiser 2.8 V R 2 6.6 4 1 2 11.0 6.4 128 SelectUK Equity Income Funds F&C Responsible UK Income 2.6 V R 4 4 1 4 2 11.2 5.2 124 UK Equity Income Funds Unicorn UK Income 3 B R 2 4.9 1 4 1 14.3 10.2 119 SelectUK Equity Income Funds Neptune Income 3.1 B R 2 4.4 4 2 1 8.9 5.4 116 UK Equity Income Funds Vanguard FTSE UK Equity Income Index Fund 2.8 FTSE UK Equity Inc Index S R 4.6 3 1 2 9.1 108 UK Equity Income Funds Schroder UK Alpha Income 2.7 V B UR 3 4.8 2 1 4 12.0 7.8 102 UK Equity Income Funds Woodford Equity Income 2.3 B S R 3.6 1 4 90 Select UK Smaller Co Funds Old Mutual UK Smaller Companies 3.6 G G R 3 0.9 4 3 2 17.5 11.3 157 SelectUK Smaller Co Funds Liontrust UK Smaller Companies 3.2 B R 5 0.3 4 4 4 19.9 12.5 152 SelectUK Smaller Co Funds Artemis UK Smaller Companies 2.6 G S R 3 1.6 4 2 2 12.8 6.4 137 UK Smaller Co Funds Standard Life UK Smaller Companies 3.5 G S R 2 1.2 2 4 1 12.9 10.8 126 RestrictionUK Smaller Co Funds Fidelity UK Smaller Companies 2.6 B R 4 1.4 3 2 3 20.5 122 Soft CloseUK Smaller Co Funds Marlborough Special Situations 3.5 B 4 1.1 4 3 4 16.3 12.7 111 SelectUK Smaller Co Funds BlackRock UK Smaller Companies 3.3 G R 2 1.2 3 3 1 14.2 9.0 107 UK Smaller Co Funds AXA Framlington UK Smaller Companies 3.2 G 4 1 2 4 4 18.2 8.4 100 UK Smaller Co Funds Schroder UK Dynamic Smaller Companies 3.3 B R 1 0.7 3 1 1 16.4 12.5 94 UK Smaller Co Funds Aberforth UK Smaller Companies 3.3 V S 2 3.2 1 1 4 14.8 7.0 92 UK Smaller Co Funds Schroder UK Smaller Companies 3.2 B 3 1.1 3 3 2 16.7 8.7 89 UK Smaller Co Funds Investec UK Smaller Companies 4.1 B R 1 1.1 1 1 4 14.3 11.9 88 Restriction
Sector Fund Group Fund Name Volatility Tracker Equity Bond Analysis Ratings RSM Crown Income 1Y 2Y 3Y 5Y 10Y Total Short 3 year Index Style Style Morning * Ratings Yield Quartile quartile quartile AGR AGR Score List
ESTATE CAPITAL INVESTMENT PORTFOLIOS SHORTLIST

ESTATE CAPITAL INVESTMENT PORTFOLIOS OVERVIEW 15 EDITION 26 Winter & Spring 2017
ESTATE CAPITAL INVESTMENT PORTFOLIOS PURCHASE LIST
Sector Fund Group Fund Name Volatility Equity Bond MStar RSM Crown Income 1Y 2Y 3Y 1YG 3Y 5Y 10Y 3Y 3Y Info 3Y Charges Selection 3 year Style Style Analysis Rating Yield Growth Growth Growth AGR AGR AGR Alpha Beta Ratio Risk TER Ranking Ratings
Asia Pacifi c Funds Stewart Asia Pacifi c Leaders 3.5 LG S R 5 1.1 1 4 4 20.36 11.90 12.90 12.50 3.11 0.69 0.48 L 0.90 1Asia Pacifi c Funds Stewart Asia Pacifi c Sustainability 3.3 LG S 5 0.8 3 4 4 26.63 15.32 17.60 14.73 6.13 0.61 0.86 L 1.01 SCAsia Pacifi c Funds Fidelity Emerging Asia 4.2 LG R 5 0.8 3 4 4 27.34 16.31 12.60 5.42 0.92 1.34 A 1.08 1Asia Pacifi c Funds Veritas Asian 3.6 LG S 5 0.2 4 4 4 26.53 15.42 14.20 12.60 6.48 0.79 1.12 L 1.24 1Asia Pacifi c Funds JOHCM Asia ex Japan 3.5 LG B R 3 0.3 3 4 3 27.46 11.75 13.90 2.98 0.62 0.32 L 1.04 2Asia Pacifi c Funds JOHCM Asia ex Japan Small & Mid 3.7 MG R 5 0 1 4 4 14.40 16.12 16.20 7.37 0.65 0.93 L 1.49 2Asia Pacifi c Income Funds Schroder Asian Income 3.6 LV B R 4 3.8 3 3 3 30.27 11.08 13.00 12.10 0.91 0.83 0.20 L 0.93 1 China Funds First State Greater China Growth 4.7 LB G R 3 1.2 3 3 1 29.38 11.05 13.70 15.50 -1.02 0.91 -0.26 L 1.07 3China Funds Invesco Perpetual Hong Kong & China 4.9 LB R 5 1.5 1 4 2 22.11 9.95 15.10 12.70 -0.32 0.83 -0.08 L 0.94 2China Funds Henderson China Opportunities 5.1 LG B 5 1.4 4 3 4 31.09 14.16 13.50 13.30 3.65 0.84 0.55 L 0.89 1China Funds Fidelity China Consumer 5.1 LB R 4 1.1 3 3 3 29.44 12.42 15.50 0.15 1.04 0.00 A 1.06 2China Funds Fidelity China Focus 5.8 LV B 4 1.4 3 4 2 27.31 14.98 13.60 3.69 0.95 0.76 A 1.15 1 European Funds Blackrock European Dynamic 3.1 LG S R 5 1.5 2 4 4 11.17 7.74 15.80 10.16 2.86 0.94 0.51 A 0.92 1European Funds Jupiter European 3.1 LG G R 5 0.5 1 4 4 3.05 9.21 15.60 10.41 4.17 0.91 0.60 A 1.03 2European Funds JOHCM Continental Europe 3.1 LB S R 5 0.2 3 3 4 12.08 7.49 13.40 7.66 2.61 0.95 0.65 A 0.69 1European Income Funds Blackrock Continental European Income 2.7 LB B 5 4.2 3 4 4 7.75 7.55 15.60 3.81 0.82 0.62 L 0.93 1European Income Funds Schroder European Alpha Income 3.5 LB R 5 3.3 4 3 4 15.56 8.97 2.70 1.01 0.35 H 0.93 2European Smaller Co Funds Standard Life European Smaller Co 3.5 MG R 5 0 3 4 2 13.10 11.86 20.00 2.84 0.99 0.53 H NA Global Emerging Market Funds Lazard Emerging Markets 5.2 LB S R 3 1.7 4 1 2 34.63 5.55 7.00 7.51 -0.78 1.06 -0.20 H 1.08 3Global Emerging Market Funds Schroder Global Emerging Markets 4.4 LB B 4 1.3 3 3 2 28.15 5.92 7.30 7.21 -0.44 0.93 -0.07 A 0.97 2Emerging Asia Fidelity Emerging Asia 4.2 LG R 5 0.8 3 4 4 27.34 16.31 12.60 5.42 0.92 1.34 A 1.08 1Global Emerging Market Funds Templeton Emerging Market Smaller Co 3.4 G B R 5 0 2 4 4 13.90 1.75 2 Global Equity Income Funds Newton Global Income 3 LV N R 4 3.1 4 4 3 27.98 14.19 15.10 10.12 2.32 0.92 0.52 A 0.79 1Global Equity Income Funds Artemis Global Income 3 LV B R 3 3.3 2 4 4 17.78 13.00 17.60 1.92 0.92 0.22 H 0.81 2Global Equity Income Funds Fidelity Global Dividend 2.8 LB R 4 2.9 4 4 4 21.22 13.00 2.28 0.82 0.47 L 0.98 2Global Equity Income Funds Schroder Global Equity Income 3.4 LV R 2 3.1 4 3 3 27.92 13.38 14.90 0.90 0.95 0.09 H 0.95 2 Global Equity Funds Fundsmith Equity 3.2 LG B R 5 0.8 4 4 4 28.27 19.07 21.60 7.54 0.90 1.43 A 0.97 1Global Equity Funds Artemis Global Growth 2.9 LV S R 4 1.8 2 4 4 19.71 14.75 17.10 8.24 0.92 1.01 0.20 A 0.86 3Global Equity Funds Fidelity Global Special Situations 3.4 LB S R 3 0.5 4 4 4 23.53 15.57 17.10 7.80 1.74 1.15 0.42 H 0.95 2Global Equity Funds First State Global Listed Infrastructure 3.4 LB B R 5 2.3 4 2 4 31.55 15.81 15.50 1.46 0.97 0.30 A 0.90 1Global Equity Funds Old Mutual Global Equity 3.2 LB R 4 0.6 3 4 4 25.82 15.84 19.50 9.62 1.61 1.08 0.37 A 1.00 2Global Equity Funds Linsdell Train Global Equity 3.1 LG 5 1.1 3 4 4 22.18 15.83 19.80 5.19 0.92 0.87 A 0.77 1Global Equity Smaller Co Funds Invesco Perpetual Global Small Cap Equity 2.9 MG N R 3 0.8 3 3 2 23.99 11.45 14.90 10.47 -1.93 0.98 -0.45 H NA Japanese Funds Lindsell Train Japanese Equity 4.5 LG S 5 1.3 4 4 4 29.04 19.03 18.90 3.40 7.86 0.74 0.64 L 0.91 1Japanese Funds Man GLG Japan Core Alpha 4.5 LV G R 1 1.4 1 4 4 27.59 15.76 14.40 9.20 -0.41 1.28 0.10 H 0.90 2Japanese Funds Legg Mason Japan Equity 6.5 MG 5 0 4 4 1 38.51 24.89 31.70 9.92 9.95 0.86 0.49 H 1.76 1Japanese Funds Jupiter Japan Income 3.9 LB N 3 3 3 4 2 24.13 15.11 14.20 6.80 0.79 1.06 0.26 H 0.99 1Japanese Smaller Co Funds CF Morant Wright Japan 3.8 MV S 3 0.8 3 4 2 25.98 15.58 15.10 8.10 0.21 1.10 0.16 H 1.15 2 North American Funds Schroder US Mid Cap 3.3 MG S R 4 0 4 4 2 36.43 20.61 19.40 13.20 1.72 0.93 0.21 A 0.91 1North American Funds Dodge & Cox Worldwide US Stocks 2.9 LV G R 3 0 4 1 4 42.11 19.43 20.10 10.26 -0.33 1.09 0.04 H 0.70 2North American Funds Old Mutual North American Equity 3.5 LG B R 3 0.4 3 4 4 31.92 20.00 20.60 11.20 0.20 1.05 0.06 A 1.00 1North American Income Funds JP Morgan US Equity Income 3.4 LV S R 2 1.9 3 2 2 31.77 17.30 18.00 -1.24 0.99 -0.28 A 0.93 2North American Smaller Co Funds T Rowe Price US Smaller Companies 3.7 SG 5 0 4 3 4 32.62 18.17 19.90 12.90 2.80 0.83 0.43 A 1.11 2North American Smaller Co Funds Schroder US Smaller Companies 3.5 SG S 3 0.1 3 4 4 35.51 18.14 17.80 12.20 1.96 0.77 0.17 L 0.92 1 Property Securities Funds First State Global Property Securities 3.4 MG N R 3 1.9 3 4 3 15.22 13.31 12.90 6.01 -0.83 0.87 -0.29 L 1.02 2Property Securities Funds Blackrock Global Property Securities Tracker 4.1 MB R 4 2.1 4 2 3 23.41 14.86 14.3 -0.62 0.99 -0.21 A 0.22 1Property Funds Henderson UK Property PAIF Feeder 1.3 MG R 3.3 1 3 3 -4.24 4.89 5.60 -0.50 L 0.84 1Property Funds L&G UK Property Feeder 1.9 MG R 2.7 1 2 2 0.68 8.20 3.70 3.04 L 0.75 2Property Funds M&G Property Portfolio 1.9 MG R 3.2 1 3 4 -6.99 4.46 4.40 -0.09 L 1.27 2Property Funds Threadneedle UK Property Trust 1.2 MG R 6 1 3 4 -5.22 5.54 4.30 L 0.81 1 India Funds Goldman Sachs India Equity 5.6 LG S R 4 0 17.40 25.70 19.70 10.19 1.03 2.02 H 1.35 2India Funds Franklin India 5.3 LG S 3 0 26.24 24.81 14.30 12.08 9.05 0.96 1.99 A 1.11 2India Funds Jupiter India 6 LG B 5 0.3 26.83 29.70 15.70 13.70 1.01 1.55 H 1.10 1India Funds Stewart Indian Subcontinent 4.7 LG B 5 0.2 23.23 24.93 15.41 10.42 0.77 1.42 L 1.24 SC Specialist Funds - Health Care AXA Framlington Biotech 7.7 MG 1 0 -2.65 16.54 27.70 16.10 -1.53 1.24 -0.11 H 0.83 1Specialist Funds - Health Care AXA Framlington Health 4.2 LG 3 0.2 9.71 15.59 19.50 12.60 -0.47 1.14 0.01 H 0.83 2Specialist Funds - Health Care Schroders Global Healthcare 3.9 LG 3 0.7 1 3 4 11.96 14.95 20.00 12.40 -0.91 1.04 -0.19 A 0.92 2Specialist Funds - Health Care Legal & General Global Health & Pharmacy Index 3.7 LG 4 1.3 1 4 4 13.25 15.82 20.1 12.6 0.16 1.03 0.08 A 0.31 1
ACTIVE INVESTMENT FUNDS
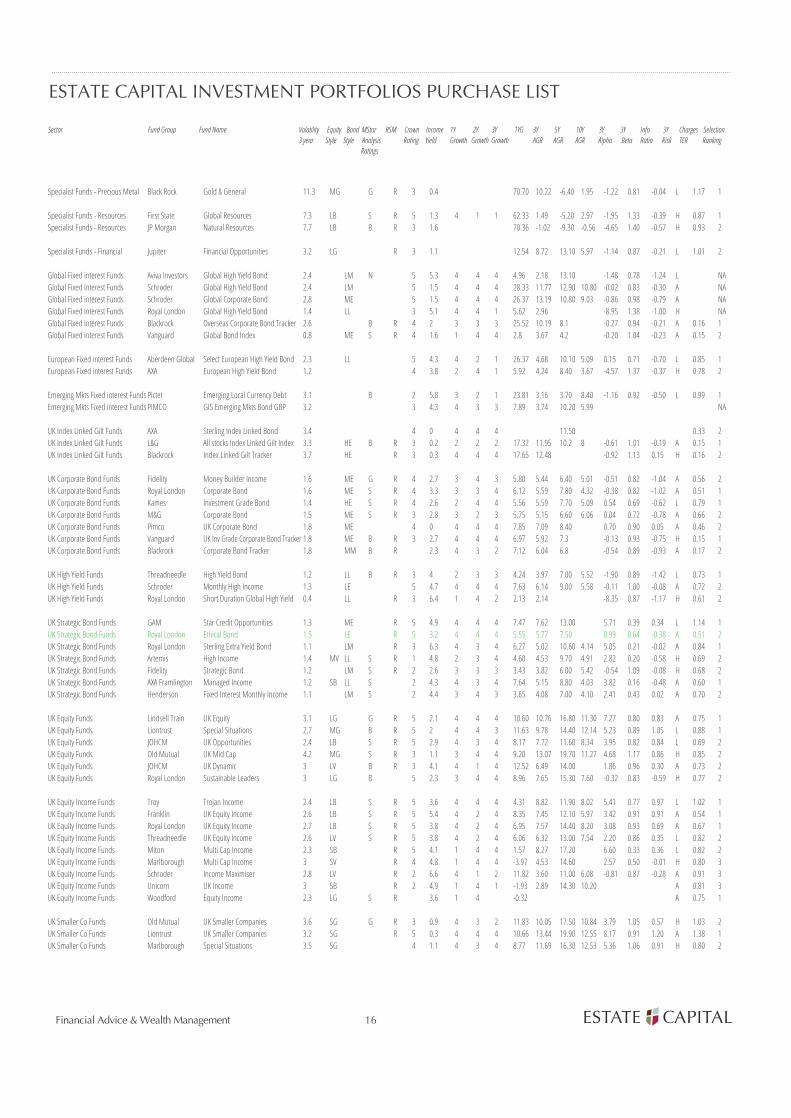
Sector Fund Group Fund Name Volatility Equity Bond MStar RSM Crown Income 1Y 2Y 3Y 1YG 3Y 5Y 10Y 3Y 3Y Info 3Y Charges Selection 3 year Style Style Analysis Rating Yield Growth Growth Growth AGR AGR AGR Alpha Beta Ratio Risk TER Ranking Ratings
ESTATE CAPITAL INVESTMENT PORTFOLIOS PURCHASE LIST
Financial Advice & Wealth Management 16
Specialist Funds - Precious Metal Black Rock Gold & General 11.3 MG G R 3 0.4 70.70 10.22 -6.40 1.95 -1.22 0.81 -0.04 L 1.17 1 Specialist Funds - Resources First State Global Resources 7.3 LB S R 5 1.3 4 1 1 62.33 1.49 -5.20 2.97 -1.95 1.33 -0.39 H 0.87 1Specialist Funds - Resources JP Morgan Natural Resources 7.7 LB B R 3 1.6 70.36 -1.02 -9.30 -0.56 -4.65 1.40 -0.57 H 0.93 2 Specialist Funds - Financial Jupiter Financial Opportunities 3.2 LG R 3 1.1 12.54 8.72 13.10 5.97 -1.14 0.87 -0.21 L 1.01 2 Global Fixed interest Funds Aviva Investors Global High Yield Bond 2.4 LM N 5 5.3 4 4 4 4.96 2.18 13.10 -1.48 0.78 -1.24 L NAGlobal Fixed interest Funds Schroder Global High Yield Bond 2.4 LM 5 1.5 4 4 4 28.33 11.77 12.90 10.80 -0.02 0.83 -0.30 A NAGlobal Fixed interest Funds Schroder Global Corporate Bond 2.8 ME 5 1.5 4 4 4 26.37 13.19 10.80 9.03 -0.86 0.98 -0.79 A NAGlobal Fixed interest Funds Royal London Global High Yield Bond 1.4 LL 3 5.1 4 4 1 5.62 2.96 -8.95 1.38 -1.00 H NAGlobal Fixed interest Funds Blackrock Overseas Corporate Bond Tracker 2.6 B R 4 2 3 3 3 25.52 10.19 8.1 -0.27 0.94 -0.21 A 0.16 1Global Fixed interest Funds Vanguard Global Bond Index 0.8 ME S R 4 1.6 1 4 4 2.8 3.67 4.2 -0.20 1.04 -0.23 A 0.15 2 European Fixed interest Funds Aberdeen Global Select European High Yield Bond 2.3 LL 5 4.3 4 2 1 26.37 4.68 10.10 5.09 0.15 0.71 -0.70 L 0.85 1European Fixed interest Funds AXA European High Yield Bond 1.2 4 3.8 2 4 1 5.92 4.24 8.40 3.67 -4.57 1.37 -0.37 H 0.78 2 Emerging Mkts Fixed interest Funds Pictet Emerging Local Currency Debt 3.1 B 2 5.8 3 2 1 23.81 3.16 3.70 8.40 -1.16 0.92 -0.50 L 0.99 1Emerging Mkts Fixed interest Funds PIMCO GIS Emerging Mkts Bond GBP 3.2 3 4.3 4 3 3 7.89 3.74 10.20 5.99 NA UK Index Linked Gilt Funds AXA Sterling Index Linked Bond 3.4 4 0 4 4 4 11.50 0.33 2UK Index Linked Gilt Funds L&G All stocks Index Linked Gilt Index 3.3 HE B R 3 0.2 2 2 2 17.32 11.95 10.2 8 -0.61 1.01 -0.19 A 0.15 1UK Index Linked Gilt Funds Blackrock Index Linked Gilt Tracker 3.7 HE R 3 0.3 4 4 4 17.65 12.48 -0.92 1.13 0.15 H 0.16 2 UK Corporate Bond Funds Fidelity Money Builder Income 1.6 ME G R 4 2.7 3 4 3 5.80 5.44 6.40 5.01 -0.51 0.82 -1.04 A 0.56 2UK Corporate Bond Funds Royal London Corporate Bond 1.6 ME S R 4 3.3 3 3 4 6.12 5.59 7.80 4.32 -0.38 0.82 -1.02 A 0.51 1UK Corporate Bond Funds Kames Investment Grade Bond 1.4 HE S R 4 2.6 2 4 4 5.56 5.59 7.70 5.09 0.54 0.69 -0.62 L 0.79 1UK Corporate Bond Funds M&G Corporate Bond 1.5 ME S R 3 2.8 3 2 3 5.75 5.15 6.60 6.06 0.04 0.72 -0.78 A 0.66 2UK Corporate Bond Funds Pimco UK Corporate Bond 1.8 ME 4 0 4 4 4 7.85 7.09 8.40 0.70 0.90 0.05 A 0.46 2UK Corporate Bond Funds Vanguard UK Inv Grade Corporate Bond Tracker 1.8 ME B R 3 2.7 4 4 4 6.97 5.92 7.3 -0.13 0.93 -0.75 H 0.15 1UK Corporate Bond Funds Blackrock Corporate Bond Tracker 1.8 MM B R 2.3 4 3 2 7.12 6.04 6.8 -0.54 0.89 -0.93 A 0.17 2 UK High Yield Funds Threadneedle High Yield Bond 1.2 LL B R 3 4 2 3 3 4.24 3.97 7.00 5.52 -1.90 0.89 -1.42 L 0.73 1UK High Yield Funds Schroder Monthly High Income 1.3 LE 5 4.7 4 4 4 7.63 6.14 9.00 5.58 -0.11 1.00 -0.08 A 0.72 2UK High Yield Funds Royal London Short Duration Global High Yield 0.4 LL R 3 6.4 1 4 2 2.13 2.14 -8.35 0.87 -1.17 H 0.61 2 UK Strategic Bond Funds GAM Star Credit Opportunities 1.3 ME R 5 4.9 4 4 4 7.47 7.62 13.00 5.71 0.39 0.34 L 1.14 1UK Strategic Bond Funds Royal London Ethical Bond 1.5 LE R 5 3.2 4 4 4 5.55 5.77 7.50 0.99 0.64 -0.38 A 0.51 2UK Strategic Bond Funds Royal London Sterling Extra Yield Bond 1.1 LM R 3 6.3 4 3 4 6.27 5.02 10.60 4.14 5.05 0.21 -0.02 A 0.84 1UK Strategic Bond Funds Artemis High Income 1.4 MV LL S R 1 4.8 2 3 4 4.60 4.53 9.70 4.91 2.82 0.20 -0.58 H 0.69 2UK Strategic Bond Funds Fidelity Strategic Bond 1.2 LM S R 2 2.6 3 3 3 3.43 3.82 6.00 5.42 -0.54 1.09 -0.08 H 0.68 2UK Strategic Bond Funds AXA Framlington Managed Income 1.2 SB LL S 2 4.3 4 3 4 7.64 5.15 8.80 4.03 3.82 0.16 -0.48 A 0.60 1UK Strategic Bond Funds Henderson Fixed Interest Monthly Income 1.1 LM S 2 4.4 3 4 3 3.65 4.08 7.00 4.10 2.41 0.43 0.02 A 0.70 2 UK Equity Funds Lindsell Train UK Equity 3.1 LG G R 5 2.1 4 4 4 10.60 10.76 16.80 11.30 7.27 0.80 0.83 A 0.75 1UK Equity Funds Liontrust Special Situations 2.7 MG B R 5 2 4 4 3 11.63 9.78 14.40 12.14 5.23 0.89 1.05 L 0.88 1UK Equity Funds JOHCM UK Opportunities 2.4 LB S R 5 2.9 4 3 4 8.17 7.72 11.60 8.34 3.95 0.82 0.84 L 0.69 2UK Equity Funds Old Mutual UK Mid Cap 4.2 MG S R 3 1.1 3 4 4 9.20 13.07 19.70 11.27 4.68 1.17 0.86 H 0.85 2UK Equity Funds JOHCM UK Dynamic 3 LV B R 3 4.1 4 1 4 12.52 6.49 14.00 1.86 0.96 0.30 A 0.73 2UK Equity Funds Royal London Sustainable Leaders 3 LG B 5 2.3 3 4 4 8.96 7.65 15.30 7.60 -0.32 0.83 -0.59 H 0.77 2 UK Equity Income Funds Troy Trojan Income 2.4 LB S R 5 3.6 4 4 4 4.31 8.82 11.90 8.02 5.41 0.77 0.97 L 1.02 1UK Equity Income Funds Franklin UK Equity Income 2.6 LB S R 5 5.4 4 2 4 8.35 7.45 12.10 5.97 3.42 0.91 0.91 A 0.54 1UK Equity Income Funds Royal London UK Equity Income 2.7 LB S R 5 3.8 4 2 4 6.95 7.57 14.40 8.20 3.08 0.93 0.69 A 0.67 1UK Equity Income Funds Threadneedle UK Equity Income 2.6 LV S R 5 3.8 4 2 4 6.06 6.32 13.00 7.54 2.20 0.86 0.35 L 0.82 2UK Equity Income Funds Miton Multi Cap Income 2.3 SB R 5 4.1 1 4 4 1.57 8.27 17.20 6.60 0.33 0.36 L 0.82 2UK Equity Income Funds Marlborough Multi Cap Income 3 SV R 4 4.8 1 4 4 -3.97 4.53 14.60 2.57 0.50 -0.01 H 0.80 3UK Equity Income Funds Schroder Income Maximiser 2.8 LV R 2 6.6 4 1 2 11.82 3.60 11.00 6.08 -0.81 0.87 -0.28 A 0.91 3UK Equity Income Funds Unicorn UK Income 3 SB R 2 4.9 1 4 1 -1.93 2.89 14.30 10.20 A 0.81 3UK Equity Income Funds Woodford Equity Income 2.3 LG S R 3.6 1 4 -0.32 A 0.75 1 UK Smaller Co Funds Old Mutual UK Smaller Companies 3.6 SG G R 3 0.9 4 3 2 11.83 10.05 17.50 10.84 3.79 1.05 0.57 H 1.03 2UK Smaller Co Funds Liontrust UK Smaller Companies 3.2 SG R 5 0.3 4 4 4 10.66 13.44 19.90 12.55 8.17 0.91 1.20 A 1.38 1UK Smaller Co Funds Marlborough Special Situations 3.5 SG 4 1.1 4 3 4 8.77 11.69 16.30 12.53 5.36 1.06 0.91 H 0.80 2

Asia Pacifi c Funds Blackrock Pacifi c ex Japan Index 4.3 LB B R 1 2.8 4 1 1 33.13 8.09 9.2 9.5 -2.39 1.05 -0.46 H 0.19 2 European Funds L&G European Index 3.2 LB B R 3 3.4 3 1 3 10.93 5.26 11.2 5.03 0.61 0.97 0.13 A 0.12 2European Funds Blackrock Continental Euro Equity Tracker 3.2 LB B 3 2.7 3 1 3 11.16 5.24 11.1 5.7 0.56 0.98 0.12 A 0.10 1 Global Emerging Market Funds Blackrock Emerging Markets Equity Tracker 4.8 LB R 3 2.1 3 2 3 31.02 7.14 6.3 0.91 1.04 0.21 H 0.25 1 Global Equity Funds Vanguard FTSE Developed World ex UK Index 2.8 LB G R 5 1.5 4 2 4 25.46 14.38 15.9 0.81 0.98 0.76 L 0.15 1Global Equity Funds Legal & General International Index 3.1 LB R 5 2 4 2 4 25.41 13.44 14.8 0.20 1.04 0.11 A 0.13 2Specialist Funds - Health Care Legal & General Global Health & Pharmacy Index 3.7 LG 4 1.3 1 4 4 13.25 15.82 20.1 12.6 0.16 1.03 0.08 A 0.31 1Global Equity Smaller Co Funds Vanguard Global Small Cap Equity 2.9 SB R 1.3 4 2 3 28.87 14.11 16.1 A 0.38 2 Japanese Funds Blackrock Japan Tracker 3.7 LB S R 4 1.5 2 2 3 23.97 13.15 14 5.5 -0.74 1.04 -0.15 A 0.16 1 North American Funds Legal & General US Index 3.1 LB G R 5 1.6 3 3 4 28.78 18.24 19.1 11.28 -0.67 1.05 -0.11 A 0.10 1North American Funds Vanguard US Equity Index 2.9 LB G R 5 1.3 4 2 3 29.56 18.47 19.3 -0.79 1.00 -0.78 A 0.10 2North American Funds HSBC American Index 3.5 LB G 4 1.6 3 3 3 29.19 18.8 19.1 10.6 -0.78 1.08 -0.06 H 0.08 1 Property Securities Funds Blackrock Global Property Securities Tracker 4.1 MB R 4 2.1 4 2 3 23.41 14.86 14.3 -0.62 0.99 -0.21 A 0.22 1 Global Fixed interest Funds Blackrock Overseas Corporate Bond Tracker 2.6 B R 4 2 3 3 3 25.52 10.19 8.1 -0.27 0.94 -0.21 A 0.16 1 Vanguard Global Bond Index 0.8 ME S R 4 1.6 1 4 4 2.8 3.67 4.2 -0.20 1.04 -0.23 A 0.15 2Global Fixed interest Funds Blackrock Overseas Government Bond 3.1 HE R 3 0.8 4 3 1 25.39 8.71 5.5 -0.56 1.14 -0.22 A 0.16 2 UK Gilt Funds Vanguard UK Government Bond Index 2.3 HE G R 4 1.6 3 3 3 7.15 7.05 5.7 -0.10 1.00 -0.78 H 0.15 3UK Index Linked Gilt Funds Blackrock Index Linked Gilt Tracker 3.7 HE R 3 0.3 4 4 4 17.65 12.48 -0.92 1.13 0.15 H 0.16 2UK Index Linked Gilt Funds L&G All stocks Index Linked Gilt Index 3.3 HE B R 3 0.2 2 2 2 17.32 11.95 10.2 8 -0.61 1.01 -0.19 A 0.15 1 UK Corporate Bond Funds Vanguard UK Inv Grade Corporate Bond Tracker 1.8 ME B R 3 2.7 4 4 4 6.97 5.92 7.3 -0.13 0.93 -0.75 H 0.15 1UK Corporate Bond Funds Blackrock Corporate Bond Tracker 1.8 MM B R 2.3 4 3 2 7.12 6.04 6.8 -0.54 0.89 -0.93 A 0.17 2 UK Equity Funds Blackrock UK Equity Tracker 2.9 LB S R 4 3.3 4 2 3 9.33 4.68 9.4 5.2 -0.19 1.03 -0.04 A 0.06 2UK Equity Funds L&G UK Index 2.8 LB S R 4 3.7 3 2 3 10.07 5 9.0 5.2 -0.15 1.01 -0.05 A 0.10 2UK Equity Funds HSBC FTSE 100 Index 3 LB N 3 3.8 4 1 2 11.37 4.42 8.0 4.5 -0.97 1.09 -0.25 H 0.18 1UK Equity Funds HSBC FTSE 250 Index 3.2 MB N 3 2.8 1 4 3 3.33 6.85 13.1 7.4 0.14 0.99 0.03 A 0.18 1
PASSIVE INVESTMENT FUNDS
ESTATE CAPITAL INVESTMENT PORTFOLIOS PURCHASE LIST
Sector Fund Group Fund Name Volatility Equity Bond MStar RSM Crown Income 1Y 2Y 3Y 1YG 3Y 5Y 10Y 3Y 3Y Info 3Y Charges Selection 3 year Style Style Analysis Rating Yield Growth Growth Growth AGR AGR AGR Alpha Beta Ratio Risk TER Ranking Ratings
ESTATE CAPITAL INVESTMENT PORTFOLIOS OVERVIEW 17 EDITION 26 Winter & Spring 2017

Financial Advice & Wealth Management 18

Maximise your returns witha level of risk you’re entirelycomfortable with
7 Uplands CrescentSwanseaSA2 0PA
Phone: 01792 477763Email: [email protected]
Financial Advice & Wealth Management
Authorised and regulated by the Financial Conduct Authority.