establishment and characterization of a clinically
TRANSCRIPT

i
Establishment and Characterisation of a Clinically Relevant
Metaphyseal Fracture Model in the Distal Femur of
Skeletally Matured Sheep
Inaugural Dissertation
submitted to the
Faculty of Medicine
in partial fulfilment of the requirements
for the PhD-Degree
of the Faculties of Veterinary Medicine and Medicine
of the Justus Liebig University Giessen
by
Alagboso, Francisca Ijeoma
of
Akokwa
Giessen, 2019

ii
From the Experimental Trauma Surgery, Faculty of Medicine
Director: Univ. Prof. Dr. med. Dr. h.c. Christian Heiß
Of the Faculty of Medicine of the Justus-Liebig-University Giessen
Supervisor
Prof. Dr. med. Dr. biol. hom Volker Alt
Committee Members
External Examiner: Prof. Dr. Michael Amling
Committee Chair: Prof. Dr. Klaus-Dieter Schlüter
Committee Member: Prof. Dr. med. vet. Sabine Wenisch
Date of PhD Disputation
4th October 2019

iii
Dedicated to my parents

Abstract
iv
ABSTRACT
Despite the high incidence of metaphyseal bone fractures in patients, the cellular and
molecular mechanisms underlying the healing process of metaphyseal fractures are still poorly
understood due to the unavailability of suitable experimental animal models. The intention of
the current work was to establish a novel clinically relevant large animal model for metaphyseal
bone healing in the distal femur of skeletally matured sheep. In contrast to commonly used
partial osteotomy models, this model employed a complete wedge-shaped osteotomy at the
metaphysis. The osteotomy was stabilised internally with a customised anatomical locking
titanium plate that allowed immediate postoperative full weight bearing. Bone healing was
evaluated at 12 weeks post-fracture relative to the unoperated contralateral femur. No plate
breakage or secondary fracture was recorded in the animals. Histological and micro-computed
tomography results revealed an increased amount of mineralised and dense trabeculae with
rich bone marrow. The new trabeculae healed via direct intramembranous ossification without
visible callus and cartilaginous tissue formation. Functional morphological analysis of the
osteocyte-lacuna revealed regularly arranged spherically shaped osteocytes-lacunae along
with the canaliculi system. The biomechanical test revealed a comparable stiffness in both
operated and unoperated femurs. However, the stiffness at their cortical regions was two-fold
more than in their trabecular regions. Histomorphometric assessment of two major bone matrix
enzymes: ALP (osteoblast marker) and TRAP (osteoclast marker) revealed a significantly
higher ALP activity in the operated femur. Bone remodelling was evident by the expressed
bone formation markers (COL1A1, ALP, BGLAP, BMP2, ASMA, OPG) and bone resorption
markers (RANKL, CTSK) as revealed by quantitative PCR and immunohistochemistry. Bone
surface biochemical analysis using time-of-flight secondary ion mass spectrometry showed
high, and a homogeneously distributed calcium and collagenous components. Ultrastructural
imaging of the new trabeculae revealed a characteristic parallel arrangement of the collagen
fibrils uniformly mineralised by the dense mineral substance. Active osteoblasts were
characterised by their plump cuboidal-shape, abundant rough endoplasmic reticulum, and a
distinct Golgi apparatus whereas active osteoclasts were characterised by their large size,
multiple nuclei and a ruffled border. The ultrastructure of the osteocytes varied according to
the mineralisation level. The matured star-shaped osteocytes embedded inside the fully
mineralised bone whereas young osteocytes embedded within the osteoid or partially
mineralised bone areas. In conclusion, this newly established metaphyseal fracture model is
of interest to study bone healing and treatment options for the enhancement of metaphyseal
fractures.

Zusammenfassung
v
ZUSAMMENFASSUNG
Ungeachtet einer hohen Inzidenz für metaphysäre Frakturen beim Menschen sind die dem
Heilungsprozess unterliegenden zellulären und molekularen Mechanismen immer noch unzureichend
bekannt, was in erster Linie durch das Fehlen klinisch relevanter Tiermodelle zu begründen ist. In der
vorliegenden Studie wurde ein neuartiges, klinisch relevantes Großtier-Modell für die metaphysäre
Knochenheilung im distalen Femur ausgewachsener Schafe etabliert. Im Gegensatz zu normalerweise
genutzten partiellen Osteotomien realisierte dieses Modell eine durchgehende keilförmige Osteotomie
im Bereich der Metaphyse. Die Osteotomie wurde durch eine anatomische winkelstablie Platte
stabilisiert, welche postoperativ sofort eine Vollbelastung erlaubte. 12 Wochen nach der Operation
wurde die Knochenheilung in Relation zur gesunden kontralateralen Seite evaluiert. Bei den Tieren
traten weder Plattenbrüche noch Sekundärfrakturen auf. Histologische und µ-computertomografische
Ergebnisse zeigten eine große Menge mineralisierten Knochens sowie verdichtete Knochentrabekel
und reichlich Knochenmark. Neue Knochentrabekel entstanden durch desmale Ossifikation ohne
sichtbare Knorpel- oder Kallusbildung. Eine spezifische morphologische Analyse der
Osteozytenlakunen veranschaulichte regelmäßig angeordnete sphärische Lakunen zusammen mit
den zugehörigen Knochenkanälchen. Biomechanische Tests demonstrierten eine vergleichbare
Steifigkeit in den operierten und nicht operierten Femora. Dabei war die Steifigkeit in den kortikalen
doppelt so hoch wie in den trabekulären Regionen. Histomorphometrische Analysen zweier wichtiger
Knochenmatrix-Enzyme, der ALP (als Osteoblasten-Marker) und der TRAP (als Osteoklasten-Marker),
ergaben eine signifikant erhöhte ALP-Aktivität im operierten Femur. Sowohl durch
immunhistochemische Färbungen als auch mithilfe der quantitativen PCR konnten aktive
Knochenumbau-Prozesse durch die Expression der knochenaufbauenden Marker Col1A1, ALP,
BGLAP, BMP2, ASMA, OPG sowie der knochenabbauenden Marker TRAP und CTSK nachgewiesen
werden. Die biochemische Analyse der Knochenoberfläche durch die time-of-flight secondary ion mass
spectrometry (ToF-SIMS) ergab eine große Menge gleichmäßig verteilten Kalziums wie auch
kollagener Komponenten. Die ultrastrukturelle Untersuchung der neu gebildeten Trabekel zeigte
charakteristisch parallel angeordnete und gleichmäßig dicht mineralisierte Kollagen-Fibrillen. Aktive
Osteoblasten konnten anhand ihrer würfelförmigen Gestalt, des zahlreich vorkommenden rauen
endoplasmatischen Retikulums sowie eines auffälligen Golgi-Apparates identifiziert werden, während
die aktiven Osteoklasten durch ihre Größe, die Mehrkernigkeit und ein ruffled border geprägt waren.
Die Ultrastruktur der Osteozyten variierte dem Mineralisierungslevel entsprechend. Reife sternförmige
Osteozyten lagen eingeschlossen in vollständig mineralisierter Knochenmatrix, während sich junge
Osteozyten im Bereich des Osteoids, bzw. teilweise in mineralisierte Matrix eingebettet fanden.
Zusammenfassend ist zu sagen, dass dieses neu etablierte metaphysäre Fraktur-Modell im Schaf
zukünftig für die Untersuchung der Knochenheilung und für neue Therapien zur Stimulation zur Heilung
bei metaphysärern Frakturen genutz werden kann.

Table of Contents
vi
TABLE OF CONTENTS
ABSTRACT ............................................................................................................................................. iv
ZUSAMMENFASSUNG ......................................................................................................................... v
TABLE OF CONTENTS ........................................................................................................................ vi
LIST OF FIGURES ................................................................................................................................. ix
LIST OF TABLES.................................................................................................................................... x
LIST OF ABBREVIATIONS.................................................................................................................. xi
1. INTRODUCTION ................................................................................................................................. 1
1.1 Bone structure, composition and function .............................................................................. 1
1.2 Healing process of diaphyseal and metaphyseal fractures ................................................ 2
1.3 Large animal models for fracture healing study .................................................................... 3
1.4 Aim and objectives of the study ................................................................................................. 8
2. MATERIALS AND METHODS ......................................................................................................... 9
2.1 Ethics statement ............................................................................................................................. 9
2.2 Experimental design ...................................................................................................................... 9
2.3 Bone mineral density (BMD) measurement using DEXA ................................................... 10
2.4 Surgical procedure of the femur osteotomy ......................................................................... 11
2.5 Post-operative follow-up ............................................................................................................. 12
2.6 Euthanasia and Sample harvesting ......................................................................................... 13
2.7 Embedding of bone slices in Technovit 9100 ....................................................................... 13
2.7.1 Preparation of reagents .............................................................................................................. 15
2.8 Micro-computed tomography (micro-CT) analysis .............................................................. 15
2.8.1 Scanning procedure .................................................................................................................... 15
2.8.2 Micro-CT image post-processing and data acquisition .......................................................... 16
2.9 Biomechanical analysis .............................................................................................................. 17
2.10 Bone sample grinding and sectioning .................................................................................. 19
2.11 Histological staining .................................................................................................................. 20
2.11.1 Trichrome Masson-Goldner stain ............................................................................................ 20
2.11.1.1 Preparation of reagents ......................................................................................................... 20
2.11.2 Von-Kossa van-Gieson stain ................................................................................................... 21
2.11.2.1 Preparation of reagents ......................................................................................................... 21
2.11.3 Silver nitrate stain ...................................................................................................................... 22
2.11.3.1 Preparation of reagents ......................................................................................................... 22
2.12 Enzyme histochemical staining .............................................................................................. 22
2.12.1 Alkaline phosphatase (ALP) stain ........................................................................................... 22

Table of Contents
vii
2.12.1.1 Preparation of reagents ......................................................................................................... 23
2.12.2 Tartrate-resistant acid phosphatase (TRAP) stain ............................................................... 23
2.12.2.1 Preparation of reagents ......................................................................................................... 23
2.13 Immunohistochemical staining............................................................................................... 24
2.13.1 Bone morphogenetic protein-2 (BMP2) stain ........................................................................ 24
2.13.2 Osteoprotegerin (OPG) and Receptor activator of NF-kB ligand (RANKL) stain ............ 25
2.13.3 Alpha-smooth muscle actin (ASMA) stain ............................................................................. 26
2.13.3.1 Preparation of reagents ......................................................................................................... 26
2.14 Light microscopic imaging ...................................................................................................... 27
2.15 Bone Histomorphometric analysis ........................................................................................ 27
2.16 Gene Expression analysis ........................................................................................................ 27
2.16.1 RNA isolation.............................................................................................................................. 27
2.16.2 Primer testing and validation for the target genes ................................................................ 28
2.16.3 Quantitative PCR ....................................................................................................................... 28
2.16.4 Data analysis .............................................................................................................................. 29
2.17 Time-of-Flight Secondary Ion Mass Spectrometry (ToF-SIM) analysis ........................ 29
2.18 Embedding of bone slices in Epon ........................................................................................ 30
2.18.1 Preparation of reagents ............................................................................................................ 31
2.19 Ultramicrotomy ............................................................................................................................ 32
2.19.1 Semi-thin sections ..................................................................................................................... 32
2.19.2 Ultrathin sections ....................................................................................................................... 32
2.20 Transmission electron microscopic imaging ..................................................................... 33
2.21 Statistical analysis ..................................................................................................................... 33
3. RESULTS ........................................................................................................................................... 34
3.1 Clinical observations ................................................................................................................... 34
3.2 Bone mineral density evaluation .............................................................................................. 34
3.3 Micro-computed tomography analysis ................................................................................... 35
3.3.1 Substantial bony bridging of the fracture gap evident by the high healing scores ............ 35
3.3.2 An increased amount of newly formed bone revealed by the quantitative 3D-
morphometry .......................................................................................................................................... 37
3.4 Biomechanical analysis .............................................................................................................. 38
3.4.1 A comparable bone stiffness at both the operated and unoperated femurs ...................... 38
3.5 Qualitative and quantitative histology .................................................................................... 39
3.5.1 Healing characterised by a dense inter-cortical and trabecular bone bridging .................. 39
3.5.2 Major matrix mineralisation as evident by an increased amount of mineralised bone area
.................................................................................................................................................................. 41
3.5.3 Increased number of regularly organised osteocytes-lacunae canaliculi network ............ 43

Table of Contents
viii
3.6 Qualitative and quantitative enzyme histochemistry .......................................................... 44
3.6.1 A significantly higher cellular expression of ALP in the operated femur ............................. 44
3.7 Qualitative and quantitative immunohistochemistry .......................................................... 45
3.7.1 A moderate amount of BMP2, OPG, RANKL and a reduced ASMA count ........................ 45
3.8 Gene expression analysis .......................................................................................................... 47
3.8.1 Up-regulation of prominent genes involved in bone formation ............................................. 47
3.9 Bone surface analysis using ToF-SIMS .................................................................................. 49
3.9.1 Calcium and collagen surface mapping revealed similar intensity distribution .................. 49
3.10 Ultrastructural analysis of the newly formed trabeculae ................................................. 50
3.10.1 The localisation of the ROIs for further ultrastructural analysis .......................................... 50
3.10.2 Ultrastructure of the organic matrix and the bone mineral material ................................... 52
3.10.3 Ultrastructure of the osteoclasts .............................................................................................. 53
3.10.4 Ultrastructure of the osteoblasts ............................................................................................. 54
3.10.5 Ultrastructure of the osteocytes............................................................................................... 55
4. DISCUSSION ..................................................................................................................................... 56
4.1 Successful establishment of a metaphyseal fracture model in the distal femur of
skeletally matured sheep .................................................................................................................. 56
4.2 Validation of the BMD in the study animals ........................................................................... 57
4.2.1 A comparable BMD at the whole body and femur region of the sheep ............................... 57
4.3 Characterisation of bone healing in the fractured area ...................................................... 57
4.3.1 Bone microstructure .................................................................................................................... 57
4.3.2 Bone mineralisation and stiffness ............................................................................................. 59
4.3.3 Cellular activities of osteoclasts, osteoblasts and osteocytes .............................................. 59
4.3.4 Vascularisation ............................................................................................................................. 61
4.3.5 Activities of prominent bone formation and resorption genes ............................................... 61
4.3.6 Characteristic ultrastructure of the organic, inorganic and the specialised bone cells ..... 62
4.4 Limitations of the study .............................................................................................................. 63
5. CONCLUSION ................................................................................................................................... 64
6. REFERENCES .................................................................................................................................. 65
THESIS DECLARATION ..................................................................................................................... 74
ACKNOWLEDGEMENTS .................................................................................................................... 75
CURRICULUM VITAE ............................................................................. Error! Bookmark not defined.

List of Figures
ix
LIST OF FIGURES
Fig. 1. A schematic representation of long bone anatomy.......................................................... 1
Fig. 2. Diagrammatic representation of the experimental design……………………................... 10
Fig. 3. Internal fixation of the custom-made locking plate and full osteotomy at the sheep
distal femur metaphysis………………………………………………………………………….…….
12
Fig. 4. Creation of ROI for the 3D-quantitative morphometry………………………..................... 17
Fig. 5. The location of indentation points for biomechanical testing…………………….………... 18
Fig. 6. Assessment of the bone stiffness via indentation test…………………………………..…. 19
Fig. 7. Postoperative X-ray analysis of the operated femur…………….……………................... 34
Fig. 8. Evaluation of the BMD………………………………………………………………………… 35
Fig. 9. Micro-CT image evaluation of the healing status of all six sheep at 12 weeks post-
fracture…………………………………………………………………………………...………….......
36
Fig. 10. Qualitative evaluation of the degree of bone healing…………………..…………...….... 37
Fig. 11. Quantitative micro-CT image analysis……………………………………….……..…....... 38
Fig. 12. Assessment of the biomechanical competence of the newly formed bone….…….…... 39
Fig. 13. Microstructural features of the newly formed cortical and trabecular bone in the
fractured area…………………………………………………………………………….…...……......
40
Fig. 14. Major bone matrix mineralisation as evidence of advanced bone healing…………….. 42
Fig. 15. Increased number of well-organised spherically shaped osteocytes-lacunae with the
canaliculi network as proof of the new bone maturation……………………………………….......
43
Fig. 16. Bone formation in the fractured area evident in the significantly higher activity of the
osteoblasts……………………………………………………………………………………………....
45
Fig. 17. Comparative expression of BMP2, OPG, RANKL and ASMA……………..………….… 46
Fig. 18. Relative expression of prominent bone formation and resorption genes ………...…… 48
Fig. 19. The local distribution pattern of calcium and collagen in the fractured area….............. 49
Fig. 20. The localisation of ROIs in the fractured area for further ultrastructural analysis….….. 51
Fig. 21. Ultrastructure of the organic matrix and the bone mineral material……….................... 52
Fig. 22. Ultrastructure of the osteoclasts……………..………………………..………………….… 53
Fig. 23. Ultrastructure of the osteoblasts…………………………………………..………………... 54
Fig. 24. Ultrastructure of the osteocytes………………………………………….………………..... 55

List of Tables
x
LIST OF TABLES
Table 1: A comprehensive literature review of the available sheep long bone fracture models
for studies on diaphyseal and metaphyseal bone healing………...............................................
5
Table 2: Sample embedding in Technovit 9100……………………………………………............ 14
Table 3: The radiographic image grading scale.....………………………………………………… 16
Table 4: The various staining methods with the allocated bone section number....................... 19
Table 5: The forward and reverse primer sequence of the target genes...……………............... 28
Table 6: Sample embedding in Epon…………………………………………………..................... 30

List of Abbreviations
xi
LIST OF ABBREVIATIONS
% Percentage
°C Degree Celsius
µm Micrometre
µM Micromolar
3D Three-dimension
AgNO3 Silver nitrate
ALP Alkaline phosphatase
ASMA Alpha-smooth muscle actin
B2M Beta-2 microglobulin
BGLAP Osteocalcin
BMD Bone mineral density
BMP2 Bone morphogenetic protein-2
Bp Base pair
BV Bone volume
BV/TV Bone volume over the total volume
Ca+ Calcium ion
cDNA Complementary deoxyribonucleic acid
COL1A1 Collagen, type 1, alpha 1
COL2A1 Collagen, type 2, alpha 2
CT Cycle threshold
CTSK Cathepsin K
DEXA Dual Energy X-ray Absorptiometry
dH2O Distilled water
ddH2O Double-distilled water
F Force
G Gram
H2O Water
HA Hydroxyapatite
IFM Interfragmentary movement
Kg Kilogram
M Molar
Mbar Millibar

List of Abbreviations
xii
Mg Milligram
micro-CT Micro-computed tomography
N Newton
obs Osteoblasts
ocs Osteocytes
ocy Osteocytes
OPG Osteoprotegerin
PCR
RANKL
Polymerase chain reaction
Receptor activator of nuclear factor kappa-B ligand
RNA Ribonucleic acid
ROI Region of interest
RT Room temperature
SMI Structural mass index
Tb.N Trabecular number
Tb.Sp Trabecular spacing
Tb.Th Trabecular thickness
TEM Transmission Electron Microscopy
ToF-SIMS Time-of-Flight Secondary Ion Mass Spectrometry
TRAP Tartrate-resistant acid phosphatase
v/v Volume per volume

Introduction
1
1. INTRODUCTION
1.1 Bone structure, composition and function
The bones of the skeleton generally function in providing structural and movement
support, protection of vital internal body organs, and as a storehouse of growth factors,
cytokines, minerals, and hematopoietic stem cells [1], [2]. The long bones of the lower
extremity are mostly subjected to load bearing activities and thus, crucial for skeletal
movement [3]–[5]. The long bone is composed of a hollow shaft also known as the
diaphysis, a rounded epiphysis lying above the growth plate and a cone-shaped
metaphysis located underneath the growth plate. The diaphysis primarily consists of
dense cortical bone, while the metaphysis and epiphysis are majorly composed of
trabecular bone also called cancellous or spongy bone surrounded by a relatively thin
layer of cortical bone as shown in figure 1.
Fig. 1: A schematic representation of long bone anatomy. The diaphysis is consists of dense cortical bone whereas the epiphysis and metaphysis comprise majorly of trabecular bone (modified from http://docplayer.net/28369321-The-skeletal-system-musculo-skeletal-system.html; accessed on 02.2.2019).
The outer surface of the cortical bone is attached to a thick fibrous (Sharpeys’ fibres)
periosteal layer that serves as a protective sheath while providing support to tendons,
which secure the muscle to the bone. The osteogenic layer of the periosteum contains
progenitor cells that can develop into bone forming cells. Enclosed within the cortical

Introduction
2
bone is a porous network of trabeculae, surrounded by a hollow cavity containing the
bone marrow. The endosteum covers the inner surface of the cortical, trabecular, and
blood vessel canals. The cortical bone is composed primarily of osteons of concentric
lamellae arranged in Haversian canal whereas the trabecular bone is primarily
composed of thin plates and rod-shaped structural units called trabeculae packets
arranged in a mosaic-like microstructure. The trabecular bone has a lower stiffness,
larger surface area to volume ratio and shows a higher metabolic rate [2], [6]–[8].
The bone matrix is made up of organic and inorganic components. The fibrillar type 1
collagen dominates the organic component whereas the inorganic component is
mostly carbonated hydroxyapatite [Ca10(PO4)6(OH)2] [9]–[11]. The collagenous fibres
appear very dense containing regularly arranged fibrils that are oriented in parallel and
reinforced with the mineral particles deposited within and outside the structure [12],
[13]. The mineral phase determines the stiffness, while the collagen component
controls its post-yield ductility. By combining the unique mechanical properties, the
collagen-mineral composite contributes to bone’s strength by providing both rigidity
and resistance against the applied load. The mechanical property of a bone is also
determined by the density and distribution pattern of the mineral within the collagenous
matrix as well as the structural organisation of the tissue both at the micro and nano-
structural levels [14], [15]. Specific types of bone cells, namely osteoblasts, osteoclasts
and osteocytes with unique morphological features occupy defined an area within the
bone matrix. In response to physiological or mechanical forces, they perform defined
roles during osteogenesis, bone modelling and remodelling processes.
1.2 Healing process of diaphyseal and metaphyseal fractures
The healing of a diaphyseal fracture in the cortical bone area is a complex multi-step
process that combines both intramembranous and endochondral ossification. It is
characterised by periosteal callus formation, in which the amount of callus depends on
the stability of the fracture fixation [16]–[18]. In contrast, the healing of a metaphyseal
fracture in the trabecular bone area under mechanically stable conditions occurs more
rapidly, mainly through a direct membranous bone formation within the marrow space,
and with very little or no external callus formation [19]–[23]. The inter-trabecular healing
process begins with the formation of a hematoma, which subsequently leads to an
inflammatory stage that is succeeded by a large assembly of undifferentiated

Introduction
3
mesenchymal stem cells developing into the osteoid tissue, which then transforms into
the woven bone that is later remodeled into lamellar bone [19]–[24]. Most trabecular
fractures of the lower body extremity for example, in the distal femur, occur in the
metaphyseal bone area. This is because trabecular bone density and strength
decreases with ageing and in the disease condition, thus making it highly susceptible
to fracture [25].
1.3 Large animal models for fracture healing study
Although small animal models are most often used for fracture healing studies, they
have several shortcomings when compared to larger animals. Some of the limiting
factors include their small skeletal size, bone structure and limited life expectancy [26]–
[28]. These drawbacks are addressable using large animal models. Among previously
tested larger animals such as goats, pigs, dogs and non-human primates, sheep are
the best choice with respect to orthopaedic research [29], [30]. These studies found
many similarities between sheep skeleton and human subject in terms of size,
microstructure, bone metabolism and mechanical properties [29], [31]–[33]. The use of
skeletally matured sheep as a large animal model for fracture healing studies have
been reported to be more clinically relevant in comparison to small animals because
the results are more likely translatable to the human subject. Also, the large size and
shape of the sheep skeleton allow the use of orthopaedic implants comparable to those
used in patients [34], [35].
Although several fracture healing studies have been conducted using sheep, most of
the defects were created in the diaphyseal area of the long bone as shown in table 1.
This contrasts with the clinical situation where most fractures occur in the metaphyseal
region. Based on the extensive literature review (Table 1), only three studies are
available on metaphyseal bone healing using sheep models. In one of those studies,
Malhotra et al. 2014 [36] compared the healing rate of different drill hole defect sizes
(8 mm, 11 mm and 14 mm) created in the proximal tibia and distal femoral epiphysis
of young and adult sheep. In the other two studies, a 3 mm partial osteotomy was
created in the trochlear groove of the distal femur in skeletally matured sheep [37] and
osteoporotic sheep [38]. Despite having interesting experimental outcomes, the
models mentioned above are somewhat limited by the lack of full discontinuity of the
bone at the fracture area and the absence of a clinically relevant fixation technique

Introduction
4
owing to the simple nature of the fracture, which is often not the case with clinical
fractures. Based on current literature review, a complete osteotomy at the metaphysis
and a proper internal fixation are among the main criteria required for an animal model
to be considered as clinically relevant for metaphyseal bone healing study [39], [40].

Introduction
5
Table 1: A comprehensive literature review of the available sheep long bone fracture models for studies on diaphyseal and
metaphyseal bone healing.
Experimental study
Sheep breed and age
Healthy or diseased condition
Defect size and location Fracture fixation method
Study duration
Healing outcome
Wullschleger
et al., 2013
[41]
Merino
5.6 ± 0.9 years
Healthy 3 cm multi-fragmentary shaft
fracture of the distal femur (A0
- C3 fracture).
External fixator 4 and 8
weeks
Callus bridging was
observed at the fracture
gap.
Lill et al.,
2003 [42]
Female Swiss
mountain
7.5 ± 1.5 years
Osteoporotic 3 mm transverse midshaft
osteotomy on the distal tibia.
External fixator 8 weeks The osteoporotic group had
reduced healing compared
to sham.
Challis et al.,
2006 [43]
Not provided Healthy Transverse osteotomy of the
right distal radius.
External fixator 4 and 6
weeks
Addition of cyclic pneumatic
pressure did not
significantly increase
healing outcome compared
to the control group.
Epari et al.,
2006 [44]
Female merino
2.5 – 3-5 years
Healthy 3 mm osteotomy on the tibial
diaphysis.
External fixator (rigid
and semi-rigid)
6 and 9
weeks
The use of semi-rigid fixator
increased healing time
leading to prolonged
chondral phase.
Tufekci et al.,
2018 [45]
Merino
3 - 4 years
Healthy 3 mm and 30 mm critical-sized
defect separated by a 30 mm
bone segment.
External fixator 9 weeks Early mechanical
stimulation alone is
sufficient for a timely
healing outcome.

Introduction
6
Table 1 continued
Experimental study
Sheep breed and age
Healthy or diseased condition
Defect size and location Fracture fixation method
Study duration
Healing outcome
Hente et al.,
1999 [46]
Female Swiss
Alpine
6 – 11 years
Healthy 3 mm osteotomy of the
anterior aspect of the tibia.
External fixator
(static and dynamic
fixation).
10
weeks
No significant differences
between dynamic and static
fixation groups.
Augat et al.,
2001 [47]
Male merino
1.8 – 2.5 years
Healthy Transverse osteotomy of the
right tibia at the mid-
diaphyseal level.
External fixator with
controlled
interfragmentary
movement (IFM).
9 weeks Externally applied
mechanical
stimulation with cyclic non-
uniform tensile strains did
not enhance healing.
Claes et al.,
1995 [48]
Male sheep
2 years
Healthy 0.6 mm transverse osteotomy
of the right metatarsal.
External fixator with
controlled IFM.
9 weeks Dynamic fixation
accelerated healing.
However, bone healing was
more dependent on gap
size rather than IFM.
Wolf et al.,
1998 [49]
Female merino
sheep
Healthy 3 mm transverse osteotomy of
the left tibia.
External fixator with
controlled IFM.
6 weeks External mechanical
stimulation did not enhance
healing. IFM of about 0.5
mm seemed to be the
optimal distance to support
healing.

Introduction
7
Table 1 continued
Experimental study
Sheep breed and age
Healthy or diseased condition
Defect size and location Fracture fixation method
Study duration
Healing outcome
Claes et al.,
2009 [19]
Mountain
6 years
Healthy 3 mm partial osteotomy in the
trochlear groove of the distal
femur.
Two stainless-steel
plates with a
thickness of 2 and
2.7 mm were
implanted to limit
IFM.
8 weeks Smaller IFM resulted in
better healing outcome
compared to lager IFM.
Bindl et al.,
2013 [38]
Merino
5 – 6 years
Osteoporotic
3 mm partial osteotomy in the
trochlea region of the distal
femur.
Two stainless-steel
plates with a
thickness of 2 and
2.7 mm were
implanted to limit
IFM.
8 weeks Hypothalamic-Pituitary
Disconnection (HPD)
treated group had a poor
healing outcome.
Malhotra et
al., 2014 [36]
18 months and
5 years
Healthy Distal femoral epiphysis and
proximal tibial epiphysis. Drill
hole defects with a fixed depth
of 25 mm and diameter of 8
mm or 11 mm or 14 mm.
None. 4 weeks Healing decreased as
defect size increased. The
defect areas were only
partially healed due to the
short observation time.

Introduction
8
1.4 Aim and objectives of the study
The high incidence of metaphyseal fracture in the world’s ageing population makes it
a serious clinical concern, especially since there are limited treatment options
available. Therefore, there is an urgent need for appropriate large animal models that
fulfil specific clinical criteria to enable translational studies on metaphyseal fracture
healing.
The goal of this doctoral research work is to establish and extensively characterise a
clinically relevant metaphyseal fracture model in adult sheep distal femur. The full
discontinuity at the metaphysis and the adequate internal stabilisation conferred by the
titanium locking plate fixation comparable to the clinical situation met the criteria
expected of a clinically relevant animal model.
The objectives of this study include:
1. To determine whether the customised anatomical locking plate construct conferred
sufficient mechanical stability on the fractured gap under mechanical loading
conditions.
2. To quantify the extent of healing that occurred in the fractured area within the 12
weeks observation period.
3. To determine the nature of the tissue formation and whether the trabecular healing
occurred via intramembranous or endochondral ossification.
4. To determine the biomechanical competence of the newly formed bone.
5. To extensively characterise the structural features of the organic, inorganic and
cellular components of the newly formed trabeculae up to the nanometer scale.

Materials and Methods
9
2. MATERIALS AND METHODS
2.1 Ethics statement
The local animal care committee approved this study according to the German animal
protection laws of the District Government of Darmstadt under the reference number
V 54-19 c 20/15 - FU/1061. All the animals were handled in conformity with the
guidelines for care and use of laboratory animals of the National Institutes of Health.
2.2 Experimental design
This study was conducted using six female adult Merino land sheep aged between 6 -
7 years and an average weight of 99 kg. The animals were fed with a standard sheep
diet (S6189-S010; ssniff-Spezialdiäten, Germany) and they grazed freely at the
meadow. The bone mineral density (BMD) of the animals was measured using Dual
Energy X-ray Absorptiometry (DEXA) two weeks after acclimatisation to the new
environment. Subsequently, the femoral osteotomy on the left distal femur metaphysis
was performed, and then the fracture was allowed to heal for 12 weeks. The matching
right femurs were left intact and used as the experimental control. Just before the
animals were euthanised for sample collection, their final BMD measurement was
recorded. The left and right distal femur areas were harvested for further analysis using
various methods as shown in figure 2. All the procedures including the DEXA, femoral
osteotomy and euthanasia were carried out under general body anaesthesia, which
was performed via intravenous administration of 2 mg/kg propofol (20 mg/mL propofol;
Fresenius Kabi, Germany) and 2 mg/kg fentanyl (50 mg/mL Fentanyl-Hameln; Hameln
Pharmaceuticals GmbH, Germany).
Materials and Methods
10
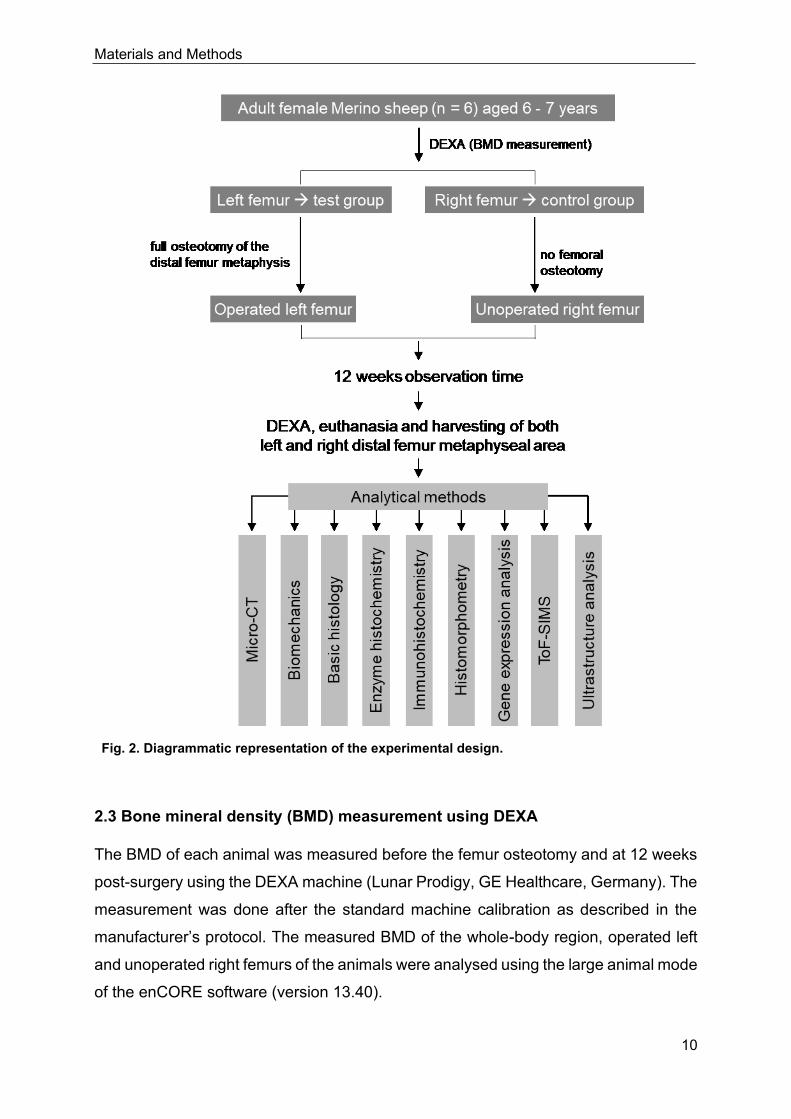
Fig. 2. Diagrammatic representation of the experimental design.
2.3 Bone mineral density (BMD) measurement using DEXA
The BMD of each animal was measured before the femur osteotomy and at 12 weeks
post-surgery using the DEXA machine (Lunar Prodigy, GE Healthcare, Germany). The
measurement was done after the standard machine calibration as described in the
manufacturer’s protocol. The measured BMD of the whole-body region, operated left
and unoperated right femurs of the animals were analysed using the large animal mode
of the enCORE software (version 13.40).

Materials and Methods
11
2.4 Surgical procedure of the femur osteotomy
A complete wedge-shaped osteotomy was created in the distal metaphyseal area of
the left femur under general body anaesthesia as described below:
Each sheep was laid in a supine position, and the hind legs were fixed in a slightly
extendable position to enable proper internal rotation. The left hind leg to be operated
was shaved entirely from the thigh region down to the knee area. Subsequently, the
surgical site and the lower body part were fully draped sterile. Incisions were made to
expose the lateral femur from the lateral condyle area into the midshaft area between
the lateral vastus muscle, and the lateral head of the femoral biceps muscle. Proper
care was taken to avoid the disruption of the surrounding collateral ligaments. Two
blunt Hohmann retractors were used to expose the femoral shaft, and the soft tissues
around the osteotomy site were carefully removed.
For a stable fixation of the distal femur, a custom-made angular stable 11-hole titanium
plate (aap Implantate, Germany) was inserted into the lateral side of the distal femur
(Fig. 3A-B). Care was taken to fix the locking plate to the distal femur just proximal to
the joint line of the knee joint, and a non-locking screw (aap Implantate, Germany) was
used to fix the plate onto the lateral cortex via the oval hole. Six 50 mm long locking
screws (aap Implantate, Germany) were fixed into the distal part of the plate with
penetration from the medial cortex without violation of the cartilage or other
intraarticular structures (Fig. 3C). The remaining four locking screws holes were fixed
into the diaphyseal region.
Afterwards, the patella was gently dislocated with the aid of blunt Hohmann retractors
that exposed the ventral aspect of the distal femur. A line just proximal and parallel to
the articular cartilage was marked. At the lateral aspect of the distal femur, the line was
extended 10 mm proximally and connected to the medial origin of the line resulting in
a triangular/wedge-shaped guideline for subsequent sawing. The osteotomy was
carried out using a motorised oscillating saw. The exercised bone was chiselled out,
then the defect (Fig. 3D) was cleaned and flushed with saline to remove residual bone
particles. Multiple layered soft tissues and skin closure were performed using
resorbable stitches. A spray silver dressing was applied to prevent infection. The stable
angular fixation of the fracture permitted the immediate post-operative full-weight
bearing of the animals.

Materials and Methods
12
Fig. 3. Internal fixation of the custom-made locking plate and full osteotomy at the sheep distal femur metaphysis. (A) Overview image of the customised titanium locking plate for fixation of the distal metaphyseal area of the femur (B) The condylar part of the plate allows for stable fixation of the distal femur with six 50 mm long locking screws. (C) Intraoperative image after fixation of the locking plate to the lateral part of the left femur with stable fixation of the locking screws into the condylar area before the osteotomy. (D) Intraoperative appearance after the creation of the wedge-shaped osteotomy with a full discontinuity at the distal metaphyseal area of the femur.
2.5 Post-operative follow-up
The animals were kept individually for one week to ensure proper wound healing and
for the rest of the observation period in a flock on a nearby meadow with the standard
diets and water ad libitum. The overall health status and wound healing were checked
daily during the first two postoperative weeks by a veterinarian. The postoperative
monitoring included the administration of relevant analgesics, observation of weight
bearing and return to daily activities. Subsequently, the animals were monitored weekly
until the end of the study period. Postoperative X-ray of the femur was performed one
day after the surgery without additional anaesthesia to ascertain if the metallic implant
was correctly placed and to exclude any additional peri-implant fractures of the femur.
Materials and Methods
13
2.6 Euthanasia and Sample harvesting
All animals were euthanised at 12 weeks post-surgery by intravenous administration
of 50 mg/kg pentobarbital (Anestesal; Pfizer, Germany) under anaesthesia as
described above. After euthanasia, both the left and right femurs were harvested from
the animals. The femurs were carefully cleaned of any unwanted soft tissues in contact
with the cortical bone surface, and the plates were carefully removed from the femurs.
All the harvested femurs remained stable after the plate removal, and no plate
breakage was recorded. The distal end of the operated left and unoperated right
femurs of the six sheep were harvested and sectioned into thin coronal bone slices
using a diamond saw (Trennband 0. 2 mm; Patho-service Germany) under constant
cooling and then assigned to the various analytical methods. For biomechanical
analysis, coronal bone slices of about 4.5 mm thickness were immediately frozen
without processing to avoid any alteration in bone quality. About 3 mm thick coronal
bone slices were allocated for gene expression and ultrastructure analysis. The
samples for gene expression analysis were immediately placed in RNAlater (1204027,
Ambion, USA), and stored at -80 °C until further processing. Another 4.5 mm thick
coronal bone slices were allocated for both micro-CT analysis and histological staining
since micro-CT is a non-destructive technique. The bone specimens were immediately
fixed in 4 % phosphate-buffered paraformaldehyde (Carl Roth, Germany) and stored
at 4 °C until further processing.
2.7 Embedding of bone slices in Technovit 9100
Technovit 9100 New (Heraeus Kulzer, Germany) is a plastic embedding system based
on methyl methacrylate (MMA). The undecalcified femoral bone slices were embedded
in the Technovit 9100 New. This embedding technique enabled the investigation of the
samples using various histological staining, enzyme-histochemistry and
immunohistochemistry. The reagent was supplied as five components consisting of:
1. Technovit 9100 basic solution of stabilised MMA. This component was
destabilised by passing the reagent slowly through a column filled with
approximately 50 g of aluminium oxide (X908, Roth, Germany). The
destabilised solution was stored at -20 °C in corked brown glass.
2. Technovit 9100 PMMA powder was used to eliminate polymerisation shrinkage
and facilitate a better polymerisation process.

Materials and Methods
14
3. Technovit 9100 hardener 1 and hardener 2 worked together to facilitate targeted
polymerisation even at temperatures less than 0 °C.
4. Technovit 9100 regulator is a reactive organic compound that facilitates a
precise polymerisation with controlled low-temperature spikes.
The embedding process was performed in two steps, namely tissue pre-treatment and
tissue treatment. In the tissue pre-treatment phase, the harvested samples were fixed
in 4 % paraformaldehyde for 24 - 48 hours followed by six rounds of washing with 0.1
M phosphate buffer, pH 7.3. The tissue treatment stage involved sample dehydration
in increasing concentration of ethanol (32205, Sigma, Germany), then in an
intermedium which involved defatting with xylene (9713, Roth, Germany) and lastly the
immersion stage where the samples were embedded in Technovit. Table 2 below
describes how the sample treatment phase was performed.
Table 2: Sample embedding in Technovit 9100.
Duration and temperatures for the tissue treatment phase of the sheep femoral bone slices.
Treatment phase: Dehydration, intermedium and immersion
Dehydration in Ethanol
Concentration Duration Temperature
70 % 2 days RT
70 % 2 days RT
80 % 3 days RT
96 % 3 days RT
100 % 4 days RT
100 % 3 days RT
100 % 4 days RT
100 % 3 days RT
100 % p.a. 4 days RT
Intermedium in Xylene
Concentration Duration Temperature
100 % 6 hours RT
100 % 12 hours RT
Immersion in Technovit 9100
Reagent Duration Temperature
Pre-infiltration 1 5 days RT
Pre- infiltration 2 5 days RT
Pre- infiltration 3 5 days 4 °C
Infiltration 1 6 days 4 °C
Infiltration 2 6 days 4 °C
Infiltration 3 6 days 4 °C
Polymerisation 2 days - 4 °C
Polymerisation 1 hour 4 °C
Key: RT: room temperature; °C: degree Celsius

Materials and Methods
15
2.7.1 Preparation of reagents
❖ Pre-infiltration 1: 200 ml Xylene + 200 ml Technovit 9100 stabilised basic
solution.
❖ Pre-infiltration 2: 200 ml stabilised Technovit 9100 basic solution + 1 g hardener
1.
❖ Pre-infiltration 3: 200 ml destabilised Technovit 9100 solution + 1 g hardener 1.
❖ Infiltration solution 1 - 3: 250 ml destabilised Technovit 9100 solution + 20 g
PMMA powder + 2 g hardener 1.
❖ Polymerisation mixture: 9 parts of stock solution A + 1 part of stock solution B.
▪ Solution A: 500 ml destabilised Technovit 9100 solution + 80 g PMMA
powder + 3 g hardener 1.
▪ Solution B: 44 ml destabilised Technovit 9100 + 17.6 ml hardener 2 + 2
ml regulator.
❖ Phosphate buffer, pH 7.3
▪ Solution A: 27.6 g Sodium dihydrogen phosphate monohydrate (106346,
Merck, Germany) in 1000 ml ddH2O.
▪ Solution B: 35.6 g di-Sodium hydrogen phosphate dihydrate in 1000 ml
ddH2O.
▪ Stock solution (0.2 M Na-phosphate, pH 7.3): 230 ml solution A + 770 ml
solution B.
▪ Working solution (0.1 M Na-phosphate, pH 7.3): 500 ml stock solution +
500 ml ddH2O.
2.8 Micro-computed tomography (micro-CT) analysis
2.8.1 Scanning procedure
The Technovit-embedded coronal bone slices were scanned using a Bruker micro-CT
(SkyScan 1173, Kontich, Belgium) at the X-ray energy of 130 kV and 60 µA for
assessment of bone microstructure as described by Bouxsein and colleagues [50]. The
samples were positioned on a computer-controlled rotation stage and scanned at 240°
around the vertical axis in rotation steps of 0.25° with a noise reduction, and a frame
average of 4-fold. A 0.25 mm brass filter was used for beam filtration to reduce beam
hardening. A pair of HA-phantoms with a diameter of 32 mm and mineral densities of

Materials and Methods
16
250 mg / 750 mg HA was scanned with each scan for system calibration of linear
attenuation coefficient to the density of HA. The images were reconstructed with the
NRecon-Software (Bruker microCT, Kontich, Belgium), resulting in an 8-bit grayscale
image. A Gaussian filter (kernel = 1) was employed for image reconstruction with a
moderate smoothing.
2.8.2 Micro-CT image post-processing and data acquisition
The qualitative assessment of the generated micro-CT images of the bone specimens
of the operated left femurs was performed by two independent investigators to
determine the extent of bony bridging at both the cortical and trabecular regions of the
fractured area. The examination was conducted with the Sykscan Dataviewer software
for 3-dimensional (3D) image analysis. The 3D images of the bone slices were
orientated in a similar direction before the assessment. Next, the fractured area was
divided into the following three parts: medial cortex, defect centre and, lateral cortex.
Healing at these regions were graded using the radiographic grading scale shown in
table 3, which was adapted from previous reports [36], [51]. The images were reviewed
in transverse, coronal as well as sagittal planes to ensure a thorough and precise
assessment. The sum of the grades was used to determine the healing status of each
specimen.
Table 3: The radiographic image grading scale.
0 No healing: No visible bone bridging within the fractured area.
1 Partial cortical and trabecular healing: Minor bone bridging with gaps; defect visible
with low radiographic density than adjacent bone outside the fractured area.
2 Advance cortical and trabecular healing: Bone bridging evident with minimal gaps;
defect visible with radiographic density fairly like that of adjacent bone outside the
fractured area.
3 Complete cortical and trabecular healing: Bone bridging with no gaps; defect
hardly visible with a radiographic density equivalent to the adjacent bone outside the
fractured area.
For the quantitative analysis, a direct 3D-morphometry of the newly formed trabeculae
of the operated left femurs was analysed relative to the unoperated right femurs. The
creation of a region of interest (ROI), segmentation and quantitative morphometry were
performed using the CTAn Software (Version 1.18.4, Bruker microCT, Kontich,
Belgium). A triangular/wedge-shaped ROI was manually contoured within the fractured

Materials and Methods
17
area of the operated left femurs and at the comparable region in the unoperated right
femurs (Fig. 4A-B).
The cortical bone region was excluded from the ROI. The height of the wedge at the
lateral and medial sides of each bone sample was about 10.5 mm and 0.5 mm,
respectively. The contoured wedge was interpolated into a defined specimen volume.
For the trabecular bone morphometry, a global threshold of 30 % of the maximum grey
values corresponding to a mineral density of 400 mg HA/cm3 was defined. The analysis
method was adapted from previous reports [52], [53].
Fig. 4. Creation of ROI for the 3D-quantitative morphometry. Representative images of (A) operated left and (B) unoperated right femur showing the wedge-shaped ROI defined only at the trabecular bone area.
2.9 Biomechanical analysis
The stiffness of the trabecular and cortical regions within and adjacent to the fractured
area was determined using an indentation test. The indentation test was performed on
non-processed fresh coronal bone slices by Prof. Dr. L. Dürselen, a collaborating
partner at the Institute of Orthopaedic Research and Biomechanics, University of Ulm,
Germany (Institute director: Prof. Dr. A. Ignatius). Similar points were also measured
from the corresponding unoperated right femur to enable comparison. The samples
were marked at nine points with a water-insoluble pen as shown in figure 5. Points
2,5,7,8 and 9 were within the osteotomy area; points 1 and 3 were around the cortical
region while points 4 and 6 were located within the trabecular region adjacent to the
fractured area. The indentation test was performed on the marked points using a
standard material test machine (Z10, Zwick Roell, Germany) as shown in figure 6A.
Materials and Methods
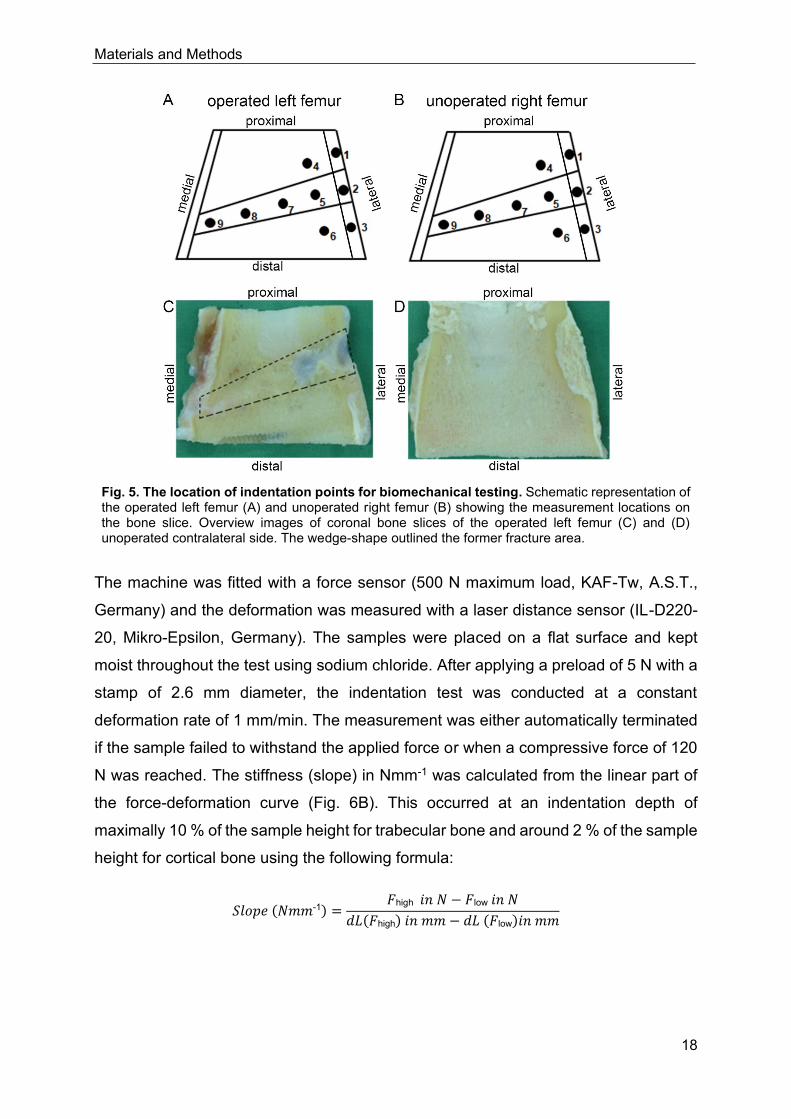
18
Fig. 5. The location of indentation points for biomechanical testing. Schematic representation of the operated left femur (A) and unoperated right femur (B) showing the measurement locations on the bone slice. Overview images of coronal bone slices of the operated left femur (C) and (D) unoperated contralateral side. The wedge-shape outlined the former fracture area.
The machine was fitted with a force sensor (500 N maximum load, KAF-Tw, A.S.T.,
Germany) and the deformation was measured with a laser distance sensor (IL-D220-
20, Mikro-Epsilon, Germany). The samples were placed on a flat surface and kept
moist throughout the test using sodium chloride. After applying a preload of 5 N with a
stamp of 2.6 mm diameter, the indentation test was conducted at a constant
deformation rate of 1 mm/min. The measurement was either automatically terminated
if the sample failed to withstand the applied force or when a compressive force of 120
N was reached. The stiffness (slope) in Nmm-1 was calculated from the linear part of
the force-deformation curve (Fig. 6B). This occurred at an indentation depth of
maximally 10 % of the sample height for trabecular bone and around 2 % of the sample
height for cortical bone using the following formula:
𝑆𝑙𝑜𝑝𝑒 (𝑁𝑚𝑚-1) =𝐹high 𝑖𝑛 𝑁 − 𝐹low 𝑖𝑛 𝑁
𝑑𝐿(𝐹high) 𝑖𝑛 𝑚𝑚 − 𝑑𝐿 (𝐹low)𝑖𝑛 𝑚𝑚

Materials and Methods
19
Fig. 6. Assessment of the bone stiffness via indentation test. (A) The overview image showed an indentation point on the cortical region of a coronal bone slice. (B) Schematic diagram of a force-deformation plot of a given sample after the indentation test.
2.10 Bone sample grinding and sectioning
The undecalcified Technovit embedded bone slices were partly ground and polished
into about 70 µm thick grinding using a cutting-grinding machine (Exakt-300, EXAKT
Advanced Technologies Germany). Then the remaining Technovit blocks were
trimmed and divided into two halves of lateral and medial sides to enable sectioning
using the 2.5 cm Kawamoto’s film (Cryofilm type 2C(9), Section-Lab Co. Ltd., Japan).
Five micrometres thick sections were prepared with the aid of a microtome (RM2155,
Leica, Germany) equipped with a hard-metallic knife (400215, Leica, Germany).
Consecutive sections were used for the various staining as shown in table 4.
Table 4: The various staining methods with the allocated bone section number.
Staining method Section number
Von-Kossa van-Gieson 6
Alpha-smooth muscle actin 7
Silver nitrate 8
Alkaline phosphate 9
Tartrate-resistant acid phosphatase 10
Bone morphogenetic protein-2 11
Receptor activator of NF-kB ligand 12
Osteoprotegerin 13

Materials and Methods
20
2.11 Histological staining
2.11.1 Trichrome Masson-Goldner stain
The undecalcified bone grindings were stained with trichrome Masson-Goldner to
investigate the healing quality and general tissue appearance within the fractured area
as described below.
The samples were deplastified for two days in two changes of 2-methoxyethyl-acetate
(8.06061, Merck Germany). Later, the samples were rehydrated in decreasing ethanol
series namely, 100 %, 96 % and 70 % each for five minutes and then for five minutes
in distilled water. Then, the samples were incubated in Weigert’s iron hematoxylin A +
B (X906/ X907, Roth, Germany) for three minutes, washed under running tap water for
ten minutes to develop the blue colouration. The samples were incubated for five
minutes in a freshly prepared Masson solution made from Fuchsin-Ponceau-
Azophloxin compounds. Afterwards, the samples were rinsed in 1 % acetic acid
(9372.4, Roth, Germany) and then incubated in Tungstophosphoric acid orange-G
solution for 8 minutes and washed in 1 % acetic acid. Finally, the samples were
incubated in 0.2 % light green (62110, Fluka, Germany) for eight minutes, rinsed again
in 1 % acetic acid and dehydrated very rapidly in 100 % ethanol and then cleared twice
in xylene for ten minutes each before mounting in coverslips with Eukitt (03989, Sigma-
Aldrich, Germany).
2.11.1.1 Preparation of reagents
❖ Weigert’s Iron Haematoxylin: 40 ml solution A + 40 ml solution B.
❖ Masson Solution (Fuchsin-Ponceau-Azophloxin):
▪ Solution A: 1 g Fuchsion-Ponceau Masson (1A-350, Chroma, Germany)
in 100 ml dH2O, bring to boil and add 1 ml glacial acetic acid.
▪ Solution B: 1 g Ponceau de Xylidine in 100 ml dH2O, bring to boil and
add 1 ml of glacial acetic acid. Filter the solution before use.
▪ Solution C: 0.5 g Azophloxin in 100 ml dH2O + 200 µl glacial acetic acid.
▪ Working solution 1: 3.3 ml solution A + 6.7 ml part solution B + 2 ml
solution C + 88 ml 0.2 % glacial acetic acid. Filter the solution before use.

Materials and Methods
21
❖ Tungstophosphoric acid Orange G Solution: 3 g Tungstophosphoric acid
(1.00583, Merck, Germany) + 2 g Orange G (1B-221, Chroma, Germany) in 100
ml dH2O. Filter the solution before use.
❖ 0.2 % Light green: 0.2 g brilliant green + 200 µl glacial acetic acid in 100 ml
dH2O. Filter the solution before use.
2.11.2 Von-Kossa van-Gieson stain
The undecalcified bone sections were stained with von-Kossa van-Gieson to
differentiate the mineralised bone area from the osteoid area and to quantify the newly
mineralised bone within the fractured area as described below.
The samples were deplastified in three changes of 2-methoxyethyl-acetate (MEA) for
20 minutes per round. Subsequently, the samples were rehydrated in decreasing
ethanol series namely, 100 %, 96 % and 70 % each for five minutes and then for five
minutes in distilled water. Afterwards, the samples were stained with von-Kossa as
follows: incubation in 3 % silver nitrate solution (131459, Applichem, Germany) for five
minutes, followed by rinsing in three changes of distilled water and then for about two
minutes in 10 % sodium carbonate-formaldehyde solution. The samples were washed
under running tap water for ten minutes, then fixed in 5 % sodium-thiosulfate solution
(1.06509, Merck, Germany) for five minutes before being rinsed in two changes of
distilled water for two minutes each. The samples were contrasted in 0.8 % methyl
green solution (5159, Roth Germany) for eight minutes and washed in three changes
of distilled water for two minutes each. Then samples were stained with van-Gieson as
follows: incubation in Weigert’s iron haematoxylin for six minutes, washed under
running tap water for ten minutes, followed by immersion in van-Gieson solution (2E-
050, Chroma, Germany) for five minutes. Lastly, the samples were dehydrated very
quickly in 96 % and 100 % ethanol and cleared in two changes of xylene for five
minutes each before mounting in coverslips with Depex (18243.02, Serva, Germany).
2.11.2.1 Preparation of reagents
❖ 3 % silver nitrate solution: 3 g of silver nitrate (AgNO3) in 1000 ml dH2O.
❖ 10 % sodium carbonate-formaldehyde: 10 g sodium carbonate (A315, Roth,
Germany) + 25 ml 37 % formaldehyde (104002, Merck,Germany). Bring to 1000
ml with dH2O.

Materials and Methods
22
❖ 5 % sodium thiosulphate solution: 5 g sodium thiosulphate in 1000 ml dH2O.
❖ 0.8 % methyl green: 1 g methyl green in 25 ml absolute ethanol.
2.11.3 Silver nitrate stain
The undecalcified Technovit-embedded sections were stained with silver nitrate to
visualise the morphology of the osteocyte-lacuna canaliculi network and quantify the
osteocytes lacunae within the fractured area as described below.
After sample deplastification and rehydration as described for the trichrome Masson-
Goldner stain, the bone sections were decalcified in a solution (pH 7.3) containing 3.4
% Tris (4855, Roth, Germany) and 10 % Titriplex III (1.08418, Merck, Germany) for
three days. The samples were incubated in the silver nitrate mixture, containing a 1:2
ratio of solution A and B for 90 minutes in the dark. The samples were rinsed in distilled
water for five minutes, followed by ten minutes incubation in a freshly prepared 5 %
sodium thiosulfate solution and then five minutes washing in distilled water. The
samples were subsequently dehydrated through an ascending ethanol gradient (70 %,
96 % and 100 %) for five minutes each and cleared in two changes of xylene before
mounting in coverslips with Depex.
2.11.3.1 Preparation of reagents
❖ Solution A: 24.75 ml ddH2O + 250 µl methanoic acid + 0.5 g gelatin low bloom.
❖ Solution B (50 % silver nitrate): 10 g silver nitrate in 20 ml ddH2O.
❖ 5 % sodium thiosulfate solution: 1 g sodium-thiosulfate in 20 ml ddH2O.
2.12 Enzyme histochemical staining
2.12.1 Alkaline phosphatase (ALP) stain
The undecalcified bone sections were stained with ALP to investigate the activity of
osteoblasts in the fractured area. The bone sections were deplastified in MEA and
rehydrated in descending series of alcohol as already described above. Next, the
samples were treated with 0.1 M Tris-buffer (pH 9.4) for ten minutes and then
incubated in ready-to-use 5-bromo,4-chloro,3-indolylphosphate/nitrobluetetrazolium
substrate solution (50-81-08, KPL, Germany) using a moist chamber at 37 oC for one
hour. Afterwards, the sections were rinsed in three changes of distilled water and

Materials and Methods
23
counterstained with nuclear fast red aluminium sulphate solution (N069, Roth,
Germany), followed by washing in three changes of distilled water. The stained
samples were dehydrated in an ascending series of alcohol and cleared in xylene
before mounting with coverslips using Eukitt.
2.12.1.1 Preparation of reagents
❖ 1 M Tris-buffer, pH 9.4: 121.1 g Tris in 1 L dH2O. Adjust pH to 9.4 with 25 %
HCl.
▪ 0.1 M Tris-buffer, pH 9.4: 100 ml 1 M Tris-buffer + 900 ml dH2O.
2.12.2 Tartrate-resistant acid phosphatase (TRAP) stain
The undecalcified bone sections were stained with TRAP to investigate the activity of
bone tissue associated macrophages such as osteoclasts. The deplastified sections
were treated with 0.1 M sodium acetate buffer, pH 5.2 for ten minutes, followed by
incubation in TRAP-stain solution containing naphthol-AS-TR-phosphate, N,N-
dimethyl formamide, fast red, sodium tartrate and sodium acetate buffer using a moist
chamber at 37 oC for one hour. The sections were later rinsed in three changes of
distilled water for five minutes each and then counterstained with Shandon Instant-
hematoxylin (6765015, Thermo Scientific, Germany) for about 20 seconds and rinsed
again in distilled water for one minute. Afterwards, sections were placed under running
tap water for ten minutes, rinsed in distilled water for five minutes, and then
coverslipped using the Kaisers Glycerin gelatin (6474, Roth, Germany).
2.12.2.1 Preparation of reagents
❖ 1 M sodium acetate: 82.03 g sodium acetate (1.062680, Merck, Germany) in 1
L dH2O. Adjust pH to 5.2 with 25 % HCl.
▪ 0.1 M sodium acetate (pH 5.2): 100 ml 1 M sodium acetate + 900 ml
dH2O.
❖ TRAP-stain solution: Transfer substrate solution 1 into substrate solution 2. Mix
thoroughly and filter before use.
▪ Substrate solution 1: 35 mg of Naphthol-AS-TR-Phosphate (N6125,
Sigma-Aldrich, Germany) in 125 µl of N, N-dimethyl formamide (D4551,
Sigma-Aldrich).

Materials and Methods
24
▪ Substrate solution 2: 57.5 mg sodium tartrate-dihydrate (1.06663, Merck)
in 1 ml of sodium acetate buffer + 35 mg fast red (368881, Sigma-Aldrich)
in 1 ml of sodium acetate buffer. Mix thoroughly.
❖ Instant-Haematoxylin stock solution: dissolve part A and B in 1 L ddH2O. Mix
thoroughly.
▪ Instant-Haematoxylin working solution: 100 ml of instant haematoxylin
stock solution + 300 ml ddH2O. Mix thoroughly and filter before use.
2.13 Immunohistochemical staining
Immunohistochemistry was performed on undecalcified bone sections using the
standard Avidin-Biotin Complex (ABC) method. The indirect antigen detection method
involves an unlabelled primary antibody reacting with the tissue antigen and a
biotinylated secondary antibody that reacts with the primary antibody. The signal is
subsequently amplified using the Vectorstain ABC HRP kit that will form a complex of
avidin-biotin-peroxidase. Finally, the peroxidase enzyme complex in conjunction with
the Vectorstain NovaRED peroxidase substrate forms an insoluble brown-coloured
precipitate. The bone sections were stained with both the primary and secondary
antibodies for BMP2, OPG, RANKL (CD254) and ASMA to determine and quantify their
cellular expression levels within the fractured area. The antibodies were titrated for
optimal working dilution before use. Also, the staining protocol was optimised to avoid
unspecific staining.
2.13.1 Bone morphogenetic protein-2 (BMP2) stain
The undecalcified bone sections were stained with BMP2 to investigate the activity of
osteoblasts. After deplastification in MEA, the samples were incubated in 100 %
acetone (9372, Roth, Germany) for ten minutes, then in a solution of acetone and wash
buffer (1:1) for another ten minutes, followed by washing in two changes of wash buffer
for five minutes each. Subsequently, an antigen retrieval step was performed with
citrate buffer solution, pH 6.0 at 60 oC for 20 minutes. The samples were cooled down
to room temperature, washed in two changes of wash buffer (TBS-X) for five minutes
each. The endogenous peroxidase activity was blocked with 3 % H2O2 (v/v) in wash
buffer for ten minutes, then washed in three changes of wash buffer for five minutes
each. Sections were incubated overnight at 4 oC with the rabbit polyclonal anti-human

Materials and Methods
25
BMP2 antibody (AP20597PU-N, Acris, Germany) diluted 1:150 with the DAKO dilution
buffer (S302283, Agilent Technologies, Germany). A negative control incubated only
with the dilution buffer was included. Next, samples were washed in three changes of
wash buffer for five minutes each and then incubated with biotinylated goat anti-rabbit
secondary antibody (BA-1000, Vector, USA) diluted 1:500 with 1 % bovine serum
albumin (A3912, Sigma-Aldrich, Germany) in Tris-buffered saline (4855.2, Roth,
Germany) plus 12.5 % sheep serum (S2263, Sigma-Aldrich, Germany) for 40 minutes
at room temperature. The samples were washed in two changes of wash buffer for five
minutes each. The signals from the target antigen were amplified using the Vectorstain
Elite ABC HRP-kit (PK-6100, Vector, USA) for 30 minutes at room temperature. Then,
the samples were washed twice in wash buffer and once in distilled water for five
minutes each. Visualisation of the detected signals was enabled by five minutes
staining with the NovaRED peroxidase substrate kit solution (SK-4800, Vector, USA).
Subsequently, the samples were washed in three changes of distilled water for five
minutes each. The nuclei were counterstained with Shandon instant-haematoxylin for
about 20 seconds, rinsed briefly in distilled water, placed under running tap water for
ten minutes, and then washed in distilled water for five minutes. Lastly, the samples
were dehydrated through an ascending series of alcohol, cleared in xylene and
mounted with coverslips using Depex.
2.13.2 Osteoprotegerin (OPG) and Receptor activator of NF-kB ligand (RANKL) stain
OPG and RANKL were stained to quantify the cellular expression levels of both
proteins as key regulators of osteoblastogenesis and osteoclastogenesis, respectively.
The staining of the undecalcified bone sections with the OPG and RANKL primary
antibodies also followed the similar procedures as described for BMP2 above. OPG
was detected using a dilution of 1:300 rabbit polyclonal OPG antibody (250800,
Abbiotec, USA). RANKL was detected using a dilution of 1:150 rabbit polyclonal
CD254 antibody (251263, Abbiotec, USA). Both primary antibodies were detected
using biotinylated goat anti-rabbit secondary antibody (BA-1000, Vector, USA) diluted
at 1:500 with 1 % bovine serum albumin in Tris-buffered saline plus 12.5 % sheep
serum.

Materials and Methods
26
2.13.3 Alpha-smooth muscle actin (ASMA) stain
ASMA staining was used to investigate tissue vascularisation by quantifying the
positively stained blood vessels in the fractured area. The ASMA staining also followed
a similar procedure as described for BMP2 above. However, no antigen retrieval step
was included. The staining was carried out using a 1:400 dilution of monoclonal mouse
anti-human smooth muscle actin (M0851, Agilent Technologies, Germany). The
primary antibody was detected with a horse anti-mouse secondary antibody (BA-2001,
Vector, USA) diluted 1:150 in 1 % bovine serum albumin in Tris-buffered saline plus
12.5 % sheep serum.
2.13.3.1 Preparation of reagents
❖ Citrate buffer, pH 6:
▪ Solution A (100 mM citric acid): 0.2 g citric acid (3958.2, Roth, Germany)
in 10 ml dH2O.
▪ Solution B (100 mM sodium citrate): 5.8 g sodium citrate (106448, Merck,
Germany) in 200 ml dH2O.
▪ Working solution: Add 41 ml of solution B to 400 ml dH2O and adjust pH
to 6.0 using solution A. Bring the volume to 500 ml with dH2O.
❖ Tris-sodium chloride buffer (TBS), pH 7.4: Stock solution: 60.57 g Tris-base
(4855.2, Roth, Germany) + 87.66 g sodium chloride (31434, Sigma-Aldrich,
Germany) in 1000 ml dH2O. Adjust the pH to 7.4 with 25% HCl.
▪ Working solution: 100 ml stock solution to 900 ml dH2O.
❖ Wash buffer: 1000 ml TBS working solution + 0.025 % Triton-X. Mix thoroughly.
❖ Tris-buffered saline-bovine serum albumin (TBS-BSA): 1 g BSA in 100 ml of
TBS.
❖ 3 % H2O2: 7 ml 30 % H2O2 (8.22287, Merck, Germany) + 63 ml wash buffer.
❖ Vectorstain Elite ABC kit solution: 1 ml TBS + 18 µl reagent A + 18 µl reagent.
Prepare fresh solution 30 minutes before use.
❖ NovaRED peroxidase substrate kit solution: 5 ml dH2O + 3 drops of reagent 1.
Mix properly. Then add two drops of reagent 2 and mix properly. Add two drops
of reagent 3 and mix properly. Lastly, add two drops of hydrogen peroxide
solution and mix thoroughly. Prepare the reagent about 30 minutes before use
and store in the dark.

Materials and Methods
27
2.14 Light microscopic imaging
Images were acquired using a Leica light microscopy system (Leica DM5500
photomicroscope equipped with a DFC7000 camera and operated by LASX software
version 3.0; Leica, Wetzlar, Germany).
2.15 Bone Histomorphometric analysis
Histomorphometric analysis was performed on the overview images generated from
the Leica microscope using Adobe Photoshop (version CS6, Adobe, Germany). After
loading each image, the system was calibrated according to the objective size. The
ROI was defined and manually contoured in the fractured area of the operated left
femur and at a comparable region in the unoperated right femur. Then, the positively
stained area was selected and measured in a semi-automated manner, and the value
was given in square millimetre. The generated values were then used to determine, for
instance, the percentage of osteoid and mineralised bone areas of the operated femur
relative to the unoperated femur. Similarly, the histomorphometric assessment was
also performed on the TRAP, ALP, OPG, BMP2 and RANKL stained samples. Manual
counting of the blood vessels and osteocytes lacunae was performed for the ASMA
and silver nitrate staining, respectively.
2.16 Gene Expression analysis
2.16.1 RNA isolation
The freshly frozen bone slices stored in RNAlater solution at -80 oC were thawed at
room temperature. The newly formed trabecular bone within the fractured area of the
operated femur was carefully selected. For comparison, the trabecular bone was also
collected from the metaphyseal area of the unoperated contralateral side.
Subsequently, about 50 mg was collected from each sample with the aid of forceps for
RNA isolation using the Lipid Tissue Mini Kit (160021969, Qiagen, Germany)
according to the manufacturer’s protocol. The isolated RNA was quantified using
NanoDropTM 1000 Spectrophotometer (NanoDrop Technologies, USA). After DNase
treatment to remove genomic DNA, 0.5 µg RNA from each sample was reserved
transcribed to cDNA using the QuantiTect Reverse Transcription Kit (157036867,

Materials and Methods
28
Qiagen, Germany) as described by the manufacturer. The samples were stored at -20
oC.
2.16.2 Primer testing and validation for the target genes
The primers for BMP2, OPG and RANKL were designed, tested and validated before
being used for gene expression analysis. The remaining primers, namely osteocalcin
(BGLAP), collagen type-1 alpha-1 (COL1A1), collagen type-2 alpha-1 (COL2A1),
cathepsin-K (CTSK) and ALP were directly used for analysis since they were already
established in the laboratory. The forward and the reverse sequences of the primers
and the amplicon length are shown in table 5.
Table 5: The forward and reverse primer sequence of the target genes.
Gene Forward Sequence (5’ 3’) Reverse Sequence (5’ 3’) Amplicon length (bp)
BGLAP CAGCGAGGTGGTGAAGAGAC GCTCATCACAGTCAGGGTTG 122
CTSK GGGTCAATGTGGTTCCTGTT GCAGCCATCATTCTCAGACA 133
COL1A1 CCAGTCACCTGCGTACAGAACG GCCAGTGTCTCCTTTGGGTCC 246
ALP TCAGCAGACCCTGAAAAATG TTCTTAGCCACGTTGGTGTTG 60
BMP2 GAAAGGACACCCTCTCCACAG GCAACGATCCAGTCATTCCAC 135
OPG AAACAGCGACACAACTCACG TGTCCAATATGCCTCCTCACG 140
RANKL CTGTGCAGAAGGAAATGCAAC GCGTTAATCGTGAGATGGGC 139
COL2A1 ACCCAGAACCAACACAATCC TCAGTGCAGAGTCCTAGAGTG 81
B2M CCAGAAGATGGAAAGCCAAA AGCGTGGGACAGAAGGTAGA 159
2.16.3 Quantitative PCR
Quantitative PCR analysis of BMP2, OPG, RANKL, ALP, BGLAP, COL1A1, COL2A1,
CTSK and the reference gene B2M were performed with the Quantifast SYBR Green
PCR Mastermix kit (151050429, Qiagen, Germany) on the LightCycler® 2.0 instrument
(software version 4.1, Roche, Germany). Each capillary tube contained 2 µl sample
cDNA, 5 µl Quantifast SYBR Green PCR Mastermix, 0.2 µl (20 µM) of the primer and
RNase free water to bring it to a final volume of 10 µl. The sample mixture was
centrifuged for about one minute before thermal cycling. The thermal cycling program
comprised of one denaturation cycle at 95 oC for five minutes, followed by 40 PCR
cycles at 95 oC for ten seconds and 60 oC for 30 seconds. The specificity of the
amplicon was verified using melting curve formation under one cycle at 95 oC, down to
60 oC for 15 seconds and back to 95 oC. The last cycle was a cooling step at 40 oC for
30 seconds. All analysis was performed in duplicate. Two negative controls, that is, a

Materials and Methods
29
mixture without transcriptase (RT-) and water instead of cDNA were included in each
run. A sample with a known CT value served as the positive control.
2.16.4 Data analysis
The mean values from the duplicate run were determined and normalised to the
reference gene. Afterwards, the relative expression of the target genes of the operated
left femurs was compared to those of the unoperated right femurs using the 2-ΔCT
method [54].
Relative expression = 2-ΔCT
ΔCT (operated left femur) = (CT, target gene left femur - CT, B2M left femur)
ΔCT (unoperated right femur) = (CT, target gene right femur - CT, B2M right femur)
2.17 Time-of-Flight Secondary Ion Mass Spectrometry (ToF-SIM) analysis
The local distribution of calcium and collagen within the fractured area was studied
using the ToF-SIMS 5-100 machine (ION-TOF Company, Germany) equipped with a
25 keV Bi-cluster ion source for surface examination. This analysis was performed by
Dr. A. Henss, a collaborating partner at the Institute of Physical Chemistry, University
of Giessen. The analysis was performed on undecalcified bone sample grinding of
approximately 70 µm thickness. The ToF-SIMS method has been previously described
[55]. Briefly, a primary ion gun using Bi3+ as main ion species was operated in the high
current bunched (hc-bu) mode with highest mass resolution and a lateral resolution of
about 10 µm. The signals collected from C4H8N+, a proline derivative, which is one of
the main components of collagen was used to image the collagen distribution [56]. The
Ca+ signal represented the mineralised bone area. To obtain a good mass image of
the bone slice, a complete stage scan with a pixel density of 100 per mm, a cycle time
of 60 µs, five frames per patch and three scans were generated. Single images with
sizes of 400 x 400 µm2 were stitched together to obtain areas of several square
millimetres. Data evaluation was done with the Surface Lab 6.7 software of IONTOF
Company.

Materials and Methods
30
2.18 Embedding of bone slices in Epon
The newly formed trabecular bone samples harvested from the fractured area were
embedding in Epon to enable ultrastructure analysis as described below:
❖ Fixation: yellow fix buffer overnight at 4-8 °C.
❖ 6x washing using 0.1 M Cacodylate buffer at 4-8 °C with rigorous shaken.
❖ 3x washing using 0.1 M Cacodylate buffer at 4-8 °C with rigorous shaken.
❖ Store at 4 °C overnight in 0.1 M Cacodylate buffer.
❖ 3x washing using 0.1 M Cacodylate buffer at 4-8 °C with rigorous shaken. The
washing step was continued until the yellow colour faded away.
❖ The samples were transferred into a dark staining rack.
❖ The samples were fixed once more in 1 % osmium tetroxide for two hours at
room temperature.
❖ 6x washing using 0.1 M Cacodylate buffer at 4-8 °C with rigorous shaken. At
least five minutes per wash.
The samples were dehydrated in increasing concentration of ethanol and xylene as
shown in table 6.
Table 6: Sample embedding in Epon.
Duration of the dehydration, infiltration, embedding and polymerisation steps.
Treatment phase: Dehydration, infiltration and embedding
Dehydration in Ethanol
Concentration Duration Temperature
30 % 10 minutes RT
50 % 2x 10 minutes RT
70 % 2x 10 minutes RT
80 % 2x 10 minutes RT
96 % 2x 10 minutes RT
100 % 15 minutes RT
100 % 3x 30 minutes RT
100 % 45 minutes RT
Intermedium in Xylene
Concentration Duration Temperature
100 % 3x 15 minutes RT
Resin embedding (Epon mix)
Reagent Duration Temperature
Infiltration 1 2 hours Desiccator, 600mbar
Infiltration 2 Overnight Desiccator, 600 mbar
Infiltration 3 4 hours Desiccator, 600 mbar
Infiltration 4 Overnight Desiccator, 600 mbar

Materials and Methods
31
Infiltration 5 10 minutes 60 °C incubator
50 minutes Desiccator, 600 mbar
10 minutes 60 °C incubator
50 minutes Desiccator, 600 mbar
10 minutes 60 °C incubator
50 minutes Desiccator, 600 mbar
10 minutes 60 °C incubator
50 minutes Desiccator, 600 mbar
Embedding 10 minutes 60 °C incubator
Embedding 15 minutes Desiccator, 600 mbar
Polymerisation I 3 hours 48 °C
Polymerisation II 20 hours 60 °C
Key: mbar: millibar; °C: degree Celsius; RT: room temperature
2.18.1 Preparation of reagents
❖ Yellow fixation buffer (stock solution): 2 % paraformaldehyde (0335, Roth,
Germany) in 500 ml dH2O + 500 ml sodium phosphate buffer solution (pH 7.2-
7.4) + 0.02 % picric acid (74069, Sigma-Aldrich, Germany).
▪ Working solution: 32 ml of 25 %-glutaraldehyde (3778, Roth, Germany)
+ 268 ml of the yellow fixation buffer stock solution.
❖ 0.2 M Cacodylate buffer: 42.8 g Sodium cacodylate trihydrate (5169, Roth,
Germany) in 1 L of ddH2O. The pH was adjusted with 0.2 N HCl to 7.2.
▪ Working solution (0.1 M): Mix 1 part of 0.2 M cacodylate buffer + 1 part
of dH2O.
❖ 2 % Osmium tetroxide (OSO4): 1 g OSO4 (8371, Roth Germany) + 50 ml ddH2O.
❖ Epon stock solution: 95 ml Glycid ether (21045, Serva, Germany) + 40 ml 2-
Dodecenylsuccinic acid anhydride (20755, Serva, Germany) + 62 ml
Methylnadic anhydride (29452, Serva, Germany).
▪ Epon working solution was prepared by mixing the 197 ml stock solution
+ 3 ml 1.5 % 2,4,6-Tris(dimethylaminomethyl)phenol (20755, Serva,
Germany).
❖ Infiltration 1: 10 ml Xylene + 5 ml Epon working solution.
❖ Infiltration 2: 5 ml Xylene + 5 ml Epon working solution.
❖ Infiltration 3: 5 ml Xylene + 10 ml Epon working solution.
❖ Infiltration 4: 15 ml Epon working solution.
❖ Infiltration 5: 15 ml Epon working solution.

Materials and Methods
32
❖ Embedding: Samples were embedded in Epon working solution. The final
volume was dependent on the size of the embedding form. The samples were
placed longitudinally on the narrow part of the form with the number tags.
2.19 Ultramicrotomy
2.19.1 Semi-thin sections
Semi-thin sections of about 0.5 µm thickness were prepared from the Epon-embedded
samples using a histo-knife (DH4580 Diatome, Switzerland) on the ultramicrotome
machine (701 701, Reichert-Jung, Germany). Each section was transferred onto a
superfrost plus glass slide (03-0060, Langenbrinck, Germany) with the aid of a perfect
loop (Diatome, Switzerland) and the sections were dried on a hot plate at 70 oC. The
sections were stained for 15 seconds in Toluidine blue solution containing 1.25 %
Toluidine blue (1B-481, Chroma Germany) + 1 % Borax (1.06306, Merck, Germany)
diluted in double distilled water and then for five seconds in Safranin-O solution
consisting of 1 % Safranin (1.15948, Merck, Germany) + 1 % Borax diluted in double
distilled water, while been placed on a hot plate. Dried sections were coverslipped
using a small drop of warm Epon solution and then polymerised at room temperature
for two days. The samples were examined under the light microscope to localise the
ROI. Overview images were taken, and the ROIs were identified and marked to enable
further sample trimming and generation of the ultrathin sections.
2.19.2 Ultrathin sections
After proper sample trimming and cutting, ultrathin sections between 60 - 80 nm
thicknesses were cut from the ROIs with the aid of a 35o-diamond knife (DU3525,
Diatome, Switzerland) and an ultra-microtome machine (701 701, Reichert-Jung,
Germany). Sections were carefully transferred onto 200 mesh copper grids (G2200C,
Plano, Germany) that have been previously filmed with 2 % Collodion (12620-10, EMS,
USA). To enable similar and reproducible contrasting, all samples were contrasted with
0.5 % uranyl acetate (Ultrostain 1, Laurylab, France) for 30 minutes and 3 % lead
citrate (Ultrostain 2, Leica, Germany) for 80 seconds using the Leica contrasting
machine (Leica EM AC20, Germany) in accordance with the manufacturer’s protocol.
Afterwards, the grids were dried, and the samples were stored using a grid box.

Materials and Methods
33
2.20 Transmission electron microscopic imaging
Images were acquired using a Zeiss transmission electron microscopy system (Zeiss
EM912 OMEGA, Germany), equipped with a camera (TRS Sharp Eye 2k slow-scan
CCD, Tröndle, Moorenweis) and controlled by the Olympus iTEM software. During
imaging, the camera was cooled at -5 oC by the iTEM software.
2.21 Statistical analysis
The data analysis and graphical presentations were done using GraphPad Prism 8.0
(GraphPad Software Inc, USA) and SPSS (V.22.0, SPSS Inc, USA). All results are
presented as means ± standard error of the mean. The mean values from the operated
left femur were compared to those of the unoperated right femur using the Wilcoxon
matched-pairs signed rank test or paired Student's t-test to determine if a significant
difference exists between the two groups and p-values less than 0.05 were considered
significant.

Results
34
3. RESULTS
3.1 Clinical observations
All the six animals tolerated the 10 mm osteotomy gap created at the distal
metaphyseal area of the left femur. The animals returned to their normal activity and
full load bearing around day three post-surgery. Postoperative X-ray of the femur
revealed the fracture gap at the distal femur metaphysis with correct placement of the
plate and locking screws that extended into the epiphysis for better stability of the
fracture (Fig. 7A-B). All the sheep survived the observation period without any plate
breakage, fracture or other relevant adverse events and could be euthanised according
to the study protocol.
Fig. 7. Postoperative X-ray analysis of the operated femur. (A) The postoperative X-ray image on day 1 revealed the wedge-shaped metaphyseal fracture in the frontal plane on the antero-posterior view (arrow) with the locking plate and screws. (B) The lateral view showed the proper alignment of the plate along the femur axis. The osteotomy is not visible on the lateral image due to the overlying plate.
3.2 Bone mineral density evaluation
The whole-body BMD of each animal was measured immediately before the fracture
and at 12 weeks post-fracture to determine whether the BMD of the animals were
comparable before and after the surgery. The measurement revealed similar BMD in
the study animals (Fig. 8A). The average BMD value at three months was slightly
reduced at both the operated left and unoperated right femurs, but with no significant
difference (Fig. 8B).

Results
35
Fig. 8. Evaluation of the BMD. (A) The BMD at the whole-body region of the individual animal before and three months after femur osteotomy (B) Average BMD values on the operated left and unoperated right femurs. ns = not significant.
3.3 Micro-computed tomography analysis
3.3.1 Substantial bony bridging of the fracture gap evident by the high healing scores
Next, the healing quality at the fractured area was determined by a macroscopic
analysis of the reconstructed 3D micro-CT images of the bone slices. Qualitatively,
images of all samples revealed a complete bridging of the fracture gap from the medial
side up to two-thirds of the fractured area. Four of the six samples (Fig. 9A-D) achieved
almost complete healing of the entire fracture gap from the medial to the lateral cortex
whereas the remaining two samples attained partial healing (Fig. 9E-F). Blinded
scoring of the degree of healing by two independent investigators showed scores
ranging between 4 and 8.5 from a maximal score of 9 (Fig. 10). The newly formed bone
present in the fractured area appeared very dense and quite like the native bone
outside the fractured area.

Results
36
Fig. 9. Micro-CT image evaluation of the healing status of all six sheep at 12 weeks post-fracture. (A-D) Four of the six sheep, namely sheep number 2 (A), 3 (B), 5 (C) and 6 (D), showed almost complete bone bridging of the entire fractured area. (E-F) Partial healing of the fracture was evident in sheep 1 (E) and 4 (F). The fracture bridged fully from the medial aspect but very minor from the lateral side. The wedge-shaped outline shows the fractured area. (G-H) Two representative images of bone slices from the unoperated right femur showing the intact metaphyseal bone area.

Results
37
Fig. 10. Qualitative evaluation of the degree of bone healing. Healing score was determined from the macroscopic assessment of the fractured area from medial to the lateral end of the cortex.
3.3.2 An increased amount of newly formed bone revealed by the quantitative 3D-
morphometry
Direct 3D-quantitative morphometry of a defined ROI within the trabecular bone area
of the operated femur and a corresponding region within the unoperated femur showed
that the bone volume (BV) and the ratio of the bone volume to total volume (BV/TV)
were comparable in both femurs (Fig. 11A-B). Also, the number of trabeculae within
the healed operated femur was comparable to the unoperated side (Fig. 11C).
However, the thickness and spacing of the trabeculae were significantly higher in the
operated femur when compared to the unoperated femur (Fig. 11D-E). Furthermore,
the structural model index (SMI), a parameter for estimating the shape the trabecular
was significantly reduced in the operated femur (Fig. 11F).

Results
38
Fig. 11. Quantitative micro-CT image analysis. A direct 3D quantitative morphometry of a defined ROI within the trabeculae of the operated femur and the unoperated contralateral femur showing positive structural changes of the new trabeculae as revealed by a higher (A) bone volume (B) bone volume / total volume (BV/TV) and (C) comparable number of trabeculae (Tb.N). (D-E) A significantly higher trabecular spacing (Tb.Sp) and thickness (Tb.Th). (F) A negative structural mass index (SMI)
value. ns = not significant.
3.4 Biomechanical analysis
3.4.1 A comparable bone stiffness at both the operated and unoperated femurs
The indentation test on nine different points covering the trabecular and cortical regions
within the fractured area and sub-regions was performed on the bone slices to compare
the stiffness of the fractured bone to those of the unoperated contralateral femur. The
data generated by the cooperation partner as mentioned in the method section was
used for the quantitative analysis. The quantification of the bone biomechanical
strength based on the degree of stiffness showed that the operated femur both at the
cortical and trabecular areas was not statistically different from the intact contralateral
side as shown in figure 12. Furthermore, the stiffness at both the cortical area of the
operated and unoperated femurs was two-fold more than in the trabecular area.
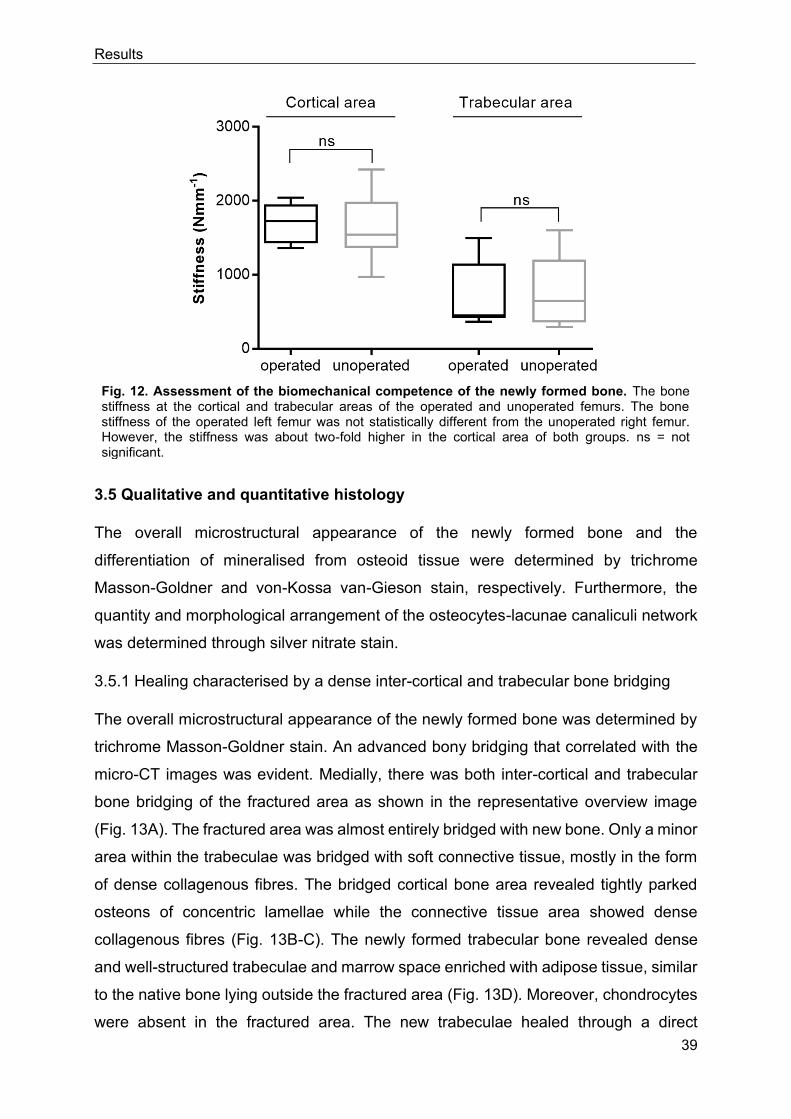
Results
39
Fig. 12. Assessment of the biomechanical competence of the newly formed bone. The bone stiffness at the cortical and trabecular areas of the operated and unoperated femurs. The bone stiffness of the operated left femur was not statistically different from the unoperated right femur. However, the stiffness was about two-fold higher in the cortical area of both groups. ns = not significant.
3.5 Qualitative and quantitative histology
The overall microstructural appearance of the newly formed bone and the
differentiation of mineralised from osteoid tissue were determined by trichrome
Masson-Goldner and von-Kossa van-Gieson stain, respectively. Furthermore, the
quantity and morphological arrangement of the osteocytes-lacunae canaliculi network
was determined through silver nitrate stain.
3.5.1 Healing characterised by a dense inter-cortical and trabecular bone bridging
The overall microstructural appearance of the newly formed bone was determined by
trichrome Masson-Goldner stain. An advanced bony bridging that correlated with the
micro-CT images was evident. Medially, there was both inter-cortical and trabecular
bone bridging of the fractured area as shown in the representative overview image
(Fig. 13A). The fractured area was almost entirely bridged with new bone. Only a minor
area within the trabeculae was bridged with soft connective tissue, mostly in the form
of dense collagenous fibres. The bridged cortical bone area revealed tightly parked
osteons of concentric lamellae while the connective tissue area showed dense
collagenous fibres (Fig. 13B-C). The newly formed trabecular bone revealed dense
and well-structured trabeculae and marrow space enriched with adipose tissue, similar
to the native bone lying outside the fractured area (Fig. 13D). Moreover, chondrocytes
were absent in the fractured area. The new trabeculae healed through a direct

Results
40
membranous bone formation at the marrow cavity without any visible callus. However,
a thin layer of periosteal callus was visible only at the medial end of the femoral cortex
whereas at the lateral cortex no external callus formation was visible.
Fig. 13. Microstructural features of the newly formed cortical and trabecular bone in the fractured area. (A) Overview image of a coronal ground bone section of sheep number 2 stained with trichrome Masson-Goldner showing an advanced bony bridging at the fracture gap. The gap was almost entirely replaced with new bone. No callus formation is evident at the lateral cortex whereas a thin layer of periosteal callus is visible at the end of the medial cortex. A minor area within the trabeculae is filled with soft connective tissue, marked C. Detail images of the (B) cortical bone area showed a compact mineralised cortex with the typical Haversian system, (C) connective tissue showed bundles of dense collagenous fibres, and (D) trabecular bone area revealing dense and well-structured mineralised trabeculae with marrow cavity lying within. The mineralised bone area was stained greenish-orange, and the unmineralised bone area was stained green.

Results
41
3.5.2 Major matrix mineralisation as evident by an increased amount of mineralised
bone area
The level of mineralisation of the newly deposited bone matrix was determined by the
von-Kossa van-Gieson stain. The images revealed a large area of mineralised bone
(black staining) and less of the osteoid area (pink staining) within the fractured area of
the operated left femur that was similar to that of the unoperated right femur (Fig. 14A-
B). The osteoid region surrounded the mineralised area and was majorly composed of
dense collagenous fibres with numerous osteoblasts embedded within (Fig. 14C-D).
The histomorphometric analysis of a defined ROI revealed an average of about 40 %
mineralised bone area in the operated femur that was comparable to the unoperated
femur (Fig. 14E). However, the percentage of the osteoid area in the fractured area
was significantly higher than the intact unoperated femur (Fig. 14F).

Results
42
Fig. 14. Major bone matrix mineralisation as evidence of advanced bone healing. Overview image of undecalcified bone sections of the (A) unoperated right and (B) operated left femurs stained with von-Kossa van-Gieson showing the mineralised area in black and the osteoid area in pink. Close-up images of B within the fractured area (yellow dashed-line sketch) revealed mainly mineralised bone area (C) and the minor osteoid area (D) showed collagenous fibres that surrounded and lined the surface of the mineralised bone with numerous osteoblasts embedded within. (E) A higher percentage of the mineralised bone area was evident; however, the quantity was not statistically different from the unoperated femur. (F) The percentage of the osteoid area of the operated femur was significantly higher relative to the unoperated femur. The dashed-line sketch shows the ROI area used for the histomorphometric analysis. ns= not significant.

Results
43
3.5.3 Increased number of regularly organised osteocytes-lacunae canaliculi network
The quality of the healing outcome in the fractured area was further characterised by
quantifying the osteocytes lacunae and the morphological arrangement of the
osteocyte-lacuna canaliculi network. Images of decalcified bone sections stained with
silver nitrate revealed mostly spherically shaped osteocytes lacunae organised in
lamellae and interconnected via the canaliculi network that was similar to the
unoperated contralateral side (Fig. 15A-C). The canaliculi network was mostly
arranged perpendicular to the longitudinal axis of the trabeculae. There was an
increased number of osteocytes lacunae in the fractured area. However, the amount
was significantly higher in the unoperated femur (Fig. 15D). Empty lacuna was mostly
found at the lateral cortex where the least bone bridging occurred.
Fig. 15. Increased number of well-organised spherically shaped osteocytes-lacunae with the canaliculi network as proof of the new bone maturation. Images of decalcified silver nitrate stained bone sections of (A-B) operated and (C) unoperated femur showing abundant spherically shaped osteocytes (arrows) that were regularly arranged within the trabecular bone area. The close-up images (B-C) revealed the osteocyte-lacuna canaliculi network. The canaliculi networks in both operated and unoperated femur were arranged perpendicular to the bone surface (arrowheads). (D) The amount of the osteocytes lacunae was significantly higher in the unoperated femur.

Results
44
3.6 Qualitative and quantitative enzyme histochemistry
3.6.1 A significantly higher cellular expression of ALP in the operated femur
The cellular activity of ALP as a key osteoblast marker associated with bone matrix
mineralisation and TRAP as an osteoclast marker involved in bone resorption was
determined by enzyme histochemical staining of the bone sections. The staining
revealed high expression of ALP-positive cells and reduced expression of TRAP-
positive cells in the fractured area (Fig. 16A-D). Similarly, histomorphometric analysis
depicted significantly higher ALP activity in the operated relative to the unoperated
femur (Fig. 16E). Although there was a lower activity of TRAP compared to ALP in the
fractured area, the amount of TRAP positive cells in the operated femur was
significantly higher than in the unoperated femur that expressed a negligible quantity
(Fig. 16F).
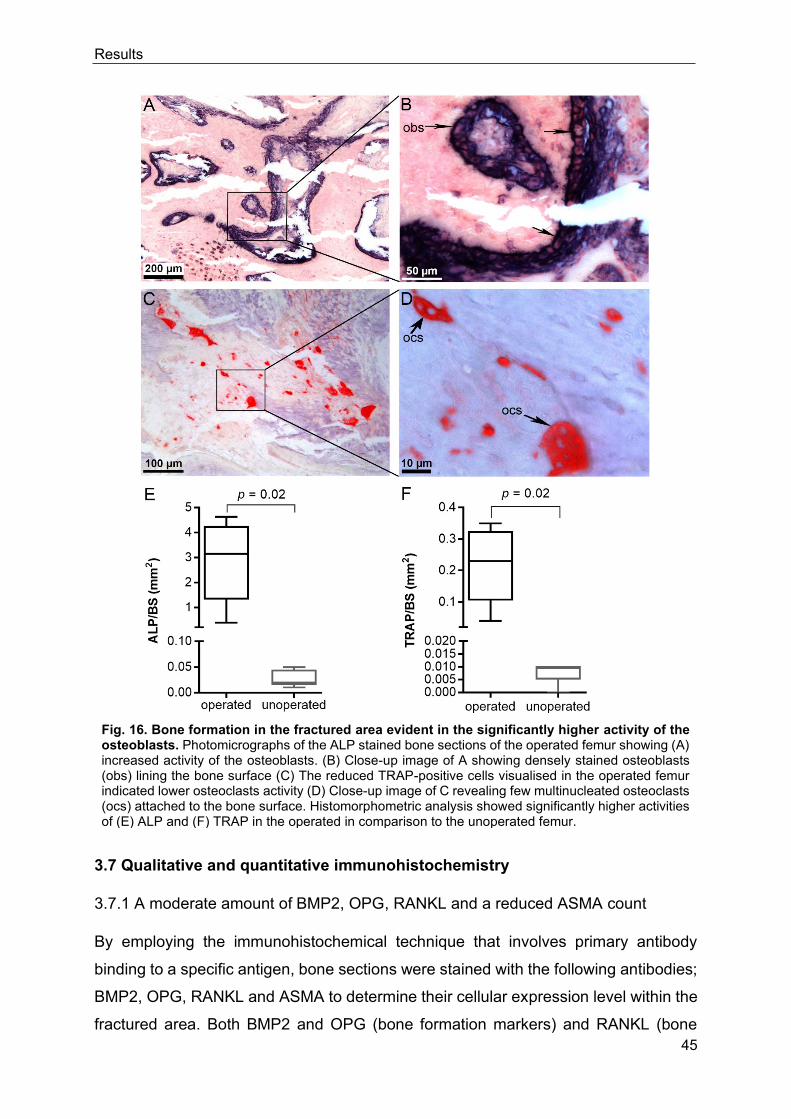
Results
45
Fig. 16. Bone formation in the fractured area evident in the significantly higher activity of the osteoblasts. Photomicrographs of the ALP stained bone sections of the operated femur showing (A) increased activity of the osteoblasts. (B) Close-up image of A showing densely stained osteoblasts (obs) lining the bone surface (C) The reduced TRAP-positive cells visualised in the operated femur indicated lower osteoclasts activity (D) Close-up image of C revealing few multinucleated osteoclasts (ocs) attached to the bone surface. Histomorphometric analysis showed significantly higher activities of (E) ALP and (F) TRAP in the operated in comparison to the unoperated femur.
3.7 Qualitative and quantitative immunohistochemistry
3.7.1 A moderate amount of BMP2, OPG, RANKL and a reduced ASMA count
By employing the immunohistochemical technique that involves primary antibody
binding to a specific antigen, bone sections were stained with the following antibodies;
BMP2, OPG, RANKL and ASMA to determine their cellular expression level within the
fractured area. Both BMP2 and OPG (bone formation markers) and RANKL (bone

Results
46
resorption marker) were positively expressed (Fig. 17A-C). Histomorphometric
analysis of the defined ROI (Fig. 17E) revealed similar quantities of the tested bone
formation and resorption markers (BMP2, OPG and RANKL). The positively stained
alpha smooth muscle cells localised within the vascular walls (Fig. 17D) confirmed the
presence of blood vessels in the fractured area. The blood vessels were typically small-
sized and sparsely distributed. The low ASMA count in the operated femur was
comparable to the unoperated contralateral femur (Fig. 17F).
Fig. 17. Comparative expression of BMP2, OPG, RANKL and ASMA. Photomicrographs of the bone sections revealed a brownish stained (A) BMP2 and (B) OPG area, indicating new bone formation. (C) RANKL positive area reflected osteoclast associated bone resorption. (D) ASMA positive area revealed small-sized blood vessels with thin lumen lying within the trabecular bone marrow as shown in the close-up image. (E) The reduced amounts of BMP2 and OPG corresponded with that of the bone resorption marker, RANKL in the operated femur. (D) The ASMA count of the operated was almost significantly higher than in the unoperated femur.

Results
47
3.8 Gene expression analysis
3.8.1 Up-regulation of prominent genes involved in bone formation
The gene expression of prominent bone formation and resorption markers in the
fractured area was quantified using quantitative PCR. Most of the tested genes were
expressed higher in the operated femur. However, the quantity was not statistically
different from the unoperated contralateral femur as shown in figure 18. The bone
turnover markers including, COL1A1, a dominant extracellular matrix collagenous
protein alongside BGLAP and ALP, which are important osteoblast markers known to
support bone matrix mineralisation were expressed at higher amount compared to
OPG and BMP2.
Further, COL2A1 a cartilaginous tissue marker was expressed in a negligible quantity
in both the operated and unoperated femur (Fig. 15A-F). The reduced expression of
the OPG gene correlated positively with that of its agonist, RANKL that was also
expressed in similar quantity resulting in equal RANKL/OPG ratio (Fig 15G-H).
Surprisingly, CTSK, an important bone resorption marker was expressed more in the
operated femur in contrast to the unoperated right femur (Fig 15I). However, there was
no statistical difference between both groups.

Results
48
Fig. 18. Relative expression of prominent bone formation and resorption genes. Relative expression of major bone formation markers: CoL1A1 (A), CoL2A1 (B), ALP (C), BGLAP (D), BMP2 (E), and OPG (F) and bone resorption markers: RANKL (G) and CTSK (I) in the operated left and unoperated right femurs. The ratio of RANKL to OPG showed similar expression amounts both in the operated and unoperated contralateral femur (H).

Results
49
3.9 Bone surface analysis using ToF-SIMS
3.9.1 Calcium and collagen surface mapping revealed similar intensity distribution
The local distribution pattern of calcium and collagen components of the newly formed
bone within the fractured area was measured using ToF-SIMS by a collaborator as
mentioned in the method section. The mass images of calcium and collagen
represented by Ca+ and C4H8N+ signals respectively, as well as overlay images, were
generated as shown in figure 19A-C. The calcium mapping revealed a quite
homogeneous calcium distribution with increased calcium content in the cortical
region. The colour scale encodes the signal intensity for each pixel, which means the
brighter the colour, the more the detected signal. The collagen signal also showed a
homogeneous distribution within the dense trabecular network. No noticeable
difference was seen in the Ca+ and collagen signal intensity between the newly formed
bone that replaced the fractured area and the native bone outside the fracture area.
The line scan given the summed signal intensity along the x-direction revealed higher
calcium and collagen signal intensity at the dense cortical bone region in comparison
to the trabecular bone region. However, within the fractured gap, the line scans
complemented the mappings and demonstrated the presence of calcium and collagen
in the fractured area.
Fig. 19. The local distribution pattern of calcium and collagen in the fractured area. Mass images of (A) Ca+ and (B) collagen fragment C4H8N+ showed homogenous distribution within and outside the fractured area. (C) An overlay image of calcium in red and collagen in green. Unmineralised collagen signal was detectable at the edge of the cortex. The line scans below the Ca+ and C4H8N+ mass images showed the signal intensity of calcium and collagen respectively, within the fractured area, as marked with the white rectangle. The signal intensity generated in y-direction was summed up and plotted with the distance in the x-axis.

Results
50
3.10 Ultrastructural analysis of the newly formed trabeculae
3.10.1 The localisation of the ROIs for further ultrastructural analysis
Next, to characterise the composition of the organic and inorganic matrix as well as
the unique features of osteoblasts, osteoclasts and osteocytes within the new
trabeculae. The ultrastructural features were investigated via transmission electron
microscopy. First, the samples were cut into semi-thin sections and examined under
the light microscope to localise ROIs for further electron microscopic investigation.
The ROI1 revealed an active remodelling zone as shown in figure 20A. The overview
image (Fig. 20A) showed a mineralised bone area partly surrounded by an
unmineralised area with an active remodelling front. A detail image of ROI1 at ‘point B’
(Fig. 20B) revealed parallel-aligned collagen fibres with abundant osteoblasts that
were embedded inside the osteoid area and surrounded by blood vessels. A close-up
image at ‘point C’, adjacent to the mineralisation front revealed predominantly
unaligned collagen fibre with osteocyte-like cells embedded within the matrix (Fig.
20C). The loss of the alignment of the collagen fibres at ‘point C’ (as opposed to ‘point
A’) indicated an ongoing mineralisation process. This observation is supported by the
increased number of young osteocytes originating from the osteoblasts. The Howship’s
resorption pit was visualised at ‘point D’ with osteoclasts resorbing the mineralised
bone surface (Fig. 20D).
The ROI2 (Fig. 20E) revealed a fully mineralised trabecular bone area with osteoblasts
lining the bone surface. A detail image of ROI2 at ‘point F’ (Fig. 20F) revealed plumb
osteoblasts arranged perpendicularly to the bone surface. Also, matured osteocytes
were embedded within the mineralised bone area.

Results
51
Fig. 20. The localisation of ROIs in the fractured area for further ultrastructural analysis. (A) An overview image of ROI1 showed partly mineralised bone area, osteoid area and an active remodelling front (arrows) within the trabeculae. Blood vessels were evident in the osteoid area. (B) A close-up image of ROI1 at ‘point B’ showed the parallel alignment of the collagen fibres with an abundance of embedded osteoblasts. (C) A close-up image of ROI1 at ‘point C’ revealed unaligned collagen fibres with many osteocyte-like cells embedded inside the matrix. (D) A close-up image of ROI1 at ‘point C’ showed the Howship’s resorption pit with osteoclasts resorbing the bone surface (arrows). (E) An overview image of ROI2 showed fully mineralised trabeculae with osteoblasts lining the bone surface. (F) A close-up image of ROI2 at ‘point F’ showed plumb osteoblasts (black arrows), and flattened osteoblasts (white arrow) arranged perpendicular to the bone surface. Matured osteocytes (black arrowheads) embedded inside the mineralised bone matrix.

Results
52
3.10.2 Ultrastructure of the organic matrix and the bone mineral material
The unmineralised organic matrix revealed smooth bundles of collagenous fibrils (Fig.
21A-B). The fibril has a thickness of about 50 nm. The fibrils were tightly packed
together in parallel orientation and the architecture resembled those of type 1 collagen.
The organic matrix was homogenously mineralised by the densely distributed bone
mineral particle of a few nanometres thickness. The deposition of the bone mineral on
the organic matrix seemed to have happened both parallel and perpendicularly to the
direction of the collagen fibrils. The aggregation of collagen fibrils increased as more
mineral particles deposit within and on the fibrillar space. The bone mineral appeared
as dense needle-like clusters with a diameter of about 1 µm (Fig. 21C-D).
Fig. 21. Ultrastructure of the organic matrix and the bone mineral material. (A-D) Electron micrographs of both ROIs showed the unmineralised organic matrix consisting of majorly collagen fibrils that were closely packed and parallel arranged. The densely mineralised area revealed a homogenous distribution of the bone mineral substance that localised within and on the collagen fibrils. The high electron-dense bone mineral particles appeared as needle-like clusters (arrows). At the active mineralisation front, the organic matrix appeared less dense.

Results
53
3.10.3 Ultrastructure of the osteoclasts
Large multinucleated osteoclasts actively involved in the resorption process were
localised at the trabecular bone surface (Fig. 22A) and in the vicinity of bone (Fig. 22B).
Their nuclei surrounded by Golgi apparatus were distributed in the cytoplasm and
positioned away from the resorption area. The osteoclasts revealed prominent ruffled
borders, known as the active resorption site that directly connected them to the bone
surface. Numerous large vacuoles and mitochondria laid very close to the ruffled
border (Fig. 22C). A closer focus into the ruffled border (Fig. 22D) revealed deep
invaginations of the cell membrane in the locality of the tissue to be resorbed.
Fig. 22. Ultrastructure of the osteoclasts. Osteoclasts (ocs) actively involved in bone resorption were attached directly to the bone surface (A) and some laid near the bone surface (B). Their large nuclei were positioned away from the resorption area. (C) A detail image of B revealed several cytoplasmic components surrounding the nucleus. The nucleus (black arrow) also revealed its highly electron-dense nucleolus, lying at the centre (white arrow). (D) A close-up image of the ruffled border showed deep invagination of the cell membrane into the resorption area (arrows). Small and large sized vacuoles (labelled V) and mitochondria (arrowhead) localised close to the ruffled border.

Results
54
3.10.4 Ultrastructure of the osteoblasts
Osteoblasts with different shapes, sizes and arrangements were evident in the
trabeculae. Several of the osteoblasts were actively involved in the secretion of the
new bone matrix along the mineralised bone surface. The active osteoblasts were
mostly cuboidal shaped and arranged perpendicularly to the bone surface with their
nucleus positioned opposite to the bone surface (Fig. 23A). A closer look into one of
the osteoblasts revealed numerous rough endoplasmic reticulum and mitochondria
within the cytoplasm (Fig. 23B). Furthermore, less active osteoblasts that were less
plump (Fig. 23C) and some almost flattened along the bone surface (Fig. 23D) were
seen lying at the osteoid layer, which separated them from the mineralised bone area.
Unlike the active osteoblasts, they appeared less developed and have several
elongated cytoplasmic components.
Fig. 23. Ultrastructure of the osteoblasts. (A) Active osteoblasts (obs) in cuboidal shape containing a large nucleus laid perpendicular to the bone surface. (B) A close-up image of an obs revealed several electron dense rough endoplasmic reticulum (rER) and mitochondria (m). The obs were attached to the bone surface via short electron dense filopodia (arrows). Less active obs with elongated cytoplasmic extensions that appeared (C) less cuboidal and (D) flattened were evident. The less active obs occupied the less dense osteoid layer separating them from the more electron dense mineralised bone surface.

Results
55
3.10.5 Ultrastructure of the osteocytes
Mature star-shaped osteocytes localised individually in flattened periosteocytic lacuna
and embedded in the fully mineralised bone matrix were evident in the newly formed
trabeculae (Fig. 24A). Furthermore, osteocytes surrounded by osteoid or partially
mineralised bone matrix referred to as osteoid-osteocytes or young osteocytes were
seen connected via their cytoplasmic extension to osteoblasts at the bone surface as
shown in figure 24B. A close-up image of a young osteocyte (Fig. 24B) revealed thin
filopodia that linked it to the adjacent osteoblast on the bone surface. In comparison to
osteoblasts, their nucleus appeared more prominent, and their cytoplasm seemed less
abundant.
Fig. 24. Ultrastructure of the osteocytes. (A) Micrograph of the matured star-shaped osteocytes (arrow) embedded within the fully mineralised bone matrix. A close-up image of an osteocyte (in the insert) revealed its flattened periosteocytic lacuna and the prominent nucleus. (B) Micrograph of a young osteocyte localised in the osteoid area and connected via the cytoplasmic projections to an adjacent osteoblast. A close-up image of the connecting area as shown in the insert revealed long filopodia (arrow) adjoining the osteocyte to the adjacent osteoblast.
Discussion
56
4. DISCUSSION
4.1 Successful establishment of a metaphyseal fracture model in the distal
femur of skeletally matured sheep
The first aim of this experimental study was to establish a clinically relevant
metaphyseal fracture model in the distal femur of adult sheep. The three main
parameters identified from clinical practice to be clinically relevant for such a model
include (1) full discontinuity of the metaphyseal area, (2) comparable internal fixation
method, and (3) postoperative full weight bearing of the operated hind limb [39], [40].
The establishment of the fracture gap at the distal metaphyseal region of the femur is
of clinical relevance due to the high prevalence of fracture at this bone area [25], [57].
Instead of the commonly used partial osteotomy model, a complete osteotomy at the
metaphyseal area was generated using a wedge-shaped fracture with a medial gap of
approximately 0.1 mm, and a width of 10 mm at the lateral end of the femoral cortex.
The full discontinuity allows comparison to frequently observed comminution defect
zones in clinical metaphyseal fractures. The fracture gap was stabilised internally using
a customised titanium locking plate construct, which is also comparable to the fixation
method used in patients with a similar type of fracture. The main benefit of this fixation
technique is the allowance of full weight bearing without any restrictions for the
animals. Since the selection of an appropriate time point is essential for achieving a
successful bone healing, an observation period of 12 weeks was selected for this study
based on the suggested estimated time of 10 to 14 weeks for the union of long bone
defects in sheep [51], [58], [59].
All animals survived the surgical procedure and returned to their regular activity as well
as full load bearing around day three post-surgery. No form of plate breakage or
secondary fracture was recorded throughout the 12-week observation period. This
confirmed that all the three identified parameters were translated into this large animal
model, thus demonstrating a successful establishment of a clinically relevant
metaphyseal fracture model.

Discussion
57
4.2 Validation of the BMD in the study animals
4.2.1 A comparable BMD at the whole body and femur region of the sheep
Since previous studies have demonstrated that sheep BMD significantly changes with
seasonal variation [28], [60]. The initial and final BMD of the whole body and femur
region of the animals was determined by DEXA. DEXA is a standard non-invasive
method commonly used in the clinic and animal experiments for the assessment of
bone quality [51], [61], [62]. The comparable BMD evident at the whole body region of
the animals and the similar BMD of the operated left and unoperated right femur
indicated that all six sheep have similar BMD status and no seasonal influence on their
BMD. The comparable BMD measurement eliminates any potential adverse effect
such seasonal variation could have had on the fracture healing, and also indicated that
the surgical operation did not affect the general bone quality of the animals. This
positive effect could be associated with the angular stable internal fixation that
facilitated immediate postoperative full weight bearing of the animals and excluded the
need for immobilisation that could have possibly led to a general bone loss. Many
reports from patients and animal models have shown that long term immobilisation is
a major culprit of mechanical unloading that could result in bone loss [63], [64].
4.3 Characterisation of bone healing in the fractured area
The second aim of this study was to characterise bone healing in the established
metaphyseal fracture model relative to the unoperated femur using different analytical
methods. The various methods enabled a comprehensive characterisation of
metaphyseal bone healing both qualitative and quantitatively. The findings provided in-
depth insight on the bone microstructure, bone stiffness and mineralisation, cellular
activities of the specialised bone cells, vascularisation, normal ultrastructure of main
bone components as well as the activities of prominent bone formation and resorption
genes as discussed below.
4.3.1 Bone microstructure
The qualitative micro-CT and histological evaluation of the bone samples from the
medial to the lateral end of the fractured gap showed prominent bony bridging from the
medial cortex up to two-thirds of the defect. The lack of external callus formation at the
lateral end of the cortex is suggestive of improved mechanical stability achieved by the

Discussion
58
internal plate fixation. This observation in the fractured metaphysis is similar to those
of Claes et al. 1997 [65] who linked periosteal callus formation in metatarsus diaphysis
with the size of interfragmentary movement and strain. They showed that higher
interfragmentary movement even though in smaller size gap could negatively impact
the overall diaphyseal fracture healing and the resulting instability most often leads to
external callus formation. A similar finding by Christopher and co-workers showed
decreased periosteal callus formation in patients with distal femoral fractures stabilised
with stable locking plates [66]. However, the thin layer of periosteal callus found at the
end of the medial cortex where the defect was only 0.1 mm wide could be likely due to
minor periodic movements at this region since the major stability was provided at the
lateral aspect of the femur by the locking plate. Such minor periodic movements are
reported to be beneficial for optimal healing of trabecular bone both in human and
animal [67]–[69].
The new trabecular bone that bridged the fracture gap formed through a direct
membranous bone transformation at the marrow cavity without any visible callus. The
absence of cartilaginous tissue within the new trabeculae as evident by the lack of
chondrocytes and the insignificant expression of COL2A1 supports the notion of a
primary bone formation without an endochondral healing phase that mostly requires
cartilage formation. Cartilaginous tissue formation is connected to instability in both
cortical and cancellous bone healing. Thus, the direct transformation into new bone
without any cartilage stage could also be attributed to the sufficient biomechanical
stability provided by the locking plate in this model. These findings support previous
observations that metaphyseal bone healing occurs through a direct intramembranous
bone formation under stable biomechanical conditions [19]–[21], [70]. Furthermore, the
presence of the Haversian system consisting of tightly parked osteons of concentric
lamellae at the newly bridged cortical bone area is typical for a matured sheep compact
bone and also similar to human subject [32], [60], [71].
The high healing scores of the micro-CT images provided a good impression of the
healing outcome and correlated with the quantitative micro-CT results. The increased
bone mass also evident by the high percentage bone volume fraction was comparable
to the unoperated contralateral femur. The improved quality of the newly formed
trabeculae microarchitecture is evident in the derived key morphometric parameters.
The significantly higher trabecular thickness and separation of the operated left femur

Discussion
59
also indicates a dense trabecula with an abundance of marrow filled cavities. This
suggests that bone healing in the fractured femur is still under remodelling process in
specific areas, unlike in the contralateral femur where the matured trabeculae are intact
with no need for repair, hence the low trabecular thickness [72], [73]. The negative SMI
value of the operated femur is also indicative of dense trabeculae with plate-like
structure whereas the positive SMI value of the unoperated side suggests thinner
trabeculae with more or less rod-like shape [74], [75].
4.3.2 Bone mineralisation and stiffness
The newly formed bone that bridged the fractured gap also attained a substantial level
of mineralisation as seen with the higher percentage increase of mineralised bone area
that was, however, comparable to the unoperated femur. On the other hand, the
significantly higher percentage of the osteoid area in the operated relative to the
unoperated femur suggests a rich organic matrix that is still under remodelling process.
ToF-SIMS as previously reported is an excellent method to identify mineralised tissue
[76], [77]. The high calcium signal detectable within the fractured area also
demonstrates high matrix mineralisation. Under-mineralisation with increased
heterogeneity of calcium in the bone matrix is reported in patients with fragility fractures
in the metaphyseal area [78]. The increased mineralised bone area correlates
positively with the high stiffness measured at both the newly formed cortical and
trabecular bone areas of the operated femur, which was quite comparable to the
unoperated femur. The higher stiffness recorded at the bridged cortical bone area is in
line with previous reports and could be attributed to its unique structural features [2],
[14], [79]. Furthermore, the similar distribution pattern observed in the collagen
component of the fractured area also implies abundant organic matrix. This
observation indicates that the quality of both the organic and the inorganic bone
components play important roles in the ultimate bone mechanical strength [80]–[82].
4.3.3 Cellular activities of osteoclasts, osteoblasts and osteocytes
The healing process is reflected in the activities of the specialised bone cellular
components. The significantly higher activity of osteoblasts observed in the ALP
staining indicates new bone formation. The bone formation also manifested in the
BMP2 and OPG staining. The increased amount of ALP-activity in the operated femur

Discussion
60
could be associated with the increased mineralised bone area, which suggests a
possible role in matrix mineralisation [83]. BMP2, a bone matrix derived protein is
shown to be more expressed during the early healing phase and subsequently
downregulated at the later phase [84]–[86]. Hence, its low expression after this 12-
week study period could imply an advance healing stage. Besides, the stimulation of
transforming growth factors (for instance the BMPs), are linked to OPG production [87],
[88]. Thus, the low expression of BMP2 could be coupled to the decreased amount of
OPG. In the operated femur, the ten-fold decrease in TRAP compared to ALP indicates
a reduced osteoblast activity. However, the TRAP activity in the operated femur was
significantly higher in comparison to the unoperated femur. This finding in line with the
micro-CT result indicates that the operated femur, as opposed to the intact
contralateral femur is still under active remodelling. Bone resorption in the operated
femur is also evident in the RANKL staining. Osteoclast-mediated bone resorption is
known to be strongly regulated by the ratio of RANKL to OPG [87], [89]–[93]. Thus, the
similar expression amount of OPG and RANKL is suggestive of a controlled resorption
process.
The proper formation and maturation process of the newly formed bone is further
reflected in the well-established osteocytes-lacunae canaliculi network. Their regular
arrangement suggests active involvement of the osteocytes in the regulation of local
strains that might have occurred during the mechanical loading episodes thus, implying
a role in mechanosensing [2], [94]–[96]. In small animal models of osteoporosis,
osteocytes death is associated with a reduction in bone formation and mechanical
strength [97], [98]. Similarly, bone loss as reported in an ovine model of osteoporosis
and the human subject were caused by low osteocytes density along with an increasing
number of empty lacunae [99], [100]. Given that the number of osteocytes and their
appropriate response to mechanical stimuli is very vital to the maintenance of superior
bone quality, it is thus, certain that the increased density of osteocytes lacunae
positively influenced the recruitment of active osteoblasts and osteoclasts as well as
other relevant growth factors necessary for the bone remodelling process.
Furthermore, changes in the osteocyte-lacuna morphology and arrangement are
recently proposed to influence the way bone responds to the applied mechanical signal
with ageing and or in disease condition [96]. A previous study by Carter et al., 2013
[101] showed that osteocytes lacunae of the human femora become smaller and

Discussion
61
spherically shaped with ageing. Ubaidus and co-workers [102] reported uniformity in
the arrangement of the osteocyte-lacuna canalicular system in healthy bone. Similar
to the result of this study, the osteocytes aligned parallel longitudinally to the bone
surface and the canaliculi network extended perpendicularly. Therefore, the
dominance of spherically shaped osteocytes lacunae along with regular canaliculi
system in the newly formed trabeculae of the operated as well as the unoperated femur
indicates that the morphological arrangement of the osteocytes positively influenced
their overall function.
4.3.4 Vascularisation
The small size and reduced number of blood vessels visualised within the fractured
area also suggest an advanced healing stage. The sparse distribution of the blood
vessels implies that the healing is at a later stage and thus, does not require major
blood vessels formation. The formation of fibrocartilages is linked to inadequate blood
supply while bone formation indicates sufficient vascularisation under stable condition
[103].
4.3.5 Activities of prominent bone formation and resorption genes
The high expression of important bone formation genes (ALP, BGLAP and COL1A1)
relative to the unoperated femur further indicates bone formation. The increased
expression of ALP and BGLAP probably relates to the richly mineralised matrix. The
low quantity of BMP2 and OPG as similarly observed in quantitative
immunohistochemistry confirm both findings and the already stated interpretation.
Conversely, bone resorption is evident in the expressed RANKL and CTSK genes of
the operated femur, which is comparable to the unoperated contralateral side. CTSK
is a key catabolic enzyme needed for the digestion of the collagenous matrix during
the resorption process [104], [105]. Hence, its high level is also suggestive of an active
remodelling phase. Regardless of the high CTSK level, there was a low level of
RANKL/OPG ratio indicating that the resorption process is well coupled to the new
bone formation process as evident by the increased bone mass. The high expression
of CTSK could be related to this study time point. This could imply that a high level of
CTSK is necessary even at the advanced healing stage since the remodelling process
is still in progress. Since osteoclast-mediated bone resorption is strongly regulated by

Discussion
62
RANKL/OPG ratio [87], [90] thus, their controlled expression by osteoblasts is vital to
achieving a balanced remodelling in healthy bone.
4.3.6 Characteristic ultrastructure of the organic, inorganic and the specialised bone
cells
Transmission electron microscopic imaging of the newly formed trabecular bone was
performed to characterise the ultrastructure of the collagen-mineral composite,
osteoblasts, osteoclasts as well as the osteocytes. A rich organic matrix majorly
consisting of collagenous protein was evident. The typical parallel arrangement of the
collagen fibrils resembles that of a normal human lamella bone [106]. Major
mineralisation of the organic matrix evident in the dense and uniformly distributed bone
mineral substance implies bone maturation. The dense needle-like clusters of the bone
mineral substance laid within and upon the collagen fibrils, consequently reinforcing
their regular cross-linking [9], [12], [107]. The less electron dense area observed close
to the mineralisation front suggests an ongoing mineralisation process. Thus, the
unique composition and structural arrangement of the collagen fibrils and the bone
mineral substance at the osteoid and mineralised bone areas respectively, indicate
that they both contribute to the final bone quality [82], [108].
The large multinucleated osteoclasts with the typical ruffled border attached directly to
the surface of the newly formed trabeculae show their active involvement in the
remodelling process [13], [109]. The abundant vacuoles situated adjacent to the ruffled
border are necessary for the digestion and transportation of cellular debris produced
during the bone resorption process [10]. Alterations in the structure and function of
osteoclasts result in several bone pathologies [110].
The unique morphology and size of the osteoblasts reveal their level of activity.
Previous reports have also shown that the shape, size and arrangement of osteoblasts
is a reflection of the activity level [111], [112]. The plump cuboidal-shaped osteoblasts
characterised by a larger surface area and enriched cytoplasmic components, notably
the abundant rough endoplasmic reticulum and mitochondria; indicate their active
involvement in the secretion of the new bone matrix whereas the flattened osteoblasts
characterised by several elongated cytoplasmic extensions with a poorly developed
cytoplasm possibly suggest a reduction in activity.

Discussion
63
The ultrastructure of the osteocytes differed depending on the level of bone
mineralisation. The matured star-shaped osteocytes localise individually in flattened
periosteocytic lacuna and embed within the fully mineralised bone area. The
osteocytes embedded in the osteoid and partially mineralised bone regions connect
via their cytoplasmic extensions to adjacent osteoblasts at the bone surface. Those
located in the osteoid area are termed osteoid osteocytes whereas those located in
the partially mineralised area are called young osteocytes [94], [113]. Generally, the
structure of the osteoid or young osteocytes seemed more developed than the matured
osteocytes. This observation indicates that the young osteocytes are probably involved
in the bone maturation process. Moreover, by connecting directly to adjacent
osteoblasts, the young osteocytes could play important roles in inter-cellular
communication as well as molecular transports [114].
4.4 Limitations of the study
The two main limitations of this study are the small sample size and the use of a single
observation time point. Although more sample size could have improved the outcome
of the statistical analysis, this was not possible due to the strong European welfare act
on the use of laboratory animals that encourages the use of a reduced number of
animals for experimental purpose. Secondly, additional time points such as an earlier
study period would have enabled a better understanding of the molecular and cellular
events occurring during the early phase of bone healing. For example, studying the
early phase of bone healing could have provided new insights on the impact of the
initial mechanical condition at the fracture area during the early remodelling phase.
However, an additional time point was not possible due to the small sample size.

Conclusion
64
5. CONCLUSION
This study established and characterised a clinically relevant fracture model for
metaphyseal bone healing in the distal femur of adult sheep. In contrast to the
commonly used partial osteotomy model, this metaphyseal fracture model is the first
large animal model to employ full discontinuity at the metaphysis and use a clinically
relevant internal fixation technique to stabilise the fracture area. The customised
anatomical locking plate conferred sufficient mechanical stability on the fractured area
that enabled direct postoperative full weight bearing in the animals. The use of different
analytical (both qualitative and quantitative) methods in this study enabled the
comprehensive characterisation of the metaphyseal bone healing in the operated left
femur relative to the unoperated contralateral femur at 12 weeks post-fracture. The
results taken together showed an advanced bony bridging at the fractured area that
was characterised by densely mineralised trabeculae. The improved quality of the
newly formed trabecular microarchitecture reflected positively in the key morphometric
indices. The advanced healing and maturation of the newly formed trabeculae also
reflected on the increased mineralised bone area, high density of regularly arranged
osteocytes-lacunae along with their canaliculi network, similar biomechanical
competence and reduced vasculature. Bone formation and moderate resorption
activities of osteoblasts and osteoclasts respectively were evident in tested markers at
various stages, namely tissue, molecular, cellular and gene expression levels. This
study also presents an in-depth ultrastructure analysis of the newly formed trabeculae
using TEM imaging. The characteristic ultrastructure of the collagen-mineral composite
and those of the specialised bone cells (osteoblast, osteoclasts and osteocytes) also
support normal bone healing and maturation.
The metaphyseal bone area healed through a direct intramembranous bone formation,
which is typical and unique to the trabecular bone without visible callus and
cartilaginous tissue formation. This large animal model enabled direct metaphyseal
healing study without the influence of any material. Thus, the findings explicitly reveal
the characteristic healing pattern of the metaphyseal bone under stable internal
fixation.
In conclusion, this newly established metaphyseal fracture model is of interest to study
bone healing and treatment options for the enhancement of metaphyseal fractures.

References
65
6. REFERENCES
[1] R. S. Taichman, “Blood and bone: two tissues whose fates are intertwined to create the hematopoietic stem-cell niche.,” Blood, vol. 105, no. 7, pp. 2631–9, Apr. 2005.
[2] B. Clarke, “Normal bone anatomy and physiology.,” Clin. J. Am. Soc. Nephrol., vol. 3 Suppl 3, pp. 131–139, 2008.
[3] J. J. Alexander, J. J. Piotrowski, D. Graham, D. Franceschi, and T. King, “Outcome of complex vascular and orthopedic injuries of the lower extremity,” Am. J. Surg., vol. 162, no. 2, pp. 111–116, 1991.
[4] D. Rixen, S. Sauerland, H.-J. Oestern, and B. Bouillon, “[Management strategies in the first operative phase after long-bone injury of the lower extremity in multiple-injured patients. A systematic literature review].,” Unfallchirurg, vol. 108, no. 10, pp. 829–38, 840–2, Oct. 2005.
[5] R. Oftadeh, M. Perez-Viloria, J. C. Villa-Camacho, A. Vaziri, and A. Nazarian, “Biomechanics and Mechanobiology of Trabecular Bone: A Review,” J. Biomech. Eng., vol. 137, no. 1, p. 010802, 2015.
[6] K. Choi and S. A. Goldstein, “a Comparison of the Fatigue Behavior of Human,” vol. 25, no. 12, 1992.
[7] J. Kragstrup and F. Melsen, “Three-dimensional morphology of trabecular bone osteons reconstructed from serial sections,” Metab. Bone Dis. Relat. Res., vol. 5, no. 3, pp. 127–130, 1983.
[8] W. S. S. Jee, “The skeletal tissues,” in Histology: Cell and Tissue Biology, Fifth., L. Weiss, Ed. Amsterdam: Elsevier Biomedical/ Elsevier Science Publishing Co., Inc, 1983, pp. 200–255.
[9] E. Bonucci, “The structural basis of calcification,” in Ultrastructure of the Connective Tissue Matrix, A. Ruggeri and P. M. Motta, Eds. Boston, MA: Springer US, 1984, pp. 165–191.
[10] S. C. Marks and S. N. Popoff, “Bone cell biology: The regulation of development, structure, and function in the skeleton,” Am. J. Anat., vol. 183, no. 1, pp. 1–44, Sep. 1988.
[11] A. S. Posner, “The mineral of bone.,” Clin. Orthop. Relat. Res., no. 200, pp. 87–99, Nov. 1985.
[12] S. Lees and K. Prostak, “The locus of mineral crystallites in bone.,” Connect. Tissue Res., vol. 18, no. 1, pp. 41–54, 1988.
[13] G. Boivin, C. Anthoine-Terrier, and K. J. Obrant, “Transmission electron microscopy of bone tissue. A review.,” Acta Orthop. Scand., vol. 61, no. 2, pp. 170–80, Apr. 1990.
[14] R. Oftadeh, V. Entezari, G. Sporri, J. C. Villa-Camacho, H. Krigbaum, E. Strawich, L. Graham, C. Rey, H. Chiu, R. Muller, H. N. Hashemi, A. Vaziri, and A. Nazarian, “Hierarchical analysis and multi-scale modelling of rat cortical and trabecular bone,” J. R. Soc. Interface, vol. 12, no. 106, pp. 20150070–20150070, 2015.

References
66
[15] A. Fritsch and C. Hellmich, “‘Universal’ microstructural patterns in cortical and trabecular, extracellular and extravascular bone materials: micromechanics-based prediction of anisotropic elasticity.,” J. Theor. Biol., vol. 244, no. 4, pp. 597–620, Feb. 2007.
[16] P. Augat, K. Margevicius, J. Simon, S. Wolf, G. Suger, and L. Claes, “Local tissue properties in bone healing: influence of size and stability of the osteotomy gap.,” J. Orthop. Res., vol. 16, no. 4, pp. 475–481, 1998.
[17] A.-B. M. Rabie, Z. Dan, and N. Samman, “Ultrastructural identification of cells involved in the healing of intramembranous and endochondral bones Research; development,” Int. J. Oral M~zTillofac. Surg. J. Oral Mctrillofac. Sttrg, vol. 25, no. 25, pp. 383–388, 1996.
[18] F. Shapiro, “Bone development and its relation to fracture repair. The role of mesenchymal osteoblasts and surface osteoblasts,” Eur. Cells Mater., vol. 15, pp. 53–76, 2008.
[19] L. Claes, A. Veeser, M. Göckelmann, U. Simon, and A. Ignatius, “A novel model to study metaphyseal bone healing under defined biomechanical conditions,” Arch. Orthop. Trauma Surg., vol. 129, no. 7, pp. 923–928, 2009.
[20] O. H. Sandberg and P. Aspenberg, “Inter-trabecular bone formation: a specific mechanism for healing of cancellous bone: A narrative review,” Acta Orthop., vol. 87, no. 5, pp. 459–465, 2016.
[21] W. T. Chen, D. C. Han, P. X. Zhang, N. Han, Y. H. Kou, X. F. Yin, and B. G. Jiang, “A special healing pattern in stable metaphyseal fractures,” Acta Orthop., vol. 86, no. 2, pp. 238–242, 2015.
[22] D. Han, N. Han, F. Xue, and P. Zhang, “A novel specialized staging system for cancellous fracture healing, distinct from traditional healing pattern of diaphysis corticalfracture?,” Int. J. Clin. Exp. Med., vol. 8, no. 1, pp. 1301–4, 2015.
[23] J. E. Aaron and T. M. Skerry, “Intramembranous trabecular generation in normal bone.,” Bone Miner., vol. 25, no. 3, pp. 211–30, Jun. 1994.
[24] T. Kon, T. J. Cho, T. Aizawa, M. Yamazaki, N. Nooh, D. Graves, L. C. Gerstenfeld, and T. A. Einhorn, “Expression of osteoprotegerin, receptor activator of NF-kappaB ligand (osteoprotegerin ligand) and related proinflammatory cytokines during fracture healing.,” J. Bone Miner. Res., vol. 16, no. 6, pp. 1004–14, Jun. 2001.
[25] L. Mosekilde, E. N. Ebbesen, L. Tornvig, and J. S. Thomsen, “Trabecular bone structure and strength - remodelling and repair,” J Musculoskelet Neuronal Interact, vol. 1, no. 1, pp. 25–30, 2000.
[26] T. Komori, “Animal models for osteoporosis.,” Eur. J. Pharmacol., vol. 759, pp. 287–94, Jul. 2015.
[27] L. Martini, M. Fini, G. Giavaresi, and R. Giardino, “Sheep model in orthopedic research: a literature review,” Comp. Med., vol. 51, no. 4, pp. 292–299, 2001.
[28] A. S. Turner, “The sheep as a model for osteoporosis in humans,” Vet. J., vol. 163, no. 3, pp. 232–239, 2002.
[29] S. Reinwald and D. Burr, “Review of nonprimate, large animal models for

References
67
osteoporosis research.,” J. Bone Miner. Res., vol. 23, no. 9, pp. 1353–68, Sep. 2008.
[30] A. I. Pearce, R. G. Richards, S. Milz, E. Schneider, and S. G. Pearce, “Animal models for implant biomaterial research in bone: A review,” Eur. Cells Mater., vol. 13, no. 0, pp. 1–10, 2007.
[31] R. Mori, T. Kodaka, S. Soeta, J. Sato, J. Kakino, S. Hamato, H. Takaki, and Y. Naito, “Preliminary study of histological comparison on the growth patterns of long-bone cortex in young calf, pig, and sheep.,” J. Vet. Med. Sci., vol. 67, no. 12, pp. 1223–9, Dec. 2005.
[32] D. N. Kalu, “Animal Models of the Aging Skeleton,” in The Aging Skeleton, 1st ed., J. G. Clifford J. Rosen and John P. Bilezikian, Eds. Academic Press, 1999, pp. 37–50.
[33] R. Oheim, M. Amling, A. Ignatius, and P. Pogoda, “Large animal model for osteoporosis in humans: the ewe.,” Eur. Cell. Mater., vol. 24, pp. 372–85, Nov. 2012.
[34] V. Borsari, M. Fini, G. Giavaresi, L. Rimondini, U. Consolo, L. Chiusoli, A. Salito, A. Volpert, R. Chiesa, and R. Giardino, “Osteointegration of titanium and hydroxyapatite rough surfaces in healthy and compromised cortical and trabecular bone: in vivo comparative study on young, aged, and estrogen-deficient sheep,” J. Orthop. Res., vol. 25, no. 9, pp. 1250–1260, Sep. 2007.
[35] M. Rocca, M. Fini, G. Giavaresi, N. Nicoli Aldini, and R. Giardino, “Osteointegration of hydroxyapatite-coated and uncoated titanium screws in long-term ovariectomized sheep,” Biomaterials, vol. 23, no. 4, pp. 1017–1023, 2002.
[36] A. Malhotra, M. H. Pelletier, Y. Yu, C. Christou, and W. R. Walsh, “A Sheep Model for Cancellous Bone Healing,” Front. Surg., vol. 1, no. September, pp. 1–7, 2014.
[37] L. Claes, A. Veeser, M. Göckelmann, U. Simon, and A. Ignatius, “A novel model to study metaphyseal bone healing under defined biomechanical conditions.,” Arch. Orthop. Trauma Surg., vol. 129, no. 7, pp. 923–8, Jul. 2009.
[38] R. Bindl, R. Oheim, P. Pogoda, F. T. Beil, K. Gruchenberg, S. Reitmaier, T. Wehner, E. Calcia, P. Radermacher, L. Claes, M. Amling, and A. Ignatius, “Metaphyseal fracture healing in a sheep model of low turnover osteoporosis induced by hypothalamic-pituitary disconnection (HPD),” J. Orthop. Res., vol. 31, no. 11, pp. 1851–1857, 2013.
[39] W. H. Cheung, T. Miclau, S. K. H. Chow, F. F. Yang, and V. Alt, “Fracture healing in osteoporotic bone,” Injury, vol. 47, pp. S21–S26, 2016.
[40] R. M. Y. Wong, M. H. V. Choy, M. C. M. Li, K.-S. Leung, S. K-H. Chow, W.-H. Cheung, and J. C. Y. Cheng, “A systematic review of current osteoporotic metaphyseal fracture animal models,” Bone Joint Res., vol. 7, no. 1, pp. 6–11, Jan. 2018.
[41] M. E. Wullschleger, R. Steck, R. Matthys, J. Webster, M. A. Woodruff, R. Devakar, K. Ito, and M. Schuetz, “A new model to study healing of a complex femur fracture with concurrent soft tissue injury in sheep,” Open J. Orthop., vol.

References
68
3, no. June, pp. 1–7, 2013.
[42] C. A. Lill, J. Hesseln, U. Schlegel, C. Eckhardt, J. Goldhahn, and E. Schneider, “Biomechanical evaluation of healing in a non-critical defect in a large animal model of osteoporosis,” J. Orthop. Res., vol. 21, no. 5, pp. 836–842, 2003.
[43] M. J. Challis, P. Gaston, K. Wilson, G. A. Jull, and R. W. Crawford, “Cyclic pneumatic soft-tissue compression accelerates the union of distal radial osteotomies in an ovine model,” J Bone Jt. Surg Br, vol. 88, no. 3, pp. 411–415, 2006.
[44] D. R. Epari, H. Schell, H. J. Bail, and G. N. Duda, “Instability prolongs the chondral phase during bone healing in sheep,” Bone, vol. 38, no. 6, pp. 864–870, 2006.
[45] P. Tufekci, A. Tavakoli, C. Dlaska, M. Neumann, M. Shanker, S. Saifzadeh, R. Steck, M. Schuetz, and D. Epari, “Early mechanical stimulation only permits timely bone healing in sheep,” J. Orthop. Res., vol. 36, no. 6, pp. 1790–1796, 2018.
[46] R. Hente, J. Cordey, B. A. Rahn, M. Maghsudi, S. von Gumppenberg, and S. M. Perren, “Fracture healing of the sheep tibia treated using a unilateral external fixator. Comparison of static and dynamic fixation,” Injury, vol. 30, Supple, pp. SA44-SA51, 1999.
[47] P. Augat, J. Merk, S. Wolf, and L. Claes, “Mechanical stimulation by external application of cyclic tensile strains does not effectively enhance bone healing.,” J. Orthop. Trauma, vol. 15, no. 1, pp. 54–60, Jan. 2001.
[48] L. E. Claes, H.-J. Wilke, P. Augat, S. Rübenacker, and K. J. Margevicius, “Effect of dynamization on gap healing of diaphyseal fractures under external fixation.,” Clin. Biomech. (Bristol, Avon), vol. 10, no. 5, pp. 227–234, Jul. 1995.
[49] S. Wolf, A. Janousek, J. Pfeil, W. Veith, F. Haas, G. Duda, and L. Claes, “The effects of external mechanical stimulation on the healing of diaphyseal osteotomies fixed by flexible external fixation.,” Clin. Biomech. (Bristol, Avon), vol. 13, no. 4–5, pp. 359–364, Jun. 1998.
[50] M. L. Bouxsein, S. K. Boyd, B. A. Christiansen, R. E. Guldberg, K. J. Jepsen, and R. Müller, “Guidelines for assessment of bone microstructure in rodents using micro-computed tomography.,” J. Bone Miner. Res., vol. 25, no. 7, pp. 1468–86, Jul. 2010.
[51] F. C. Den Boer, P. Patka, F. C. Bakker, B. W. Wippermann, A. Van Lingen, G. Q. M. Vink, K. Boshuizen, and H. J. T. M. Haarman, “New segmental long bone defect model in sheep: Quantitative analysis of healing with dual energy x-ray absorptiometry,” J. Orthop. Res., vol. 17, no. 5, pp. 654–660, 1999.
[52] E. F. Morgan, Z. D. Mason, K. B. Chien, A. J. Pfeiffer, G. L. Barnes, T. A. Einhorn, and L. C. Gerstenfeld, “Micro-computed tomography assessment of fracture healing: Relationships among callus structure, composition, and mechanical function,” Bone, vol. 44, no. 2, pp. 335–344, 2009.
[53] J. S. Nyman, S. Munoz, S. Jadhav, A. Mansour, T. Yoshii, G. R. Mundy, and G. E. Gutierrez, “Quantitative measures of femoral fracture repair in rats derived by micro-computed tomography,” J. Biomech., vol. 42, no. 7, pp. 891–897, 2009.

References
69
[54] K. J. Livak and T. D. Schmittgen, “Analysis of relative gene expression data using real-time quantitative PCR and the 2(-Delta Delta C(T)) Method.,” Methods, vol. 25, no. 4, pp. 402–8, Dec. 2001.
[55] B. W. Schueler, “Time-of-flight mass analysers,” in TOF-SIMS : materials analysis by mass spectrometry, 2nd ed., J. C. Vickerman and D. Briggs, Eds. Chichester: IM Publications LLP, 2012, p. 732.
[56] A. Henss, M. Rohnke, T. El Khassawna, P. Govindarajan, G. Schlewitz, C. Heiss, and J. Janek, “Applicability of ToF-SIMS for monitoring compositional changes in bone in a long-term animal model,” J. R. Soc. Interface, vol. 10, no. 86, pp. 20130332–20130332, 2013.
[57] B. L. Riggs and L. J. Melton, “Involutional osteoporosis.,” N. Engl. J. Med., vol. 314, no. 26, pp. 1676–86, Jun. 1986.
[58] L. A. Mills and A. H. R. W. Simpson, “In vivo models of bone repair.,” J. Bone Joint Surg. Br., vol. 94, no. 7, pp. 865–74, Jul. 2012.
[59] C. Christou, R. A. Oliver, M. H. Pelletier, and W. R. Walsh, “Ovine model for critical-size tibial segmental defects,” Comp. Med., vol. 64, no. 5, pp. 377–385, 2014.
[60] D. Arens, I. Sigrist, M. Alini, P. Schawalder, E. Schneider, and M. Egermann, “Seasonal changes in bone metabolism in sheep.,” Vet. J., vol. 174, no. 3, pp. 585–91, Nov. 2007.
[61] M. D. Markel and J. J. Bogdanske, “The effect of increasing gap width on localized densitometric changes within tibial ostectomies in a canine model.,” Calcif. Tissue Int., vol. 54, no. 2, pp. 155–9, Feb. 1994.
[62] K. Tanaka, T. Kurokawa, K. Nakamura, T. Matsushita, S. Horinaka, I. Kusaba, H. Okazaki, K. Mamada, R. Shiro, W. Ou, and S. C. Hung, “Callus formation in femur and tibia during leg lengthening: 7 patients examined with DXA.,” Acta Orthop. Scand., vol. 67, no. 2, pp. 158–60, Apr. 1996.
[63] W. S. Jee and Y. Ma, “Animal models of immobilization osteopenia.,” Morphologie, vol. 83, no. 261, pp. 25–34, Jun. 1999.
[64] C. Alexandre and L. Vico, “Pathophysiology of bone loss in disuse osteoporosis,” Jt. Bone Spine, vol. 78, no. 6, pp. 572–576, 2011.
[65] L. Claes, P. Augat, G. Suger, and H. J. Wilke, “Influence of size and stability of the osteotomy gap on the success of fracture healing,” J. Orthop. Res., vol. 15, no. 4, pp. 577–584, 1997.
[66] C. E. Henderson, T. Lujan, M. Bottlang, D. C. Fitzpatrick, S. M. Madey, and J. L. Marsh, “Stabilization of distal femur fractures with intramedullary nails and locking plates: differences in callus formation.,” Iowa Orthop. J., vol. 30, no. 319, pp. 61–8, 2010.
[67] L. Claes, M. Reusch, M. Göckelmann, M. Ohnmacht, T. Wehner, M. Amling, F. T. Beil, and A. Ignatius, “Metaphyseal fracture healing follows similar biomechanical rules as diaphyseal healing,” J. Orthop. Res., vol. 29, no. 3, pp. 425–432, 2011.
[68] M. Lutz, R. Steck, I. Sitte, M. Rieger, M. Schuetz, and T. Klestil, “The

References
70
metaphyseal bone defect in distal radius fractures and its implication on trabecular remodeling-a histomorphometric study (case series),” J. Orthop. Surg. Res., vol. 10, no. 1, pp. 1–7, 2015.
[69] G. Vicenti, V. Pesce, N. Tartaglia, A. Abate, C. M. Mori, and B. Moretti, “Micromotion in the fracture healing of closed distal metaphyseal tibial fractures: A multicentre prospective study,” Injury, vol. 45, no. S6, pp. S27–S35, 2014.
[70] H. K. Uhthoff and B. a Rahn, “Healing patterns of metaphyseal fractures.,” Clin. Orthop. Relat. Res., no. 160, pp. 295–303, 1981.
[71] M. Martiniaková, B. Grosskopf, R. Omelka, M. Vondráková, and M. Bauerová, “Histological analysis of ovine compact bone tissue.,” J. Vet. Med. Sci., vol. 69, pp. 409–411, 2007.
[72] D. B. Burr, “Targeted and nontargeted remodeling.,” Bone, vol. 30, no. 1, pp. 2–4, Jan. 2002.
[73] A. M. Parfitt, “Targeted and nontargeted bone remodeling: relationship to basic multicellular unit origination and progression.,” Bone, vol. 30, no. 1, pp. 5–7, Jan. 2002.
[74] T. Hildebrand, A. Laib, R. Müller, J. Dequeker, and P. Rüegsegger, “Direct three-dimensional morphometric analysis of human cancellous bone: microstructural data from spine, femur, iliac crest, and calcaneus.,” J. Bone Miner. Res., vol. 14, no. 7, pp. 1167–74, Jul. 1999.
[75] T. Hildebrand and P. Rüegsegger, “Quantification of Bone Microarchitecture with the Structure Model Index.,” Comput. Methods Biomech. Biomed. Engin., vol. 1, no. 1, pp. 15–23, Jan. 1997.
[76] S. Ray, U. Thormann, M. Eichelroth, M. Budak, C. Biehl, M. Rupp, U. Sommer, T. El Khassawna, F. I. Alagboso, M. Kampschulte, M. Rohnke, A. Henß, K. Peppler, V. Linke, P. Quadbeck, A. Voigt, F. Stenger, D. Karl, R. Schnettler, C. Heiss, K. S. Lips, and V. Alt, “Strontium and bisphosphonate coated iron foam scaffolds for osteoporotic fracture defect healing,” Biomaterials, vol. 157, pp. 1–16, 2018.
[77] U. Thormann, S. Ray, U. Sommer, T. Elkhassawna, T. Rehling, M. Hundgeburth, A. Henß, M. Rohnke, J. Janek, K. S. Lips, C. Heiss, G. Schlewitz, G. Szalay, M. Schumacher, M. Gelinsky, R. Schnettler, and V. Alt, “Bone formation induced by strontium modified calcium phosphate cement in critical-size metaphyseal fracture defects in ovariectomized rats.,” Biomaterials, vol. 34, no. 34, pp. 8589–98, Nov. 2013.
[78] N. Fratzl-Zelman, P. Roschger, B. M. Misof, K. Nawrot-Wawrzyniak, S. Pötter-Lang, C. Muschitz, H. Resch, K. Klaushofer, and E. Zwettler, “Fragility fractures in men with idiopathic osteoporosis are associated with undermineralization of the bone matrix without evidence of increased bone turnover,” Calcif. Tissue Int., vol. 88, no. 5, pp. 378–387, 2011.
[79] P. K. Zysset, X. Edward Guo, C. Edward Hoffler, K. E. Moore, and S. A. Goldstein, “Elastic modulus and hardness of cortical and trabecular bone lamellae measured by nanoindentation in the human femur,” J. Biomech., vol. 32, no. 10, pp. 1005–1012, 1999.

References
71
[80] X. Wang, X. Shen, X. Li, and C. M. Agrawal, “Age-related changes in the collagen network and toughness of bone.,” Bone, vol. 31, no. 1, pp. 1–7, Jul. 2002.
[81] P. Zioupos, J. D. Currey, and A. J. Hamer, “The role of collagen in the declining mechanical properties of aging human cortical bone.,” J. Biomed. Mater. Res., vol. 45, no. 2, pp. 108–16, May 1999.
[82] P. Fratzl, H. S. Gupta, E. P. Paschalis, and P. Roschger, “Structure and mechanical quality of the collagen–mineral nano-composite in bone,” J. Mater. Chem., vol. 14, no. 14, pp. 2115–2123, 2004.
[83] M. P. Whyte, “Hypophosphatasia and the role of alkaline phosphatase in skeletal mineralization.,” Endocr. Rev., vol. 15, no. 4, pp. 439–61, Aug. 1994.
[84] J. Yang, P. Shi, M. Tu, Y. Wang, M. Liu, F. Fan, and M. Du, “Bone morphogenetic proteins: Relationship between molecular structure and their osteogenic activity,” Food Sci. Hum. Wellness, vol. 3, no. 3–4, pp. 127–135, 2014.
[85] Y. Y. Yu, S. Lieu, C. Lu, T. Miclau, R. S. Marcucio, and C. Colnot, “Immunolocalization of BMPs, BMP antagonists, receptors, and effectors during fracture repair,” Bone, vol. 46, no. 3, pp. 841–851, 2010.
[86] T. J. Cho, L. C. Gerstenfeld, and T. A. Einhorn, “Differential temporal expression of members of the transforming growth factor β superfamily during murine fracture healing,” J. Bone Miner. Res., vol. 17, no. 3, pp. 513–520, 2002.
[87] N. Udagawa, N. Takahashi, H. Yasuda, A. Mizuno, K. Itoh, Y. Ueno, T. Shinki, M. T. Gillespie, T. J. Martin, K. Higashio, and T. Suda, “Osteoprotegerin produced by osteoblasts is an important regulator in osteoclast development and function,” Endocrinology, vol. 141, no. 9, pp. 3478–3484, 2000.
[88] M. Schoppet, K. T. Preissner, and L. C. Hofbauer, “RANK ligand and osteoprotegerin: paracrine regulators of bone metabolism and vascular function.,” Arterioscler. Thromb. Vasc. Biol., vol. 22, no. 4, pp. 549–53, Apr. 2002.
[89] M. M. Cohen, “The new bone biology: pathologic, molecular, and clinical correlates.,” Am. J. Med. Genet. A, vol. 140, no. 23, pp. 2646–706, Dec. 2006.
[90] W. J. Boyle, W. S. Simonet, and D. L. Lacey, “Osteoclast differentiation and activation.,” Nature, vol. 423, no. 6937, pp. 337–42, May 2003.
[91] S. Khosla, “Minireview: the OPG/RANKL/RANK system.,” Endocrinology, vol. 142, no. 12, pp. 5050–5055, 2001.
[92] D. L. Lacey, E. Timms, H. L. Tan, M. J. Kelley, C. R. Dunstan, T. Burgess, R. Elliott, A. Colombero, G. Elliott, S. Scully, H. Hsu, J. Sullivan, N. Hawkins, E. Davy, C. Capparelli, A. Eli, Y. X. Qian, S. Kaufman, I. Sarosi, V. Shalhoub, G. Senaldi, J. Guo, J. Delaney, and W. J. Boyle, “Osteoprotegerin ligand is a cytokine that regulates osteoclast differentiation and activation.,” Cell, vol. 93, no. 2, pp. 165–76, Apr. 1998.
[93] W. . Simonet, D. . Lacey, C. . Dunstan, M. Kelley, M.-S. Chang, R. Lüthy, H. . Nguyen, S. Wooden, L. Bennett, and T. Boone, “Osteoprotegerin: A Novel Secreted Protein Involved in the Regulation of Bone Density,” Cell, vol. 89, no.

References
72
2, pp. 309–319, Apr. 1997.
[94] E. M. Aarden, E. H. Burger, and P. J. Nijweide, “Function of osteocytes in bone,” J. Cell. Biochem., vol. 55, no. 3, pp. 287–299, 1994.
[95] J. Klein-Nulend, A. D. Bakker, R. G. Bacabac, A. Vatsa, and S. Weinbaum, “Mechanosensation and transduction in osteocytes.,” Bone, vol. 54, no. 2, pp. 182–90, Jun. 2013.
[96] H. Hemmatian, A. D. Bakker, J. Klein-Nulend, and G. H. van Lenthe, “Aging, Osteocytes, and Mechanotransduction.,” Curr. Osteoporos. Rep., vol. 15, no. 5, pp. 401–411, 2017.
[97] Y.-L. Ma, R.-C. Dai, Z.-F. Sheng, Y. Jin, Y.-H. Zhang, L.-N. Fang, H.-J. Fan, and E.-Y. Liao, “Quantitative associations between osteocyte density and biomechanics, microcrack and microstructure in OVX rats vertebral trabeculae.,” J. Biomech., vol. 41, no. 6, pp. 1324–32, 2008.
[98] C. A. O’Brien, D. Jia, L. I. Plotkin, T. Bellido, C. C. Powers, S. A. Stewart, S. C. Manolagas, and R. S. Weinstein, “Glucocorticoids act directly on osteoblasts and osteocytes to induce their apoptosis and reduce bone formation and strength,” Endocrinology, vol. 145, no. 4, pp. 1835–1841, 2004.
[99] M. G. Mullender, S. D. Tan, L. Vico, C. Alexandre, and J. Klein-Nulend, “Differences in osteocyte density and bone histomorphometry between men and women and between healthy and osteoporotic subjects.,” Calcif. Tissue Int., vol. 77, no. 5, pp. 291–6, Nov. 2005.
[100] M. R. Zarrinkalam, A. Mulaibrahimovic, G. J. Atkins, and R. J. Moore, “Changes in osteocyte density correspond with changes in osteoblast and osteoclast activity in an osteoporotic sheep model,” Osteoporos. Int., vol. 23, no. 4, pp. 1329–1336, 2012.
[101] Y. Carter, C. D. L. Thomas, J. G. Clement, and D. M. L. Cooper, “Femoral osteocyte lacunar density, volume and morphology in women across the lifespan,” J. Struct. Biol., vol. 183, no. 3, pp. 519–526, Sep. 2013.
[102] S. Ubaidus, M. Li, S. Sultana, P. H. L. de Freitas, K. Oda, T. Maeda, R. Takagi, and N. Amizuka, “FGF23 is mainly synthesized by osteocytes in the regularly distributed osteocytic lacunar canalicular system established after physiological bone remodeling,” J. Electron Microsc. (Tokyo)., vol. 58, no. 6, pp. 381–392, Dec. 2009.
[103] L. Claes, K. Eckert-Hübner, and P. Augat, “The effect of mechanical stability on local vascularization and tissue differentiation in callus healing,” J. Orthop. Res., vol. 20, no. 5, pp. 1099–1105, Sep. 2002.
[104] J.-M. Delaissé, T. L. Andersen, M. T. Engsig, K. Henriksen, T. Troen, and L. Blavier, “Matrix metalloproteinases (MMP) and cathepsin K contribute differently to osteoclastic activities.,” Microsc. Res. Tech., vol. 61, no. 6, pp. 504–13, Aug. 2003.
[105] B. R. Troen, “The regulation of cathepsin K gene expression,” Ann. N. Y. Acad. Sci., vol. 1068, no. 1, pp. 165–172, 2006.
[106] S. A. Reid, “A study of lamellar organisation in juvenile and adult human bone.,”

References
73
Anat. Embryol. (Berl)., vol. 174, no. 3, pp. 329–38, 1986.
[107] M. J. Glimcher and H. Muir, “Recent Studies of the Mineral Phase in Bone and Its Possible Linkage to the Organic Matrix by Protein-Bound Phosphate Bonds [and Discussion],” Philos. Trans. R. Soc. B Biol. Sci., vol. 304, no. 1121, pp. 479–508, 1984.
[108] W. J. Landis, “The strength of a calcified tissue depends in part on the molecular structure and organization of its constituent mineral crystals in their organic matrix.,” Bone, vol. 16, no. 5, pp. 533–44, May 1995.
[109] T. Domon and M. Wakita, “Electron microscope study of osteoclasts with special reference to the three-dimensional structure of the ruffled border.,” Arch. Histol. Jpn., vol. 49, no. 5, pp. 593–602, Dec. 1986.
[110] S. C. Marks, “Congenital osteopetrotic mutations as probes of the origin, structure, and function of osteoclasts.,” Clin. Orthop. Relat. Res., no. 189, pp. 239–63, Oct. 1984.
[111] A. Z. Zallone, “Relationships between shape and size of the osteoblasts and the accretion rate of trabecular bone surfaces.,” Anat. Embryol. (Berl)., vol. 152, no. 1, pp. 65–72, Dec. 1977.
[112] W. L. Ries, J. K. Gong, and M. M. Sholley, “A comparative study of osteoblasts: in situ versus isolated specimens.,” Am. J. Anat., vol. 172, no. 1, pp. 57–73, Jan. 1985.
[113] C. Palumbo, “A three-dimensional ultrastructural study of osteoid-osteocytes in the tibia of chick embryos.,” Cell Tissue Res., vol. 246, no. 1, pp. 125–31, 1986.
[114] M. Sasaki, H. Hongo, T. Hasegawa, R. Suzuki, L. Zhusheng, P. H. L. de Freitas, T. Yamada, K. Oda, T. Yamamoto, M. Li, Y. Totsuka, and N. Amizuka, “Morphological aspects of the biological function of the osteocytic lacunar canalicular system and of osteocyte-derived factors,” Oral Sci. Int., vol. 9, no. 1, pp. 1–8, 2012.

Thesis Declaration
74
THESIS DECLARATION
I declare that I have completed this dissertation single-handedly without the
unauthorised help of a second party and only with the assistance acknowledged
therein. I have appropriately acknowledged and referenced all text passages that are
derived literally from or are based on the content of published or unpublished work of
others, and all information that relates to verbal communications. I have abided by the
principles of good scientific conduct laid down in the charter of the Justus Liebig
University of Giessen in carrying out the investigations described in the dissertation.
------------------------------------------------
Francisca I. Alagboso
Giessen, Germany

Acknowledgements
75
ACKNOWLEDGEMENTS
My immense gratitude goes to my mentor Prof. Dr. Dr. Volker Alt for permitting me to
carry out my PhD work under his guidance. His continual support, guidance and
kindness enabled me to complete this thesis successfully.
It gives me great pleasure to acknowledge the invaluable help and support I received
from Dr. Ursula Sommer throughout my PhD work. Her unswerving expert ideas and
constructive discussions during my experimental work were noteworthy. I also wish to
express my profound appreciation for her meticulous revision of my thesis.
My sincere thanks go to PD. Dr. Ulrich Thormann and Dr. Matthaeus Budak for
providing their invaluable expertise and support in animal surgeries. Special thanks to
Dr. Seemun Ray, Mr. Andreas Kaiser and Mrs. Nirosha Wijekoon for offering the best
teamwork during the animal surgeries.
I am truly grateful for the support provided by the technical staffs in the Experimental
Trauma Surgery and Radiology laboratories, Giessen University. My special thank you
go to Mrs. Ida Oberst, Irina Bogun, Ivonne Bergen and Gunhild Martels for the brilliant
technical support.
My sincere appreciation go to the collaborating partners: Dr. Marian Kampschulte from
the Radiology laboratory, Giessen University, and to Dr. Anja Henss from the Institute
for Physical Chemistry, Giessen University and Prof. Dr. Lutz Dürselen from the
Institute of Orthopaedic Research and Biomechanics, Ulm University for the invaluable
support and discussions during my experimental work.
I am also grateful to Prof. Dr. Christian Heiß for giving me the great opportunity to
participate in the interdisciplinary SFB/79 research group and to the laboratory head
Prof. Dr. Katrin Lips for providing the conducive work environment to conduct my
research work. Also, I appreciate the general support and the peaceful working
atmosphere provided by all the laboratory members.
I owe my gratitude to the German Research Foundation (DFG) for funding this project
under the collaborative research work SFB/79 and the international Giessen Graduate
Centre for the Life sciences (GGL) for allowing me to benefit from their well-structured
graduate school program.
I am forever grateful to my family for their continual loving support and help.
Words are not enough for me to express my heartfelt gratitude to my dear husband for
his constant support and encouragement and to my loving son for bringing me so much
joy that help eased my stressful moments.
Last but by no means least; I thank the GOD ALMIGHTY who made everything
possible.

Curriculum Vitae
76

Curriculum Vitae
77