establishment and characterization of a patient- …
TRANSCRIPT

133
Introduction
Undifferentiated pleomorphic sarcoma (UPS) constitutes a heterogeneous and aggressive sub-group of sarcoma1). The clinical outcome remains dismal and the five-year survival rate is 65–70%2). The curative treatment for UPS is surgical resec-
ESTABLISHMENT AND CHARACTERIZATION OF A PATIENT-DERIVED CANCER MODEL OF UNDIFFERENTIATED PLEOMOR-PHIC SARCOMA
Fusako KITO1), Rieko OYAMA1), Mami TAKAHASHI2), Kumiko SHIOZAWA3), Marimu SAKUMOTO1), Akihiko YOSHIDA4), Noritaka SETSU5), Eisuke KOBAYASHI5), Akira KAWAI5) and Tadashi KONDO1,3)
1) Department of Innovative Seeds Evaluation, National Cancer Center Research Institute, 5–1–1 Tsukiji, Chuo-ku, Tokyo 104–0045, Japan
2) Central Animal Division, National Cancer Center Research Institute, 5–1–1 Tsukiji, Chuo-ku, Tokyo 104–0045, Japan
3) Division of Rare Cancer Research, National Cancer Center Research Institute, 5–1–1 Tsukiji, Chuo-ku, Tokyo 104–0045, Japan
4) Pathology and Clinical Laboratory Division, National Cancer Center Hospital, 5–1–1 Tsukiji, Chuo-ku, Tokyo 104–0045, Japan
5) Division of Musculoskeletal Oncology, National Cancer Center Hospital, 5–1–1 Tsukiji, Chuo-ku, Tokyo 104–0045, Japan
Abstract Background: Undifferentiated pleomorphic sarcoma (UPS) is a pleomorphic variant of undiffer-entiated, aggressive, and heterogeneous mesenchymal malignancy. Patient-derived cancer models comprise an invaluable preclinical tool for developing novel therapeutic strategies, although owing to the diversity in UPS, multiple cell lines are required for research of this disease. Therefore, we aimed to establish novel patient-derived xenografts (PDXs) from the tumor tissue of a patient with UPS, along with a cell line from an established PDX. Methods: The biologi-cal characteristics of the established cell line such as morphology, growth rate, colony forma-tion capacity, and immunohistochemical characteristics were determined. Proteomic features were assessed by mass spectrometry. Results: The tumor tissues of PDXs showed a similar histological appearance to that of primary tumor tissue. The cells grew at a sufficient rate for conventional experiments. The cells exhibited colony-forming ability and expressed a typical marker of UPS. The mass spectrometric protein expression profiling revealed a unique spec-trum of functions from the original tumor tissue, through patient-derived xenograft, to the cell line. The use of the established xenograft and cell line will facilitate our understanding of the molecular mechanisms underlying poor prognosis of UPS, and will contribute to the develop-ment of novel therapeutic strategies.
Key Words: Sarcoma, undifferentiated pleomorphic sarcoma, xenograft, cell line, proteome
* Corresponding author: Tadashi Kondo, Division of Rare Can-cer Research, National Cancer Center Research Institute, 5–1–1 Tsukiji, Chuo-ku, Tokyo 104–0045, JapanTel: +81 3 3542 2511 (ex 3003); Fax: +81 3 3547 5298E-mail: [email protected]
Tiss. Cult. Res. Commun. 37: 133–145 (2018)© 2018 Japanese Tissue Culture Association

134
Fusako Kito et al.
tion with consideration of adjuvant treatment according to the surgical margins, location of tumor, and tumor-associated risk factors. UPS exhibits marked res istance to radiotherapy and chemotherapy. At present, a common standard treatment is administered for all patients with UPS, whereas individualized strategies should be devel-oped owing to the heterogeneity of UPS3–5). As is the case for other sarcomas, large clinical trials to evaluate the efficacy of novel treatments have not yet been conducted for UPS1). To address to the limited number of patients with UPS and the clinical and pathological diversity of this disease, preclinical model systems are required to exam-ine novel therapeutic approaches.
Patient-derived xenografts (PDXs) and cell lines are invaluable tools to understand the complex malignant features and the clinical and pathologi-cal diversity of tumors at the molecular level. The standard procedure of creating PDXs is to section fresh surgically resected tumor tissues into small pieces, which are then implanted into immune-deficient mice. Once the tumor tissue is sufficiently enlarged, it is transplanted to other mice. After several passages, the tumor tissues in PDXs exhibit rapid and permanent growth. The tumor tissue can then be frozen in liquid nitrogen until use. Subse-quently, cell lines can be established from the PDX tumors. Such cell lines for UPS, previously termed malignant fibrous histiocytoma, were established in prior studies6–11), and patient-derived xenografts of UPS were also reported12–14). These models are useful resources to examine the effects of anti-cancer drugs. However, to address to the clinical and bio-logical diversity of the disease, additional patient-derived cancer models are necessary in UPS.
Here, we report a novel PDX established from the surgical specimen of a patient with UPS, as well as a cell line that was established from the PDX. The histological appearance of the tumor tissue, the properties of the cell line, and global protein expression were examined to characterize this patient-derived model.
Materials and Methods
This study utilized tumor tissue from a patient with UPS. The use of clinical materials in this study was approved by the ethics committee of
the National Cancer Center, Tokyo, Japan. Writ-ten informed consent was obtained from the patient. The protocol of animal experiments was in accor-dance with the guidelines for Animal Experiments of the National Cancer Center and approved by the Institutional Ethics Review Committee for Animal Experimentation. In a previous report, we estab-lished a cell line directly from the tumor tissue; detailed patient data was described therein15).
Patient informationThe patient-derived xenografts were estab-
lished from the tumor tissue of an 83-year-old male patient with UPS, who was admitted to the National Cancer Center Hospital, Tokyo, Japan. The patient exhibited soft tissue mass in his scapular back 2 months prior to being referred to the hospital. Pathological examination by needle biopsy was consistent with pleomorphic spindle cell sarcoma. Wide resection via pedicled latissimus dorsi flap surgery was performed four weeks after the initial diagnosis. Pathological examination of resected tumor tissues yielded a diagnosis of UPS. At four weeks after surgery, the patient developed multi-ple lung metastases with right pleural effusion and died of disease six weeks after surgery.
Histological observationHistological observations were performed on
the tumor tissues, which were sectioned from a representative paraffinized block of the tumor to four-micrometer-thick sections. Then, the tissue sections were deparaffinized and stained with hematoxylin and eosin (HE).
Establishment of PDXs and cell linesThe surgically excised tumor was cut into 2–3
mm in pieces (approximately 200 mm3), and implanted subcutaneously using a 13-gauge trans-plant needle to the hind bilateral flanks of 6- to 12-week-okd female severe immunodeficient NOD.Cg-Prkdcscid Il2rgtm1Sug
/Jic (NOD/Shi-scid, IL-2Rnull or NOG) mice (Central Institute for Experimental Animals, Kanagawa, Japan). When the tumors grew up to sufficient size (500–1,000 mm3), they were transplanted to additional mice. Tumor size was measured periodically using a digital caliper (SuperCaliper, Mitutiyo, Kanagawa, Japan). Tumor
135
PATIENT-DERIVED XENOGRAFT AND CELL LINE OF UNDIFFERENTIATED PLEOMORPHIC SARCOMA
volume was calculated as 6/pie × length × width × thickness16). After two passages, the tumors were minced into 8 mm3 with seizer, and soaked in CELLBANKER 1 plus (TAKARA BIO Inc., Osaka, Japan) at –80ºC overnight. Then tumor tissues were cryopreserved in liquid nitrogen tanks. We considered that the PDX was established when the engraftment of the cryopreserved tissue after quickly thawing at 37ºC was confirmed by visual inspection. Histological observations were performed on the sectioned tissues using HE staining.
The PDX tumor tissues were then minced with scissors and transferred to a culture dish. The cells were maintained in RPMI 1640 medium sup-plemented with 5% (or 10%) fetal bovine serum (FBS), 100 U/mL penicillin G, and 100 mg/mL streptomycin (Invitrogen Co., Carlsbad, CA), in a humidified atmosphere containing 5% CO2 at 37ºC. When the cultured cells reached confluence, they were dispersed with a 0.25% trypsin solution and seeded in another dish. The passaging was seri-ally performed more than 30 times until a cell line was established.
Authentication of the PDX and cell lineFor authentication of the established PDX and
cell line, short tandem repeats (STRs) were exam-ined by PCR. Genomic DNA was extracted from the excised tissue or cell lines using DNeasy blood and tissue kits (Qiagen, Hilden, Germany) or AllPrep DNA/RNA mini kits (Qiagen). DNA concentrations were measured using a NanoDrop 8000 (Thermo Fisher Scientific Waltham, MA), and DNA samples were stored at –20ºC until use. PCR amplifica-tion was performed for 10 loci (Supplementary Table 1). The PCR products were separated using an ABI 3130 or 3500xL Genetic Analyzer (Applied Biosystems, Waltham, MA). STR multiplex assays were carried out using GenePrint 10 (Promega, Madison, WI), and the data analysis was accom-plished using GeneMapper 5.0 (Applied Biosystems) or PeakScanner (Applied Biosystems) programs. The STR profiles were compared between the orig-inal tumor tissues, tumor tissues of PDXs, and established cell lines. Moreover, the STR profiles of cell lines were compared with those from the ATCC, DSMZ, or JRCB databases for reference matching.
Mycoplasma contamination screeningMycoplasma DNA was examined to determine
the presence of contamination. Tissue culture medium was examined according to the guideline from The International Cell Line Authentication Committee17). When the cells reached 70–90% confluence, DNA was recovered from the culture medium and amplif ied using an e-Myco Mycoplasma PCR Detect ion K i t ( In t ron Biotechnology, Gyeonggi-do, Korea). The PCR products were separated by 1.5% agarose gel elec-trophoresis and detected using Midori Green Advanced (Nippon Genetics, Tokyo, Japan). The image data were recorded and analyzed using an Amersham Imager 600 (GE Healthcare Biosciences, Chicago, IL).
Cell growth and characteristicsThe established cells were seeded into 96-well
culture plates at various cell numbers in triplicate. Cell numbers were counted at several time points over a 120 h period of incubation at 37ºC. Cell counting Kit 8 (CCK-8) reagent (Dojindo Molecular Technologies, Inc., Kumamoto, Japan) was added to each well, and after incubation for 2 h, absor-bance values were measured at a wavelength of 450 nm using a microplate reader (Bio-Rad, Hercules, CA). Cell culture doubling population time was calculated within a logarithmic growth phase of an exponential fitting curve.
Colony formation assayThe bottoms of 35-mm dishes were coated
with 0.5% low melting agarose (Noble agar, Sigma Aldrich, St. Louis, MO), with DMEM supplemented with 10% FBS and penicillin streptomycin (Thermo Fisher Scientific, San Jose, CA). Then the bot-toms of wells were covered with 0.33% agarose containing 5 × 10⁴ cells. After incubation at 37ºC for 4 weeks, colonies containing more than 50 cells were confirmed by microscopic observation (ZEISS Primo Vert Inverted Microscope, Carl Zeiss, Jena, Germany). All assays were performed in dupli-cate.
Immunohistochemical veri�cationThe cells were suspended, solidified using
iPGell (Genostaff, Tokyo, Japan), and cell-blocks

136
Fusako Kito et al.
were created. The cell-blocks were fixed with 10% formalin neutral buffer solution, embedded in par-affin, and four-micrometer-thick paraffin sections were prepared. The sectioned tissues were stained with HE or reacted with specific antibodies accord-ing to a previous study18). The primary antibod-ies used were mouse monoclonal antibodies; and antibodies against α-smooth muscle actin (SMA; 1: 100; 1A4; Dako, Glostrup, Denmark), cytokera-tin (1: 100; AE1/AE3; Dako), desmin (1: 100; D33; Dako), and myogenin (1: 100; F5D; Dako). A rab-bit polyclonal antibody against S-100 (1: 2000; Dako) was also used. The reactions were detected using the EnVision system (Dako).
Mass spectrometric protein expression pro�lingProteins were extracted from original tumor
tissues, PDX tumor tissue, and the cell line using urea lysis buffer (6 M urea, 2 M thiourea, 3% CHAPS, 1% Triton X-100) according to our previ-ous report19). The protein samples (25 μg) were processed into tryptic digests using the filter-aided sample preparation (FASP) method20). The tryp-tic digests were subjected to liquid chromatogra-phy coupled with nanoelectrospray tandem mass spectrometry (Finnigan LTQ Orbitrap XL mass spectrometer; Thermo Fisher, Waltham, MA). The Mascot software package (version 2.5.1; Matrix Science, London, UK) was used to search for the mass of each peptide ion peak against a SWISS-PROT database (Homo sap iens , Swiss prot_2015_09.fasta f i le containing 20,205 sequences) using the following parameters: 1 missed cleavage; variable modifications: oxidation (Met), phosphorylation (ST), phosphorylation (Y); peptide tolerance: 10 ppm; MS/MS tolerance: 0.8 Da; peptide charge: 2+ and 3+. Every sample was subjected to mass spectrometry five times, and the identified peptides and proteins were accu-mulated.
Data analysisThe R package “treemap” was used to illus-
trate the results of functional classification of iden-tified proteins21). The Kyoto Encyclopedia of Genes and Genomes (KEGG) database was used to clas-sify gene sets into their respective pathways22). Significance was indicated by the p-value for each
category, and the process groups with p < 0.05 were considered significant. The KEGG pathway annotations for each protein group in our proteome data were inferred using Database for Annotation, Visualization and Integration Discovery (DAVID) software (http://david.abcc.ncifcrf.gov/).
Results
Workflow of establishment of a patient-derived cancer model
The workflow of experiments in this study is illustrated in Figure 1. The tumor tissue sections were inoculated onto the skin of mice, and when each reached a proper size, it was transplanted to another mouse. The tumor tissue of the third generation was frozen in liquid nitrogen, and inoc-ulated to an additional mouse skin. We termed this third generation PDX model as NCC-UPS1-X3. The cell line was established from the third gen-eration PDX tumor, and was termed as NCC-UPS1-X3-C1. The tumor cells were not isolated from the cell population by cloning. As the patient did not receive neo-adjuvant treatment, there was no possible effect of either chemotherapy or radio-therapy on the tumor from which the PDX was established.
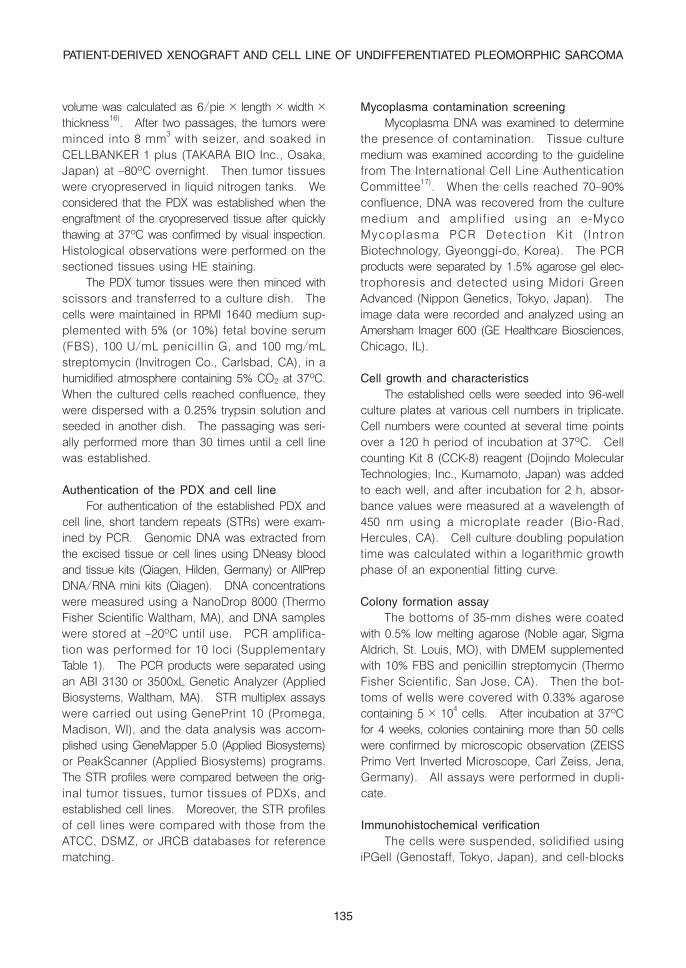
Characteristics of the established PDX modelFigure 2A and B show the typical images of
the resected tumor tissue from the patient with UPS in this study. The tumor tissue consisted of pleo-morphic spindle cells and exhibited histological
Figure 1. Workflow of experiments. The tumor tissue was subcutaneously implanted to the immuno-deficient mice. Once the tumor grew, a por-tion was inoculated to the other mice. The tumor tissue of the third generation was frozen in liquid nitrogen, as well as re-implanted to mice. A cell line was established from the tumor tissue of the third generation PDX.
137
PATIENT-DERIVED XENOGRAFT AND CELL LINE OF UNDIFFERENTIATED PLEOMORPHIC SARCOMA
Figure 2. Characteristics of tumors in PDX models. Histology of primary tumor tissues (A: ×200, B: ×400). The tis-sue sections were stained with hematoxylin and eosin. Histology of PDX tumor tissues; first generation (C, 37 days after transplantation), second generation (D, 48 days after transplantation), third generation (E, 30 days after transplantation), and fourth generation (F, 22 days after transplantation). Original magnification was ×400. Growth curves of PDX tumors (G: NCC-UPS1-X1, first generation of xenografts, mean of two tumors engrafted in the right and left sides of the trunk of a mouse; H: NCC-UPS1-X3, third generation of xenografts, mean of four tumors engrafted in the right and left sides of the trunks of two mice; bars: standard deviation value).
Figure 2A B
C D
E F
G H
0200400600800
1000120014001600
0 10 20 30 40
Tum
or v
olum
e (m
m3)
Days after implantation
0200400600800
1000120014001600
0 10 20 30 40
Tum
or v
olum
e (m
m3)
Days after implantation
200μm
200μm200μm
200μm
50μm100μm
A
C
E
G
B
D
F
H

138
Fusako Kito et al.
appearance that supported the diagnosis of UPS. The diffuse expression of SMA and negative expression of AE1/AE3, S100, desmin, caldesmon, myogenin, MDM2, and CDK2 was observed by immunohistochemical study (data not shown), being also consistent with the diagnosis of UPS.
We established a PDX model from the tumor tissue of a patient with UPS. The histological appearance of tumor tissues of different genera-tion PDXs are shown in Figure 2C–F. The histo-logical appearances of tumor tissues of PDXs from different generations were similar to those of the original tumor tissue (Figure 2A–F).
Growth status of the engrafted tumor tissues in mice was also examined. The growth curve of the PDX tumors in the first generation is shown in Figure 2G. At more than 30 days after implanta-tion, the tumor sizes started to increase. The growth curve of PDX tumor tissues in the third gen-eration is demonstrated in Figure 2H. The tumor size started to increase two weeks after transplan-tation, with the periods required for a tumor to reach 500 mm3 being apparently shorter than those of first generation tumors.
Authentication of the PDX and cell line and cyto-logical assay
To confirm the identification of the origin of PDX tumors and the established cell line, we examined the status of STRs of ten microsatellites. We found that all of STRs except vWA (20) were identical to the other samples and to the surgically
resected original tumor (Table 1). Through data-base search, we did not find any cell lines with the same STR patterns. We concluded that the PDX model NCC-UPS1-X3 and NCC-UPS1-X3-C1 cells comprised novel UPS models derived from the patient with UPS.
We confirmed the absence of mycoplasma contamination by PCR. Mycoplasma-specific DNAs were not detected in conditioned media from the NCC-UPS1-X3-C1 cell culture (data not shown). We concluded that the cell line was free of myco-plasma contamination.
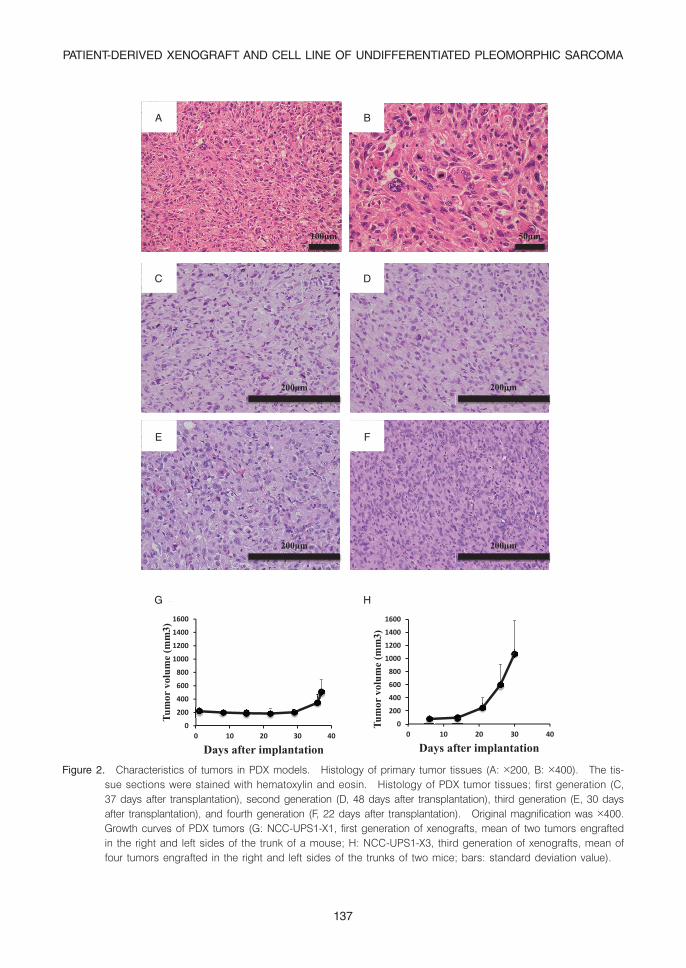
Phenotypic characterization of tissue cultured cellsMorphological characterization was performed
via microscopic observations. NCC-UPS1-X3-C1 cells were spindle, round, or polygonal in shape (Figure 3A). The growth status of NCC-UPS1-X3-C1 cells was examined (Figure 3B). Popula-tion doubling time was approximately 40 h. Colony formation capabilities of NCC-UPS1-X3-C1 cells were confirmed on soft agar plates (Figure 3C).
For immunocytochemical study, NCC-UPS1-X3-C1 cells were embedded in paraffin (Figure 3D) and the cells were reacted with antibodies against histological marker proteins. We found that the NCC-UPS1-X3-C1 cells were positive for smooth muscle actin (Figure 3E) but negative for cytoker-atin (Figure 3F), S100 (Figure 3G), desmin (Figure 3H), and myogenin (Figure 3I).
Table 1. Results of STR analysis
Microsatellite (Chromosome)
Normal Tissue Tumor Tissue NCC-UPS1-X3NCC-UPS1-X3-C1
(P59)
Amelogenin (X Y) X,Y X,Y X,Y X,Y
TH01 (3) 6,7 6, 7 6, 7 6,7
D21S11 (21) 28.2,29 28.2,29 28.2 28.2
D5S818 (5) 11 11 11 11
D13S317 (13) 9,12 9,12 12 12
D7S820 (7) 11 11 11 11
D16S539 (16) 9,12 9,12 9, 12 9,12
CSF1PO (5) 10,11 10,11 11 11
vWA (12) 16,20 16,20 20 20
TPOX (2) 8 8 8 8
Passage number of the cells were indicate.
139
PATIENT-DERIVED XENOGRAFT AND CELL LINE OF UNDIFFERENTIATED PLEOMORPHIC SARCOMA
Proteomic studyThe protein expression profiles of primary tumor
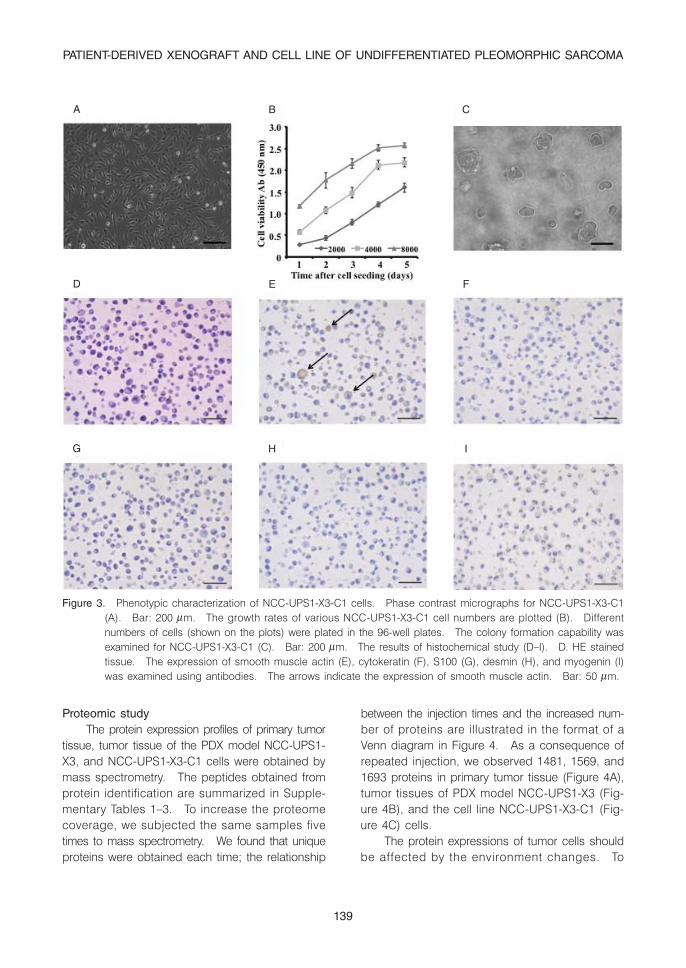
tissue, tumor tissue of the PDX model NCC-UPS1-X3, and NCC-UPS1-X3-C1 cells were obtained by mass spectrometry. The peptides obtained from protein identification are summarized in Supple-mentary Tables 1–3. To increase the proteome coverage, we subjected the same samples five times to mass spectrometry. We found that unique proteins were obtained each time; the relationship
between the injection times and the increased num-ber of proteins are illustrated in the format of a Venn diagram in Figure 4. As a consequence of repeated injection, we observed 1481, 1569, and 1693 proteins in primary tumor tissue (Figure 4A), tumor tissues of PDX model NCC-UPS1-X3 (Fig-ure 4B), and the cell line NCC-UPS1-X3-C1 (Fig-ure 4C) cells.
The protein expressions of tumor cells should be affected by the environment changes. To
Figure 3. Phenotypic characterization of NCC-UPS1-X3-C1 cells. Phase contrast micrographs for NCC-UPS1-X3-C1 (A). Bar: 200 μm. The growth rates of various NCC-UPS1-X3-C1 cell numbers are plotted (B). Different numbers of cells (shown on the plots) were plated in the 96-well plates. The colony formation capability was examined for NCC-UPS1-X3-C1 (C). Bar: 200 μm. The results of histochemical study (D–I). D. HE stained tissue. The expression of smooth muscle actin (E), cytokeratin (F), S100 (G), desmin (H), and myogenin (I) was examined using antibodies. The arrows indicate the expression of smooth muscle actin. Bar: 50 μm.
A
D
G
B
E
H
C
F
I

140
Fusako Kito et al.
understand the alterations of molecular pathways during the process of model establishment, we performed the treemap analysis of KEGG path-ways (Figure 5). The proteins are assigned to certain KEGG pathways and each treemap con-sists of unique KEGG pathways. The columns are colored according to the enrichment score of pathways, and the size of column is determined according to the number of proteins in that pathway. Figure 5 depicts a functional classifica-tion of identified proteins in a treemap format. Each treemap includes KEGG pathways with adjusted p-value < 0.05. Supplementary Table 4 summarizes the annotations of the proteins used in the treemaps. “Focal adhesion”, “Pathogenic Escherichia coli infection”, and “Ribosome” were mostly enriched in the original tumor tissues (Fig. 5A). “Ribosome”, “Proteasome” and “Pathogenic Escherichia coli infection” were mostly enriched in both PDX tumor tissue and cell line samples (Fig. 5B and C). “Ribosome”, “Pathogenic Escherichia
coli infection” and “Proteasome” were commonly enriched in all samples (Fig. 5D). The enrichment scores for “Focal adhesion”, “ECM-receptor inter-action”, “Pathogenic Escherichia coli infection”, “Complement and coagulation cascades”, and “Glycolysis/Gluconeogenesis” were decreased in the PDX tumor and cell line samples compared to those in the original tumor whereas the enrichment scores for “Ribosome” and “Aminoacyl-tRNA bio-synthesis” were increased in the PDX tumor and cell line samples compared to those in the origi-nal tumor.
Based on observation of the treemap results, we found a suggestive spectrum of pathways, which changed during the process of model establishment. We categorized the enriched path-ways according their possible significances (Table 2). In Table 2, the KEGG pathways are labeled with the ranking orders that were determined according to the enrichment score; the pathways with the higher enrichment score are highly ranked.
Figure 4. Venn diagrams of number of proteins identified by mass spectrometry. (A) Primary tumor tissues, (B) tumor tissues of PDX model NCC-UPS1-X3, and of NCC-UPS1-X3-C1 cells (C). The numbers in the diagrams rep-resent the number of proteins identified in the experiment. Note that the proteins identified in the experiment from the first to fifth run were partially overlapped, and by combining all results, a large number of proteins can be observed.
A
C
B

141
PATIENT-DERIVED XENOGRAFT AND CELL LINE OF UNDIFFERENTIATED PLEOMORPHIC SARCOMA
We found a spectrum of pathways among the sam-ples from tumor tissues, PDX tumor tissues, and the established cell lines. Pathways in Group A were consistently common in all samples. Path-ways in Group B were common in all samples, but not consistent between PDX tumors and cell lines. Pathways in Group C were observed only in the original tumor tissue and PDX tumor tissues. The pathway in Group D was enriched in the original tumor tissue and the cell line. Pathways in Group E were observed only from the tumor tissue. Pathways in Group F were observed both in the PDX tumor tissues and the cell line consistently or irregularly. Pathways in Group G were observed consistently only in PDX tumor tissues. Pathways
in Group H were observed only in the cell line. The different enrichment patterns of pathways may reflect the different phenotypes of each model. Furthermore, these observations may indicate important concerns regarding the patient-derived cancer model. For example, when we examined the biological features relating to pathways in group A, because those pathways are consistently observed in the primary tumor tissues, the PDX tumor tissues, and the cell line, all models are suit-able for study. In contrast, we may need to avoid studying the pathways in Group E, because they were not observed in the models. The pathways in Groups G and H were enriched only in the PDX tissues and the cell line, respectively.
Figure 5. Treemap of sample-specific KEGG pathways. Enrichment of sample-specific KEGG pathways is shown for primary tumor tissue (A), tissue of the PDX model NCC-UPS1-X3 (B), and of the NCC-UPS1-X3-C1 cells (C). The pathways common in the primary tumor tissue, tissue of the PDX model NCC-UPS1-X3-C1, and the cell line NCC-UPS1-X3-C1 are summarized (D). The size of boxes represents the numbers of the proteins in that category and the color represents the enrichment score. Categories in red are characterized by higher aver-age expression in the sample, and in dark blue by lower average expression. All process groups were con-sidered significant at p < 0.05.
A
C
B
D

142
Fusako Kito et al.
Table 2. Rank of KEGG pathways according to enrichment score, -log2 (p-value), in the proteome of different samples.
No Name of pathways
Name of samples
GroupsTumor
NCC-UPS1-X3
NCC-UPS1-X3-C1
Common
1 Focal adhesion 1 4 8 4
A
2 Pathogenic Escherichia coli infection 2 3 3 2
3 Ribosome 3 2 1 1
4 Proteasome 4 1 2 3
5 Glycolysis/Gluconeogenesis 7 8 7 5
6 Pentose phosphate pathway 8 12 9 7
7 Fatty acid metabolism 9 9 18 11
8 Pyruvate metabolism 10 5 6 8
9 Regulation of actin cytoskeleton 11 13 11 6
10 Valine, leucine and isoleucine degradation 13 11 14 n.d.
11 Glutathione metabolism 14 25 22 12
12 Citrate cycle (TCA cycle) 15 15 5 9
13 Aminoacyl-tRNA biosynthesis 25 6 4 n.d.
14 Lysine degradation 23 7 13 n.d.
15 ECM-receptor interaction 6 14 n.d. 16
B16 Fc gamma R-mediated phagocytosis 20 21 n.d. 20
17 Oocyte meiosis 26 23 n.d. 17
18 Antigen processing and presentation 22 22 n.d. 10
19 Systemic lupus erythematosus 12 n.d. n.d. 21
C
20 Fatty acid elongation in mitochondria 16 n.d. n.d. n.d.
21 Complement and coagulation cascades 5 n.d. n.d. n.d.
22 Adherens junction 17 n.d. n.d. n.d.
23 Leukocyte transendothelial migration 18 n.d. n.d. 19
24 Prion diseases 19 n.d. n.d. n.d.
25 PPAR signaling pathway 21 n.d. n.d. n.d.
26 Arginine and proline metabolism 24 n.d. n.d. n.d.
27 Starch and sucrose metabolism 27 n.d. n.d. 22
28 Arrhythmogenic right ventricular cardiomyopathy (ARVC) 28 n.d. n.d. n.d.
29 Spliceosome n.d. 10 12 13
D30 Huntington’s disease n.d. 20 10 18
31 Parkinson’s disease n.d. 17 15 n.d.
32 Propanoate metabolism n.d. 19 21 n.d.

143
PATIENT-DERIVED XENOGRAFT AND CELL LINE OF UNDIFFERENTIATED PLEOMORPHIC SARCOMA
Discussion
Our results indicate that the patient-derived cancer model appears to have promise as a research tool. The tumor tissues implanted in the mice may mimic the tumor tissues in the donor patients. Previous studies suggested that the response to treatment was common between the original tumor tissues and those of PDXs23,24). Patient-derived cells also have unique advantages as they are easy to handle and the effects of many possible anti-cancer drugs can be screened in a high throughput way25). To achieve the goal of personal medicine, the patient-derived cancer model may constitute an indispensable tool. However, although the patient-derived cancer model is expected to faithfully reproduce the features of orig-inal tumors, it is highly controversial whether such models retain the molecular features of original tumors. Wang et al. reported that somatic muta-
tions, gene copy number, and expression profiles, as well as the phospho-tyrosine proteome land-scape were similar between patient tumors and PDX tumors in lung cancer26). In contrast, Ben-David et al. stressed that copy number alter-ations rapidly accumulated during PDX passaging, owing to the clonal selection of preexisting minor-ity tumor cells27). Dieter et al. pointed out that EBV-associated B-lymphoproliferation frequently develop following xenotransplantation28). In the present study, we found that the proteomic fea-tures were similar but not identical among the original tumor tissues, the tumor tissues of PDX, and the cell line. In addition, although the patient-derived cancer model established with PDX exhibited morphologically similar appearance to the original tumor tissue at the different passages, the growth rate of PDX tumors increased in the late passages. Our observations were consistent with those of a previous report29). During pas-
33 Glyoxylate and dicarboxylate metabolism n.d. 24 n.d. n.d.
E
34 Leukocyte transendothelial migration n.d. 16 n.d. n.d.
35 Endocytosis n.d. 26 n.d. n.d.
36 beta-Alanine metabolism n.d. 27 n.d. n.d.
37 Neurotrophin signaling pathway n.d. 28 n.d. 23
38 Steroid biosynthesis n.d. 29 n.d. n.d.
39 Fructose and mannose metabolism n.d. 30 n.d. n.d.
40 Tryptophan metabolism n.d. 31 n.d. n.d.
41 Butanoate metabolism n.d. 18 n.d. n.d.
42 DNA replication n.d. n.d. 20 n.d.
F
43 Protein export n.d. n.d. 17 n.d.
44 Gap junction n.d. n.d. 19 n.d.
45 Cysteine and methionine metabolism n.d. n.d. 23 n.d.
46 Tight junction n.d. n.d. 16 n.d.
47 Terpenoid backbone biosynthesis n.d. n.d. 24 n.d.
n.d.: not detected.Group A: pathways in all samplesGroup B: pathways in the original tumor and NCC-UPS1-X3Group C: pathways unique to the original tumorGroup D: pathways in NCC-UPS1-X2 and NCC-UPS1-X3-C1Group E: pathways unique to NCC-UPS1-X3Group F: pathways unique to NCC-UPS1-X3-C1

144
Fusako Kito et al.
sage, the tumor cells may have adopted them-selves to the circumstances of the mouse environ-ment, or the tumor cells with advantageous traits were selected during the process of engraftment. Considering these reports and our observations, we doubt on the versatile utility of patient-derived cancer models. We thus need to assess the phe-notype of PDXs and cell lines to verify the consis-tency of original properties of the tumors.
In conclusion, to generate a novel preclinical model of UPS, we successfully obtained a PDX model and a cell line. We consider that patient-derived cancer models, especially for rare cancers, should be shared in the research community. We hope that our models accelerate the development of novel clinical applications for patients with UPS.
Con�ict of Interest
The authors declare that they have no con-flicting interests.
Sources of Support
This research was supported by the National Cancer Center Research and Development Fund (26-A-3 and 26-A-9).
Acknowledgements
We would like to thank Editage (www.editage.jp) for English language editing and constructive comments on the manuscript.
References
1) Fletcher, C. D. M., Bridge, J. A., Hogendoorn, P., et al.: WHO Classification of Tumours of Soft Tissue and Bone (ed. fourth edition). Geneva, WHO Press, 2013.
2) Goldblum, J. R.: An approach to pleomorphic sar-comas: can we subclassify, and does it matter? Mod. Pathol., 27 Suppl 1, S39–46, 2014.
3) Radaelli, S., Stacchiotti, S., Casali, P. G., et al.: Emerging therapies for adult soft tissue sarcoma. Expert Rev. Anticancer Ther., 14, 689–704, 2014.
4) Reichardt, P.: Soft tissue sarcomas, a look into the future: different treatments for different subtypes. Future Oncol., 10, s19–27, 2014.
5) Versleijen-Jonkers, Y. M., Vlenterie, M., van de Luijtgaarden, A. C., et al.: Anti-angiogenic therapy, a new player in the field of sarcoma treatment. Crit. Rev. Oncol. Hematol., 91, 172–185, 2014.
6) Nakatani, T., Marui, T., Yamamoto, T., et al.: Estab-lishment and characterization of cell line TNMY1 derived from human malignant fibrous histiocytoma. Pathol. Int., 51, 595–602, 2001.
7) Krause, A. K., Hinrichs, S. H., Orndal, C., et al.: Characterization of a human myxoid malignant fibrous histiocytoma cell line, OH931. Cancer Genet. Cyto-genet., 94, 138–143, 1997.
8) Mairal, A., Chibon, F., Rousselet, A., et al.: Estab-lishment of a human malignant fibrous histiocytoma cell line, COMA: Characterization by conventional cyto-genetics, comparative genomic hybridization, and mul-tiplex fluorescence in situ hybridization. Cancer Genet. Cytogenet., 121, 117–123, 2000.
9) Hakozaki, M., Hojo, H., Sato, M., et al.: Establish-ment and characterization of a new cell line, FPS-1, derived from human undifferentiated pleomorphic sar-coma, overexpressing epidermal growth factor recep-tor and cyclooxygenase-2. Anticancer Res., 26, 3393–3401, 2006.
10) Nishio, J., Iwasaki, H., Nabeshima, K., et al.: Estab-lishment of a new human pleomorphic malignant fibrous histiocytoma cell line, FU-MFH-2: Molecular cytoge-netic characterization by multicolor fluorescence in situ hybridization and comparative genomic hybridization. J. Exp. Clin. Cancer Res., 29:153, 2010.
11) Becker, M., Graf, C., Tonak, M., et al.: Xenograft models for undifferentiated pleomorphic sarcoma not otherwise specified are essential for preclinical testing of therapeutic agents. Oncol. Lett., 12, 1257–1264, 2016.
12) Steinstraesser, L., Jacobsen, F., Schubert, C., et al.: Establishment of a primary human sarcoma model in athymic nude mice. Hum. Cell, 23, 50–57, 2010.
13) Tilkorn, D. J., Daigeler, A., Hauser, J., et al.: A novel xenograft model with intrinsic vascularisation for grow-ing undifferentiated pleomorphic sarcoma NOS in mice. J. Cancer Res. Clin. Oncol., 138, 877–884, 2012.
14) Tilkorn, D. J., Stricker, I., Hauser, J., et al.: Experi-mental murine model of primary high grade undiffer-entiated pleomorphic sarcoma not otherwise specified. In Vivo, 26, 559–563, 2012.
15) Sakumoto, M., Takahashi, M., Oyama, R., et al.: Establishment and proteomic characterization of NCC-LMS1-C1, a novel cell line of primary leiomyosarcoma in the bone. Jpn. J. Clin. Oncol., 47, 954–961, 2017.
16) Tomayko, M. M. and Reynolds, C. P.: Determination of subcutaneous tumor size in athymic (nude) mice. Cancer Chemother. Pharmacol., 24, 148–154, 1989.
17) Capes-Davis, A., Dirks, W. G., MacLeod, R. A., et al.: Quality Matters: Cell lines and their use in research. GIT Lab. J. Eur., 17, 12–13, 2014.
145
PATIENT-DERIVED XENOGRAFT AND CELL LINE OF UNDIFFERENTIATED PLEOMORPHIC SARCOMA
18) Yoshida, A., Got,o K., Kodaira, M., et al.: CIC-rear-ranged sarcomas: A study of 20 cases and compari-sons with ewing sarcomas. Am. J. Surg. Pathol., 40, 313–323, 2016.
19) Kondo, T. and Hirohashi, S.: Application of highly sensitive fluorescent dyes (CyDye DIGE Fluor satura-tion dyes) to laser microdissection and two-dimensional difference gel electrophoresis (2D-DIGE) for cancer proteomics. Nat. Protoc., 1, 2940–2956, 2007.
20) Wisniewski, J. R., Zougman, A., Nagaraj, N., et al.: Universal sample preparation method for proteome analysis. Nat. Methods., 6, 359–362, 2009.
21) Baehrecke, E. H., Dang, N., Babaria, K., et al.: Visu-alization and analysis of microarray and gene ontol-ogy data with treemaps. BMC Bioinf., 5:84, 2004.
22) A l termann, E . and Klaenhammer, T. R. : PathwayVoyager: pathway mapping using the Kyoto Encyclopedia of Genes and Genomes (KEGG) database. BMC Genomics, 6:60, 2005.
23) Tentler, J. J., Tan, A. C., Weekes, C. D., et al.: Patient-derived tumour xenografts as models for oncology drug development. Nat. Rev. Clin. Oncol., 9, 338–350, 2012.
24) Izumchenko, E., Paz, K., Ciznadija, D., et al.: Patient-
derived xenografts effectively capture responses to oncology therapy in a heterogeneous cohort of patients with solid tumors. Ann. Oncol., 28, 2595–2605, 2017.
25) Barretina, J., Caponigro, G., Stransky, N., et al.: The Cancer Cell Line Encyclopedia enables predictive mod-elling of anticancer drug sensitivity. Nature, 483, 603–607, 2012.
26) Wang, D., Pham, N. A., Tong, J., et al.: Molecular heterogeneity of non-small cell lung carcinoma patient-derived xenografts closely reflect their primary tumors. Int. J. Cancer, 140, 662–673, 2017.
27) Ben-David, U., Ha, G., Tseng, Y. Y., et al.: Patient-derived xenografts undergo mouse-specific tumor evolution. Nat. Genet., 49, 1567–1575, 2017.
28) Dieter, S. M., Giessler, K. M., Kriegsmann, M., et al.: Patient-derived xenografts of gastrointestinal can-cers are susceptible to rapid and delayed B-lymphoproliferation. Int. J. Cancer, 140, 1356–1363, 2017.
29) Pearson, A. T., Finkel, K. A., Warner, K. A., et al.: Patient-derived xenograft (PDX) tumors increase growth rate with time. Oncotarget, 7, 7993–8005, 2016.
(Accepted 26 February 2018)