establishing a sustainable water supply in chonyonyo ... · establishing a sustainable water ......
TRANSCRIPT
UPTEC W 17 005
Examensarbete 30 hpNovember 2017
Establishing a sustainable water supply in Chonyonyo, Karagwe, Tanzania
Kristin Holmberg

i
ABSTRACT
Establishing a sustainable water supply in Chonyonyo, Karagwe, Tanzania Kristin Holmberg
The small village Chonyonyo, in the district Karagwe in the northwest of Tanzania has a
shortage of safe drinking water. Women and children spend several hours a day fetching
water and gathering firewood to boil the water to make it more suitable for drinking. The
need of new sustainable water supply solutions is fundamental for providing more people
with safe drinking water.
Two water distribution alternatives was suggested by Engineers Without Borders and
MAVUNO as possible solutions to supply the community with water. Alternative 1
consisted of a 10 km distribution system from an already existing groundwater well at the
MAVUNO office to Chonyonyo. Alternative 2 consisted of a 3.5 km distribution system
from the most neighboring valley to Chonyonyo, where no groundwater well exists today.
Both alternatives would be powered by solar panels and operated six hours a day. The most
sustainable distribution solution was chosen by modeling the distribution alternatives in the
modeling software EPANET. Input parameters to simulate the model were position,
elevation and dimension of storage tanks and pipes. Other required input parameters were
absolute roughness, water withdrawal, operation hours, description of the withdrawal pattern
for the water outlet and other modelling conditions such as a suitable simulation time. The
selection of water distribution system was based on minimum requirements of energy used
for operation weighed with lowest possible water residence time in the storage tank.
Water quality analyses of the raw water source for distribution alternative 1 were performed
in order to classify the water and select suitable water treatment solutions. The analyses
consisted of microbiological and metal/metalloid analyses, and measurements of EC and pH.
The result of the simulation showed that neither of the distribution alternatives met all the
pipe design criteria. The main reason is that the system can not be constantly operated. If this
criterion is excluded the optimal solution is distribution alternative 1 with an outer pipe
diameter of 110 mm throughout the whole distribution system and a water residence time in
the storage tank of 57.1 hours.
The water quality analysis showed that the ground water source for distribution alternative 1
was affected by surface water and is thus classified as unusable because of high levels of
harmful bacteria and lead. The most suitable water treatment solution due to the aspects of
sustainable water supply are the microbiological barriers ultrafiltration and UV-light in
combination with a treatment method to remove lead from the water.
Keyword: activated carbon filter, EPANET, microbiological barrier, MPN, pipe design
criteria, storage effects, sustainable water supply, ultrafiltration, UV-light, water treatment
Department of Earth Science, Uppsala University
Villavägen 16, SE-752 36 Uppsala, Sweden. ISSN 1401-5765

ii
REFERAT
Upprättande av en hållbar vattenförsörjning i Chonyonyo, Karagwe, Tanzania
Kristin Holmberg
I samhället Chonyonyo i distriktet Karagwe i nordvästra Tanzania råder brist på säkert
dricksvatten. Kvinnor och barn spenderar flera timmar om dagen för att hämta vatten och
samla ved för att koka vattnet så att det blir säkrare att dricka. Behovet av nya hållbara
vattenlösningar är fundamental för att kunna försörja fler människor med säkert dricksvatten.
Två vattendistributionsalternativ lades fram av Ingenjörer utan gränser och MAVUNO som
möjliga lösningar för att försörja invånarna i Chonyonyo med dricksvatten. Alternativ 1
bestod av ett 10 km distributionssystem från en befintlig grundvattenbrunn vid MAVUNO:s
kontor. Alternativ 2 bestod av ett 3.5 km distributionssystem från den närmaste dalen till
samhället Chonyonyo, där det inte finns någon befintlig grundvattenbrunn. Båda alternativen
kommer att drivas av solpaneler och vara under drift sex timmar per dygn. Det lämpligaste
distributionsalternativet valdes ut genom simulering i mjukvaran EPANET.
Ingångsparametrar för simuleringen var bl.a. position, höjd och dimension på reservoarer och
ledningar. Ytterligare nödvändiga parametrar var skrovlighet på ledningar, storlek på
vattenuttag, antal driftstimmar, uttagmönster från vattenkranar i systemet samt andra
modelleringsförhållanden såsom en lämplig simuleringstid. Valet av distributionssystem
grundades på lägsta möjliga energibehov för drift viktat mot lägsta möjliga uppehållstid i
vattenreservoarerna.
Kvalitetsanalyser av råvattnet för distributionsalternativ 1 genomfördes för att klassificera
vattnet och göra lämpliga val av vattenreningslösningar. Analyserna omfattade mätning av
ett antal mikrobiologiska parametrar, metaller/metalloider samt EC och pH.
Simuleringen visade att ingen av alternativen kunde uppnå alla designkriterierna.
Huvudorsaken till det är att systemet endast är i drift periodvis. Bortsett från dessa kriterier
var det optimala lösningen distributionsalternativ 1 med en yttre rördiameter på 110 mm
genom hela systemet med en maximal uppehållstid i vattenreservoaren på ca 57 timmar.
Analyserna visade att grundvattnet var ytvattenpåverkat och klassificeras som otjänligt med
höga nivåer av skadliga bakterier och bly. De lämpligaste vattenreningslösningarna i
förhållande till hållbarhetsaspekterna var de mikrobiologiska barriärerna ultrafiltrering och
behandling med UV-ljus kombinerat med en reningsmetod för att avskilja bly från vattnet.
Nyckelord: EPANET, hållbar vattenförsörjning, kolfilter, mikrobiologisk barriär, MPN, UV-
beredning, pipe design criteria, lagringseffekter, ultrafiltrering, UV-ljus, vattenrening
Institutionen för Geovetenskaper, Uppsala universitet
Villavägen 16, SE-752 36 Uppsala, Sverige. ISSN 1401-5765

iii
PREFACE
The report Establishing a sustainable water supply in Chonyonyo, Karagwe, Tanzania is the
master thesis and final course at the Master Program in Environmental and Water
Engineering at Uppsala University and Swedish University of Agricultural Science. The
thesis consists of 30 ECTS credits and was made in collaboration with the non-government
organization MAVUNO in Ihanda, Karagwe, Tanzania and Engineers Without Borders in
Malmö, Sweden.
Matilda Perborn, HVAC-Engineer at the consulting firm Bengt Dahlgren in Malmö, Sweden
has been my supervisor. Subject reviewer was Roger Herbert, Senior lecturer in hydrology
at Uppsala University, Sweden.
I want to thank Krister Törneke, Investigator in Water at the consulting firm Tyréns in
Stockholm for introducing and assisting me with the modeling in the computerized software
EPANET. I also want to thank Christian Demandt, Laboratory Manager at Laboratory of
Geochemistry at Swedish University of Agricultural Science for doing water analyses. Other
people who have been helpful during my project with expertise and information are Nicholas
South, Sales Engineer at NP Innovation. Also Per Samuelsson, CEO and Sales chief at Water
processing should have a great thank for assisting me during my project.
I also want to thank Joseph Baraka and Materine Shwekelera, water technicians at MAVUNO
for introducing me to the laboratory work and assisting me with information of the water
situation and consumption in Chonyonyo, Tanzania. Also Charles Bahati, Project Manager
at MAVUNO have been helpful during the research work in Chonyonyo, Tanzania.
In addition, I want to send a big thank to Engineers Without Borders, Sweden for economical
support to implement the water analysis needed for doing my project feasible.
Copyright © Kristin Holmberg and Department of Earth Sciences, Air, Water and Landscape
Science, Uppsala University.
UPTEC W 17 005, ISSN 1401-5765
Printed at the Department of Earth Sciences, Geotryckeriet, Uppsala University, Uppsala,
2017.

iv
POPULÄRVETENSKAPLIG SAMMANFATTNING
Utvärdering av processen för att upprätta en hållbar vattenförsörjning i Chonyonyo,
Karagwe, Tanzania
Kristin Holmberg
Samhället Chonyonyo i distriktet Karagwe i nordvästra Tanzania har stora problem med
vattenbrist. De senaste åren har regnsäsongen varit kortvarig och förskjuten vilket resulterat
i svåra torrperioder som hotar matförsörjningen och möjligheterna till säkert dricksvatten.
Kvinnor och barn spenderar flera timmar om dagen för att hämta vatten och samla ved för
att koka vattnet så att det blir säkrare att dricka. Detta leder i många fall till att barns
utbildning prioriteras bort. Tillgången på vatten är bristande och kvaliteten låg. Invånarna i
Chonyonyo använder 10-20 liter per dag för alla vattenfaciliteter. Enligt FN behöver varje
person 20-50 liter per dag för att upprätthålla sina behov av dricksvatten, till matlagning och
personlig hygien. Undersökningar har visat att en stor del av samhällets invånare konsumerar
råvatten som klassas som otjänligt med höga halter av farliga bakterier som härstammar från
avföring från människor och djur och kan leda till diarréer och sjukdomar som kolera.
Behovet av nya hållbara vattenberedningslösningar är fundamentalt för att kunna försörja
byborna i Chonyonyo med säkert dricksvatten. För att säkerställa ett hållbart system behöver
vattenlösningarna vara lättillgängliga och försörja samhället med säkert dricksvatten över
lång tid. Risken för försämring av vattenkvaliteten i distributionssystem och råvattenkällan
ska minimeras. Hänsyn till återhämtningsgraden av grundvatten är en förutsättning för att
inte utarma råvattenkällan. Vattenlösningen skall även ta hänsyn till sociala och ekonomiska
aspekter.
Utifrån nämnda aspekter jämfördes två vattenberedningsalternativ utifrån energibehov och
omsättning på vattnet. Alternativen ritades upp och modellerades i datorprogrammet
EPANET där det alternativ som hade lägst energibehov viktat med lägst vattenomsättning
valdes som det lämpligaste alternativet. Det alternativet som valdes som lämpligast består av
en 10 km vattenledning från en redan borrad brunn vid den icke-statliga organisationen
MAVUNO:s kontor i samhället Ihanda. Vattnet från den brunnen undersöktes genom
vattenanalyser för att kunna utreda dess kvalitet. Analyserna visade på att grundvattnet är
ytvattenpåverkat vilket innebär att bakterier som vanligtvis inte förekommer i grundvatten
detekterades. Vattnet i brunnen klassas som otjänligt med förhöjda halter av mikrobiologiska
bakterier och bly. Bly är en giftig metall och räknas in blad de farligaste ämnena för
människor att få i sig. Förgiftning av bly kan bland annat leda till skador på nervsystemet och
njur- och hjärtproblem. Då vattnet klassades som ytvattenpåverkat misstänker man att
brunnen läcker in ytvatten alternativt att hela vattenkällan är förorenad där föroreningen
härstammar från en annan plats och blandar ut sig i hela grundvattenkällan.
Baserat på vattenkvalitetsanalyserna behöver vattenreningslösningar installeras i anslutning
till distributionssystemet för att förbättra vattenkvaliteten. Två så kallade mikrobiologiska
barriärer behövs för att kunna säkerställa ett vatten fritt från farliga mikroorganismer. Dess
funktion är att separera eller desinfektera de mikrobiologiska organismerna i vattnet. De kan

v
separeras genom att till exempel filtrera bort dem genom små porer som är mindre än 0,1
mikrometer, filtrera dem genom ett tjockt lager sand eller genom att få organismerna att
klumpa ihop sig och sjunka till botten för att sedan avlägsnas. Vattnet kan även desinfekteras
genom att till exempel tillsätta klor till vattnet eller belysa vattnet med ultraviolett ljus som
inaktiverar organismernas DNA så att de blir ofarliga. Dessutom behövs också en
vattenreningslösning som minskar halterna av bly i vattnet. Blyet kan skiljas ut genom att
filtrera vattnet genom porer som är mindre än 3 nanometer eller genom kolfilter. De
lämpligaste vattenreningslösningarna för att säkerställa en hållbar vattenförsörjning ansågs
vara ett ultrafilter med porer av storleken 0.01 – 0.1 mikrometer tillsammans med UV-
ljusbehandling kombinerat med en reningsmetod för att avskilja bly från vattnet.
Trots att dessa vattenreningslösningar installeras kan vattnet i ledningsnätet komma att
försämras om vattenkvaliteten i grundvattenkällan förorenas ytterligare. Om föroreningen
beror på att grundvattenbrunnen läcker in ytvatten eller att hela grundvattenkällan är
förorenad är okänt. Är orsaken det sistnämnda behöver grundvattenkällan skyddas från
ytterligare kontaminering och om det beror på ett läckage till brunnen behöver läckaget
åtgärdas.
För att upprätthålla ett hållbart system behöver även regelbundna undersökningar göras för
att upptäcka problem snabbt och åtgärda problemen i tid. Reningslösningarna behöver även
regelbundet underhållas genom att exempelvis kontrollera att ultrafiltret inte sätts igen samt
att beläggning på UV-lampan inte uppstår och därmed försämrar desinfektionen.
I tillägg kan nämnas att mängden vatten i grundvattenkällan samt grundvattenbildningen inte
är kända. Därmed är inte det hållbara uttaget av vatten, d.v.s. den mängd vatten som kan tas
ut utan att källan riskerar att utarmas, känt. Kompletterande undersökningar behöver
genomföras för att ta reda på hur stort uttag som kan göras för att säkerställa att systemet är
hållbart, och resultaten av dessa undersökningar bör vägas in i lösningsstrategin.

vi
LIST OF ABBREVIATIONS
AC Activated Carbon
EC Electrical Conductivity
E.coli Escherichia coli
EWB Engineers Without Borders
M. avum Mycobacterum avum
MPN Most Probable Number
NF Nanofiltration
NFAS National Food Agency, Sweden
NGO Non-Governmental Organization
pH Potential of Hydrogen
RO Reverse Osmosis
UN United Nation
UNSDG United Nation Sustainable Development
Goals
UF Ultrafiltration
UV-light Ultraviolet light
UVT Ultraviolet Transmissivity

vii
CONTENTS
1 INTRODUCTION ........................................................................................................... 1
OBJECTIVE ............................................................................................................ 1
DELIMITATIONS .................................................................................................. 1
2 BACKGROUND ............................................................................................................. 2
DESCRIPTION OF THE FIELD SITE ................................................................... 2
SUSTAINABLE WATER SUPPLY ....................................................................... 2
WATER QUALITY ................................................................................................ 3
2.3.1 Microbiology .................................................................................................... 4
2.3.2 Metals and metalloids ....................................................................................... 5
2.3.3 EC and pH ........................................................................................................ 6
2.3.4 Water treatment solutions ................................................................................. 6
DESIGN OF THE WATER DISTRIBUTION SYSTEM ....................................... 9
2.4.1 Hydraulics in pipe networks ........................................................................... 10
2.4.2 Design selection .............................................................................................. 11
2.4.3 Storage effects ................................................................................................ 12
2.4.4 Protection of the water source ........................................................................ 13
3 METHOD ...................................................................................................................... 13
WATER QUALITY .............................................................................................. 13
3.1.1 Microbiology .................................................................................................. 13
3.1.2 Metals, metalloids, UV-parameters, EC, pH .................................................. 14
MODELING IN EPANET ..................................................................................... 14
3.2.1 Description of the experiment ........................................................................ 14
4 RESULTS...................................................................................................................... 23
WATER QUALITY .............................................................................................. 23
4.1.1 Microbiological, EC, pH – MAVUNO office ................................................ 23
4.1.2 Microbiological, EC, pH – Ihanda station ...................................................... 24
4.1.3 Metals and metalloids – MAVUNO office..................................................... 24
4.1.4 UV-parameters – MAVUNO office ............................................................... 25
MODELING IN EPANET ..................................................................................... 25
4.2.1 Storage tank dimensions ................................................................................. 25
4.2.2 Placement of the storage tanks ....................................................................... 25
4.2.3 Simulations of the water distribution alternatives .......................................... 27
5 DISCUSSION ............................................................................................................... 29
WATER QUALITY .............................................................................................. 29
5.1.1 Microbiology, EC, pH – MAVUNO office .................................................... 29
5.1.2 Microbiology, EC, pH – Ihanda station .......................................................... 30
5.1.3 Metals and metalloids – MAVUNO office..................................................... 30
5.1.4 UV-parameters – MAVUNO office ............................................................... 30
5.1.5 Error sources in the water quality investigation ............................................. 30
5.1.6 Selection of water treatment solutions............................................................ 32
MODELING IN EPANET ..................................................................................... 35
5.2.1 Results compared to requirements .................................................................. 35

viii
5.2.2 Deviation from the final distribution solution ................................................ 35
5.2.3 Water consumption compared to supply ........................................................ 36
DESIGN OF THE WATER DISTRIBUTION NETWORK ................................. 36
5.3.1 Source protection ............................................................................................ 36
5.3.2 Surveys and cleaning ...................................................................................... 36
SUSTAINABLE GROUNDWATER WITHDRAWAL ....................................... 37
6 CONCLUSIONS ........................................................................................................... 38
Further studies ................................................................................................................... 38
7 REFERENCES .............................................................................................................. 40
8 APPENDIX ................................................................................................................... 43
LOCATION OF THE STUDY .............................................................................. 43

1
1 INTRODUCTION The small village Chonyonyo in northwest Tanzania (see appendix 1) is sensitive to water
shortages due to its low amount of annual rain and delays in the onset of the rain period. This
threatens food supply and possibilities to maintain safe drinking water. Years 2015 – 2016 have
been particularly dry and the need for new water solutions is fundamental for providing more
people with safe drinking water.
According to the United Nations, UN (UN Water, 2014), each person is considered to require 20-
50 liters of water per day for drinking, cooking and personal hygiene while the estimated amount
of water available per person in Chonyonyo is as low as 10-20 liters (Baraka and Shwekelera,
2016). The nearest groundwater well is located in Ihanda at the office of the non-governmental
organization (NGO), MAVUNO (harvest in Swahili) which implies the 10 km long walk for
people from Chonyonyo. Instead they use water from surface water sources. This water often has
high presence of bacteria which is harmful to human health. It is usually the responsibility of
women and children to provide the family with drinking water. It takes several hours a day to
retrieve the water and gather firewood to boil the water and make it more suitable for drinking.
This sometimes jeopardizes the possibility for children to get an education.
Safe drinking water is essential to minimize the risk for waterborne diseases. Based on this
situation, consultants from Engineers Without Borders (EWB) in Malmö, Sweden started a project
in the spring of 2016 with a mission to support the area with safe drinking water by evaluating a
distribution system for establishing a sustainable water supply.
OBJECTIVE
The overall objective of this study was to establish a sustainable water supply for the village
Chonyonyo. The aim of this study was to find an optimal construction of the water distribution
system with regard to the position of storage tanks, diameter of the pipes, tank volumes, withdrawal
schedule etc. The optimal solution would be based on the minimum requirements of energy for
operation weighed with the highest possible water quality. Additionally, the study would seek to
minimize the risks for negative storage effects to occur in the distribution system. If the water was
to be contaminated, safe drinking water would be ensured by introducing water treatment
solutions. A cost efficient and reliable treatment solution with easy maintenance requirements
customized to local conditions was desired.
DELIMITATIONS
Some delimitations have been made due to technical and practical reasons with the condition that
it does not affect the results considerably
Quantification of the raw water source will not be made but it will be discussed as an
essential aspect to establish a sustainable water supply.
Selection of the distribution system material can have a substantial impact on the expected
lifetime of the system and the water quality but is have not been investigated in this study.

2
Specific product recommendations of storage tanks, pumps, pipes, fittings and control
valves for the distribution system will not be made. For the last four, neither design
recommendations will be made.
The energy used to operate the water treatment solutions was not included in the
investigation of the energy use to operate the distribution system
Water analysis of mercury was not performed in the study and have not been included
when selecting water treatment solution. Since mercury is one of the most harmful
elements to human health, even in small amounts, further analyses should be made and the
results should be weighed in the selection of the treatment solutions
2 BACKGROUND
DESCRIPTION OF THE FIELD SITE
The groundwater well at the MAVUNO office pumps up water from 130 m depth to three plastic
tanks of 15 m3 each. From there the water is transported by the force of gravity down to four outlet
taps where the water is sold to consumers in the area.
During the building process of the groundwater well at the MAVUNO office, a drilling report was
made. The report describes the type and levels of soils, borehole structure and dimensions. It also
includes results from a six-hour pumping test, which was performed to quantify water level
drawdown. Also a water quality test including physical and chemical examinations was made
(R.M.MGENI ENTERPRISES, 2015). The report does not present any data of the presence of
bacteria. However, microbiological analyses were made in the building process where sanitary
bacteria were detected in elevated amounts (Baraka and Shwekelera, 2016).
SUSTAINABLE WATER SUPPLY
The definition of sustainable development, published in the report Our Common Future is
“development that meets the needs of the present without compromising the ability of future
generations to meet their own needs”. Sustainable development consists of three dimensions:
social, environmental and economic sustainability (United Nations General Assembly, 1987).
These dimensions are closely connected and none can be neglected. Often, the development of one
of these dimensions does not go hand in hand with the development of the others. Economic and
social development may cause environmental degradation and depletion of natural resources. An
example can be exportation of garbage from Europe to Africa. This process is financially beneficial
for the villages importing the garbage since it creates jobs and money. But on the other hand, it
may cause groundwater contamination and air pollution during combustion.
An absolute definition of sustainable water supply does not currently exist. However, the concept
is closely connected to the United Nation Sustainable Development Goal (UNSDG) number 6,
Ensure availability and sustainable management of water and sanitation for all. The goal
addresses the quality and sustainability of water resources (United Nations Department of
Economic and Social Affairs, no date).
By applying the definition of sustainable development and UNSDG 6 to this study it can be divided
into the following issues:

3
o Provide an accessible water solution that ensures a long-term safe drinking water supply
o Establish a robust system with a reliable and easy maintenance procedure
o Ensure protection of the water system and the raw water source from contamination of the
external environment in order to avoid health risks
o Minimize use of energy during operation and ensure usage of renewable energy
o Take water source renewal rate into account in order to avoid depletion of the raw water
source.
o Implement a suitable number of water treatment solutions
o Establish a water distribution system which is socially and economically reasonable
This study will be focused on the above mentioned aspects when considering the distribution
alternatives. Sustainable water supply is more or less connected to all the 17 UNSDG. For example,
availability to safe and accessible drinking water operated by solar energy decreases the risk of
waterborne diseases. In addition, women and children currently need to spend several hours a day
to retrieve water and gather firewood to boil the water to make it suitable for drinking. Instead the
children can go to school and after school do their homework. Women will have more time and
improved chances of entering the labor market. This scenario relates to the UNSGD, good health
and well-being, quality education, gender equality, affordable and clean energy, industry,
innovation and infrastructure and sustainable cities and communities (United Nations Department
of Economic and Social Affairs, no date).
WATER QUALITY
To maximize the expected lifetime of the system comprehensive actions are required to maintain
the water quality parameters below drinking water limits. Classification of the quality is essential
to select and implement suitable solutions and thereby ensure the consumer safe drinking water.
The classification of the drinking water quality would be based on the regulations of drinking
water, presented by the National Food Agency, Sweden (NFAS). The regulations apply to drinking
water processes with a daily production of 10 m3 or more alternatively processes which supply
more than 50 people a day. The regulations apply regardless if the process is a commercial or
public operation (National Food Agency, Sweden, 2015).
The quality regulations are mentioned in 7 and 8 § in NFAS (2015). 7 § reads:
The drinking water should be healthy and clean. It is considered to be healthy and
clean if it
does not contain microorganisms, parasites or substances in an amount that
constitutes a risk to human health, and
fulfills the quality requirements in annex 2, section A and B (LIVSFS 2015:3)
(National Food Agency, Sweden, 2015)
The water quality requirements in NFAS (2015) are based on the type of water service, depending
on how the water is distributed and used. They are presented in 8 § and are categorized as type (a)
– (e).

4
8 § reads, for:
a) out-going drinking water from a water treatment plant: after completed water treatment
before the water is distributed
b) drinking water supplied from a distribution system: at a point in a property or facility,
with water withdrawal from outlet taps, usually used as drinking water
c) drinking water supplied from tanks: at a point where the water is taken out from the tank
d) drinking water used by food producing companies: at a point where the water is used,
and
e) drinking water taped on bottles or container intended for sales: at the point the water is
taped on bottles or containers
The distribution alternatives used in this study are of type b) drinking water supplied from a
distribution system: at a point in a building or facility, where water is taken out from taps, usually
used as drinking water. This is because the length of the distribution system is large and then the
risk for creation of a biofilm in the system is high (National Food Agency, Sweden, 2015).
It is of great importance that analyses are performed on a regular basis to have current data of the
water quality. At detection of abnormal values, possible reasons are leakage of sanitation elements
in the pipe system, contamination of the water source or insufficient cleaning procedures. Hence,
the reasons of contamination need to be examined and if it cannot be solved, measures are needed
such as cleaning and further treatment.
The 9 - 14 §, Surveys etc. in NFAS (2015) present regulations of regular surveys and minimum
frequency of sampling and analysis depending on the water-service. The survey is divided into
normal and extended examination of drinking water.
2.3.1 Microbiology
The microbiological quality of the water was classified by measurements of total coliform
bacteria, Escherichia coli (E.coli) and Enterococcus. The presence of these bacteria reflects the
sanitary quality of the water and acts as indicators when classifying the drinking water. E.coli and
Enterococcus are indicators of contamination from warm blooded animals feces while total
coliform bacteria indicate contamination but not necessarily of fecal origin (National Food
Agency, Sweden, 2015). The number of total coliform bacteria, E-coli and Enterococcus classifies
the raw water type and is related to recommended amounts of microbiological safety barriers
needed (Table 1), based on the guidance for drinking water in NFAS (2014), presented by NFAS.
The function of microbiological safety barriers is to separate or disinfect the water from possible
micro-biological contamination.

5
Table 1. Type of raw water and requirements of minimum amounts of microbiological safety barriers compared to
the presence of bacteria. The numbers of bacteria in the table is the presence found in a 100 ml sample. Table from
NFAS (2014b)
Raw water type Unaffected
groundwater
Groundwater
affected by
surface water
Surface water and
Groundwater affected
by surface water
E.coli or Enterococcus Not
detectable
Not
detectable
1 - 10
> 10
Coliform bacteria Not
detectable
1 - 10 10 - 100
> 100
Minimum number of barriers One1
One in
preparedness2
One Two Three
1Public facilities under the act (2006:412) on public water services producing >400 m3 drinking water a day. 2All
other facilities which are presented by the regulation.
2.3.2 Metals and metalloids
Another important aspect when classifying the water quality is the presence of metals and
metalloids. The heavy metals lead (Pb), mercury (Hg), cadmium (Cd) and the metalloid arsenic
(As) are particularly toxic to human health, even in small amounts. These elements can cause
diseases such as cancer, reduced development and growth, damage on bone structures and organs
(Hutton, 1987). Other metals which are harmful to humans are chromium (Cr), copper (Cu) and
nickel (Ni). Cr and Cu are essential for humans but can be harmful in elevated amounts. Cr, Cu
and Ni can cause diseases as skin and eye irritations, damage on kidneys, liver, lungs and blood
cells (Tepe, 2014). The water quality requirements for these elements in the regulations of drinking
water in NFAS (2015), are listed in Table 2.
6
Table 2. Water quality requirements for heavy metals and metalloids due to the regulations of drinking water in NFAS
(2015). ”-” means that requirements not exist in the regulation
Parameter Requirement for unusable
at the sampling point
(unit)
-
Outgoing drinking water and
drinking water at the user
(8 § a, b, c, d)
Requirement for usable with
remark at the sampling point
(unit)
-
Drinking water at the user or
package drinking water
(8 § b, c, d, e)
Arsenic (As) 10 (µg/l) -
Cadmium (Cd) 5.0 (µg/l) -
Chromium (Cr) 50 (µg/l) -
Copper (Cu) 2.0 (mg/l) 0.2 (mg/l)
Lead (Pb) 10 (µg/l) -
Mercury (Hg) 1.0 (µg/l) -
Nickel (Ni) 20 (µg/l) -
2.3.3 EC and pH
Electrical Conductivity (EC) indicates the ionic activity in the water and thereby the capacity to
transmit a current. EC-values under 0.3 µS/cm are defined as distilled water. If the EC-value is
above 500 µS/cm, contamination of the groundwater is suspected. Values up to 2000 µS/cm are
considered to be safe to use for irrigation. Water with a higher value than 2500 µS/cm is not
advised to be consumed by humans (Geochemical Atlas of Europe, 2006). EC is linearly related
to total dissolved solids (TDS), which indicates dissolved inorganic salts and small amounts of
dissolved organic matter. Relevant compounds inorganic salts include calcium, magnesium,
potassium, sodium, bicarbonate, chloride and sulfate. (World Health Organization, 2011)
It is also of great importance to measure the pH in the water. The pH-value effects the solubility
and toxicity of metals including heavy metals and deviating values can damage and corrode pipe
network materials (World Health Organization, 2003, 2011). Also, a particularly high or low pH-
value has adverse effects on human eyes, skin and mucous membranes (World Health
Organization, 2003). According to the requirements in NFAS (2015) a pH-value higher than 10.5
is categorized as unusable and a value below 7.5 or above 9 is categorized as usable with remark
(National Food Agency, Sweden, 2015).
2.3.4 Water treatment solutions
If the water quality parameters are detected in elevated levels, measures are required to ensure safe
drinking water. If an improvement cannot be reached by protecting the source or by installing
internal technical solutions in the pipe system, a water treatment solution is needed.
The 15 - 20 § in NFAS (2015) present measures to be taken if the water quality requirements, are
not achieved. Examples are the producers’ responsibility to inform the consumers about the
situation and rapidly determine the possible cause and implement measures. The producer is also
required to have updated and current water quality data available to the public.

7
There are some aspects that need to be considered before deciding an appropriate treatment
solution. I will call them water treatment aspects and is based on Philip McCleaf’s, Process
Engineer at Uppsala Water, own experience. These aspects are the quality of the raw water source,
quantity of the raw water source, intended water use (drinking, irrigation or industry), volume of
water required, generated waste products of treatment operation and the defined requirements
(McCleaf, 2017).
To simplify maintenance and minimize the generated waste products of the treatment operation,
chemical treatment solutions would be avoided if possible when selecting water treatment
solutions. Exclusion of chemical treatment solution also avoids continuous dependence of process
chemicals. In addition, treatment solutions which require large treatment chambers or long process
time would be excluded if possible.
Microbiological safety barriers
3 §, Treatment and distribution in NFAS (2015) points out that consideration of negative effects
on the water quality in the distribution system is needed. So called microbiological safety barriers
should be implemented to be able to manage possible microbiological contamination. The function
of a barrier is to separate or disinfect harmful bacteria. If the water treatment will consist of two
or more barriers, a combination of separation and disinfection treatment is desired and gives best
possible effect. Approved microbiological safety barriers are listed in Table 3. To be counted as a
primary disinfection the reduction must be 99 percent or more (National Food Agency, Sweden,
2014).
Table 3. Approved microbiological safety barriers (National Food Agency, Sweden, 2014)
Type Method
Artificial infiltration of surface water
(less than 14 days)
Chemical precipitation with subsequent
filtration
Separation Slow sand filtration
Membrane pore width ≤ 100 nm (0,1 µm)
Ultrafiltration (UF) (10 – 100 nm)
Nanofiltration (NF) (1-3 nm)
Reverse osmosis (RO) (< 3 nm)
Disinfection
Primary disinfection (≥ 99% reduction)
Chlorine, (except chloramine and for
parasites)
Chlorine dioxide (except for parasites)
Ozone
UV-light

8
Artificial infiltration of surface water (less than 14 days) works in such a way that surface water
filtrates through the soil profile. The soil profile needs to have an unsaturated zone, at least 1 m
above the groundwater level, this to have an effective separation of microorganisms during the
artificial filtration. If no unsaturated zone exists in the soil profile the residence time needs to be
sufficient long. During a chemical precipitation with subsequent filtration a flocculate substance,
as aluminum sulfate, is added to the water during a mixing process. The substance and the mixing
process make particles in the water to form bigger colonies. In a later step, the colonies settle to
the bottom and separate from the water. During a slow sand filtration process the water filtrates
through a profile with layers of different thickness and sand of different fraction and pore sizes
(National Food Agency, Sweden, 2014). Membrane filter with a pore size equal to or larger than
0,1 µm (ultrafiltration, nanofiltration and reserve osmosis) is another microbiological safety barrier
which separate elements when the water pass through the membrane pores by pressure, so called
transmembrane pressure. The smaller pore size the higher transmembrane pressure is needed
(Bergman, Garcia-Aleman and Morgan, 2012; National Food Agency, Sweden, 2014). Primary
disinfection (chlorine, chlorine dioxide, ozone and UV-light) is a disinfection process which
inactivate the harmful effects of the microorganisms to a level equal to or higher than 99 percent
(National Food Agency, Sweden, 2014).
The presence of the total coliform bacteria, E.coli and Enterococcus determine the minimum
number of microbiological safety barriers needed to improve the quality to a suitable level (Table
1). If the water analyses indicate no presence of the listed bacteria the source is often unaffected
groundwater and only one microbiological barrier is needed. If E.coli or Enterococcus are detected
at least two barriers are necessary to improve the quality to a suitable level.
EC, pH, metals and metalloids
If EC, pH, metals or metalloids are detected in elevated levels measures are required. Abnormal
pH-values can be stabilized by adding an acid or base to the solution. Alternative solutions are
membrane filtration and ion exchange. The value of EC can decrease by reverse osmosis (RO)
processes or electrodialysis (Bergman, Garcia-Aleman and Morgan, 2012). To separate heavy
metals from the water a common water treatment solution is RO or activated carbon (AC) filter
(Samuelsson, 2017).
UV-parameters
Ultra violet light (UV-light) can be used as a water treatment solution and is classified as a
disinfection microbiological (National Food Agency, Sweden, 2014). It is relatively easy to
implement, operate and is a non-chemical treatment solution which avoids a dependence on
external resources such as chemicals. In order for UV-light to be a suitable solution, some limits
need to be met (Table 4). If these limits are fulfilled, UV-light can be used without pretreatment
(Vattensystem, no date).

9
Table 4. Limits for UV-light to be used as a water treatment solution without pretreatment (Vattensystem, no date)
Concern Constituent Required values
Disinfection Performance Turbidity < 5 NTU, < 1 preferred
Total Suspended Solids (TSS) < 5 mg/l
Iron < 0.3 mg/l
Fouling Potential Manganese < 0.5 mg/l
Hardness (CaCO3) < 120 mg/l 1
UVT10 >75 %
pH 6-9 1 Another company recomends a hardness limit of <200 mg/l, but 120 mg/l will be used according to the precautionary
principle.
A high turbidity and Total Suspended Solids (TSS) and dissolved organics have a shadowing effect
on the bacteria since particles absorb and scatter the UV-light which increase the UV absorbance.
If there are too many particles shielding the UV-rays to reach the bacteria it results in a deteriorated
disinfection effect. Particles can also scatter the UV-light, including backscattering the light
toward the incident light source and thereby reduce the intensity. The same principle can be applied
for UV Transmissivity, UVT10; the higher the levels of particles, the lower the UVT. The value
of UVT10 presents the percentage of light at the wavelength of 254 nm that passes through a 10
mm wide cuvette (Swaim, Cotton and Linden, 2012). Compared to TDS which counts all the
particles smaller than 2 micron, TSS counts all particles larger than 2 microns. Another factor
which makes the UV-light lose its effect to inactivate the bacteria is fouling of the lamp surfaces.
The fouling decreases the UV-dose the lamps generate to the water. Thereby the UV-dose must
increase or the cleaning intervals be more frequent for the UV-light process to be disinfection
efficient. Fouling potential parameters are pH, lamp temperature, hardness and certain inorganic
constituents such as iron and manganese which have a property to deposit on surfaces. Fouling
typically causes by compounds with low solubility or compounds that are less soluble as
temperature increases such as calcium carbonate. A solution to this problem can be to turn off the
UV-lights during non-operating hours (Swaim, Cotton and Linden, 2012).
DESIGN OF THE WATER DISTRIBUTION SYSTEM
To establish a sustainable water supply, the expected lifetime of the system needs to be maximized.
By selecting a suitable distribution material and design, protecting the source, avoiding risks for
negative storage effects, avoiding occurrence of negative pressure and internal damage, the
expected lifetime age can be substantially improved. On this basis it is of great importance to
optimize the design to ensure a long-term safe drinking water supply.
A water distribution system consists of a pipeline network with one or several storage tanks to
balance the supply and demand and taps for outlet. Fittings and valves are used to connect the
pipes and direct the water. The water is pumped from a raw water source, in this case a groundwater
source. The pipe network can have one or several water treatment solutions connected to the
system to improve water quality before consumption.

10
2.4.1 Hydraulics in pipe networks
Water in a pressurized water distribution system possesses three types of energy: kinetic energy
(due to the water´s movement), potential energy (due to elevation) and pressure energy (due to
internal pressure). These three components build up the total energy, called total head. Kinetic
energy is expressed by the velocity head, potential energy by the elevation head and internal
pressure by the pressure head. All head parameters have the unit meter. The fluid movement
through a pipe network includes a frictional force from the pipe wall. This results in loss in velocity
head and is called friction head loss (de Vera, 2012). The head loss can be computed by the Hazen-
Williams, Darcy-Weisbach or Chezy-Manning formula. Darcy-Weisbach friction head loss
formula is the most theoretically accurate and can be seen in Equation 1 (Liou, 1998; Brown,
2003).
ℎ𝑓 = 𝑓𝐷𝐿
𝐷
𝑉2
2𝑔 (Equation 1)
ℎ𝑓 – friction head loss, 𝑓𝐷 – Darcy-Weisbach friction factor, L – pipe length, D – hydraulic (inner)
pipe diameter, V – average flow velocity, g – acceleration of gravitation (Pipe Flow Software, no
date).
The Darcy-Weisbach friction factor is a complex function related to the Reynolds number and the
relative roughness. It can be determined by the Moody diagram or more accurately by the
Colebrook equation.
The relative roughness is dependent on the absolute roughness and the hydraulic diameter by the
relation in Equation 2.
𝑟 =𝑘
𝑑ℎ (Equation 2)
k – absolute roughness, hd – hydraulic diameter (Pipe Flow Software, no date)
Another important factor in pipe hydraulics is total head. The total head in a distribution network
should not be unnecessary high (over 70 head m) for the system to work properly since it can result
in the cracking and brakeage of pipes. Furthermore, it should not be too low since situations which
give occurrence to negative pressure in pipes should be highly avoided (Ainsworth, 2004).
Negative pressure occurs in the pipe system when the pressure is below the atmospheric pressure.
In order to prevent pollution in the external environment from entering and contaminating the
water, the pressure of the system must be kept above atmospheric pressure. This is also necessary
in order to avoid hydraulic problems (Törneke, 2016). A measure to reduce the risk of
contamination from the external environment is installation of so-called “no return” valves in the
pipes which prevents the water to internally flow backwards. It is especially important to install
them right after the source to avoid the risk to contaminate the water source. If midway taps exist
in the distribution system, installation right after those is also necessary (Ainsworth, 2004).
11
2.4.2 Design selection
Reservoirs
Reservoirs are needed to balance the demand and supply since the outflow and inflow in the
distribution system are not consistent. It is also needed in case of temporary breakdowns.
Reservoirs can be underground, surficial or elevated (de Vera, 2012). To minimize the risks of
contamination, elevated ones are generally preferred. In contrast to surficial or underground
reservoirs, the risk of leakage of polluting substances from surface water will be close to negligible
for elevated tanks. Disadvantages with elevated reservoirs are that they require higher pressure in
the system and thereby a higher pump capacity. In addition, elevated tanks are more vulnerable to
damage during conflicts. From a hydraulic perspective, positioning a storage tank at the most
elevated point is motivated to avoid negative pressure. Also, the shape of the reservoir has a large
impact in terms of minimizing contamination and negative storage effects. It is reasonable to
assume that a cylindrical reservoir with a mixing propeller is preferred to a cubic or rectangular
one because of the risks of particles to settle in corners.
Other measures that will improve the water quality, is to place the water outlet slightly above the
bottom of the tank, see Figure 1. Then the deposits sink to the bottom and will not reach the outlet.
To further avoid deposits reaching the outlet, the bottom of the tank should be sloping in the
direction of the drain to enable removal of
deposits from the tank (Figure 1) (Brikké
and Bredero, 2003). Even a vent pipe is
necessary to avoid negative pressure from
occurring during filling and emptying the
tank. But the ventilation needs to be
constructed so that rain, surface water or
insects cannot enter the tank. The tank also
needs an inspection hole in the upper part
of the tank when there is a need of
renovation, cleaning or controls. In turn, it
needs to be covered to avoid entrance of
animal feces, other pollutants and sun rays
which can result in growth of algae (de
Vera, 2012).
Figure 1. A grounded tank where the bottom of the tank is
sloping in the direction of the drain (Brikké and Bredero,
2003)
12
Instead of a controller monitoring
the water level so that the tank
will not overflow, a float valve
can regulate the water level by
opening the overflow hatch when
the water have reached a specific
height (Figure 2). This solution is
preferable since it is not in need
of any electric device (Brikké and
Bredero, 2003). The overflow
can be connected to a larger
collection vessel for people to use
for washing, water for animals
etc. However, there is a risk that
people will consume this water
instead because the price is lower
or free and people may think the
quality is good enough.
2.4.3 Storage effects
Deterioration of water quality due to storage in tanks is called storage effects. The extent of storage
effects is related to the incoming raw water quality and possible contamination entering from the
external environment. Low raw water quality and extensive contamination can result in formation
of biofilms on the internal surfaces of the distribution system (Ainsworth, 2004).
It is important to be reminded that the water transported to the consumers does not need to be of
excellent quality standard or even free from bacteria, but the supply of organic and inorganic
nutrients determines the rate of bacterial growth. The multiplication of harmful microorganisms
like fungi, protozoa and worms is driven by the availability of nutrients. Another important
microbial growth factor is high temperature, 15 degrees or more increases the microbial activity
considerably. An additional factor is pH, but most microorganisms survive at values normally
found in drinking water. Most bacteria forming biofilms are harmless, but exceptions do occur.
This includes Legionella and Mycobacteium avum (M. avium). Both of them are founded in piped
distribution systems. Legionella multiplies fast in warm water and big colonies could be found in
water heaters, hot tubs and shower heads. If they appear in a hospital environment they can cause
nosocomial infection. M. avium is a complex group of bacteria highly resistant to disinfections and
can cause diseases in immunocompromised patients. Yet, all bacteria forming a biofilm have effect
on odor, taste and color of the water (Ainsworth, 2004; Payment and Robertson, 2004)).
Figure 2. Elevated reservoir of type fill and draw. A float valve regulate
the water level by opening the overflow when the water have reached a
specific height (de Vera, 2012)
13
2.4.4 Protection of the water source
To maintain safe drinking water over a long time an investigation to establish a protection of the
raw water source is a prerequisite. The water quality of a source can substantially influence the
expected lifetime of the system and how much future measures will be needed. A low quality of
the water source requires more treatment solutions and more frequent cleaning in order to minimize
negative storage effect. Especially in rural areas, where the possibility to introduce water treatment
solutions are few or in many cases cannot be applied at all. If the source turns out to be
contaminated, the producer should prioritize to determine the cause and implement solutions
immediately (Ainsworth, 2004; Payment and Robertson, 2004).
3 METHOD
WATER QUALITY
In this study, microbiological and metal/metalloid analyses, and measurements of EC and pH were
performed to classify the quality of the water from the groundwater well at the MAVUNO office.
In addition, several analyses of turbidity, Total Suspended Solids (TSS), iron, manganese,
hardness, pH and UVT10 were performed to investigate if UV-light could be used as a suitable
water treatment solution. These water samples were collected from the outlet taps connected to the
groundwater well at the MAVUNO office. The microbiological parameters and measurements of
EC and pH were analyzed multiple times between the 23th and 27th of September 2016. The
remaining analyses were made once and the water samples were taken the 30th of October 2016.
Additional water analyses from the groundwater source at Ihanda station were performed, located
in a valley nearby the groundwater well at the MAVUNO office. These results could give an idea
if the groundwater well at the MAVUNO office and the source at Ihanda station belong to the same
aquifer. A similar result between them could indicate that they belong to the same, potentially
contaminated, aquifer. The microbiological parameters and measurements of EC and pH were
analyzed multiple times between the 3th and 13th of October 2016.
Since the distribution process, according to 2 §, Application, would have a daily production of 10
m3 or more and/or supply more than 50 people with drinking water, it would apply to the drinking
water regulations in NFAS (2015).
The results were analyzed and classified in accordance to the drinking water quality regulations in
NFAS (2015) and possible water treatment solutions were determined.
3.1.1 Microbiology
The microbiological quality of the water was classified by measurements of total coliform
bacteria, E.coli and Enterococcus. Several water analyses were performed to give an average value
and to comprise outliers. The method used to determine the presence of bacteria was the most
probable number (MPN) method. MPN is a probability method which estimates bacteria in a
sample, with upper and lower 95% confidence range. The method is widely used, especially in
sanitary bacteriology, to detect bacteria in feces, water, milk and food in general (Sutton, 2010).
The estimation of bacteria was done by dissolving a reagent, either Enterolert*-E or Colilert*-18,
into a 100 ml sample by shaking the bottle. Enterolert* detects the presence of Enterococcus and
Colilert*-18 detects total coliform bacteria and E.coli. The reagent consists of a nutritional powder
14
which gives maximum growth of the considered bacteria. The sample was poured in a sterile tray
of model Quanti-Tray/2000 consisting of 48 small and 49 large cells and inserted in an incubator.
The incubator was set to a temperature which would maximize the growth of the considered
bacteria, 41±0.5ᵒC for Enterolet*-E and 35±0.5ᵒC for Colilert*-18. The set temperature is the air
temperature in the incubator. The temperature of the water when filling up the samples was in the
interval 22.3-22.8ᵒC. After a limited time, 24 hours for Enterolet*-E and 18 hours for Colilert*-
18, the experiment was completed. The last step was to count the number of positive small and
large cells and thereby determine the number of bacteria, based on the MPN table in the laboratory
manual (IDEXX Laboratories, no date). The analyses was not always performed right after
sampling and were thereby stored before analysis. In these cases the samples were stored inside
the office, not in daylight, in a temperature of around 25-30 degrees.
3.1.2 Metals, metalloids, UV-parameters, EC, pH
The UVT10 analysis was performed by the analysis company ALcontrol Laboratories. The other
UV-parameters and the metal/metalloid analyses were performed by the geochemical laboratory
at the Swedish University of Agriculture Sciences (SLU). Both laboratories used methods
accredited by Swedac ISO / IEC 17025 to detect these parameters (Sonesten, 2016). pH and EC
were determined in the field, by the measuring instruments pHep®4-tester and EC+TDS-tester
manufactured by the company Hanna instruments (Hanna instruments, 2016a, 2016b).
Measurements of pH and EC were made three times at each analysis and an average value was
determined.
In the metal/metalloid analyses eleven metals and metalloids were detected including some of the
most harmful ones: lead, arsenic and cadmium. Also the metals chromium, copper and nickel were
observed. Although the harmful metal mercury was not measured. All eleven elements from the
analyses are not included in the regulation of drinking water quality in NFAS (2015). This is
because they are not considered as harmful or have not shown any toxic evidence.
MODELING IN EPANET
To model the distribution system the software EPANET, version 2.00 was used. It is a free
hydraulic and water quality analysis program, developed by US Environmental Protection Agency.
EPANET consists of a pipe network built up by nodes, tanks, pumps, valves and reservoirs. The
program has features which simulate water quality throughout the pipe system, pressures at the
nodes, age and heights of the water in the tanks. EPANET is based on hydraulic equations with
capabilities to model frictional head loss (Hazen- Williams, Darcy-Weisbach or Chezy-Manning
formula), energy use and costs and various withdrawal patterns with different shapes on tanks,
with constant or variable pump frequencies (Rossman, 2000). EPANET can also simulate when,
where and how negative pressure occur in the distribution system (Ainsworth, 2004).
3.2.1 Description of the experiment
The aim of the modeling in EPANET was to investigate two water supply alternatives (Figure 3),
in order to estimate which one that would be the most appropriate considering energy use for
operation and water residence time in the storage tank. Minimum requirement of energy is
motivated since the distribution alternatives would be operated by solar panels which could only
produce energy during a limited number of hours a day. Lowest possible water residence time in
15
the storage tank is motivated since storage can result in negative effects in the water system such
as formation of biofilms which can deteriorate the water quality.
Two distribution alternatives was suggested as possible solutions by EWB and MAVUNO to
supply the villagers in Chonyonyo with water. Alternative 1 consists of a 10 km distribution system
from the already existing groundwater well at the MAVUNO office to the City-tap in Chonyonyo.
Alternative 2 consists of a 3.5 km distribution system from the most neighboring valley to
Chonyonyo, where no groundwater well exists today. The latter alternative has considerable higher
altitude difference. If distribution alternative 1 would be the most appropriate solution an
investigation need to be done of eventual effects of an extension of the water withdrawal from the
groundwater well at MAVUNO. Both alternatives would be powered by solar panels. Solar energy
from the current panels can only be used to operate the system on average six hours a day according
to Joseph Baraka, water technician at the MAVUNO (Baraka and Shwekelera, 2016). Hence, the
same number of hours was used in this study.
To define an optimal water distribution solution, a prerequisite was to describe the external
condition for both alternatives. This includes defining water withdrawal, operation hours and
determine if a water withdrawal from the groundwater well at MAVUNO office is possible without
affecting the current withdrawal at MAVUNO office. Further, input parameters such as position,
elevation and dimension of storage tanks and pipes were input to the model. It also includes a
description of the withdrawal pattern for the water outlet and other modelling conditions such as a
suitable simulation time. The output parameters which EPANET simulates need to meet a couple
of design requirements in order to not give any considerably negative impact on the hydraulics in
the pipe system and minimize the risk of negative storage effects.
The pressure in each junction for the prescribed water withdrawal could be simulated in EPANET.
The pressure in the junction “groundwater well” corresponds to the pressure which the
groundwater pump needs to operate the distribution system. On the other hand, how high effect
the pump needs to have to distribute the prescribed water withdrawal and thereby the energy use
and solar power needed.
External conditions
If distribution alternative 1 was to be selected as the most appropriate alternative, a desire from
MAVUNO is to install a couple of taps connected to the distribution system, TAP 1 and 2, to
facilitate the access to water withdrawal for people living between the MAVUNO office and
Chonyonyo. The outlet taps would be connected to storage tanks to fill up water when the outflow
rate of water is below the inflow rate.

16
Figure 3. Illustration of the water distribution alternatives in EPANET where green line represents alternative 1 and
red line represents alternative 2
To determine a suitable distribution system, surveying of the area was required. Distances and
elevations were determined by tracking the connecting roadway every 10th m, with a GPS (Figure
4). The pipeline would be buried next to the road to simplify the process during reparation or
replacement.
Figure 4. Tracking every 10th m from the MAVUNO office (cerise line) versus Valley (light purple line) to
Chonyonyo. Scale is missing in the map but a square in the map is about 1 km2 since the light purple line is 3.5 km
and the cerise line is 10 km, Google Earth
17
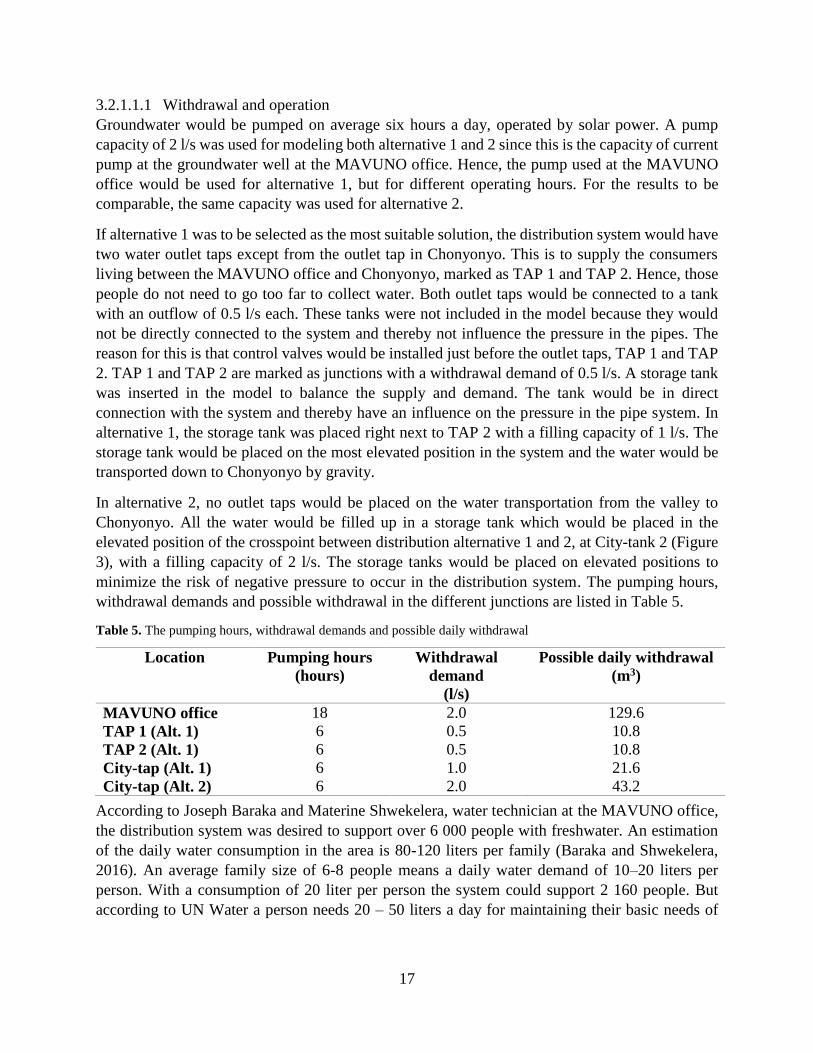
3.2.1.1.1 Withdrawal and operation
Groundwater would be pumped on average six hours a day, operated by solar power. A pump
capacity of 2 l/s was used for modeling both alternative 1 and 2 since this is the capacity of current
pump at the groundwater well at the MAVUNO office. Hence, the pump used at the MAVUNO
office would be used for alternative 1, but for different operating hours. For the results to be
comparable, the same capacity was used for alternative 2.
If alternative 1 was to be selected as the most suitable solution, the distribution system would have
two water outlet taps except from the outlet tap in Chonyonyo. This is to supply the consumers
living between the MAVUNO office and Chonyonyo, marked as TAP 1 and TAP 2. Hence, those
people do not need to go too far to collect water. Both outlet taps would be connected to a tank
with an outflow of 0.5 l/s each. These tanks were not included in the model because they would
not be directly connected to the system and thereby not influence the pressure in the pipes. The
reason for this is that control valves would be installed just before the outlet taps, TAP 1 and TAP
2. TAP 1 and TAP 2 are marked as junctions with a withdrawal demand of 0.5 l/s. A storage tank
was inserted in the model to balance the supply and demand. The tank would be in direct
connection with the system and thereby have an influence on the pressure in the pipe system. In
alternative 1, the storage tank was placed right next to TAP 2 with a filling capacity of 1 l/s. The
storage tank would be placed on the most elevated position in the system and the water would be
transported down to Chonyonyo by gravity.
In alternative 2, no outlet taps would be placed on the water transportation from the valley to
Chonyonyo. All the water would be filled up in a storage tank which would be placed in the
elevated position of the crosspoint between distribution alternative 1 and 2, at City-tank 2 (Figure
3), with a filling capacity of 2 l/s. The storage tanks would be placed on elevated positions to
minimize the risk of negative pressure to occur in the distribution system. The pumping hours,
withdrawal demands and possible withdrawal in the different junctions are listed in Table 5.
Table 5. The pumping hours, withdrawal demands and possible daily withdrawal
Location Pumping hours
(hours)
Withdrawal
demand
(l/s)
Possible daily withdrawal
(m3)
MAVUNO office 18 2.0 129.6
TAP 1 (Alt. 1) 6 0.5 10.8
TAP 2 (Alt. 1) 6 0.5 10.8
City-tap (Alt. 1) 6 1.0 21.6
City-tap (Alt. 2) 6 2.0 43.2
According to Joseph Baraka and Materine Shwekelera, water technician at the MAVUNO office,
the distribution system was desired to support over 6 000 people with freshwater. An estimation
of the daily water consumption in the area is 80-120 liters per family (Baraka and Shwekelera,
2016). An average family size of 6-8 people means a daily water demand of 10–20 liters per
person. With a consumption of 20 liter per person the system could support 2 160 people. But
according to UN Water a person needs 20 – 50 liters a day for maintaining their basic needs of

18
drinking, cooking and cleaning (UN Water, 2014). With a daily consumption of 50 liter per person,
the system could supply less than 870 people with water.
3.2.1.1.2 Extension of the water withdrawal (Alternative 1)
If distribution alternative 1 was to be the most suitable distribution solution an extension of the
withdrawal from the existing groundwater well is required. To determine if a water withdrawal
from the groundwater well at MAVUNO office is possible without affecting the current
withdrawal at MAVUNO office, the current water consumption from the well was investigated.
The water withdrawal from the groundwater well is manually noted sales statistics and has been
done by registration of the water volumes sold. The statistics is presented in Figure 5.
Figure 5. Daily water withdrawal from the groundwater well at MAVUNO office
The average withdrawal from the groundwater well at MAVUNO office during the period 1st of
July to 31th of December 2016 was 16.3 m3 water a day, excluding the days without data. During
days without data no observations of the withdrawal were made. The highest value was 55.7 m3.
The possible withdrawal from the groundwater well at MAVUNO office, if considering
distribution alternative 1, was 129.6 m3 a day (2 l/s during 18 hours of pumping). This indicates
that a daily extension of withdrawal of 43.2 m3 (2 l/s during 6 hours), see Table 5, for further
distribution to Chonyonyo is fully possible without effecting the water consumption at MAVUNO
office. As seen in the Figure 5 the withdrawal was higher from July to the end of September and
lower from October to the end of December. This is because of the dry and rain season. The
consumption of water from the well for drinking, cooking and irrigation was higher during the dry
season which ended in October and lower during the rainy season. During the rain season people
try to fetch their own water by filling up own buckets with rainwater. Since both the dry and the
rain season was represented in the statistics during approximately the same length of time, it gave
a credible minimum, maximum and average value.
0
10
20
30
40
50
60
2016-07-01 2016-08-01 2016-09-01 2016-10-01 2016-11-01 2016-12-01
Vo
lum
e (
m3)
Date
Water consumption - groundwater well, MAVUNO office

19
Input parameters
Input parameters are required for EPANET to compute output. In this case these input parameters
were absolute roughness, length and diameter of pipes, heights of nodes, withdrawal pattern,
simulation time and also dimension, shape, placement and elevation of storage tanks. The pumping
hours and water withdrawal demands from Table 5 were also input parameters in the model.
3.2.1.2.1 Absolute roughness
Absolute roughness, e, is related to the material of the pipes. A higher value of absolute roughness
results in higher head loss (equation 1). Polyethene (PE) have been chosen as pipe material for
modeling in this study. The roughness value for a new PE-pipe, transporting water of high quality,
is 0.0015 mm (Pipe Flow Software, no date). However, since the turbidity is high and the effect
of local losses need to be taken into account the roughness increases. Also the age of the
distribution system increases the value of roughness. On the other hand, it is reasonable to assume
that for very long pipes the effect of local losses is relatively small. A more reasonable value could
be 0.2 and this value has been chosen for this study (Törneke, 2016). This number is based on
Krister Törneke’s, Investigator in Water at the consulting firm Tyréns, own experience from
working with modeling in EPANET. This value may result in a little bit overrated friction head
loss but 0.2 would still be used according to the precautionary principle.
3.2.1.2.2 Length of pipes
The length of the pipes in the distribution system was measured by a GPS and the dimensions are
presented in Figure 6.
Figure 6. Length of pipes (meters) in the distribution system, illustrated in EPANET

20
3.2.1.2.3 Heights of nodes
The heights of nodes in the distribution system was measured by a GPS and the heights are
presented in Figure 7.
Figure 7. Heights of nodes (meters) in the distribution system, illustrated in EPANET
3.2.1.2.4 Elevation, dimension and shape of the storage tanks
Since the storage tanks would be elevated to minimize the risk of contamination the tanks would
be placed a few meters above ground level. An elevation of 4 m for each tank has been chosen
because it gives a margin to the ground and does not give an unnecessary high pressure.
The residence time in the storage tanks should be
minimized in order to minimize the risk for negative
storage effects in the distribution system. It is mainly the
difference between the bottom of the storage tank and the
minimum water level in the tank that determines the
residence time since this volume would not be utilized.
An illustration of this phenomenon is presented by Figure
10. It illustrates that a smaller difference between the
bottom of the tank and the minimum level results in a
lower residence time in the tank. The optimal minimum
water level would have been 0 m, it would have given the
lowest possible residence time. However, there has to be
a reserve volume of water in the tank so that the tank
would not turn empty. With this requirement in mind the
minimal water level was set to 0.5 m. The initial water level does not affect the simulation in any
considerable way but was set to 1 m above the minimum water level. Hence, the minimal water
level would be 0.5 m and the initial water level would be 1.5 m for the storage tanks in both
distribution alternatives.
Figure 10. Illustration of how the water
residence time in the storage tank depends on
the minimum level of the water. The right
tank has a higher minimum level and thereby
a higher water residence time in the storage
tank

21
Storage tank dimensions were determined by trial and error in EPANET in order to find suitable
dimensions to lower the water residence time in the storage tanks. The shape of the tank was
determined to be cylindrical according to the theory.
3.2.1.2.5 Placement of the storage tanks
The placement of the storage tanks was determined by trial and error in EPANET to find a
placement which balance the supply and demand without occurrence of negative pressure in the
distribution system.
3.2.1.2.6 Withdrawal pattern
To adjust the model based on the circumstances in the water consumption the withdrawal pattern
was described. The withdrawal from the City-tap in Chonyonyo would not be constant during the
day. The transportation of water from the wells to the storage tanks, City-tank 1 and 2, would be
constant during the operating hours. The tanks would be filled up 6 hours a day operated by solar
power but the withdrawal demand from the City-tap would vary. An approximation of the
withdrawal pattern was described by Baraka & Shwekelera (2016). A realistic pattern was a higher
withdrawal demand from 7 am until 12 noon and a decrease of consumers until 3 pm when the
consumption increases again until 6 pm. The modeling would assume the withdrawal pattern
illustrated in Figure 8. Since this figure reflect the demand pattern for both distribution alternatives,
peak demand factor was 4 and minimum demand factor was 0 (Baraka and Shwekelera, 2016).
Figure 8. The daily withdrawal pattern from the City-tap in Chonyonyo, performed in EPANET (Baraka and Shwekelera, 2016).
The average withdrawal during a whole day is 0.25 l/s
22
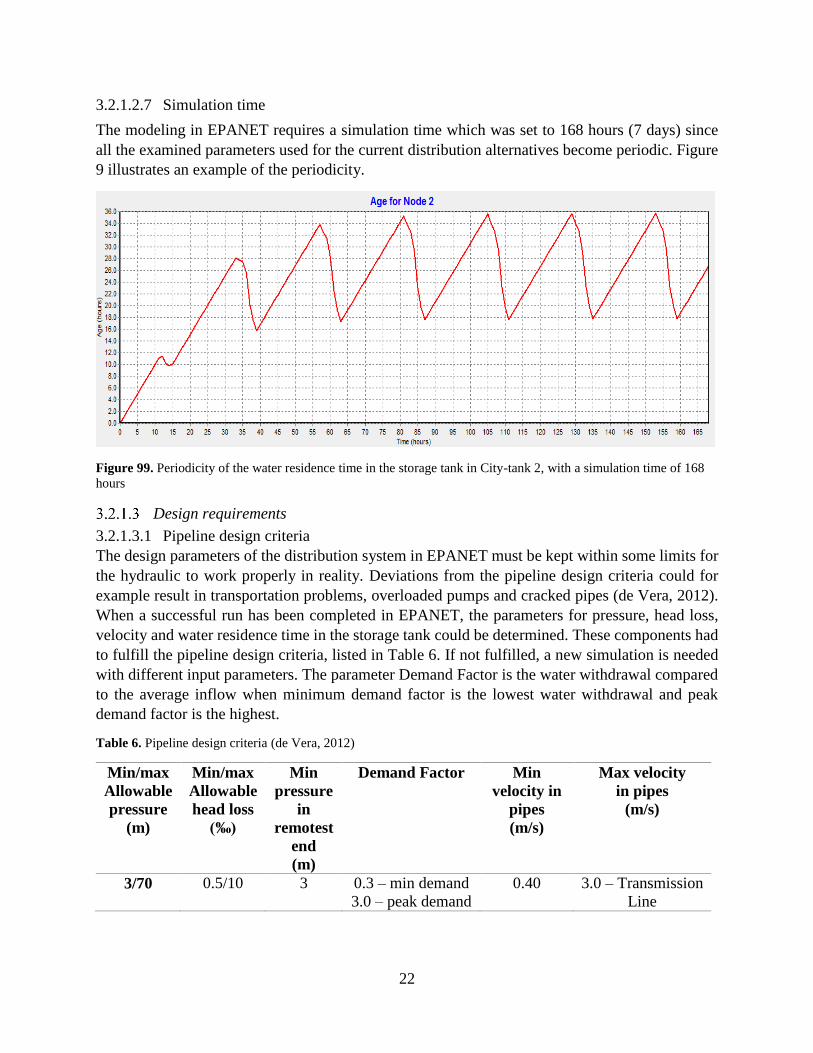
3.2.1.2.7 Simulation time
The modeling in EPANET requires a simulation time which was set to 168 hours (7 days) since
all the examined parameters used for the current distribution alternatives become periodic. Figure
9 illustrates an example of the periodicity.
Figure 99. Periodicity of the water residence time in the storage tank in City-tank 2, with a simulation time of 168
hours
Design requirements
3.2.1.3.1 Pipeline design criteria
The design parameters of the distribution system in EPANET must be kept within some limits for
the hydraulic to work properly in reality. Deviations from the pipeline design criteria could for
example result in transportation problems, overloaded pumps and cracked pipes (de Vera, 2012).
When a successful run has been completed in EPANET, the parameters for pressure, head loss,
velocity and water residence time in the storage tank could be determined. These components had
to fulfill the pipeline design criteria, listed in Table 6. If not fulfilled, a new simulation is needed
with different input parameters. The parameter Demand Factor is the water withdrawal compared
to the average inflow when minimum demand factor is the lowest water withdrawal and peak
demand factor is the highest.
Table 6. Pipeline design criteria (de Vera, 2012)
Min/max
Allowable
pressure
(m)
Min/max
Allowable
head loss
(‰)
Min
pressure
in
remotest
end
(m)
Demand Factor Min
velocity in
pipes
(m/s)
Max velocity
in pipes
(m/s)
3/70 0.5/10 3 0.3 – min demand
3.0 – peak demand
0.40 3.0 – Transmission
Line

23
3.2.1.3.2 Diameter of the pipes
The dimension used in the modeling needs to follow the standard sizes for pipes. The dimensions
which were of interest for these simulations were found by trial and error in EPANET. For the
given distribution system these were an outer pipe diameter of 63, 75, 90 and 110 mm. PE-pipes
of model PE80, pressure category P10 was used for modeling. P10 could handle a pressure of 100
m which has a good margin to the allowed maximum pressure of 70 m (VA Specialen, no date).
If another pipe material would be selected the standard dimensions of the pipes are more or less
equal.
3.2.1.3.3 Other requirements
The size of the tanks had to be at least ¼ of the daily inflow since the outflow from the system
most likely would not be constant (de Vera, 2012). In addition, the residence time in the storage
tanks should be minimized in order to minimize the risk of negative storage effects.
4 RESULTS
WATER QUALITY
4.1.1 Microbiological, EC, pH – MAVUNO office
The analysis results of microbiological parameters, EC- and pH-values, from the outlet taps at the
MAVUNO office, are listed in Table 7.
Table 7. Detected presence of total coliform bacteria, E.coli, Enterococcus and values of EC and pH in the 100 ml
water samples from the outlet taps at the MAVUNO office. For each sample only either Total coliform bacteria and
E.coli or Enterococcus could be detected
Date Storage time
before
analysis
Numbers of
Total
coliform
bacteria
Numbers
of
E.coli
bacteria
Numbers of
Enterococcus
bacteria
EC
(µS/cm)
pH
Sample 1
(2016-09-23)
0 h 55.4 <1 688 6.3
Sample 2
(2016-09-25)
0 h 344.8 9.8 695 6.8
Sample 3
(2016-09-27)
0 h 55.7 <1 706 6.8
Sample 4
(2016-09-27)
24 h 40 min <1 706 6.8
The results showed similar numbers of total coliform bacteria and E.coli for Sample 1 and 3,
around 50 coliform bacteria and no occurrences of E.coli. Sample 2 had an outlying value, almost
350 coliform bacteria and 9.8 E.coli bacteria. The result from Sample 4 showed no presence of
Enterococcus. The average value for pH was determined to 6.6 and the average value for EC was
696 µS/cm. In all cases no odor or abnormal color were observed.

24
4.1.2 Microbiological, EC, pH – Ihanda station
The quality result from Ihanda station is presented in Table 8.
Table 8. Detected presence of total coliform bacteria, E.coli, Enterococcus and values of EC and pH in the 100 ml
water samples from the outlet taps at Ihanda station. The symbol “-“ stands for no data. For each sample only either
Total coliform bacteria and E.coli or Enterococcus could be detected
Date Storage
time before
analysis
Numbers of
Total
coliform
bacteria
Numbers
of
E.coli
bacteria
Numbers of
Enterococcus
bacteria
EC
(µS/cm)
pH
Sample 1
2016-10-03
48 h <1 - -
Sample 2
2016-10-05
96 h 344.8 <1 - -
Sample 3
2016-10-13
0 h >2419.6 - 405 5.8
For Sample 3 the presence of E.coli could not be detected since the UV-lamp which is needed for
detection of E.coli bacteria broke.
4.1.3 Metals and metalloids – MAVUNO office
Detected values of the metal analyses from the groundwater well at MAVUNO office are present
in Table 9.
Table 9. Detected values of metals/metalloids from the water analyses of the groundwater well at the MAVUNO
office. The water samples were taken the 30th of October 2017
Parameter Detected concentration
(unit)
Arsenic (As) 0.8 (µg/l)
Cadmium (Cd) 0.13 (µg/l)
Chromium (Cr) 0.04 (µg/l)
Cobalt (Co) 1.5 (µg/l)
Copper (Cu) 0.07 (mg/l)
Lead (Pb) 9.5 (µg/l)
Nickel (Ni) 7.2 (µg/l)
Silicon (Si) 4.7 (mg/l)
Vanadium (V) 0.06 (µg/l)
Zinc (Zn) 0.27 (mg/l)

25
4.1.4 UV-parameters – MAVUNO office
The detected values for the UV-parameters and requirements for using UV-light as a water
treatment solution without pretreatments are present in Table 10.
Table 10. Detected values for the UV-parameters and requirements to use UV-light as a treatment solution without
pretreatment (Vattensystem, no date). The water samples were taken the 30th of October 2017
Concern Constituent Detected value
(unit)
Disinfection performance Turbidity 0.41 (NTU)
Total Suspended Solids (TSS) 1.2 (mg/l)
Iron 0.003 (mg/l)
Manganese 0.021 (mg/l)
Fouling potential Hardness (CaCO3) 89.9 (mg/l)
UVT10 95 (%)
MODELING IN EPANET
4.2.1 Storage tank dimensions
After simulating in EPANET a suitable dimension of the storage tanks were determined by trial
and error. For alternative 1 a suitable dimension was an initial water level of 1.5 m, minimum
water level of 0.5 m, maximal level of 2.2 m and a diameter of 3 m. This gave a reserve volume
of 3.6 m3. A suitable dimension for alternative 2 was an initial water level of 1.5 m, minimum
water level of 0.5 m, maximal level of 2.6 m and a diameter of 3.8 m. This gave a reserve volume
of 5.7 m3. In both cases a higher maximum level in the tanks did not affect the unutilized volume
but it increased the residence time. Hence, a minimization of the maximal level is motivated to
lower the residence time. For both alternatives, a lower maximum level or lower diameter resulted
in negative pressure in the distribution system.
As mentioned in the method there is a rule of thumb that the storage tank should be at least ¼ of
the daily inflow. This would result in a storage tank volume of at least 5.4 m3 for alternative 1 and
10.8 m3 for alternative 2. These criteria were fulfilled since the inflow volume capacity for
alternative 1 is 12 m3 and for alternative 2 it is almost 24 m3, based on the dimensions determined
above.
4.2.2 Placement of the storage tanks
A first idea was to connect the storage tank to the City-tap in the same way City-tank 1 was
connected to TAP 2, for both distribution alternatives. The position is marked with a disconnected
tank right by the City-tap in Figure 3. It seemed practical to connect the storage tank close to the
City-tap in Chonyonyo, but this placement solution caused, when simulating the alternatives in
EPANET, negative pressure in the pipes for both distribution alternatives. Figure 11 presents a
profile graph of the pressure at the different positions in the distribution system for alternative 1,
after 12 hours of operation. When the storage tank was connected to City-tap negative pressure
occurs before, after and in between TAP 1 and the crosspoint between distribution alternative 1
and 2, down to -10.49 m. In this case, negative pressure occurs when water was pumped from a

26
low elevated position and passes a peak-elevated point and down to a lower elevated point with no
tanks in between to balance the pressure. The same effect applies for alternative 2.
It is important to clarify that the pressure theoretically could sink to large negative values, thus a
value of -9.8 m is under atmospheric pressure but it could not be maintained in reality. It would
result in air entering the distribution pipes and limiting the flow. By then the negative pressure
values EPANET simulates is not maintained in reality, EPANET has no lowest limitation for water
pressure.
Figure 10. The occurrence of negative pressure in the pipes for alternative 1 when the storage tank is placed in the
remotest end, connected to City-tap, after 12 hours of operation. Observe that the distances in the figure do not
correspond to the real length dimensions, but are only schematic
Because of the occurrence of negative pressure when connecting the storage tank to the City-tap
the tank would be connected to the distribution system at the elevated points. For alternative 1 the
tank would be connected to TAP 2 and for alternative 2 the tank would be connected to the
crosspoint between distribution alternative 1 and 2, at City tank 2 (Figure 3). These distribution
solutions counteract negative pressure to occur in the distribution system. In both situations the
water from the storage tanks would be transported to the outlet taps at Chonyonyo by the gravity.
Figure 12 illustrates the profile graph of the pressure in the pipes after 12 hours of operation for
alternative 1, with the storage tank connected to TAP 2. These placements of the storage tanks
would not gave occurrence of negative pressure in the distribution system. The same phenomenon
applies for alternative 2.
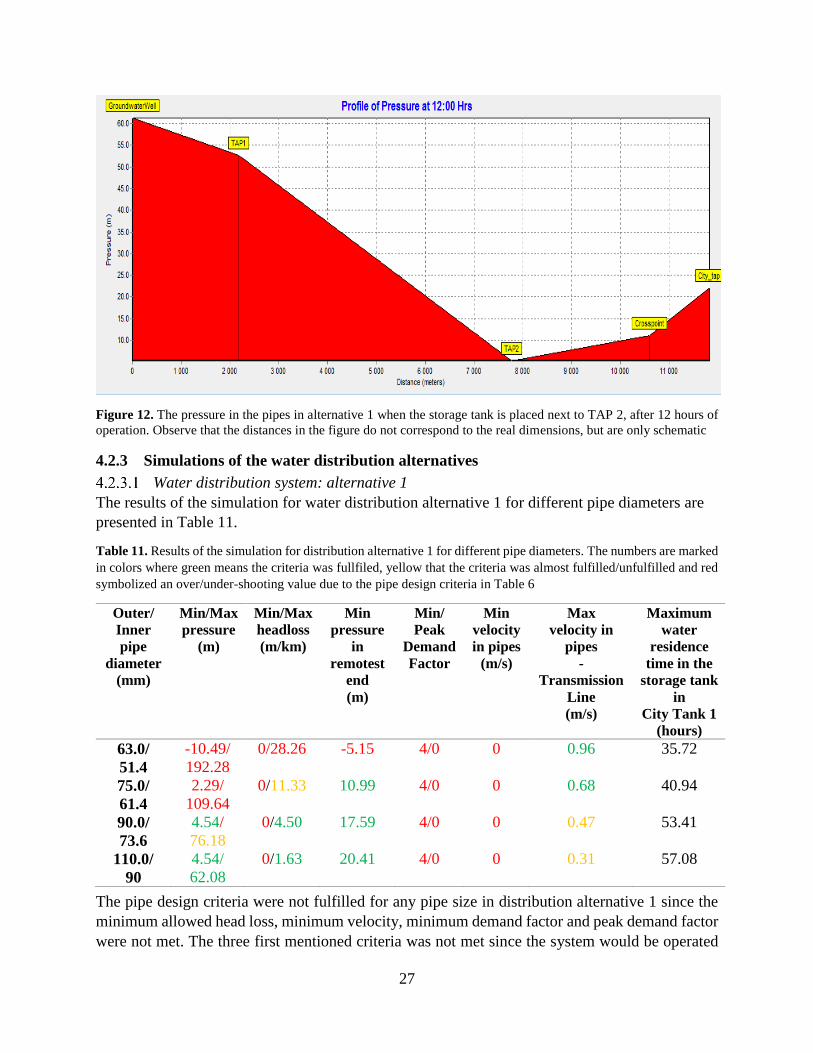
27
Figure 12. The pressure in the pipes in alternative 1 when the storage tank is placed next to TAP 2, after 12 hours of
operation. Observe that the distances in the figure do not correspond to the real dimensions, but are only schematic
4.2.3 Simulations of the water distribution alternatives
Water distribution system: alternative 1
The results of the simulation for water distribution alternative 1 for different pipe diameters are
presented in Table 11.
Table 11. Results of the simulation for distribution alternative 1 for different pipe diameters. The numbers are marked
in colors where green means the criteria was fullfiled, yellow that the criteria was almost fulfilled/unfulfilled and red
symbolized an over/under-shooting value due to the pipe design criteria in Table 6
Outer/
Inner
pipe
diameter
(mm)
Min/Max
pressure
(m)
Min/Max
headloss
(m/km)
Min
pressure
in
remotest
end
(m)
Min/
Peak
Demand
Factor
Min
velocity
in pipes
(m/s)
Max
velocity in
pipes
-
Transmission
Line
(m/s)
Maximum
water
residence
time in the
storage tank
in
City Tank 1
(hours)
63.0/
51.4
-10.49/
192.28
0/28.26 -5.15 4/0 0 0.96 35.72
75.0/
61.4
2.29/
109.64
0/11.33 10.99 4/0 0 0.68 40.94
90.0/
73.6
4.54/
76.18
0/4.50 17.59 4/0 0 0.47 53.41
110.0/
90
4.54/
62.08
0/1.63 20.41 4/0 0 0.31 57.08
The pipe design criteria were not fulfilled for any pipe size in distribution alternative 1 since the
minimum allowed head loss, minimum velocity, minimum demand factor and peak demand factor
were not met. The three first mentioned criteria was not met since the system would be operated
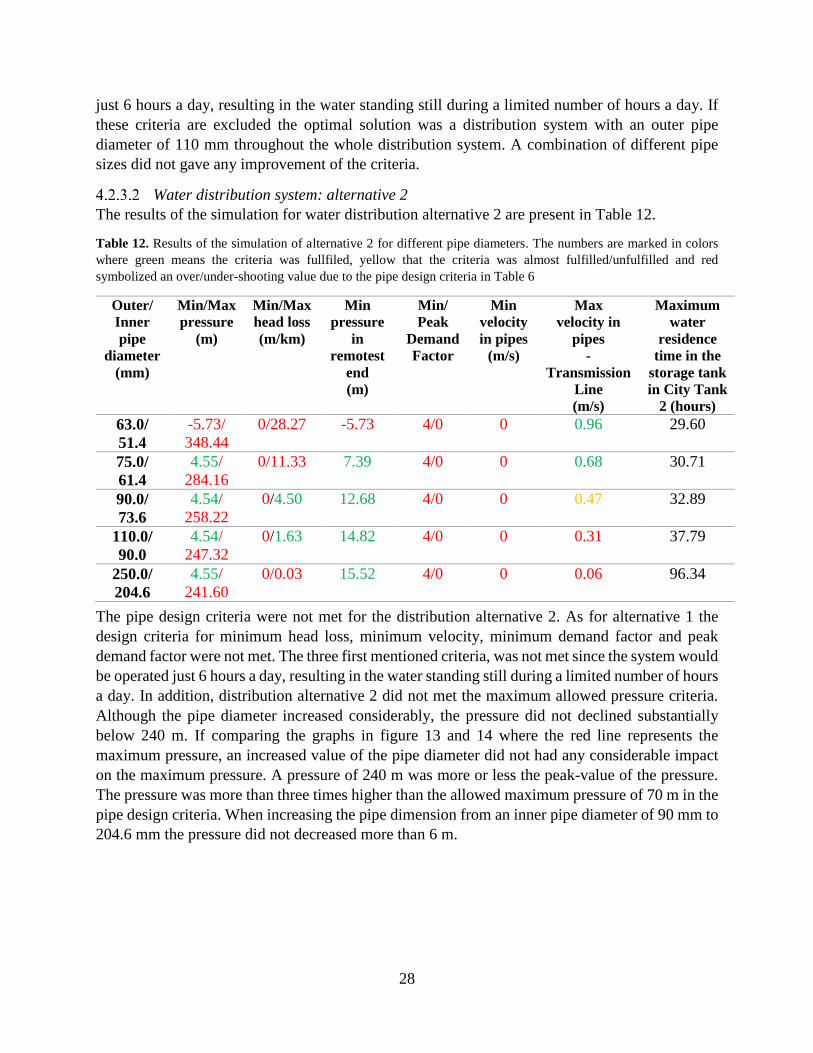
28
just 6 hours a day, resulting in the water standing still during a limited number of hours a day. If
these criteria are excluded the optimal solution was a distribution system with an outer pipe
diameter of 110 mm throughout the whole distribution system. A combination of different pipe
sizes did not gave any improvement of the criteria.
Water distribution system: alternative 2
The results of the simulation for water distribution alternative 2 are present in Table 12.
Table 12. Results of the simulation of alternative 2 for different pipe diameters. The numbers are marked in colors
where green means the criteria was fullfiled, yellow that the criteria was almost fulfilled/unfulfilled and red
symbolized an over/under-shooting value due to the pipe design criteria in Table 6
Outer/
Inner
pipe
diameter
(mm)
Min/Max
pressure
(m)
Min/Max
head loss
(m/km)
Min
pressure
in
remotest
end
(m)
Min/
Peak
Demand
Factor
Min
velocity
in pipes
(m/s)
Max
velocity in
pipes
-
Transmission
Line
(m/s)
Maximum
water
residence
time in the
storage tank
in City Tank
2 (hours)
63.0/
51.4
-5.73/
348.44
0/28.27 -5.73 4/0 0 0.96 29.60
75.0/
61.4
4.55/
284.16
0/11.33 7.39 4/0 0 0.68 30.71
90.0/
73.6
4.54/
258.22
0/4.50 12.68
4/0 0 0.47 32.89
110.0/
90.0
4.54/
247.32
0/1.63 14.82 4/0 0 0.31 37.79
250.0/
204.6
4.55/
241.60
0/0.03 15.52 4/0 0 0.06 96.34
The pipe design criteria were not met for the distribution alternative 2. As for alternative 1 the
design criteria for minimum head loss, minimum velocity, minimum demand factor and peak
demand factor were not met. The three first mentioned criteria, was not met since the system would
be operated just 6 hours a day, resulting in the water standing still during a limited number of hours
a day. In addition, distribution alternative 2 did not met the maximum allowed pressure criteria.
Although the pipe diameter increased considerably, the pressure did not declined substantially
below 240 m. If comparing the graphs in figure 13 and 14 where the red line represents the
maximum pressure, an increased value of the pipe diameter did not had any considerable impact
on the maximum pressure. A pressure of 240 m was more or less the peak-value of the pressure.
The pressure was more than three times higher than the allowed maximum pressure of 70 m in the
pipe design criteria. When increasing the pipe dimension from an inner pipe diameter of 90 mm to
204.6 mm the pressure did not decreased more than 6 m.
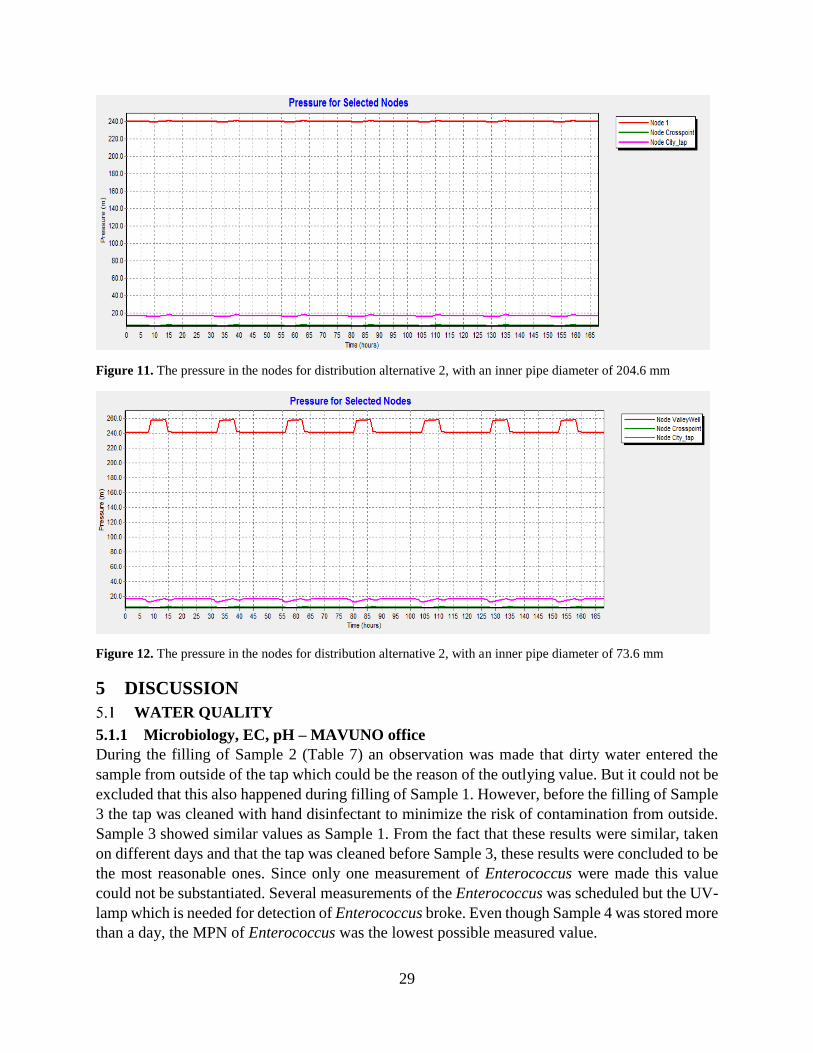
29
Figure 11. The pressure in the nodes for distribution alternative 2, with an inner pipe diameter of 204.6 mm
Figure 12. The pressure in the nodes for distribution alternative 2, with an inner pipe diameter of 73.6 mm
5 DISCUSSION
WATER QUALITY
5.1.1 Microbiology, EC, pH – MAVUNO office
During the filling of Sample 2 (Table 7) an observation was made that dirty water entered the
sample from outside of the tap which could be the reason of the outlying value. But it could not be
excluded that this also happened during filling of Sample 1. However, before the filling of Sample
3 the tap was cleaned with hand disinfectant to minimize the risk of contamination from outside.
Sample 3 showed similar values as Sample 1. From the fact that these results were similar, taken
on different days and that the tap was cleaned before Sample 3, these results were concluded to be
the most reasonable ones. Since only one measurement of Enterococcus were made this value
could not be substantiated. Several measurements of the Enterococcus was scheduled but the UV-
lamp which is needed for detection of Enterococcus broke. Even though Sample 4 was stored more
than a day, the MPN of Enterococcus was the lowest possible measured value.

30
According to section A, I. Microbiological parameters in NFAS (2015) the water was classified
as unusable since the presence of total coliform bacteria was more than 10 in the 100 ml water
sample (Table 1). If comparing the presence of total coliform bacteria, E.coli and Enterococcus
with the minimum amounts of microbiological safety barriers required (Table 1), three barriers
were required in this case. But after neglecting the outlying value from Sample 2, it was concluded
that only two microbiological safety barriers were needed. The analyses indicate that the
groundwater was probably affected by surface water and was classified as unusable according to
NFAS (2014).
The pH-value was slightly lower than desired and became categorized as usable with remark
according to NFAS (2015). The EC-value was detected in non-harmful levels, neither for irrigation
nor for human consumption (Geochemical Atlas of Europe, 2006).
5.1.2 Microbiology, EC, pH – Ihanda station
The results from Sample 2 and 3 in Table 8 were not similar to each other, the presence of total
coliform bacteria differed considerably. Even if the tap was cleaned with disinfectant before filling
of Sample 3 to minimize the risk of contamination from outside, the value was higher than for
Sample 2. Since there was no consistence in the result, the result could not be ensured. More water
quality data are required to obtain a satisfying basis. A reason for the results could be the
differences in storage time before analysis. The storage can affect the measurement results but
Roger Herbert, Senior lecturer in hydrology at Uppsala University thinks that there is a small
probability that the bacteria concentration could have decreased (Herbert, 2016). If the storage
time would have had an impact on the result a higher value of bacteria would be expected, but in
this case the opposite happened. Since there was no consistence in the result from Ihanda (Table
8) or neither similarities nor differences between the results from MAVUNO office (Table 7) and
Ihanda station (Table 8) one could not conclude that they belong to the same aquifer.
Since only one measurement of pH and EC was made these values could not be substantiated.
5.1.3 Metals and metalloids – MAVUNO office
When the metal/metalloid analyses from Table 9 were compared to the regulations of drinking
water quality (Table 2), NFAS (2015), the detected concentrations of all the elements were lower
than the requirements. The concentration of cadmium, chromium and copper were all under 4 %
of the unusable value. But the concentration of arsenic, nickel and lead were 8 %, 36 % and 95 %
of the unusable values. Hence, lead almost exceeded the limit for unusable presence.
5.1.4 UV-parameters – MAVUNO office
When comparing the results of the UV-parameters from Table 10 with the requirements in Table
4, all of the parameters met the requirements to use UV-light as a treatment solution without
pretreatment.
5.1.5 Error sources in the water quality investigation
The microbiological water quality results were based on data from just a few water samples,
sometimes just one. Because of this, conclusions have been based on an uncertain basis. In the
cases the results from the same source have been correlated and sampled different days the results

31
have been concluded to be reasonable. More data would have been desired to give a more certain
result.
Before the measurements of pH and EC, neither the instrument pHep®4-tester nor EC+TDS-tester
were calibrated. This could have affected the results of the pH- and EC-analyses.
The water samples may have been contaminated during the analysis and thereby given incorrect
results and conclusions. When analyzing the water quality of the groundwater source at the
MAVUNO office one of the samples had an evidently outlying value. An observation was made
that dirty water entered the sample from outside of the tap. Contamination from the external
environment could be the reason of the outlying value. The presence of E.coli in the outlying
sample probably came from the external environment. If the outlying value was a result of external
contamination the routines during the withdrawal could have a great impact on the quality of the
water the consumers receive. This motivates a review of the routines during withdrawal. Improved
routines during withdrawal may be both easier to implement and result in a larger improvement of
the water quality than trying to improve the raw water quality and protect the raw water source
from contamination. Contact between the water outlet taps and the external environment should
be avoided at all cost.
During the microbiological water analysis the samples were inserted in an incubator on a set
temperature to maximize the growth of the considered bacteria: 41±0.5ᵒC during 18 hours for
detection of E.coli and total coliform bacteria and 35±0.5ᵒC during 24 hours for detection of
Enterococcus. The temperature of the water when filling up the samples were in the interval 22.3-
22.8ᵒC and this temperature increased during storage time since the external air temperature was
higher than that. Shutdowns occurred both day and night on a regular basis during the analysis
which may have affected the result of the water quality. Just a few minutes of shutdown decreases
the temperature rapidly by several degrees. Shutdown during the day was usually observed and
rapidly fixed. This was not fixed as fast during the night. A shorter period of incubation may have
affected a less presence of bacteria since a lower temperature results in lower growth of the
considered bacteria.
Another error source could be the effect of storage of the microbiological analysis samples. In the
laboratory at the MAVUNO office a few samples were stored more than a day, one up to 96 hours.
No relationship between the storage time and the quality results have been noticed in this study.
According to Herbert (2016) the storage can affect the measured results. But as mentioned, if the
storage time would have had an impact on the result a higher value of bacteria would be expected,
but in this case the opposite happened, as for Sample 2 in comparison with Sample 3 in Table 8.
Based on this fact no detection of considered bacteria during extended storage time have been
concluded to be accurate data. An example of this statement is the microbiological quality results
from Sample 4 (Table 7) from MAVUNO office and Sample 1 (Table 8) at Ihanda station.
Water samples were taken to Sweden for analyses of metals/metalloids and UV-parameters. They
were stored about two weeks before analyzing and this could have had an impact on the water
results. Christian Demandt, Laboratory Manager at Laboratory of Geochemistry at Swedish
University of Agricultural Science said that the risk that the storage have had a significant impact
on the result in this case is low. Metal/metalloids are not affected by storage while turbidity and

32
TSS could be affected. According to the accreditation of the analytical laboratory in charge,
Laboratory of Geochemistry at Swedish University of Agricultural Science, TSS should not be
stored more than two weeks and turbidity should be analyzed immediately. Longer storage could
have made the particles to flocculate in a higher extent and thereby result in an elevated value. On
the other hand, the laboratory have years of experience of samples matrices and concentration
range for these parameters, for example reanalyzes of samples after couple of months show that,
since the levels of both turbidity and TSS were low Demandt does not think the results could have
been affected in any significantly degree (Demandt, 2017).
5.1.6 Selection of water treatment solutions
As mentioned in the background, some aspects need to be considered before deciding a suitable
water treatment solution, the so called water treatment aspects (page 7). These aspects, except the
quantity of the raw water source, have been taken into account when selecting the water treatment
solution in this project. This is because the volume of the raw water source is unknown and it has
not been determined in this study. Therefore the quantity has not been taken into consideration
when selecting the water treatment solutions. But the quantity of the raw water source is important
to investigate and its result should be considered in the choice of treatment solution.
The intended water use is drinking water and the defined requirements of the water quality are
found in the regulations of drinking water in NFAS (2015). The analyses identified the quality of
the raw water source and it showed that the groundwater was probably affected by surface water.
According to the regulations at least two microbiological safety barriers are required to improve
the microbiological water quality to a suitable level for drinking (National Food Agency, Sweden,
2014). The water analyses also showed relatively high concentrations of lead, but still under
reference values. Since lead is one of the most harmful elements for the human health even in
small amounts measures are highly necessary to decrease the concentration of lead.
As mentioned in the background, if two microbiological safety barriers are required to improve
the microbiological quality of the water, one separation and one disinfection solution are preferable
and gives the best possible effect.
Separation barrier
Since chemical treatment should be avoided if possible chemical precipitation with subsequent
filtration was excluded as a water treatment solution in this work. Also slow sand filtration and
RO was excluded since they require large treatment chambers and the process time is long.
Regarding RO, it requires extensive maintenance, technical advance processes and the installation
and operation is costly which makes this alternative less appropriate to apply in this project. RO
also requires a high quality of the water, otherwise the pores risk to clog since the membrane pore
size is small (Bergman, Garcia-Aleman and Morgan, 2012).
Of the separation barriers, ultrafiltration (UF) with a prefilter was selected as the most suitable
water treatment solution due to the water treatment aspects. UF separate particles up to 0.01 um
like bacteria, giardia, cryptosporidium, colloids and viruses (Bergman, Garcia-Aleman and
Morgan, 2012). To use UF as a treatment solution the presence of iron should be less than 0.3 mg/l
and hardness less than 120 mg/l. In addition, manganese is required to be less than 0.05 mg/l and
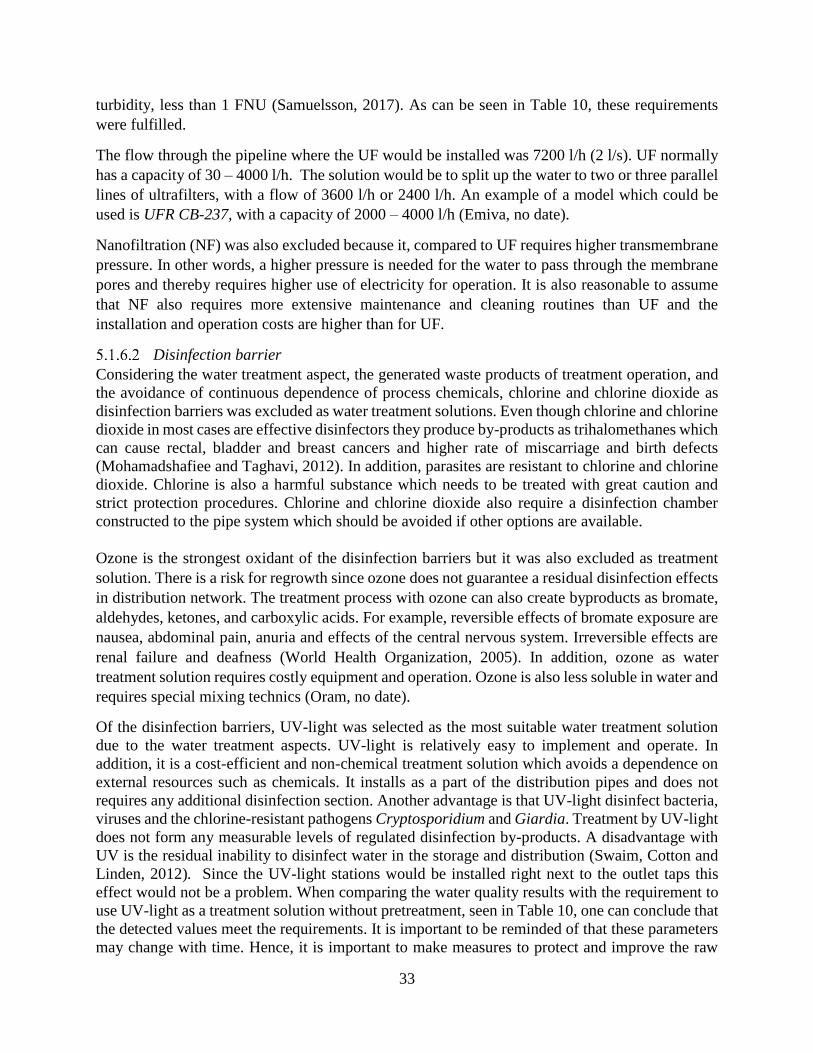
33
turbidity, less than 1 FNU (Samuelsson, 2017). As can be seen in Table 10, these requirements
were fulfilled.
The flow through the pipeline where the UF would be installed was 7200 l/h (2 l/s). UF normally
has a capacity of 30 – 4000 l/h. The solution would be to split up the water to two or three parallel
lines of ultrafilters, with a flow of 3600 l/h or 2400 l/h. An example of a model which could be
used is UFR CB-237, with a capacity of 2000 – 4000 l/h (Emiva, no date).
Nanofiltration (NF) was also excluded because it, compared to UF requires higher transmembrane
pressure. In other words, a higher pressure is needed for the water to pass through the membrane
pores and thereby requires higher use of electricity for operation. It is also reasonable to assume
that NF also requires more extensive maintenance and cleaning routines than UF and the
installation and operation costs are higher than for UF.
Disinfection barrier
Considering the water treatment aspect, the generated waste products of treatment operation, and
the avoidance of continuous dependence of process chemicals, chlorine and chlorine dioxide as
disinfection barriers was excluded as water treatment solutions. Even though chlorine and chlorine
dioxide in most cases are effective disinfectors they produce by-products as trihalomethanes which
can cause rectal, bladder and breast cancers and higher rate of miscarriage and birth defects
(Mohamadshafiee and Taghavi, 2012). In addition, parasites are resistant to chlorine and chlorine
dioxide. Chlorine is also a harmful substance which needs to be treated with great caution and
strict protection procedures. Chlorine and chlorine dioxide also require a disinfection chamber
constructed to the pipe system which should be avoided if other options are available.
Ozone is the strongest oxidant of the disinfection barriers but it was also excluded as treatment
solution. There is a risk for regrowth since ozone does not guarantee a residual disinfection effects
in distribution network. The treatment process with ozone can also create byproducts as bromate,
aldehydes, ketones, and carboxylic acids. For example, reversible effects of bromate exposure are
nausea, abdominal pain, anuria and effects of the central nervous system. Irreversible effects are
renal failure and deafness (World Health Organization, 2005). In addition, ozone as water
treatment solution requires costly equipment and operation. Ozone is also less soluble in water and
requires special mixing technics (Oram, no date).
Of the disinfection barriers, UV-light was selected as the most suitable water treatment solution
due to the water treatment aspects. UV-light is relatively easy to implement and operate. In
addition, it is a cost-efficient and non-chemical treatment solution which avoids a dependence on
external resources such as chemicals. It installs as a part of the distribution pipes and does not
requires any additional disinfection section. Another advantage is that UV-light disinfect bacteria,
viruses and the chlorine-resistant pathogens Cryptosporidium and Giardia. Treatment by UV-light
does not form any measurable levels of regulated disinfection by-products. A disadvantage with
UV is the residual inability to disinfect water in the storage and distribution (Swaim, Cotton and
Linden, 2012). Since the UV-light stations would be installed right next to the outlet taps this
effect would not be a problem. When comparing the water quality results with the requirement to
use UV-light as a treatment solution without pretreatment, seen in Table 10, one can conclude that
the detected values meet the requirements. It is important to be reminded of that these parameters
may change with time. Hence, it is important to make measures to protect and improve the raw
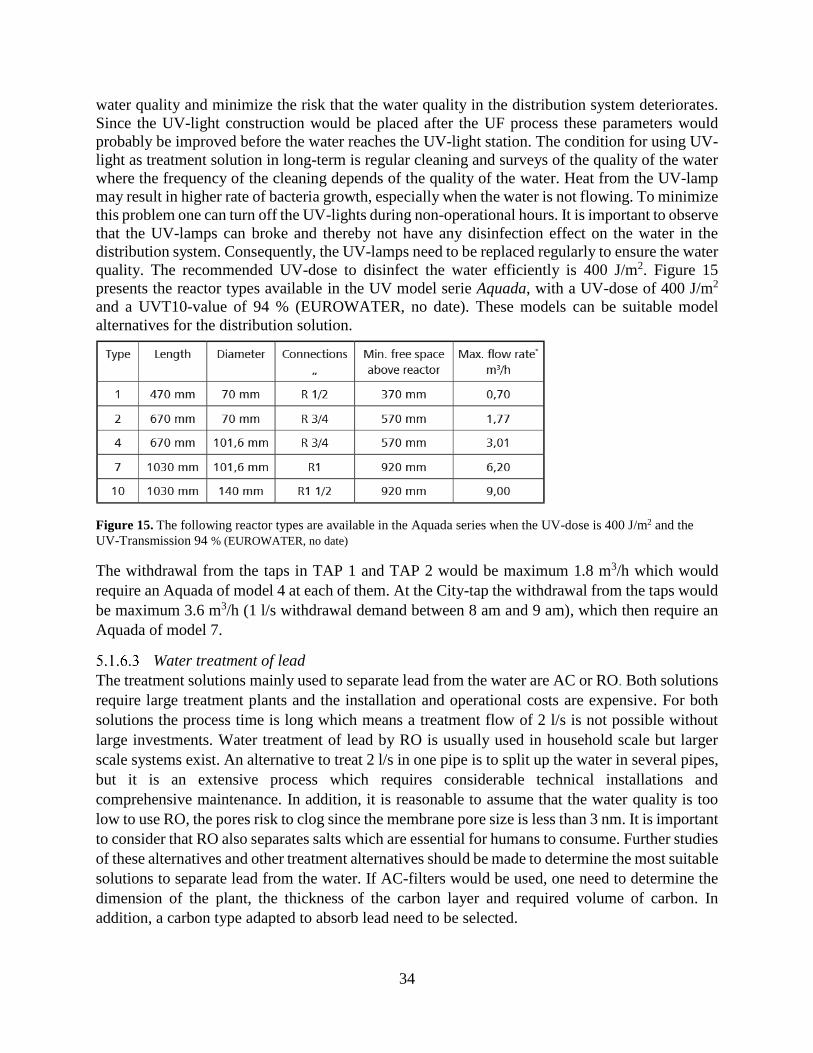
34
water quality and minimize the risk that the water quality in the distribution system deteriorates.
Since the UV-light construction would be placed after the UF process these parameters would
probably be improved before the water reaches the UV-light station. The condition for using UV-
light as treatment solution in long-term is regular cleaning and surveys of the quality of the water
where the frequency of the cleaning depends of the quality of the water. Heat from the UV-lamp
may result in higher rate of bacteria growth, especially when the water is not flowing. To minimize
this problem one can turn off the UV-lights during non-operational hours. It is important to observe
that the UV-lamps can broke and thereby not have any disinfection effect on the water in the
distribution system. Consequently, the UV-lamps need to be replaced regularly to ensure the water
quality. The recommended UV-dose to disinfect the water efficiently is 400 J/m2. Figure 15
presents the reactor types available in the UV model serie Aquada, with a UV-dose of 400 J/m2
and a UVT10-value of 94 % (EUROWATER, no date). These models can be suitable model
alternatives for the distribution solution.
Figure 15. The following reactor types are available in the Aquada series when the UV-dose is 400 J/m2 and the
UV-Transmission 94 % (EUROWATER, no date)
The withdrawal from the taps in TAP 1 and TAP 2 would be maximum 1.8 m3/h which would
require an Aquada of model 4 at each of them. At the City-tap the withdrawal from the taps would
be maximum 3.6 m3/h (1 l/s withdrawal demand between 8 am and 9 am), which then require an
Aquada of model 7.
Water treatment of lead
The treatment solutions mainly used to separate lead from the water are AC or RO. Both solutions
require large treatment plants and the installation and operational costs are expensive. For both
solutions the process time is long which means a treatment flow of 2 l/s is not possible without
large investments. Water treatment of lead by RO is usually used in household scale but larger
scale systems exist. An alternative to treat 2 l/s in one pipe is to split up the water in several pipes,
but it is an extensive process which requires considerable technical installations and
comprehensive maintenance. In addition, it is reasonable to assume that the water quality is too
low to use RO, the pores risk to clog since the membrane pore size is less than 3 nm. It is important
to consider that RO also separates salts which are essential for humans to consume. Further studies
of these alternatives and other treatment alternatives should be made to determine the most suitable
solutions to separate lead from the water. If AC-filters would be used, one need to determine the
dimension of the plant, the thickness of the carbon layer and required volume of carbon. In
addition, a carbon type adapted to absorb lead need to be selected.

35
The origin of lead was not investigated in this study. The most suitable solution may be to
investigate the origin of lead and protect the water from further contamination since treatment of
lead is problematic and expensive. Charles Bahati, Project Manager at MAVUNO office said that
the pipes from the groundwater well to the outlet taps are made of plastic and the outlet taps are
made of iron. Lead has not been used as material in the current distribution solution (Bahati, 2017).
Since the analyses indicate that the groundwater is most probably affected by surface water another
guess can be that gasoline is not lead free and lead have been entered the water source.
MODELING IN EPANET
5.2.1 Results compared to requirements
The result of the simulation showed that neither alternative 1 nor 2 met the pipe design criteria of
minimum demand factor, minimum head loss or minimum velocity in pipe. This is because the
system would not be operational during the main part of the day. Thereby the water would stand
still during this time period and then the minimum demand factor became 0, head loss became 0
‰ and the velocity became 0 m/s. These criteria could not be met as long as the system not would
/almost would be constantly operational, not even with help by external solutions. Even if a battery
would be used so that the system could be operated all day and night it would not result fulfilling
the criteria. This since a constant extension for further transportation till Chonyonyo will result in
that no water withdrawal could be made at MAVUNO office. As long as the water system stand
still for some time for extension of water withdrawal locally at MAVUNO office these criteria will
be 0, 0 ‰ and 0 m/s. In addition, peak demand factor is not met since the demand pattern is a
factor of 4 between 8 am and 9 am. This can be rectified by changing the demand pattern at the
City-tap but the most important from a hydraulic aspect is that the water balance over a day is
fixed and the storage tank can regulate the differences occurring between the inflow and the water
extraction. Then a deviation in demand a few hours a day would then have no major impact. For
the same reason, if the system stands still a few hours a day would not have a major impact on the
hydraulics. This reflection means that the system could be implemented without any hydraulic
difficulties. An inner pipe diameter of 90 mm throughout the whole system would be the most
motivated distribution solution since all the criteria except minimum demand factor, peak demand
factor, minimum head loss and minimum velocity are fulfilled. A combination of different pipe
sizes does not give any improvement of the criteria. Distribution alternative 1 requires less energy
to supply the villagers in Chonyonyo with water than distribution alternative 2, since the pressure
in the junction “groundwater well” is lower for alternative 1 than for alternative 2.
5.2.2 Deviation from the final distribution solution
The parameters inserted in the model in EPANET will probably vary from the final solution. For
example, the demanded pattern would most likely look different, the pump capacity differs from
the chosen one, shutdowns of electricity would interrupt the operation and breakage of tanks, pipes
or pumps would occur. Based on these facts the model would never be fully adapted to the reality
and therefore gave different results and conclusions and end up in another optimal constructional
solution. But the most important from a hydraulic aspect is that the water balance over a day is
fixed and that the storage tank could regulate the differences occurring between the inflow and the
water extraction.

36
The distribution system requires operation by solar power 6 hours a day, from 9 am to 3 pm. But
the sun may not generate enough energy to operate the distribution system during certain periods.
For this to not cause interruption in the operation a powerful battery is required and an alternative
energy source like the community powerline.
5.2.3 Water consumption compared to supply
The new distribution system was desired to support over 6 000 people with drinking water. But
with a consumption of 20 liter per person, which was assumed to be the average consumption, the
system could support only 2 160 people. According to UN Water a person needs 20 – 50 liters a
day for maintaining their basic needs of drinking, cooking and cleaning (UN Water, 2014). With
a daily consumption of 50 liter per person, the system could supply less than 870 people. This
means that just up to a third of the consumers could be supported with water. The final distribution
solution needs to be combined with more distribution systems with several boreholes to support
all the villagers with safe drinking water.
DESIGN OF THE WATER DISTRIBUTION NETWORK
5.3.1 Source protection
The quality tests showed that the groundwater probably is affected by surface water. The lower
the raw water quality entering the distribution system, the larger the risk for negative storage
effects and formation of biofilms. It is important to improve the raw water quality to increase the
expected lifetime of the system. The reason of the contamination of the water has not been
investigated further in this study. The pumping from the groundwater well at the MAVUNO office
was put into service in May 2016. The short distribution system from the well to the outlet taps
have not been cleaned since then. But this is probably not the reason for the low water quality
results since contamination has been detected since the installation (Baraka and Shwekelera,
2016). The most probable reason is leakage of surface water to the groundwater well already from
the installation or contamination of the whole aquifer.
The water analyses from the MAVUNO office and Ihanda station showed both similarities and
differences. The presence of Enterococcus value was similar but the total coliform bacteria and
E.coli did not show any substantial similarities or differences. Not even among the samples from
Ihanda station were the results comparable. The reason could be contaminated samples during the
water quality measurements. It could also depend on varying sizes of inward leakage of surface
water at the different places, a higher leakage of surface water in the valley and a lower at the
MAVUNO office. But these water results could not determine if the raw water source at the
MAVUNO office and Ihanda has the same origin. Thereby no conclusion could be made of what
the contamination depends on. Further studies need to be performed to investigate why the outlet
taps at the MAVUNO office supply unclean water. Further, measures are needed to improve the
current raw water quality and protect the source from contamination. In addition, currently
implementation of suitable water treatment solutions are needed to ensure safe drinking water to
the consumers.
5.3.2 Surveys and cleaning
To maintain transportation of safe drinking water for the consumers, regular quality controls and
frequent cleaning of the system is a prerequisite. If contamination would not be detected in time,
37
if there would be lack of maintenance or if measures would not be prioritized etc., the quality of
the water could rapidly deteriorate and the expected lifetime of the system could be substantially
decreased. Since the distribution process is a b-type water service according to 8 § in NFAS (2015)
and the daily production was 43.2 m3 the requirement is four normal surveys a year and one
extended survey every second year due to part II in section C, The minimum frequency of sampling
and analysis (National Food Agency, Sweden, 2015).
Selection of water cleaning intervals and sort of cleaning was not investigated in this study. It
depends on the capacity and quality of the water, selection of distribution material and water
treatment solutions etc. Examples of cleaning routines are regular disinfection by chlorine,
chloramine or chlorine dioxide of the distribution system and tanks. The concentration required
for an effective disinfection is related to, for example water temperature, pH and the presence of
microorganisms. Even ozone could be used but the disinfecting effect could decay too rapidly to
have a long lasting disinfecting effect (Ainsworth, 2004).
SUSTAINABLE GROUNDWATER WITHDRAWAL
The sustainable withdrawal rate from the groundwater well is unknown. The possible withdrawal
volume from the groundwater well at the MAVUNO office is 172.8 m3 (2 l/s in 24 hours) a day.
Since the daily average water consumption is 16.3 m3, an extension of withdrawal of 43.2 m3 for
transporting to Chonyonyo is fully possible without effecting the water consumption at the
MAVUNO office. But since the aquifer volume and the recharge rate of the groundwater is
unknown, the sustainable water withdrawal is unknown.
To maintain a sustainable water supply the possible withdrawal rate from the groundwater source
needs to be investigated. It is dependent on the current volume and storage capacity of the aquifer,
the withdrawal rate and the recharge rate of groundwater. Further studies are needed to investigate
these parameters. The recharge rate could be determined through water balance studies. The
storage capacity of the aquifer and other characteristics could be investigated by detecting the
groundwater level recovery (drawdown) due to withdrawal of a known volume of water, so called
pump tests. These measurements would be made in a control well and one or several observation
wells to observe how the detected data varies over time and distance from the control well
(Environmental Protection Agency, 2006)
An alternative and less costly way to detect the response of the withdrawal demand is to install a
logger in connection to the water source. It detects how the groundwater level varies of a known
daily water withdrawal. This is not a fully investigation but it gives an estimation of the effects of
a known withdrawal and could be a temporary solution until a complete investigation is be made.
Further studies of the water quantity and recovery are recommended before an eventual increase
of the withdrawal from the ground water source.

38
6 CONCLUSIONS Two water distribution alternatives were suggested by Engineers Without Borders and MAVUNO
to supply the community Chonyonyo with safe drinking water. Alternative 1 consisted of a 10 km
distribution system from the already existing groundwater well at the MAVUNO office and the
other a 3.5 km distribution system from the most neighboring valley to Chonyonyo, where no
groundwater well exists today. The latter alternative has considerable higher altitude difference.
Both alternatives would be operated by solar panels during six hours a day. By modelling the
alternatives in EPANET regard to parameters such as position and volumes of storage tanks, length
and diameters of pipes, water withdrawal schedule etc. a suitable sustainable water distribution
system was investigated. The selection of the water distribution system was based on minimum
requirements of energy for operation weighed with lowest possible water residence time in the
storage tank.
The result of the simulation showed that neither of the distribution alternatives met all the design
criteria. The main reason was that the system could not be constantly operated. If this criterion was
excluded distribution alternative 1 required less energy to supply the villagers in Chonyonyo with
the prescribed water withdrawal than distribution alternative 2. This since the maximum pressure
in the junction “groundwater well” was lower for alternative 1 than for alternative 2. The pressure
in this junction corresponds to the capacity the groundwater pump needs to operate the distribution
system and thereby energy use and demand of solar power. The optimal solution was distribution
alternative 1 with an outer pipe diameter of 110 mm throughout the whole distribution system and
a water residence time in the storage tank of 57.1 hours.
Water quality analyses from the raw water source for distribution alternative 1 were performed in
order to classify the status of the water and select suitable water treatment solutions. The water
quality analysis showed that the ground water source for distribution alternative 1 was affected by
surface water and classified as unusable because of high levels of harmful bacteria and lead. The
most suitable water treatment solutions to improve the microbiological water quality and decrease
the levels of lead were UF and UV-light in combination with a treatment method to remove lead
from the water. The selection have been based on the water treatment aspects: quality of the raw
water source, intended water use, volume of water required, generated waste products of treatment
operation and the defined requirements.
In consideration of the mentioned aspects and an installation of an UF in the beginning of the
distribution system and installation of UV-light just before the outlet, with an additional treatment
method of lead installed, the system has good possibilities to ensure distribution of safe drinking
water for many days to come.
Further studies
To maintain a sustainable water supply and maximize the expected lifetime of the distribution
system, further studies needed are:
Investigate a sustainable water withdrawal rate from the groundwater well at MAVUNO
office.
39
Select suitable distribution system material. Also investigate specific product
recommendations of storage tanks, pumps, pipes, fittings and control valves for the
distribution system need to be investigated. For the last four, neither design
recommendations was made in this study.
Investigate the reason why the outlet taps at the MAVUNO office supply unclean water
due to high levels of harmful bacteria, rectify it and additionally protect the water source
from further contamination.
Additional analysis of the concentration of lead from the groundwater well at MAVUNO
office to eventually ensure the authenticity of the analysis. If the follow up analysis
confirm high concentrations of lead the origin of lead should be investigated and rectify
or implement a treatment method to decrease the levels of lead in the water.
Perform water analysis of mercury and weighed in the selection of the water treatment
solutions
Determine cleaning and maintenance intervals and sort of cleaning for the storage tanks,
pipe network and water treatment solutions.
Design and implement more water distribution system since only this distribution system
would not be able to supply the demand of water in Chonyonyo.
40
7 REFERENCES Ainsworth, R. (2004) Safe Piped Water, Managing Microbial Water Quality in Piped
Distribution Systems. London, United Kingdom: IWA Publishing.
Bahati, C. (2017) ‘Personal communication’.
Baraka, J. and Shwekelera, M. (2016) ‘Personal communication’.
Bergman, R. A., Garcia-Aleman, J. and Morgan, R. (2012) ‘15.1. TYPES OF MEMBRANE
PROCESSES’, in Water Treatment Plant Design. 5th edn. McGraw-Hill Professional
Publishing.
Brikké, F. and Bredero, M. (2003) Linking technology choice with operation and maintenance in
the context of community water supply and sanitation. Geneva, Switzerland: World Health
Organization and IRC Water and Sanitation Centre, pp. 93–95.
Brown, G. O. (2003) ‘The History of the Darcy-Weisbach Equation for Pipe Flow Resistance’, in
Environmental and Water Resources History. Washington, D. C.: American Society of Civil
Engineers, pp. 34–43.
Demandt, C. (2017) ‘Personal communication’.
Environmental Protection Agency (2006) Technical Guidance Manual for Ground Water
Investigations, Chapter 4 - Pumping and Slug Tests. Columbus: Division of Drinking and
Ground Waters, pp. 4–11, 4–26.
EUROWATER (no date) ‘WEDECO Aquada, Installation and Maintenance Instructions’.
Geochemical Atlas of Europe (2006) ‘EC - Electrical Conductivity’.
Herbert, R. (2016) ‘Personal communication’.
Hutton, M. (1987) ‘Chapter 6. Human Health Concerns of Lead, Mercury, Cadmium and
Arsenic’, in Lead, Mercury, Cadmium and Arsenic in the Environment. John Wiley & Sons Ltd,
pp. 53–68.
IDEXX Laboratories (no date) ‘Quanti-Tray/2000’.
Liou, C. P. (1998) ‘Limitations and proper use of the Hazen-Williams equation’, Journal of
Hydraulic Engineering-American Society of Civil Engineers, 124(9), pp. 951–954.
McCleaf, P. (2017) ‘Personal information’.
Mohamadshafiee, M. R. and Taghavi, L. (2012) ‘Health Effects of Trihalomethanes as
Chlorinated Disinfection by Products: A Review Article’, International Journal of
Environmental, Chemical, Ecological, Geological and Geophysical Engineering, 6, No:8.

41
National Food Agency, Sweden (2014) ‘Vägledning till dricksvattenföreskrifterna SLVFS
2001:30’.
National Food Agency, Sweden (2015) ‘Livsmedelsverkets föreskrifter (SLVFS 2001:30) om
dricksvatten’.
Payment, P. and Robertson, W. (2004) The microbiology of piped distribution systems and
public health. 924156251.
R.M.MGENI ENTERPRISES (2015) ‘Drilling Report of MR: MAVUNO OFFICE P O
Box:273, Karagwe, Kagera, Tanzania’.
Rossman, L. A. (2000) ‘EPANET 2 USERS MANUAL’.
Samuelsson, P. (2017) ‘Personal communication’.
Sutton, S. (2010) ‘The Most Probable Number Method and Its Use in QC Microbiology’,
Journal of GXP Compliance, 14(4), p. 28.
Swaim, P. D., Cotton, C. A. and Linden, K. G. (2012) ‘12. ULTRAVIOLET DISINFECTION’,
in Water Treatment Plant Design. 5th edn. McGraw-Hill Professional Publishing.
Tepe, Y. A. (2014) ‘Toxic Metals: Trace metals - Chromium, Nickel, Copper and Aluminum’,
Encyclopedia of Food Safety. Giresun, Turkey.
Törneke, K. (2016) ‘Personal communication’.
United Nations General Assembly (1987) ‘Report of the World Commission on Environment
and Development: Our Common Future’.
VA Specialen (no date) ‘Flik01_Tryckledningar’.
de Vera, A. R. (2012) Rural water supply Design manual, Volume 1. 67751. Manila, Philippines,
p. 11.1-13.10.
World Health Organization (2003) ‘pH in Drinking-water Background document for
development of WHO Guidelines for Drinking-water Quality’.
World Health Organization (2005) ‘Bromate in drinking water, Background document for
development of WHO Guidelines for Drinking-water Quality’.
World Health Organization (2011) Guidelines for drinking-water quality, 4th edition. 4th edn.
Geneva, Switzerland.
42
Internet references
Emiva (no date) Ultrafilter. Available at: http://www.emiva.se/vattenrening-produkter/ultrafilter-
132724 (Accessed: 15 February 2017).
Hanna instruments (2016a) HI-98127 Pocket pHep4 Water Resistant pH Tester, Hanna
instruments. Available at: http://www.hannainstruments.co.uk/ph/meters/pocket-phep4-water-
resistant-ph-tester.html (Accessed: 2 February 2017).
Hanna instruments (2016b) HI-98311 EC, TDS and Temperature Tester, Low Range, Hanna
instruments. Available at: http://www.hannainstruments.co.uk/conductivity-tds/meters/ec-tds-
and-temp-low-range-0-3999us-water-resistant-tester.html (Accessed: 31 January 2017).
Oram, B. (no date) Ozonation in Water Treatment, Water Research Center. Available at:
http://water-research.net/index.php/ozonation (Accessed: 16 February 2017).
Pipe Flow Software (no date) Pipe Pressure Drop Calculations, Pipe Flow Software: System
Flow Rate & Pipe Pressure Drop Calculators. Available at: http://www.pipeflow.com/pipe-
pressure-drop-calculations/pipe-friction-loss (Accessed: 20 March 2017).
Sonesten, L. (2016) Vattenkemiska analysmetoder | Externwebben. Available at:
http://www.slu.se/institutioner/vatten-miljo/laboratorier/vattenkemiska-
laboratoriet/vattenkemiska-analysmetoder/ (Accessed: 6 January 2017).
UN Water (2014) A person needs 20-50 liters of water a day for basic needs, UN Water - The
United Nations internal-agency mechanism on all freshwater related issues including sanitation.
Available at: http://www.unwater.org/statistics/statistics-detail/en/c/211765/ (Accessed: 6
February 2017).
United Nations Department of Economic and Social Affairs (no date) Sustainable development
goals. Available at: https://sustainabledevelopment.un.org/sdgs (Accessed: 17 February 2017).
Vattensystem (no date) UV-filter UV-anläggning. Available at:
http://www.vattensystem.se/UVfilterUVanlaggning.htm (Accessed: 6 January 2017).
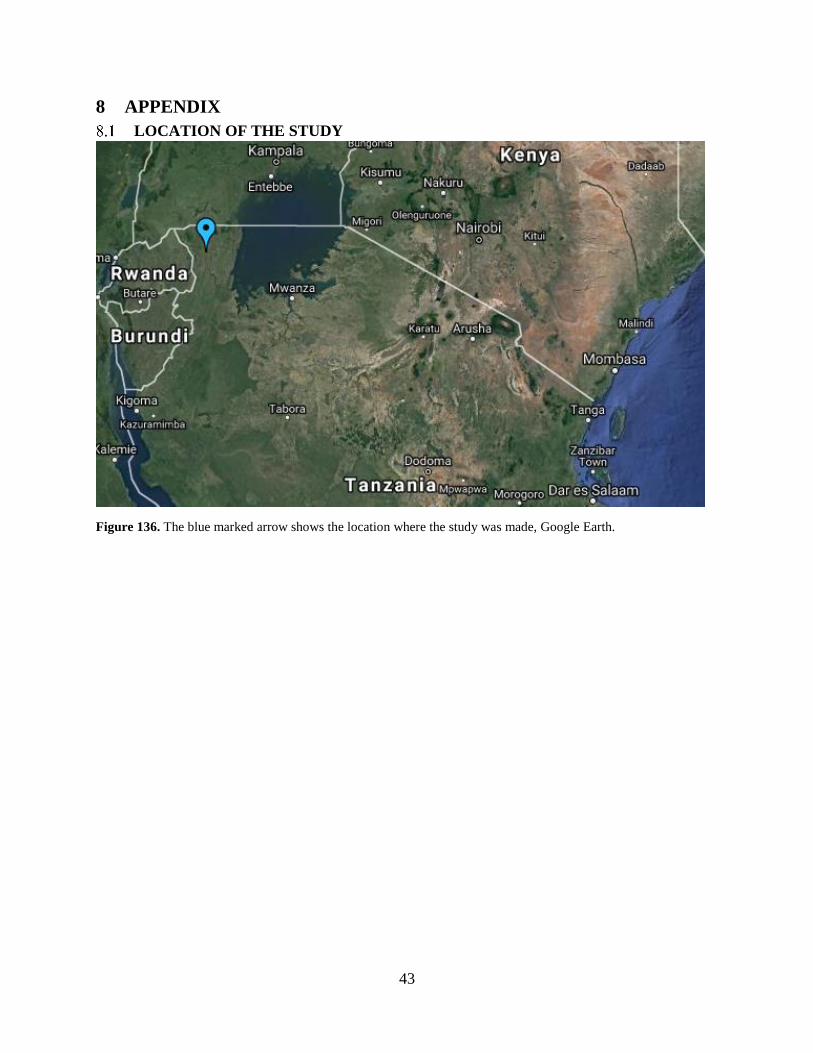
43
8 APPENDIX
LOCATION OF THE STUDY
Figure 136. The blue marked arrow shows the location where the study was made, Google Earth.