est case studies and perspectives in japan faculteit/afdelingen... · the environmentally...
TRANSCRIPT

EST Case Studies and Perspectives in Japan
Yuichi Moriguchi* and Hirokazu Kato** *National Institute for Environmental Studies Traffic Pollution Control Research Team PM2.5 & DEP research project group Japan Email: [email protected] **Nagoya University Department of Sustainable Transport and Spatial Development Graduate School of Environmental Studies Japan Email: [email protected]
EJTIR, 4, no. 1 (2004), pp. 121-145
Received: October 2003 Accepted: August 2004
Results and discussion of the Environmentally Sustainable Transport (EST) Case Study for Japan are introduced within this paper. According to procedures defined in the EST project by the OECD, the targets for a major reduction of environmental load within the transport sector are defined to be CO2, NOx, PM, and VOC. Three scenarios to accomplish these reduction targets, with respect to these environmental loads are detailed: a techno-optimistic scenario (EST1), a transport demand management scenario (EST2), and a composite scenario (EST3). All of the scenarios are examined and compared to the business-as-usual (BAU) scenario. Policy instruments to realize these scenarios and their socio-economic impacts were, to date, not assessed within the study. Utilizing a “back casting” methodology, expected changes in technology and transport behavior in order to meet an ultimate target of emissions reduction were examined by each of the scenarios. The objective areas consisted of a national study, encompassing the whole of Japan, and a regional (Aichi prefecture) study. The forecasts indicate that CO2 emissions increase by about 10% in Japan but are almost stable in Aichi prefecture. NOx and HC emissions in 2030 are about half, and PM emissions around one quarter of those in 1990 in Aichi prefecture. The results of the back casting indicate that CO2 and NOx reduction targets have severely restrictive conditions. The achievement of targets utilizing only EST1 and EST2 is totally unfeasible. Even in the combined EST3 scenario, and in light of current trends requirements must include strong recommendations for change such as the significant wide spread use of fuel cell vehicles and

122 EST Case Studies and Perspectives in Japan
the reduction of freight transport demands, and hence the scenario still needs to be discussed further.
Introduction
The Environmentally Sustainable Transport (EST) project by the OECD includes “Case Studies” in each associated country or city to examine how EST might be achieved. These studies have already been undertaken in Sweden, the Netherlands, Germany, the Quebec-Windsor corridor in Canada, the greater Oslo region group, the Alpine group (Austria, France, Italy and Switzerland), as well as other regions. Its procedures are defined in EST-guidelines (OECD, 2002). As a part of, and input to, the International Conference on EST in the Asian Region in Nagoya, Japan in March 2003 (OECD, 2003), the Case Study for Japan was initiated by the EST Japanese study team, including the authors, using the same protocols as those undertaken for the other regions. This paper will introduce the results to date from the EST Case Study for Japan, consisting of two parts: a national study encompassing the whole of Japan, and a regional (Aichi prefecture) study.
1. Outline of the EST Case Study
The EST Case Study is designed to assess the improvement of technologies and transport activities by applying a "back casting” approach, in order to achieve emission reduction targets for the year 2030. The backcasting approach is an important methodology for setting a goal required for the discussion and perspectives of long-term measures. The approach does not forecast future technological developments and transport activities on the basis of current trends and measures, but rather examines what are the preconditions needed for technological developments, transport activities, and the surrounding society, where environmental targets can be achieved. In principle, the goal is supposed to set, as targets, the reduction of a series of six environmental loads; carbon dioxide (CO2), nitrogen oxides (NOx), particulate matter (PM), volatile organic compounds (VOCs), noise, and land use from a wider perspective of environmental criteria. In practical terms, the Case Study is undertaken using the following procedure.
STEP 1) Setting up of targets on CO2, NOx, PM, and VOC based on scientific knowledge and environmental criteria, although the national case study dealt with CO2 alone. Noise and land use were excluded in the Case Study for Aichi prefecture. They are not covered within the study as it is difficult to conduct quantitative evaluation without the consideration of tangible location-specific conditions.
STEP 2) Forecasting each of the environmental loads for the target year 2030. It is assumed that technological developments and transport activities will follow the current trends, namely a “Business As Usual (BAU) scenario”. A comparison between the estimated emissions and the targets may reveal a required reduction for achieving the goal.

Yuichi Moriguchi and Hirokazu Kato 123
STEP 3) Construction of alternative technologies and transport activities in order to achieve the targets, called “EST scenarios”. Three EST scenarios are proposed; EST1, EST2 and EST3, all of which presume a certain level of technological development and changes to transport activities. Given such an assumption, it becomes possible to elicit essential conditions, required for realizing transport and the surrounding society where the target is achievable. Due to the fact that EST1 attains a goal only by virtue of technological improvements and EST2 achieves the same simply by changes in transport activities, both scenarios would end up assuming extremely radical changes. EST3 is designed to construct a scenario by combining settings on technology and transport activities, so that the target can be achieved by rather more moderate changes. Outlines of each of the scenarios and their respective interrelations are shown in Tables 1 and 2.
The OECD’s guidelines include further steps, namely, to identify strategies to achieve EST, to assess socio- economic implications of the EST vision, to construct packages of measures and instruments, as well as implementation and monitoring of EST plans. Within the Japanese study, completion of all these steps hasn’t been undertaken, only the first few within the full case study. Nevertheless, the case study contributes to the discussion on policy measures, such as land use policies, taxation systems and revenue resources, pertaining to the promotion of technological developments and changes in transport activity, with the recognition of the gap between the BAU scenario and a picture of the future. Even under the EST3 scenario, there could be a case for no alternatives, only the assumption of dramatic changes with little feasibility. This illustrates the significant gap between future targets and current trends. A nationwide case study is reported in Section 2, and a regional (Aichi prefecture) case study is reported in Section 3. Table 1. Scenarios for achieving the targets
Scenario Summary
EST1 This is a high technology scenario, which assumes technological improvements only. Transport activities are assumed to be the same as in the BAU scenario.
EST2 This is a mobility change scenario, which assumes changes in transport activities only. Technological developments are assumed to be the same as in the BAU scenario.
EST3 This is a combination scenario in which the targets are attained through a combination of both technological developments and changes in transport activities.
Table 2. Interrelations among the scenarios
BAU EST 1 EST 2 EST 3 Economic growth and population growth = BAU = BAU = BAU
Technological developments >> BAU = BAU > BAU Changes in transport activities
Assumes the continuation of current trends. = BAU >> BAU > BAU
= BAU : Assumes the same change as BAU scenario. >> BAU: Assumes a much greater rate of change than BAU scenario. > BAU : Assumes an intermediate rate of change, between = BAU and >> BAU.

124 EST Case Studies and Perspectives in Japan
2. Case Study for Japan
2.1 Major Trends in Transport and Environment in Japan
Major trends in transport and relevant environmental issues in Japan, a background of the Case Study, can be summarized as follows;
Railways account for 27.9% of passenger transport in Japan, which is considered as exceptionally high. However, it only accounts for 4.3% of freight transport. A shift from rail and maritime transport to truck transportation occurred in Japanese period of spectacular economic growth. It is true that railways have an overwhelming share of passenger transport, both between city-center and their suburbs and in inter-urban transport. Nevertheless, the proportion of motor vehicle usage has been increasing in other areas of passenger transport as well as in freight transportation, especially in rural areas, where transportation systems are heavily dependant on motor vehicles.
While CO2 emissions from the industrial sector remained stable in the 1990s, emissions from the transport sector have increased. In the 2000 fiscal year, transport sector related CO2 emissions increased by 20.6% compared with those of 1990. These increases could be attributed to the following issues: (1) an increase in traffic volume due to an increase in the ownership of private passenger cars, and (2) the decline of the fuel efficiency of passenger cars due to an increase in size. In order to achieve the GHG reduction target determined at Kyoto Protocol, CO2 reduction in transport sector is inevitable. Contained within the Governments master plan on the prevention of global warming, measures should be comprehensively taken to reduce CO2 emissions from transport sector. By 2010 CO2 emissions should be no more than a 17% increase from those in 1990: Such prevention strategies include (1) development of high energy efficiency vehicles and the marketing of them, (2) motor vehicle traffic demand management, (3) introduction of Intelligent Transport Systems (ITS), (4) promotion of modal shift, and (5) improvement in the efficiency of distribution systems. The master plan will be reviewed and updated in 2004 and 2007.
The concentration and levels of air pollutants such as NO2 and SPM have remained stable due to the delay in the implementation of countermeasures. In order to improve compliance with environmental quality standards, measures have to be undertaken based on the Law concerning special measures for automobile related NOx and PM.
Despite the efforts of making low emission (and/or energy efficient) vehicles popular with the introduction of the severest emission regulations in the world by the end of 2005, as well as a “green tax”, further countermeasures to achieve environmental quality standards of NO2 and SPM, and the target determined at the Kyoto Protocol have to be promoted. Long-term measures such as new technology development and improvement of transport infrastructures should be comprehensively implemented, based on a long-range perspective. With respect to the short-term, measures should be taken constantly, for example, (1) facilitation of vehicle traffic flow such as the introduction of ITS and the resolution of road network bottlenecks, and (2) measures to reduce traffic demand itself such as joint shipping and delivery, and improvement of distribution system efficiency.

Yuichi Moriguchi and Hirokazu Kato 125
2.2 Classification of Transport Modes and Definition of the Target
Categories of the modes of transport addressed within the Case Study of Japan on a national level are listed in Table 3. As a general rule, the amounts of CO2 emissions are based on where they are emitted (International aviation and international maritime transport are excluded)14. Passenger cars and buses are categorized in motor vehicles. Table 3. Categories of transport modes in the case study (Japan as a whole)
Passenger transport
Motor vehicles#1 , Railways#2, Domestic aviation & Domestic passenger ships
Freight transport LDV#3, HDV#4, Railways, Domestic aviation & Domestic maritime transport
# 1 Buses were aggregated into motor vehicles, because of the difficulty in reflecting local conditions. #2 Including all the rail-based public transits such as streetcars. #3 LDV=Light Duty Vehicle #4 HDV=Heavy Duty Vehicle
Note: An emission factor of each transport mode is based on the data from National Institute for Environmental Studies by personal communication, “The Survey on Transport Energy” (MLIT, 2001a, MLIT, 2002a), etc.
The target for Japan on a national level is set at an 80% reduction against total CO2 emissions of those in 1990, in compliance with former case studies for OECD countries. In principle, Japanese own targets should be set based on scientific criteria and local attributes. However, it could be said the highly contentious nature of the subject matter makes a logical conclusion difficult. Instead, targets similar to those of other OECD case studies are adopted and analysis is conducted in such a way that the comparison with OECD countries regarding impacts on technological developments and mobility changes is therefore possible.
2.3 Definition of Common Assumptions to All Scenarios
The assumptions in Table 4 are shared by the BAU scenario and EST scenarios for Japan. The effects that EST scenarios 1-3 may have on economic growth, etc. are not taken into consideration. Table 4. Assumptions common to all scenarios (Japan as a whole)
Item Content Source Economic growth rate
Japan's real economic growth rate (nationwide) will be an average annual rise of 2.0% until 2010 and will flatten off thereafter.
Ideal Socioeconomy and Policies for Economic Rebirth (Economic Council, 1999)
Population 2010:127,623 thousand
2030:117,149 thousand
Medium variant projections by “Population Projections for Japan, January 1997) (National Institute of Population and Social Security Research, 1997)
14The reason for the exclusion is that international airports and international maritime transport are not included in emissions inventories under the totals for individual countries; instead they are reported separately

126 EST Case Studies and Perspectives in Japan
2.4 Business as Usual (BAU) Scenario
The BAU scenario assumes that technologies and transport activities should continue to develop and change, following current trends. The scenarios related to technological developments and transport activities are as follows.
(1) Scenario concerning technological developments Assumptions behind the scenario concerning technological developments, which are shown in Table 5, are based on documents issued by the Ministry of the Environment, Ministry of Land, Infrastructure and Transport, and other agencies. Table 5. Assumptions on technological developments in BAU Scenario (Japan as a whole)
Mode of transport Scenario References • Improvement in fuel efficiency (by 22.8% compared with that of 1999 )
Fuel efficiency standards based on Revised Energy Conservation Law
• Increase in traveling speed by 14.7% through currently planned road construction (compared with 1999)
Data issued by the Ministry of Land, Infrastructure and Transport
Passenger
• Introduction of 4.46 million fuel cell vehicles. (Diffusion rate: 6.6%)
Report of the Fuel Cell Project Team (Fuel Cell Project Team, vice ministerial council); Technology for international clean energy systems using hydrogen (WE-NET), Phase 2 R&D, Task 1, investigation and research on system assessment (New Energy and Industrial Technology Developments Organization)
• Improvement in fuel efficiency (Improve by 6.5% compared with that of 1999).
Fuel efficiency standards based on Revised Energy Conservation Law
• Increase in traveling speed by 14.7% (compared with 1999).
Data issued by the Ministry of Land, Infrastructure and Transport
Motor vehicles
Freight
• The following number of fuel cell vehicles are introduced: 420,000 LDVs (Diffusion rate: 3.7%) 59,000 HDVs (Diffusion rate: 1.1%)
Report of the Fuel Cell Project Team (Fuel Cell Project Team, vice ministerial council); Technology for international clean energy systems using hydrogen (WE-NET), Phase 2 R&D, Task 1, investigation and research on system assessment (New Energy and Industrial Technology Developments Organization)
Passenger Railways Freight
• Improvement in energy efficiency (by 7% compared with that of 1999).
The New Climate Change Policy Program
Passenger Aviation Freight
• Improvement in energy efficiency (by 7% compared with that of 1999).
The New Climate Change Policy Program
Maritime Passenger • Energy efficiency is constant.

Yuichi Moriguchi and Hirokazu Kato 127
(2) Scenario concerning transport activities In determination of transport activities under the BAU scenario, the forecast data of transport demand by each mode in 2010, (ITPS, 2001), is assumed to remain until 203015. The reason is based on the assumption that the leveling off of economic growth, the decline of the population, as well as an aging of the society should lead to little fluctuation in transport demand, as any increase and decrease will be offset. The forecasted values in the above reference were used as the basis for "About the fundamental direction of a synthetic traffic policy in the beginning of the 21st century -innovation of the mobility urged to a change of economic society-" (Council for Transportation Policy, 2000). They are representative estimates as comprehensive long-term forecasts of future demand for each mode of transport. Tables 6 and 7 are the assumed levels of transport demand in 2030. Table 6. Assumed transport demand in BAU scenario (Japan as a whole, 2030)
Passenger transport Freight transport
Mode Demand (bil. pass-km/yr) Mode Demand (bil. ton-
km/yr) Aviation 102 Aviation 1 Railways 400 Railways 26
LDV 11 Motor vehicles 887 HDV 299 Maritime transport 5 Maritime
transport 236
Total 1395 Total 573 Table 7. Ownership of motor vehicles in BAU scenario (Japan on a national level, 2030)
(million cars) Motor Vehicles 68,30 Fuel cell cars included 4,46 LDV.HDV 16,50 Fuel cell cars included 0,48
15 The transport demand data is based on some other statistical data (MLIT 2002b)

128 EST Case Studies and Perspectives in Japan
Figure 1. CO2 emissions in 1990 and under the BAU scenario in 2030 (Japan on a national level)
(3) Forecast result of emission under BAU scenario and reduction needed Figure 1 shows estimated emissions in 1990 and the BAU in 2030. The indication here is that the emissions will increase more than those of the 1990 levels within the BAU scenario. Thus, further reductions of emissions are needed to achieve the stated goal. Moreover, it is suggested that major reductions will be needed with respect to passenger vehicle and freight vehicle emissions, which account for the greater part of CO2 emissions. Composition of CO2 emissions in 1990, BAU as well as three EST scenarios are given in Table Appendix 1.
2.5 Environmentally Sustainable Transport (EST) Scenarios
(1) EST1 (high technology) Scenario With regard to CO2 emissions within the BAU scenario by mode of transport, it is clear that motor vehicles account for the majority of emissions. In terms of technological developments, it is also necessary to reduce the fuel consumption of motor vehicles and promote a shift toward fuel cell vehicles, compressed natural gas (CNG) vehicles, and so on. Here, conditions are developed to attain the target on the basis of technological improvements at the motor vehicle level. Representing measures underpinned by the technological advance of automobiles and making the hybrid and CNG vehicles popular can be pointed out. However, even if all of vehicles are replaced by hybrid and CNG vehicles they can only limit emissions by no more than 50% under BAU scenario. This is because the emission factor cannot be decreased by more than 30 to 40%. In the EST1 scenario, a significant spread of fuel cell vehicles and the introduction of carbon-free hydrogen supplying technology is needed. It is assumed that automobiles do not emit CO2 if hydrogen for fuel cell vehicles is produced via the carbon-free method (for example, electrolysis of water by carbon-free electricity such as hydro, wind, photo-voltaic as well as nuclear). Although it is possible to assume the spread of electric vehicles, making fuel cell vehicle much more popular is adopted here in order to reflect the current trend of

Yuichi Moriguchi and Hirokazu Kato 129
ongoing policies that give priority to the spread of fuel cell vehicles, as a measure to reduce CO2 emission. In addition, although the assumption of a radical drop in emission factor via other technological innovations may be possible, making the fuel cell vehicle popular is presumed to be the most representative technological innovation. Assumptions with respect to technological developments in the EST1 scenario are shown in Table 8. Table 8. Assumptions on technological developments in EST1 Scenario (Japan as a whole)
Mode of transport Assumptions Passenger 90% conversion to fuel cell vehicles
Motor vehicles Freight 85% conversion to fuel cell vehicles Railways Passenger, Freight 80% reduction in emission factor compared to 1999 Aviation Passenger, Freight 80% reduction in emission factor compared to 1999 Maritime transport Passenger, Freight 60% reduction in emission factor compared to 1999
Details of the necessary conditions for attaining the goal are as follows. <Motor vehicles>
To replace 90% of the 68.3 million passenger cars and buses with fuel cell vehicles. To replace 85% of the 16.5 million freight vehicles with fuel cell vehicles. The integration of the above-mentioned fuel cell vehicles requires construction of 40,000
hydrogen refueling stations nationwide. To produce electricity of approximately 370 billion kWh/year (around 35% of total generated electricity in 1999) in carbon free methods (wind power, hydro power, geothermal power, atomic energy and biomass energy, etc) is based on the assumption that hydrogen is produced by electrolysis of water at the hydrogen refueling station (on-site type) Furthermore, provided that necessary quantity of plutonium as catalyst of fuel cell is 100g / unit, it amounts to 7,600 tons as a total of fuel cell vehicles, which is 44 times of the global platinum consumption of 170 tons in 1999.
<Railways>
Introducing motor control technologies with higher efficiency, weight saving of railway vehicles and the source of energy with lower CO2 emission factor.
<Aviation and maritime transport>
Technological developments including exploitation of low carbon emission fuel (e.g. hydrogen) and weight saving
As above described, in order to achieve target goals with only technological developments, extreme conditions have to be forthcoming when compared to current trends, such as adoption rate of fuel cell vehicles and the number of hydrogen providing stations to be built. To avoid such extreme conditions, it requires the setting based on a combination with mobility changes, which will be reviewed as EST3.

130 EST Case Studies and Perspectives in Japan
(2) EST2 (mobility change) Scenario Under the BAU scenario, motor vehicles account for the majority of CO2 emissions they also have a high CO2 emissions rate per transported unit. In this context, when efforts to achieve the goal are made only on the basis of transport activities, it is essential to take measures to reduce automobile transport usage and demand. As it is expected that trips such as commuting or business can be partially replaced by telecommunications technologies (e.g. e-mail, video conferencing, etc), as a result passenger transport demand is assumed to decrease. Achievable modes in regard to a shift in passenger transport are assumed. In regard to shopping, for example, a short distance car trip can be replaced by the use of a bicycle and a medium to long distance car trip can be replaced by rail transport. Furthermore, there is an additional assumption of increased occupancy via car-pooling. With respect to freight vehicles, a shift from vehicle to rail transportation is not assumed because the majority of LDVs are engaged in access/igress transport. Instead, it is assumed that the total transport demand by freight vehicles is reduced and necessary conditions are examined. In addition, the improvement in average loading efficiency is also set up. Concerning air and water transportation, a shift to rail is assumed. Table 9. Assumptions on transport activities in EST2 Scenario (Japan as a whole)
Mode of transport Assumptions All modes • 20% reduction in overall passenger transport demand
Passenger
• 70% shift to railways • 25% shift to bicycles and walking • Doubling of average occupancy of passenger car (from 1.46 to 2.92 persons/vehicle) • 20% increase in traveling speed compared to 1999(Note2)
Motor vehicles
Freight • Decrease ton-km of LDVs by 80% • Decrease ton-km of HDVs by 85% • Tripling of average loading rate of LDVs (from 17.8% to 53.4%) • 1.5 times higher average loading rate of HDVs (from 50.0% to 75.0%) • 20% increase in traveling speed compared to 1999(Note2)
Passenger
• Increased by the amount shifted from motor vehicles, aviation and ships Railways
Freight • Increased by the amount shifted from aviation and ships Passenger
• 75% shift to railways Aviation
Freight • 30% shift to railways Passenger
• 30% shift to railways Water
Freight • 30% shift to railways Notes: 1. The amounts of all reductions and shifts in transport demand are based on those under the BAU scenario, while the shift of passengers is based on the demand after the 20% reduction.

Yuichi Moriguchi and Hirokazu Kato 131
2. Based on the assumption of improvement in speed due to congestion mitigation by traffic management and reduction in traffic demand of bus, passenger and freight vehicle. The necessary assumptions for EST2 are shown in Table 9. Details of the necessary conditions for attaining the goal are as follows.
<Passenger transport>
Cutting the number of trips including commuting, conferences and meetings taking advantages of telecommunications technology including e-mail and video conference systems. To implement reforms in employment, for example the introduction of teleworking once in the five day working week.
Popularization of joint use vehicles, and arrangement of HOV lanes . Short-distance trips such as shopping and commuting utilizing walking or use of the bicycle. A conversion of all trips that cannot be replaced by bicycles and walks to railway transport.
The feasibility will be enhanced by the construction of passenger railway covering about 35,000 km both in metropolitan areas and local regions.
<Freight transport>
To improve load efficiency by reviewing the transaction methods among shippers (time-specified delivery service etc) and by decreasing frequency of collection and delivery.
(3) EST3 (combination) Scenario EST3 scenario is established by the combination of suitable measures from EST 1 and 2. As mentioned earlier, EST1 refers only to technological developments. Hence, extreme conditions with respect to the adoption rate of fuel cell vehicles, the number of hydrogen supply stations to be built, and platinum consumption volume of fuel cell vehicles are assumed to take place. On the other hand, under EST 2, the assumptions of a dramatic increase in the share of railway transport turns out to be unrealistic in terms of the required volume of additional railway construction. In addition, it is extremely difficult to reduce the transport demand by 80% for LDVs and by 85% for HDVs. As a result, under EST 3, it is decided to mitigate conditions and to replace the above less feasible and/or unfeasible conditions with more realistic ones by combining conditions regarding technological developments and transport activities. In practical terms, the assumption is made on the basis of the following concept.
(A) A major conversion from automobiles to rail-based public transport in EST 2 becomes the predominant condition to restrict personal mobility. In EST 3, therefore, a shift from automobile transportation to rail-based public transport, to attempt to secure more moderate level of personal mobility/accessibility than EST 2 is assumed.
(B) Conditions considered for a reduction in freight traffic volume are a decrease in freight transport from distant suppliers, a relocation of production and distribution facilities, and the promotion and consumption of local products. Because reductions will be achieved via long-distance transports under these conditions, the assumptions are arranged in a way to ensure larger transport demand in short or middle distance transport compared to EST2.
(C) Owing to the need for the large investments required for making fuel cell vehicles popular and for the construction of hydrogen supplying infrastructure, as in ETS1, a
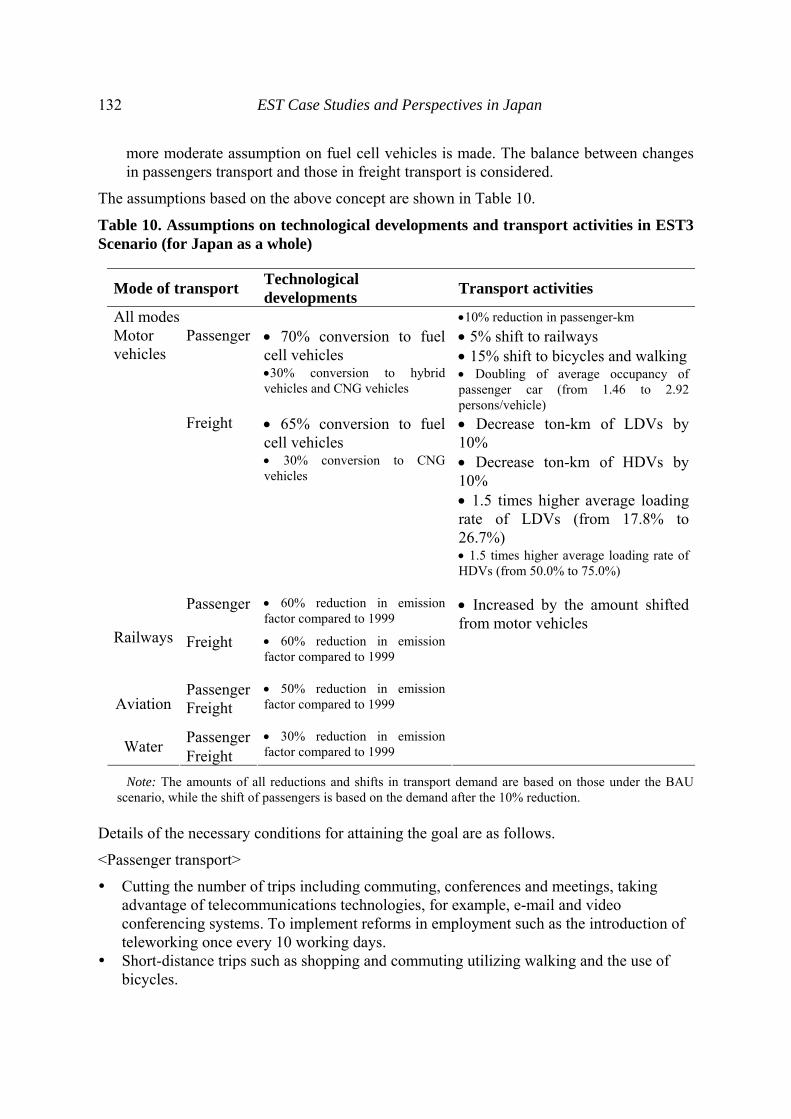
132 EST Case Studies and Perspectives in Japan
more moderate assumption on fuel cell vehicles is made. The balance between changes in passengers transport and those in freight transport is considered.
The assumptions based on the above concept are shown in Table 10.
Table 10. Assumptions on technological developments and transport activities in EST3 Scenario (for Japan as a whole)
Mode of transport Technological developments Transport activities
All modes •10% reduction in passenger-km Passenger • 70% conversion to fuel
cell vehicles •30% conversion to hybrid vehicles and CNG vehicles
• 5% shift to railways • 15% shift to bicycles and walking • Doubling of average occupancy of passenger car (from 1.46 to 2.92 persons/vehicle)
Motor vehicles
Freight • 65% conversion to fuel cell vehicles • 30% conversion to CNG vehicles
• Decrease ton-km of LDVs by 10% • Decrease ton-km of HDVs by 10% • 1.5 times higher average loading rate of LDVs (from 17.8% to 26.7%) • 1.5 times higher average loading rate of HDVs (from 50.0% to 75.0%)
Passenger • 60% reduction in emission factor compared to 1999
• Increased by the amount shifted from motor vehicles
Railways Freight • 60% reduction in emission factor compared to 1999
Passenger Aviation Freight
• 50% reduction in emission factor compared to 1999
Passenger Water Freight • 30% reduction in emission factor compared to 1999
Note: The amounts of all reductions and shifts in transport demand are based on those under the BAU scenario, while the shift of passengers is based on the demand after the 10% reduction.
Details of the necessary conditions for attaining the goal are as follows.
<Passenger transport>
Cutting the number of trips including commuting, conferences and meetings, taking advantage of telecommunications technologies, for example, e-mail and video conferencing systems. To implement reforms in employment such as the introduction of teleworking once every 10 working days.
Short-distance trips such as shopping and commuting utilizing walking and the use of bicycles.

Yuichi Moriguchi and Hirokazu Kato 133
<Freight transport>
To improve load efficiency by reviewing the transaction methods among shippers (time-specified delivery service etc) and by decreasing frequency of collection and delivery.
To decrease the volume of long-distance material transport, relocate the production and distribution center, and promote the consumption of local products.
<Motor vehicles>
To replace 70% of the 22 million passenger cars and buses with fuel cell vehicles, and the remainder with hybrid and CNG vehicles.
To replace 65% of the 9.9 million freight vehicles with fuel cell vehicles, and 30 % with hybrid and CNG vehicles.
The integration of the above-mentioned fuel cell vehicles requires construction of 15,000 hydrogen refueling stations nationwide. To produce electricity of approximately 130 billion kWh/year (around 12% of total generated electricity in 1999) in carbon free methods, (wind power, hydro power, geothermal power, atomic energy and biomass energy, etc) based on the assumption that hydrogen is produced by electrolysis of water at the hydrogen refueling station (on-site type) Furthermore, provided that necessary quantity of plutonium as catalyst of fuel cell is 100g / unit, it amounts to 2,400 tons as a total of fuel cell vehicles, which is 14 times of the global platinum consumption of 170 tons in 1999.
<Railways>
Introducing motor control technologies with higher efficiency, weight saving of railway vehicles and the source of energy with lower CO2 emission factor.
<Air and maritime transport>
Technological developments including exploitation of low carbon emission fuel (e.g. hydrogen) and weight saving.

134 EST Case Studies and Perspectives in Japan
3. Case Study for Aichi Prefecture in Japan
3.1 Transport and the Environment in Aichi Prefecture
Figure 2. Location of Aichi Prefecture within Japan
Figure 3. Shares of overland passenger transport within three major prefectures in Japan (1999) Source: MLIT, 2001b
Note: These figures refer only to transport within each prefecture. The others are ignored. As shown in Figure 2, Aichi Prefecture is located almost in the center of Japan, facing the Pacific Ocean to the south. The prefecture measures 106 kilometers from east to west and 94 kilometers from north to south. It has an area of 5,154 square kilometers, or about 1.4% of the total area of Japan. The population of Aichi Prefecture is 7,122,252 (as of Oct. 1, 2002),

Yuichi Moriguchi and Hirokazu Kato 135
or about 5.6% of the total population of Japan. The most populous municipality of the prefecture is the City of Nagoya, which has a population of 2,186,075. Nagoya is the center of industry, transport and culture in Aichi Prefecture. Aichi Prefecture is one of the world's major bases of the motor vehicle manufacturing industry. The prefecture ships around 15 trillion yen of motor vehicles and automotive parts annually, or about 37.5% of the corresponding figure for Japan as a whole. Aichi Prefecture has a well-developed road network, and motor vehicles account for a larger share of passenger transportation inside the prefecture when compared to other major metropolitan areas such as Tokyo and Osaka. (see Figure 3) It leads the nation in vehicle ownership, and the number of motor vehicles per household is higher than in other major metropolitan areas. Transport within the prefecture, as a whole, depends heavily on the use of motor vehicles. The prefecture also has a range of public transport systems, including railways, subways and bus routes; which play an important role in commuting. However, transport demand of motor vehicles has been increasing year by year, while patronage of rail-based public transport systems is somewhat in decline. Concentrations of NO2, SPM and NMHC have been generally stable in recent years without significant progress or improvement. While 89 out of 90 monitoring stations, or nearly 100%, met the environmental standards for NO2 in 2001; only 55 of the 93 monitoring stations met the standards for SPM. Further improvement of the regional environment remains an important task. CO2 emissions from transport have been increasing and measures need to be taken with regard to motor vehicles in particular.
3.2 Classification of Transport Modes and Definition of the Target
Table 11 shows the categories of the modes of transport to be addressed. CO2, NOx, PM and VOC emissions are forecasted and assessed. Air and maritime transportation departing from, or arriving at, Aichi Prefecture are excluded.16 Transport demand for passenger cars and buses is forecasted separately, considering the important role of buses in medium-distance transport. With regard to emissions from motor vehicles and buses in Aichi Prefecture, they are also estimated separately for OD trips within the Prefecture, departing from or arriving at Aichi Prefecture and passing through it. Furthermore, analyses for long-distance and medium-distance trips are estimated individually. Table 11. Categories of transport modes in the Case Study for Aichi Prefecture
Passenger transport Passenger cars (including light cars), Buses, Railways*
Freight transport LDV, HDV, Railways * Including all the rail-based public transports such as streetcars.
16 Emissions of CO2, NOx, etc. during the takeoff and landing of aircraft only account for a very small proportion of total emissions from transport. Also, it is difficult to conceive of a scenario in which transport would shift from motor vehicles to aviation or from aviation to motor vehicles. Therefore, this category is ignored here.

136 EST Case Studies and Perspectives in Japan
Notes: 1. Emission factor of each transport mode was assumed based on the data from National Institute for
Environmental Studies, Chubu Electric Power Company, “Railway Statistics Yearbook” (MLIT, 2002d), and so on.
2. Emission of PM and HC from railways is not considered.
The targets are the same as the EST targets of the OECD, for the same reasons as contained in Japan national level case study. Table 12. Targets in the Case Study for Aichi Prefecture
Pollutants Targets CO2 80% reduction from the 1990 level NOx, VOC (HC)17, PM 90% reduction from the 1990 level
3.3 Business as Usual (BAU) Scenario
The common assumptions are the same as those given for the Japan national case study (Section 2.3). The BAU scenario assumes that technologies and transport activities continue to develop and change according to current trends. The following scenarios as to technological developments and transport activities are set out in the same way as the national case study.
(1) Scenario concerning technological developments It is assumed that emission factors for CO2, NOx, PM and HC should decrease due to technological improvements. For CO2, the scenario of Japan is assumed entirely (See Table 5). For NOx, PM, and HC, major improvements are assumed (Table 13) as a result of new short and long-term regulations, where the improvements made by increase in traveling speed are not included.
(2) Scenario concerning transport activities The future transport demand in Aichi Prefecture is forecasted by applying the assumed growth based on the demand in 1999. It is the same as the national Case Study. Of course, it would be preferable to estimate demand separately for each region and OD. However, the simple growth rate at a national level was used because of limited data availability and for the sake of conformity with the national case study. The data used for estimating prefectural shares of transport demand are taken from the ”Land transport statistics directory”, “Annual Statistical Report on Motor Vehicle Transport”,” Inter-regional flow data of freight and passenger”, and “Road traffic census” (MLIT2002b, MLIT2002c, MLIT2001b, MLIT2001c).
17 Strictly speaking, the definitions of volatile organic compounds (VOC) and hydrocarbons (HC) are different. However, VOC is measured as HC in most of Japanese data. Therefore, HC will be considered here as a close approximation of VOC.

Yuichi Moriguchi and Hirokazu Kato 137
Table 13. Assumptions on technological developments in BAU Scenario (Aichi Prefecture) PM, HC Emission factors reduction
Category Nox PM HC Passenger cars
85% 40% 65%
Buses 55% 40% 65% Railway 7% LDV 40% 70% 65% HDV 30% 70% 65%
(3) Estimation result of emission under BAU scenario and reduction needed Figure 4 shows the emissions by mode of transport in 2030 under the BAU scenario, along with corresponding targets. Passenger cars are the predominant source of CO2 emissions, while freight vehicles are the primary source of NOx, PM and HC emissions. To attain the targets, it is necessary to reduce emissions from these modes of transport. Also under the BAU scenario, it is forecasted that NOx, PM, and HC emissions decline steadily owing to the new long-term regulations. However, none of these pollutants will meet the target under that scenario, so it is necessary to improve technology and promote significant shifts in transportation activities if the goal is to be achieved.
Figure 4 Emissions by modes and targets in 1990 and BAU scenario in 2030 (Aichi Prefecture)

138 EST Case Studies and Perspectives in Japan
3.4 Environmentally Sustainable Transport (EST) Scenarios
(1) EST1 (high technology) Scenario Assumptions within this scenario are shown in Table 14, followed by details of necessary conditions. The assumption for making fuel cell vehicles and hydrogen providing technology popular is made, since it is difficult to achieve the required target merely by the introduction of hybrid and CNG vehicles. Table 14. Assumptions on technological developments in EST1 Scenario (Aichi Prefecture)
Mode of transport Assumptions Passenge
r cars More stringent regulations on emissions than the new long-term
regulations. 85% conversion to fuel cell vehicles
Buses New long-term regulations. 50% conversion to fuel cell vehicles
LDV 85% conversion to fuel cell vehicles and 15% to CNG vehicles.
Motor vehicles
HDV 85% conversion to fuel cell vehicles and 15% to CNG vehicles. Railways 70% reduction in emission factor of CO2 and NOx.
<Motor vehicles>
Reduction in emission factor of each pollutant. A major shift from gasoline and diesel-fueled vehicles to fuel cell vehicles. To build hydrogen refueling stations in and around Aichi Prefecture corresponding to the popularization of fuel cell vehicles.
Hydrogen for fuel cell vehicles to be produced by a carbon free hydrogen supply technologies (e.g. biomass fuels and electrolysis of water by non-fossil fuels.). Construction of power plants with low CO2 intensity around Aichi Prefecture.
<Railways>
70% reduction in emission factor of CO2 and NOx by introducing technologies like motor control technologies with higher efficiency, weight saving of railway vehicles, and the source of energy with lower CO2 emission factor.
(2) EST2 (mobility change) Scenario Results of the BAU scenario show that a large proportion of the CO2 emissions are from passenger vehicles, while most of NOx, PM and HC emissions are from freight vehicles. From a viewpoint of transport activity, therefore, it is crucial to reduce motor vehicles transport demand. In the EST2 scenario, a shift from motor vehicles to rail in passenger transport, and reduction of freight transport demand itself, are assumed as in the case for the study for Japan on a national level.. Assumptions within this scenario are shown in Table 15, followed by details of necessary conditions. CO2 and NOx reduction targets are critical restrictive conditions. PM and HC reduction targets are achieved in accordance with CO2 and NOx target.

Yuichi Moriguchi and Hirokazu Kato 139
Table 15. Assumptions on transport activities in EST2 Scenario (Aichi Prefecture)
Mode of transport Assumptions All modes • 20% reduction in passenger transport demand
Passenger cars
• 20% improvement in motor vehicle travel speed. (compared with 1999) (Note 1) • Doubling the average occupancy of passenger car (from current 1.46 to 2.92 persons/ vehicle). • Shifting 75% of passenger-km within Aichi Prefecture to railways and 20% to buses. • Shifting 55% of passenger-km within Nagoya to railways, 20% to buses and 20% to walking and bicycles. • Shifting 65% of passenger-km departing from, or arriving in Aichi Prefecture to railways • Shifting 50% of passenger-km passing through Aichi Prefecture to railways
Buses • 20% improvement in motor vehicle travel speed. (compared with 1999) (Note 1) • Doubling the number of bus passengers (from current 13.4 to 26.9 persons/vehicle). • Passengers increase as shift from passenger cars.
LDV • 20% improvement in motor vehicle travel speed. (compared with 1999) (Note 1) • Increasing average loading rate 3 times (from current 17.8% to 53.4%). • 70% reduction in ton-km within Aichi Prefecture. • 70% reduction in ton-km passing through, departing from, or arriving in Aichi Prefecture.
Motor vehicles
HDV • 20% improvement in motor vehicle travel speed. (compared with 1999) (Note 1) • Increasing average loading rate 1.5 times (from current 50% to 75%). • 70% reduction in tron-km within Aichi Prefecture. • 90% reduction in ton-km passing through, departing from, or arriving in Aichi Prefecture.
Railways • Transport demand increased by the amount shifted from motor vehicles.
Notes: 1. Based on the assumed improvement in traveling speed due to congestion mitigation by traffic management
and reduction in traffic demand of bus, passenger and freight vehicle. 2. The amounts of all reductions and shifts in transport demand are based on that under the BAU scenario,
while the shift of passengers is based on the demand after the 20% reduction.

140 EST Case Studies and Perspectives in Japan
<Passenger transport>
Cutting the number of trips including commuting, conferences and meetings taking advantages of telecommunication technologies, for example, e-mail and video conferencing systems. To improve passenger carrying efficiency by popularization of common ownership and use of cars.
Short-distance trips within Nagoya city (such trips under 5km as shopping and commuting) are composed, in principle of cycling and walking.
For the shift from passenger cars to rail-based public transport, more dense rail-network be constructed in and around Aichi Prefecture.
<Freight transport>
To reduce freight vehicle traffic volume within, passing through, departing from, or arriving in Aichi Prefecture drastically (70-90%). To review transaction methods among shippers (time-specified delivery service) and improve load efficiency based on combined collection and delivery
(3) EST3 (combination) Scenario EST1 scenario includes a large-scale effort to make fuel cell vehicles and the use of renewable energy popular. In the EST2 scenario, emissions are reduced via a large-scale shift from motor vehicles to railways and improvements in transport efficiency. However, both scenarios assume quite extreme changes. Therefore, EST3 combines both scenarios to attain the target with more modest changes. The assumptions are shown in Table 16. The target on NOx reduction is such a harshly restrictive condition that its satisfaction amounts to the automatic fulfillment of other substances.

Yuichi Moriguchi and Hirokazu Kato 141
Table 16. Assumptions on technological developments and transport activities in EST3 Scenario (Aichi Prefecture)
Mode of transport Technological developments Transport activities
All modes • 10% reduction in passenger-km Passenger cars
• New short and long-term regulations. • 65% conversion to fuel cell vehicles
• Doubling the average occupancy of passenger car (from current 1.46 to 2.92 persons/ vehicle). • Shifting 10% of passenger-km within Nagoya to railways and 10% to buses.
Buses • New short and long-term regulations. • 30% conversion to fuel cell vehicles
• Doubling the number of bus passengers (from current 13.4 to 26.9 persons/vehicle). • Passengers increased by the amount shifted from passenger cars.
LDV • 75% conversion to fuel cell vehicles and 25% to CNG vehicles
• Doubling the average loading rate (from current 17.8% to 35.6%). • 5% reduction in ton-km within Aichi Prefecture. • 20% reduction in ton-km departing from or arriving in Aichi Prefecture. • 20% reduction in ton-km passing through Aichi Prefecture.
Motor vehicles
HDV • Same as for LDVs. • Increasing average loading rate 1.5 times (from current 50% to 75%). • 10% reduction in ton-km within Aichi Prefecture. • 20% reduction in ton-km passing through, departing from, or arriving in Aichi Prefecture. • 20% reduction in ton-km passing through Aichi Prefecture.
Passenger • 60% reduction in emission factor of CO2 and NOx
• Passengers increased by the amount shifted from passenger cars.
Railways
Freight • 60% reduction in emission factor of CO2 and NOx.
Note: The amounts of all reductions and shifts in transport demand are based on those under the BAU scenario, while the shifts of passengers modal shares are based on reduced demand by 10%.

142 EST Case Studies and Perspectives in Japan
4. Discussions and conclusions -The perspectives to mitigate environmental loads from transport activities-
4.1 Discussions
This paper is based on the study, which was carried out under the auspices of a governmental institution within a severe time constraint before the EST Nagoya Conference. Discussions on policy implication of the study were not included into the formal report to the Conference, as it was premature and misleading, considering the tremendous gap between the practical level of formal commitments of emission reduction and the drastic targets applied in this study. Nevertheless, it seems worthwhile to summarize the discussions, though they are informal, during and after the study. First of all, adoption of the back-casting approach itself provided us with good opportunity to go through the very different process of discussion, which was sometimes controversial but mostly inspiring, compared to the conventional forecast-based studies. However, it was crucial to adopt the targets of relative emission reduction at the same level as those in previous OECD case studies. This process should have been more carefully designed, as the same target in relative term was too stringent for Japan to achieve. As the feasibility to realize the backcasted scenarios seemed to be low, implementation of further steps of the case study, such as designing policy packages and assessing socio-economic impacts, became more controversial. Major points of preliminary discussion related to these uncompleted steps are as follows.
For EST1, incentives including financial mechanisms to activate the developments and the wide spread use of promising technologies are essential
For EST2, there found no single effective measure, but individual policy measures should be applied according to the contents.
Combination of policy measures (policy mix) should be well designed. Though only roughly estimated, socio-economic impacts to realize EST scenarios will be
significant. For example, infrastructures to support the scenarios (typically hydrogen supply for FCV in EST1, expansion of railway network for EST2 and EST3) require drastic changes in public investment.
4.2 Conclusions
In this paper, the process, protocols and results of the EST Case Study in Japan are explained. The main objective of this case study is to provide an opportunity to discuss long-term perspectives on future transport related environmental policies by taking into account the gap between the BAU scenario and EST scenarios. Lack of discerning a visible goal in the examination of transport related environmental policies would consequently be negative in the process of consideration. First, the amounts of environmental loads under the BAU scenario in the target year 2030 are forecasted. CO2 emission increases by around 10% in Japan and is almost stable in Aichi prefecture. Also, NOx, PM and HC are forecasted in Aichi prefecture. Enforcement of already determined strict regulations will considerably reduce these emissions. NOx and HC emission in 2030 is about half of that in 1990 and PM emissions are about one quarter.

Yuichi Moriguchi and Hirokazu Kato 143
The targets for Japan and Aichi prefecture are set in compliance with former case studies for OECD countries. (It is extremely strict, for example, 80% reduction against total CO2 emissions in 1990). To achieve these targets, three types of EST scenarios are proposed. EST1 is a high technology scenario, EST2 is a transport mobility change scenario, and EST3 is a combination scenario of both technological developments and changes in transport activities. Requirements of countermeasures for satisfying each scenario are calculated utilizing a “back casting” approach. The results indicate that achieving targets via only EST1 and EST2 is completely unfeasible. Even in the EST3 scenario, the requirements must include strong measures in light of current trends such as making fuel cell vehicles significantly popular and reduction of freight transport demand, the scenario still warrants further discussion. The regional case study for Aichi Prefecture could reflect region-specific characteristics to some extent, but more micro-scaled (such as at municipal level) case study will be more suitable to incorporate region-specific factors such as feasibility of modal shift from cars to railways. This Japanese Case Study examined the possibility of EST at a national level and a regional level, while stressing the need to assess possible alternative scenarios and further discussions for the development of them. Considering various scenarios for the examination mentioned and Japanese current transport related environmental policies, it is essential that the following contentions should be discussed vigorously among prominent figures representing different fields; how the long-term goal concerning transport related environmental policies can be established, what measures need to be pushed forward for approaching the goal, what repercussions these measures would have on socio-economy, and so on.
Acknowledgment
The authors are indebted to Dr.Keisuke Matsuhashi, Dr.Yuki Kudo (National Institute for Environmental Studies), Dr. Yoichi Sakurada, Mr.Kazuyuki Tsuchiya, Mr. Kazuhiko Masumoto, and Mr. Tetsuo Komeiji (Mitsubishi Research Institute Inc.) and all members of the EST Japanese study team for their contributions through collaboration and discussion for this Case Study.
References
Council for Transportation Policy (2000): About the fundamental direction of a synthetic traffic policy in the beginning of the 21st century -innovation of the mobility urged to a change of economic society, Council for Transport Policy Report No. 20, Tokyo, (in Japanese. English summary is available from http://www.mlit.go.jp/english/policy_planning/load/index.html)
Economic Council (1999): Ideal Socio-economy and Policies for Economic Rebirth, Cabinet Decision on July 8th, 1999, Tokyo (in Japanese).
Institute for Transport Policy Studies (2001): Survey on Long-term Estimates for Transport Demand, ITPS, Tokyo, (in Japanese)

144 EST Case Studies and Perspectives in Japan
Ministry of Land, Infrastructure and Transport (2001a): The Survey on Transport Energy 2000, Printing Bureau of the Ministry of Finance, Tokyo, (in Japanese).
Ministry of Land, Infrastructure and Transport (2001b): Inter-regional flow data of freight and passenger, 1999, ITPS, Tokyo, (in Japanese)
Ministry of Land, Infrastructure and Transport (2001c): Road traffic census1999, Japan Society for Transport Engineering, Tokyo, (in Japanese)
Ministry of Land, Infrastructure and Transport (2002a): The Survey on Transport Energy 2001, Printing Bureau of the Ministry of Finance, Tokyo, (In Japanese)
Ministry of Land, Infrastructure and Transport (2002b): Riku-un Tokei Yoran (Land transport statistics directory), Automobile Business Association of Japan, Tokyo, (in Japanese)
Ministry of Land, Infrastructure and Transport (2002c): Annual Statistical Report on Motor Vehicle Transport, vol. 39, MLIT, Tokyo, (in Japanese).
Ministry of Land, Infrastructure and Transport (2002d): Railway Statistics Yearbook, MLIT, Tokyo, (in Japanese).
National Institute of Population and Social Security Research (1997): Population Projections for Japan, January 199”, NIPSSR, Tokyo, (in Japanese).
OECD (2002): OECD Guidelines towards Environmentally Sustainable Transport, OECD Publications, Paris.
OECD (2003): Report on the International Conference on Environmentally Sustainable Transport in the Asian Region, Working Party on National Environmental Policy and Working Group on Transport, OECD, Paris.

Yuichi Moriguchi and Hirokazu Kato 145
Appendix:
Table Appendix 1. Comparison of transport demands, emission factors and emission amounts for 1990, BAU and EST scenarios
Passengers FreightTransport demand Transport demand
(Unit: billion passenger- km / year) (Unit: billion ton- km / year)Mode 1990 BAU EST1 EST2 EST3 Mode 1990 BAU EST1 EST2 EST3
Air 52 102 102 20 92 Air 1 1 1 1 1Rail 387 400 400 879 400 Rail 27 26 26 97 26Vehicle 663 887 887 35 639 LDV 10 11 11 2 10Water 6 5 5 3 5 HDV 236 299 299 45 269Total 1108 1395 1395 938 1135 Water 245 236 236 165 236
Total 518 573 573 310 542
Emission factor(Unit: kg CO2 / passenger- km ) (Unit: kg CO2 / ton- km )
Mode 1990 BAU EST1 EST2 EST3 Mode 1990 BAU EST1 EST2 EST3Air 0.107 0.102 0.022 0.102 0.055 Air 1.429 1.357 0.292 1.357 0.730Rail 0.018 0.017 0.004 0.017 0.007 Rail 0.021 0.020 0.004 0.020 0.009Vehicle 0.143 0.115 0.017 0.057 0.012 LDV 4.389 3.852 0.669 1.585 0.632Water 0.749 1.342 0.537 1.342 0.939 HDV 0.191 0.172 0.029 0.114 0.026
Water 0.036 0.040 0.016 0.040 0.028CO2 emissions
(Unit: million ton CO2) (Unit: million ton CO2)Mode 1990 BAU EST1 EST2 EST3 Mode 1990 BAU EST1 EST2 EST3
Air 6 10 2 2 5 Air 1 2 0 1 1Rail 7 7 1 15 3 Rail 1 1 0 2 0Vehicle 95 102 15 2 8 LDV 43 42 7 3 6Water 5 7 3 4 4 HDV 45 51 9 5 7Total 112 126 21 23 20 Water 9 10 4 7 7
Total 98 106 20 18 21Passengers+Freight
(Unit: million ton CO2)Mode 1990 BAU EST1 EST2 EST3
Passenger 111.9 126.1 21.3 23.1 20.4Freight 98.3 105.5 20.3 18.4 20.9Total 210.2 231.6 41.6 41.4 41.3