essqr mar 2013 10 key facts and figures_en
DESCRIPTION
EU unemployment analysisTRANSCRIPT
Social Europe
EU Employment and Social Situation Quarterly Review March 2013
10 Key facts and figures EMPL A1-A2
Social Europe
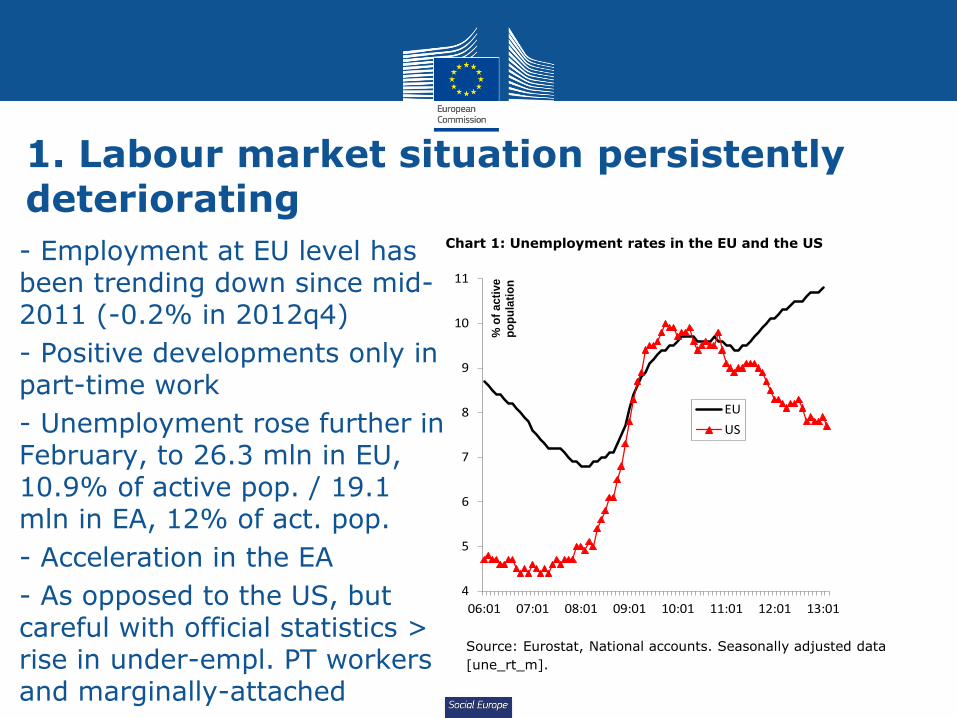
1. Labour market situation persistently deteriorating
• - Employment at EU level has been trending down since mid-2011 (-0.2% in 2012q4)
• - Positive developments only in part-time work
• - Unemployment rose further in February, to 26.3 mln in EU, 10.9% of active pop. / 19.1 mln in EA, 12% of act. pop.
• - Acceleration in the EA
• - As opposed to the US, but careful with official statistics > rise in under-empl. PT workers and marginally-attached
Chart 1: Unemployment rates in the EU and the US
Chart 4: Real GDP and employment in EU Member States (y-o-y)
Source: Eurostat, National accounts. Seasonally adjusted data
[une_rt_m].
4
5
6
7
8
9
10
11
06:01 07:01 08:01 09:01 10:01 11:01 12:01 13:01
EU
US
% o
f a
cti
ve
p
op
ula
tio
n
Social Europe
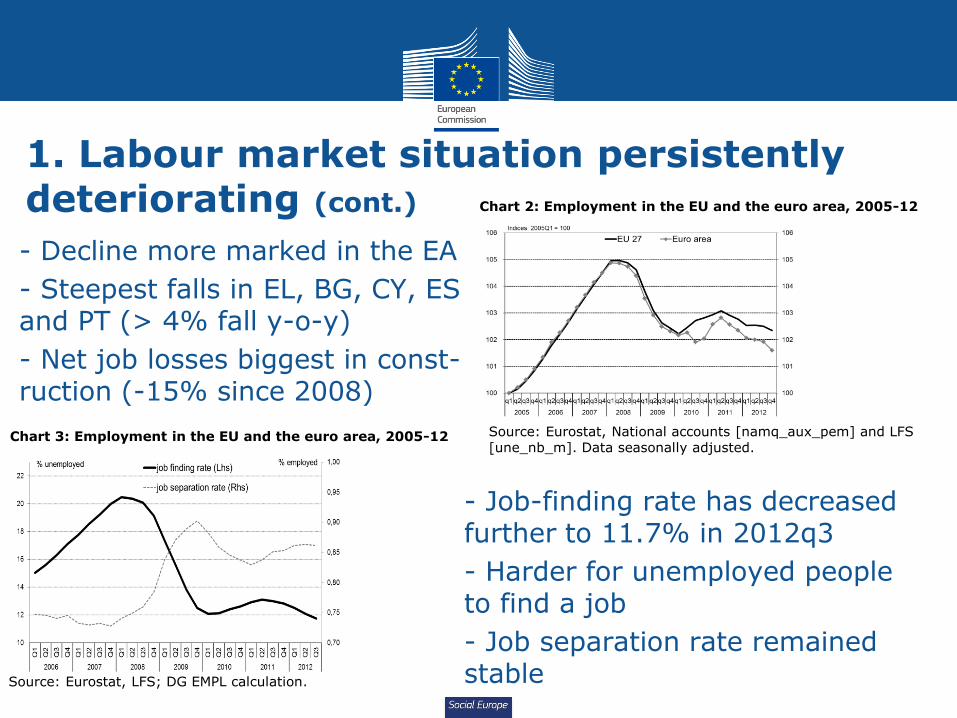
1. Labour market situation persistently deteriorating (cont.)
• - Decline more marked in the EA
• - Steepest falls in EL, BG, CY, ES and PT (> 4% fall y-o-y)
• - Net job losses biggest in const-ruction (-15% since 2008)
Chart 2: Employment in the EU and the euro area, 2005-12
Chart 4: Real GDP and employment in EU Member States (y-o-y)
Source: Eurostat, National accounts [namq_aux_pem] and LFS [une_nb_m]. Data seasonally adjusted.
Chart 3: Employment in the EU and the euro area, 2005-12
Source: Eurostat, LFS; DG EMPL calculation.
• - Job-finding rate has decreased further to 11.7% in 2012q3
• - Harder for unemployed people to find a job
• - Job separation rate remained stable
Social Europe
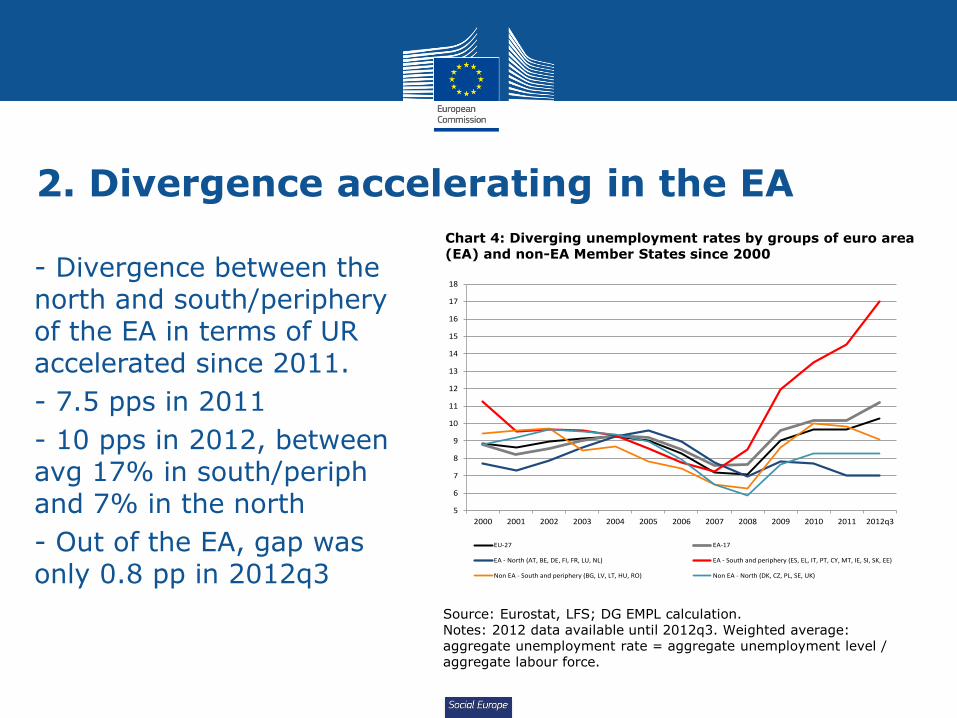
2. Divergence accelerating in the EA
• - Divergence between the north and south/periphery of the EA in terms of UR accelerated since 2011.
• - 7.5 pps in 2011
• - 10 pps in 2012, between avg 17% in south/periph and 7% in the north
• - Out of the EA, gap was only 0.8 pp in 2012q3
Chart 4: Diverging unemployment rates by groups of euro area (EA) and non-EA Member States since 2000
Source: Eurostat, LFS; DG EMPL calculation. Notes: 2012 data available until 2012q3. Weighted average: aggregate unemployment rate = aggregate unemployment level / aggregate labour force.
5
6
7
8
9
10
11
12
13
14
15
16
17
18
2000 2001 2002 2003 2004 2005 2006 2007 2008 2009 2010 2011 2012q3
EU-27 EA-17
EA - North (AT, BE, DE, FI, FR, LU, NL) EA - South and periphery (ES, EL, IT, PT, CY, MT, IE, SI, SK, EE)
Non EA - South and periphery (BG, LV, LT, HU, RO) Non EA - North (DK, CZ, PL, SE, UK)
Social Europe
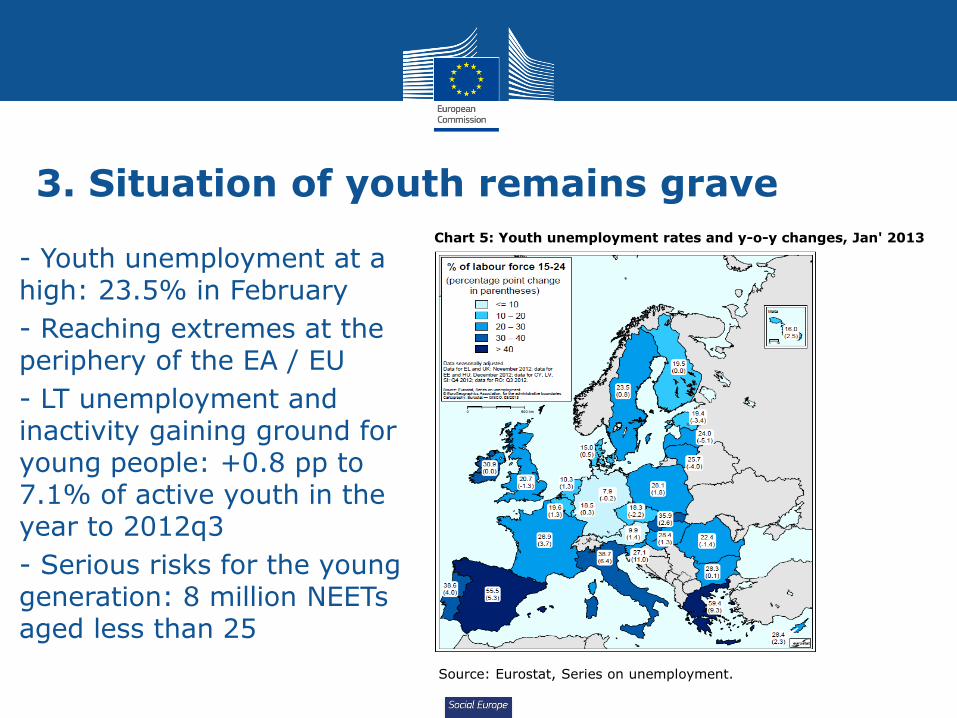
3. Situation of youth remains grave
• - Youth unemployment at a high: 23.5% in February
• - Reaching extremes at the periphery of the EA / EU
• - LT unemployment and inactivity gaining ground for young people: +0.8 pp to 7.1% of active youth in the year to 2012q3
• - Serious risks for the young generation: 8 million NEETs aged less than 25
Chart 5: Youth unemployment rates and y-o-y changes, Jan' 2013
Source: Eurostat, Series on unemployment.
Social Europe
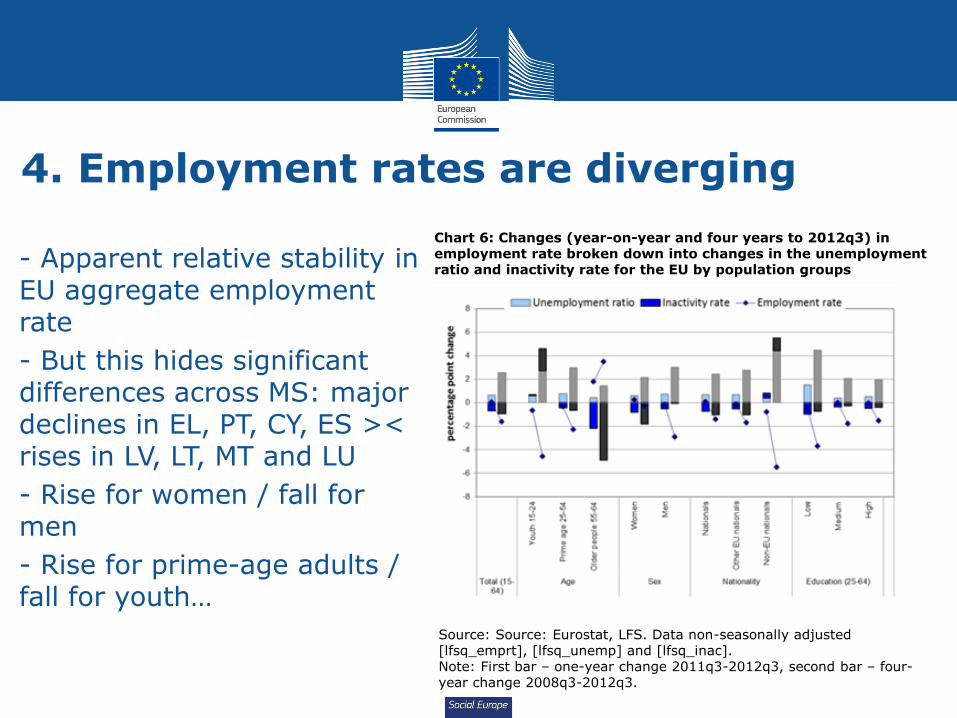
4. Employment rates are diverging
• - Apparent relative stability in EU aggregate employment rate
• - But this hides significant differences across MS: major declines in EL, PT, CY, ES >< rises in LV, LT, MT and LU
• - Rise for women / fall for men
• - Rise for prime-age adults / fall for youth…
Chart 6: Changes (year-on-year and four years to 2012q3) in employment rate broken down into changes in the unemployment ratio and inactivity rate for the EU by population groups
Source: Source: Eurostat, LFS. Data non-seasonally adjusted [lfsq_emprt], [lfsq_unemp] and [lfsq_inac]. Note: First bar – one-year change 2011q3-2012q3, second bar – four-year change 2008q3-2012q3.
Social Europe
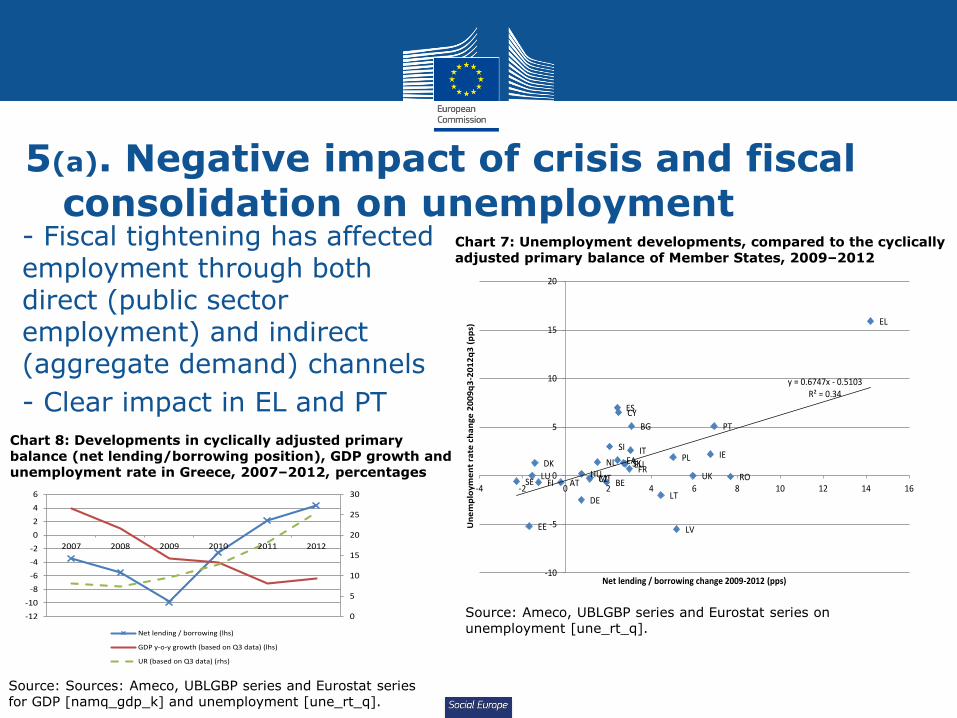
5(a). Negative impact of crisis and fiscal consolidation on unemployment
• - Fiscal tightening has affected employment through both direct (public sector employment) and indirect (aggregate demand) channels
• - Clear impact in EL and PT
Chart 7: Unemployment developments, compared to the cyclically adjusted primary balance of Member States, 2009–2012
Source: Ameco, UBLGBP series and Eurostat series on unemployment [une_rt_q].
EUEA
BE
BG
CZ
DK
DE
EE
IE
EL
ES
FR
IT
CY
LV
LT
LU HUMT
NL
AT
PL
PT
RO
SI
SK
FISEUK
y = 0.6747x - 0.5103R² = 0.34
-10
-5
0
5
10
15
20
-4 -2 0 2 4 6 8 10 12 14 16
Un
em
plo
ym
en
t ra
te c
ha
ng
e 2
00
9q
3-2
01
2q
3 (
pp
s)
Net lending / borrowing change 2009-2012 (pps)
0
5
10
15
20
25
30
-12
-10
-8
-6
-4
-2
0
2
4
6
2007 2008 2009 2010 2011 2012
Net lending / borrowing (lhs)
GDP y-o-y growth (based on Q3 data) (lhs)
UR (based on Q3 data) (rhs)
Chart 8: Developments in cyclically adjusted primary balance (net lending/borrowing position), GDP growth and unemployment rate in Greece, 2007–2012, percentages
Source: Sources: Ameco, UBLGBP series and Eurostat series for GDP [namq_gdp_k] and unemployment [une_rt_q].
Social Europe
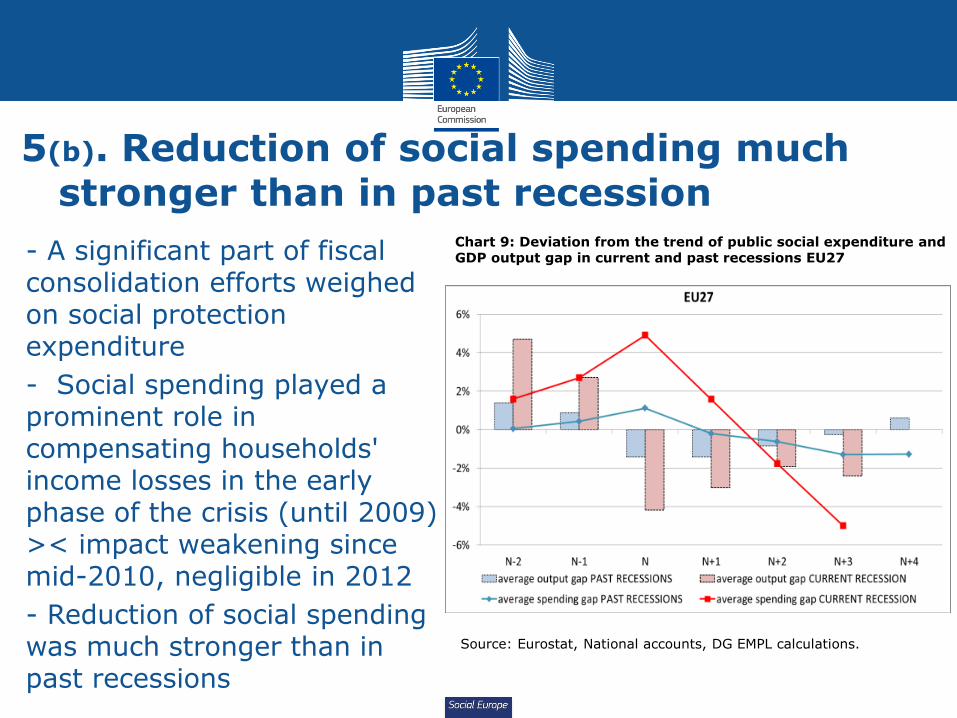
5(b). Reduction of social spending much stronger than in past recession
• - A significant part of fiscal consolidation efforts weighed on social protection expenditure
• - Social spending played a prominent role in compensating households' income losses in the early phase of the crisis (until 2009) >< impact weakening since mid-2010, negligible in 2012
• - Reduction of social spending was much stronger than in past recessions
Chart 9: Deviation from the trend of public social expenditure and GDP output gap in current and past recessions EU27
Source: Eurostat, National accounts, DG EMPL calculations.
Social Europe
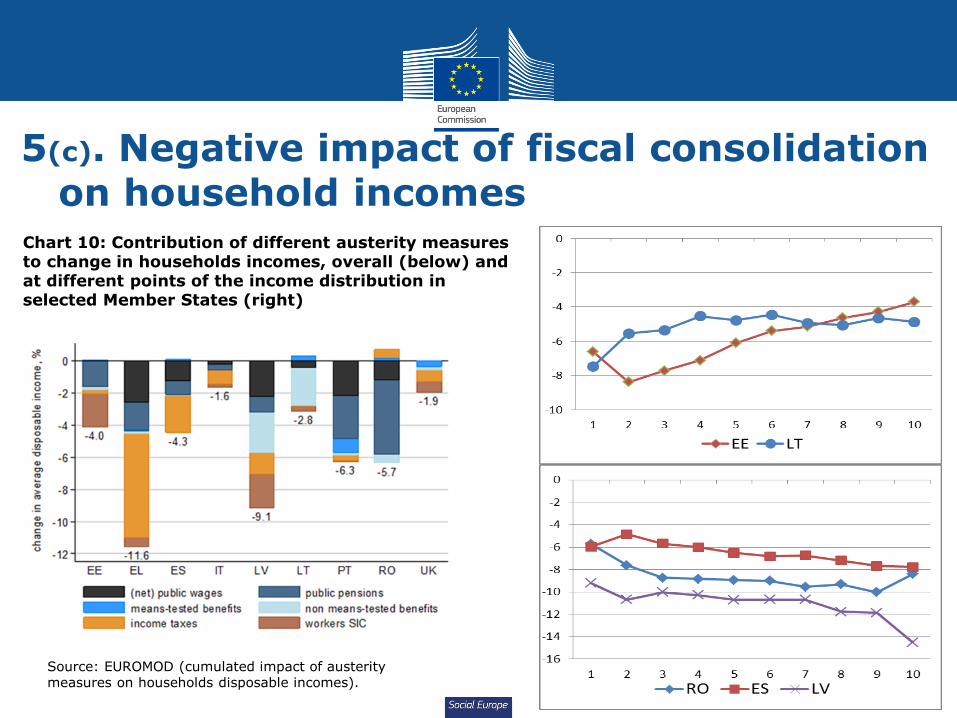
5(c). Negative impact of fiscal consolidation on household incomes
Chart 10: Contribution of different austerity measures to change in households incomes, overall (below) and at different points of the income distribution in selected Member States (right)
Source: EUROMOD (cumulated impact of austerity measures on households disposable incomes).
Social Europe
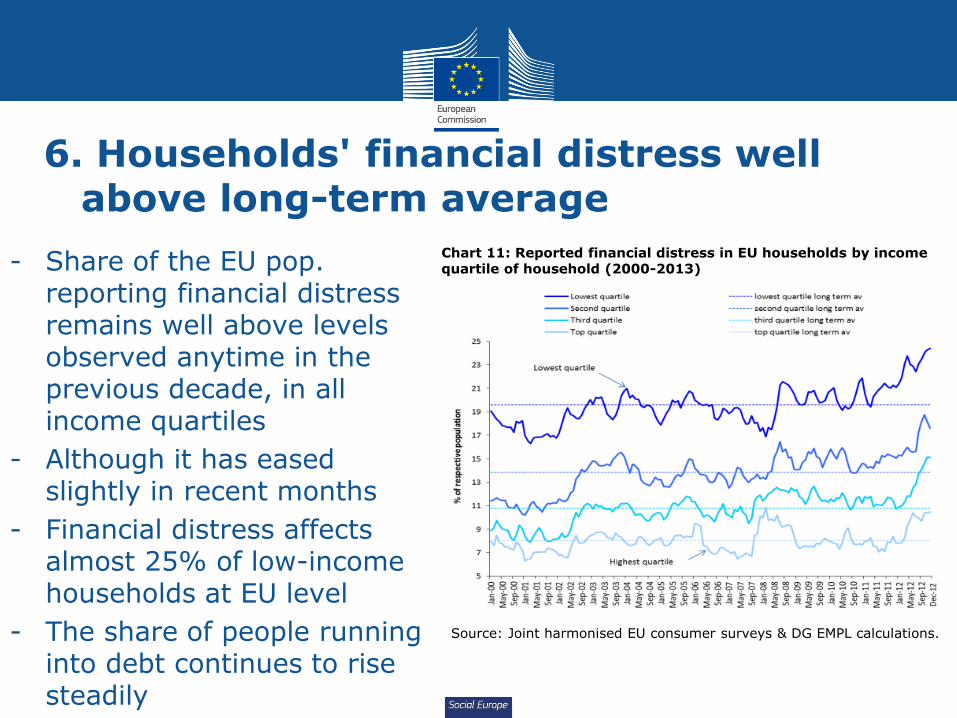
6. Households' financial distress well above long-term average
- Share of the EU pop. reporting financial distress remains well above levels observed anytime in the previous decade, in all income quartiles
- Although it has eased slightly in recent months
- Financial distress affects almost 25% of low-income households at EU level
- The share of people running into debt continues to rise steadily
• Chart 11: Reported financial distress in EU households by income quartile of household (2000-2013)
Source: Joint harmonised EU consumer surveys & DG EMPL calculations.
Social Europe
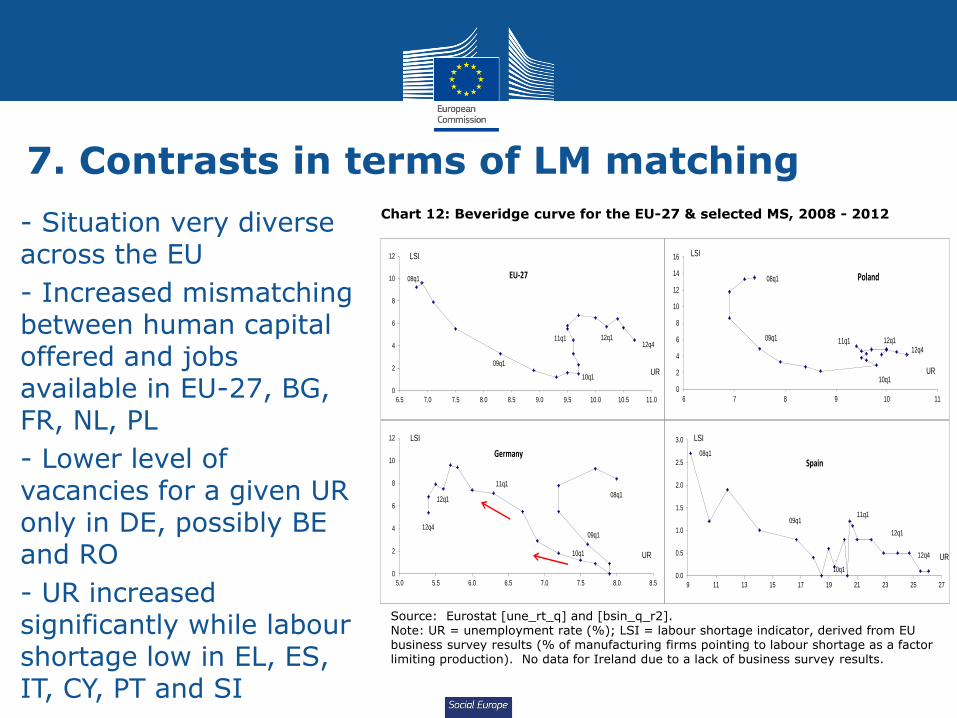
7. Contrasts in terms of LM matching Chart 12: Beveridge curve for the EU-27 & selected MS, 2008 - 2012
Source: Eurostat [une_rt_q] and [bsin_q_r2]. Note: UR = unemployment rate (%); LSI = labour shortage indicator, derived from EU business survey results (% of manufacturing firms pointing to labour shortage as a factor limiting production). No data for Ireland due to a lack of business survey results.
• - Situation very diverse across the EU
• - Increased mismatching between human capital offered and jobs available in EU-27, BG, FR, NL, PL
• - Lower level of vacancies for a given UR only in DE, possibly BE and RO
• - UR increased significantly while labour shortage low in EL, ES, IT, CY, PT and SI
0
2
4
6
8
10
12
6.5 7.0 7.5 8.0 8.5 9.0 9.5 10.0 10.5 11.0
UR
LSI
08q1
09q1
10q1
11q1 12q1
EU-27
12q4
0
2
4
6
8
10
12
14
16
6 7 8 9 10 11
UR
LSI
08q1
09q1
10q1
11q1 12q1
Poland
12q4
0
2
4
6
8
10
12
5.0 5.5 6.0 6.5 7.0 7.5 8.0 8.5
UR
LSI
08q1
09q1
10q1
11q1
12q1
Germany
12q4
0.0
0.5
1.0
1.5
2.0
2.5
3.0
9 11 13 15 17 19 21 23 25 27
UR
LSI
08q1
09q1
10q1
11q1
12q1
Spain
12q4
Social Europe
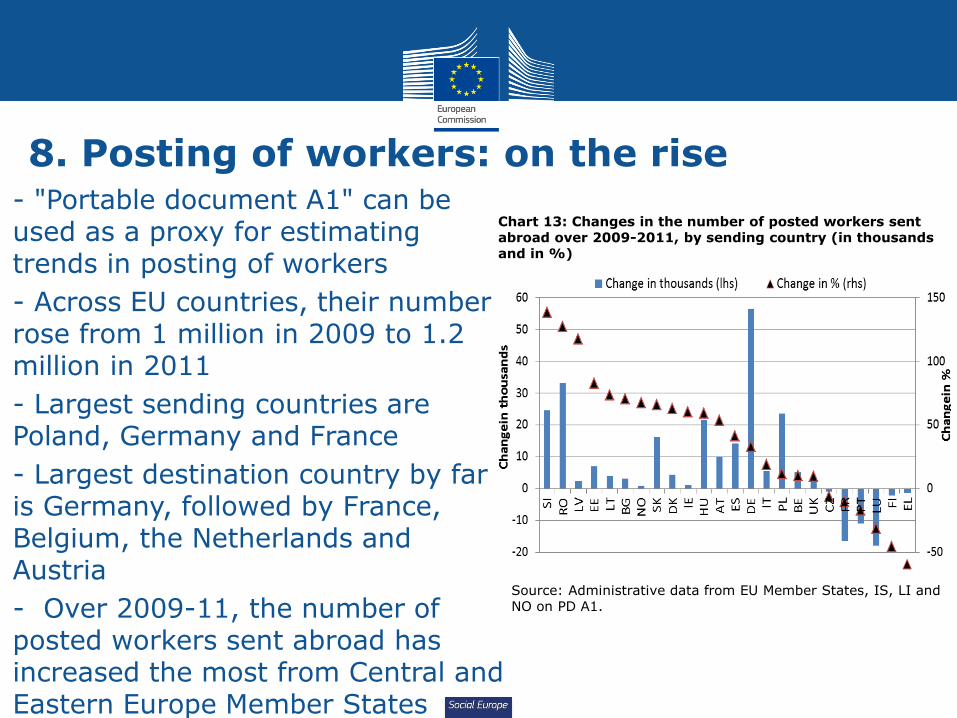
8. Posting of workers: on the rise
Chart 13: Changes in the number of posted workers sent abroad over 2009-2011, by sending country (in thousands and in %)
Source: Administrative data from EU Member States, IS, LI and NO on PD A1.
• - "Portable document A1" can be used as a proxy for estimating trends in posting of workers
• - Across EU countries, their number rose from 1 million in 2009 to 1.2 million in 2011
• - Largest sending countries are Poland, Germany and France
• - Largest destination country by far is Germany, followed by France, Belgium, the Netherlands and Austria
• - Over 2009-11, the number of posted workers sent abroad has increased the most from Central and Eastern Europe Member States
Social Europe
9. Labour market outlook remains bleak
• - As a result of GDP contraction in the last quarter of 2012, the employment outlook is very bleak
• - Unemployment foreseen to remain at a very high level up until 2014
• - These prospects are, however, not fully reflected in labour market players' recorded expectations: • Employment prospects in industry in the EU have remained slightly above their
long-term average in recent months, showing that managers in this sector expect employment to stabilise, although prospects for services and construction remain particularly depressed
• European consumers’ expectations of unemployment are slightly less pessimistic, but remain significantly higher than their long-term average at EU aggregate level
Social Europe
10. Demographic trends: crisis has negatively affected fertility recovery
• - Since 2009 fertility has stopped its recent recovery
• - The mean age of women at childbirth has kept rising and has reached the 30-year threshold
• - Life expectancy continued to increase and reached 77.4 years for men and 83.1 for women
• - Migration has decreased from its 2007 peak but even in 2011 the EU posted a net increase of ½ million, that is 1 per thousand
• - Citizenship acquisitions are higher, at almost one million
• >> The challenges for EU labour markets from a shrinking and ageing workforce clearly remain!
Social Europe
Thank you for your attention!
Please consult our website to download the report, the press release, the FAQ and the Special Supplement
(URL: http://ec.europa.eu/social/main.jsp?langId=en&catId=89&newsId=1852&furtherNews=yes&preview=cHJldmlld0VtcGxQb3J0YWwhMjAxMjAyMTU=)