essexville-hampton public schools bush...
TRANSCRIPT

Essexville-Hampton Public Schools BUSH ELEMENTARY SCHOOL
800 NEBOBISH AVENUE ESSEXVILLE, MICHIGAN 48732
(989) 894-9760 Fax: (989) 894-9730
Accredited by the North Central Association of Colleges and Schools
Mr. Shannon Flippin - Principal
August 16, 2013
Dear Parents and Community Members:
We are pleased to present you with the Annual Education Report (AER) which provides key information on the 2012-2013 educational progress for Bush Elementary School. The AER addresses the complex reporting information required by federal and state laws. The school’s report contains information about student assessment, accountability and teacher quality. If you have any questions about the AER, please contact Shannon Flippin, principal, for assistance.
The AER is available for you to review electronically by visiting the following web site www.e-hps.net or you may review a copy from the principal’s office at your child’s school.
The state has identified some schools with the status of Reward, Focus or Priority. A Reward school is one that is outperforming other schools in achievement, growth, or is performing better that other schools with a similar student population. A Focus school is one that has a large achievement gap in 30% of its student achievement scores. A Priority school is one whose achievement and growth is in the lowest 5% of all schools in the state. Our school has not been given one of these labels.
The key challenges for our district overall are in the areas of math, science and writing as you will see in the data presented in the following pages. We have invested time in the past year modifying our math curriculum, adopting a new Kindergarten through eighth grade math series and adding new strategies and activities into our school improvement plan. Initiatives in the areas of informational reading, argument writing and technology are being undertaken to close achievement gaps.
We appreciate the continued support of parents, staff and our community in this effort. Due to the grade levels in our building, we do not administer the MEAP testing program, but the success of our curriculum is evident as the students advance to the next grade levels. We also test our students in District Writing and Reading assessments, DIBELS, and the easyCBM Math tests, administered in both the fall and the spring to measure academic growth.

State law requires that we also report additional information:
1. Bush Elementary is a Young 5’s, Kindergarten and 1st grade building. We completed the school year with 40 Young 5’s students, 103 Kindergarten students, and 116 1st graders for a total of 259 students. We had one retention in Kindergarten. All students in those grade levels are assigned to Bush Elementary. For the 2012-2013 school year, we have implemented all day programs for both Kindergarten and Young 5’s students. Our students are provided extra academic support if needed through our literacy and math specialists who work with students in small group settings as well as one on one. We also offer an after-school tutoring program to improve reading and math skills. In the 1st grade, we begin the Accelerated Reader program, mid-year. Our students are very motivated to read books and improve their reading skills.
2. Bush Elementary participates in the AdvancEd/North Central Accreditation school improvement process. This past November, we participated in a Quality Assurance Review visit and we received high marks for our educational programs and school improvement process. The district has made the transition to the District Accreditation process, with the revised school improvement plan being implemented in the 2013-14 school year.
3. W.R. Bush is also “home” to the district’s Day Care and Pre-school programs for our community. On average, our Day Care hosts 25-30 students daily and between 50-70 students in the after school program. We also host a “Day Care Summer Camp” experience which has grown each year; we currently have 93 “campers” in the themed program, “Nature Studies.”
4. Bush Elementary utilizes the Michigan Common Core Curriculum to establish the academic skills students need to learn for each grade level. Implementation of curriculum is facilitated at the district level in coordination with the Bay-Arenac Intermediate School District. Information about the curriculum can be found on the Michigan Department of Education website, or by contacting the principal. Bush students benefit from an excellent learning environment, a highly qualified and caring faculty and staff, and many special classes and activities ranging from vocal music to Media Center story time, physical education and computer lab activities. This summer, we are pleased to offer a “Jump Start” two-week summer school program in August, prior to the start of the new school year.
5. At our fall parent-teacher conferences, 96% of parents were in attendance. At our spring conferences for at-risk students academically, we saw 76% of our families. In addition to parent-teacher conferences, parent communication folders are sent home regularly to involve parents in their child’s education.

Essexville-Hampton Public Schools BUSH ELEMENTARY SCHOOL
800 NEBOBISH AVENUE ESSEXVILLE, MICHIGAN 48732
(989) 894-9760 Fax: (989) 894-9730
Accredited by the North Central Association of Colleges and Schools
Another special feature of our building is our outstanding parent volunteer group which helps to enrich our students’ experiences while they are here. Our partners provide tremendous support during our annual fundraiser; they plan special events for both students and faculty, chaperone field trips, help with recycling projects, and generally “lend a hand” whenever it is needed. Working together as a school community has enabled us to establish an environment which escalates student enthusiasm for all aspects of the school day. At W.R. Bush Elementary we sincerely believe in the concept that when all of us work together to help our students, we create powerful relationships which support learning and develop self-esteem. Sincerely, Shannon Flippin Principal

12/11/2013
Annual Education ReportW.R. Bush Elementary School
Michigan Educational Assessment Program (MEAP)
Subject Grade TestingGroup
School Year % StudentsTested
State %StudentsProficient
District %StudentsProficient
School %StudentsProficient
% Advanced(Level 1)
% Proficient(Level 2)
% PartiallyProficient(Level 3)
% NotProficient(Level 4)
No Data to Display
Page 1 of A service of the Center for Educational Performance and Information20

12/11/2013
Annual Education ReportW.R. Bush Elementary School
Michigan Merit Examination (MME)
Subject Grade TestingGroup
School Year % StudentsTested
State %StudentsProficient
District %StudentsProficient
School %StudentsProficient
% Advanced(Level 1)
% Proficient(Level 2)
% PartiallyProficient(Level 3)
% NotProficient(Level 4)
No Data to Display
Page 2 of A service of the Center for Educational Performance and Information20

12/11/2013
Annual Education ReportW.R. Bush Elementary School
Michigan Educational Assessment Program Access (MEAP - Access)
Subject Grade Testing Group School Year % StudentsTested
State %StudentsProficient
District %StudentsProficient
School %StudentsProficient
% Exceeded % Met % Progressing
No Data to Display
Page 3 of A service of the Center for Educational Performance and Information20

12/11/2013
Annual Education ReportW.R. Bush Elementary School
MI-Access Functional Independence
Subject Grade Testing Group School Year % StudentsTested
State %StudentsProficient
District %StudentsProficient
School %StudentsProficient
% Surpassed(Level 1)
% Attained(Level 2)
% Emerging(Level 3)
No Data to Display
Page 4 of A service of the Center for Educational Performance and Information20

12/11/2013
Annual Education ReportW.R. Bush Elementary School
MI-Access Supported Independence
Subject Grade Testing Group School Year % StudentsTested
State %StudentsProficient
District %StudentsProficient
School %StudentsProficient
% Surpassed(Level 1)
% Attained(Level 2)
% Emerging(Level 3)
No Data to Display
Page 5 of A service of the Center for Educational Performance and Information20

12/11/2013
Annual Education ReportW.R. Bush Elementary School
MI-Access Participation
Subject Grade Testing Group School Year % StudentsTested
State %StudentsProficient
District %StudentsProficient
School %StudentsProficient
% Surpassed(Level 1)
% Attained(Level 2)
% Emerging(Level 3)
No Data to Display
Page 6 of A service of the Center for Educational Performance and Information20

12/11/2013
Annual Education ReportW.R. Bush Elementary School
Accountability Details Subject Data
Testing Group Location Subject % Tested Total(Goal95%)
% Proficient forAccountability*
All Students Statewide Mathematics 98.7% 58.2%
Bottom 30% Statewide Mathematics 11.2%
American Indian Statewide Mathematics 98.5% 48.4%
African American Statewide Mathematics 96.9% 32.7%
Asian Statewide Mathematics 99.4% 81.5%
Hispanic of Any Race Statewide Mathematics 98.6% 45.9%
Native Hawaiian or OtherPacific Islander
Statewide Mathematics 97.4% 64.9%
Two or More Races Statewide Mathematics 99.2% 55.9%
White Statewide Mathematics 99.2% 64.4%
Economically Disadvantaged Statewide Mathematics 98.2% 43.7%
English Language Learners Statewide Mathematics 98.9% 36.9%
Students With Disabilities Statewide Mathematics 97.8% 32.5%
All Students District Mathematics 99.8% 63.7%
Bottom 30% District Mathematics 8.9%
American Indian District Mathematics
African American District Mathematics < 30 < 30
Asian District Mathematics < 30 < 30
Hispanic of Any Race District Mathematics < 30 < 30
Native Hawaiian or OtherPacific Islander
District Mathematics < 30 < 30
Two or More Races District Mathematics < 30 < 30
White District Mathematics 99.8% 65.1%
Economically Disadvantaged District Mathematics 100% 55.9%
English Language Learners District Mathematics < 30
Students With Disabilities District Mathematics 100% 35.3%
All Students Statewide Reading 99% 83.1%
Bottom 30% Statewide Reading 51.3%
American Indian Statewide Reading 98.8% 79.7%
African American Statewide Reading 97.3% 67.9%
Asian Statewide Reading 100.3% 90.1%
Hispanic of Any Race Statewide Reading 99.2% 77%
Page 7 of A service of the Center for Educational Performance and Information20

12/11/2013
Annual Education ReportW.R. Bush Elementary School
Accountability Details Subject Data
Testing Group Location Subject % Tested Total(Goal95%)
% Proficient forAccountability*
Native Hawaiian or OtherPacific Islander
Statewide Reading 97.4% 85.7%
Two or More Races Statewide Reading 99.4% 83.6%
White Statewide Reading 99.4% 86.9%
Economically Disadvantaged Statewide Reading 98.6% 74.8%
English Language Learners Statewide Reading 100.5% 62.4%
Students With Disabilities Statewide Reading 98.1% 51.8%
All Students District Reading 99.8% 90%
Bottom 30% District Reading 66.5%
American Indian District Reading
African American District Reading < 30 < 30
Asian District Reading < 30 < 30
Hispanic of Any Race District Reading < 30 < 30
Native Hawaiian or OtherPacific Islander
District Reading < 30 < 30
Two or More Races District Reading < 30 < 30
White District Reading 99.8% 90.8%
Economically Disadvantaged District Reading 100% 85.8%
English Language Learners District Reading < 30
Students With Disabilities District Reading 100% 61.2%
All Students Statewide Science 97.9% 38.6%
Bottom 30% Statewide Science 1%
American Indian Statewide Science 97.5% 29.4%
African American Statewide Science 94.8% 12.8%
Asian Statewide Science 99.1% 57.4%
Hispanic of Any Race Statewide Science 97.9% 22.9%
Native Hawaiian or OtherPacific Islander
Statewide Science 93.7% 49.2%
Two or More Races Statewide Science 98.7% 35.7%
White Statewide Science 98.7% 45%
Economically Disadvantaged Statewide Science 97% 22.9%
English Language Learners Statewide Science 98% 7.6%
Students With Disabilities Statewide Science 96.5% 15.1%Page 8 of A service of the Center for Educational Performance and Information20

12/11/2013
Annual Education ReportW.R. Bush Elementary School
Accountability Details Subject Data
Testing Group Location Subject % Tested Total(Goal95%)
% Proficient forAccountability*
All Students District Science 99.8% 50%
Bottom 30% District Science 0%
American Indian District Science
African American District Science < 30 < 30
Asian District Science < 30 < 30
Hispanic of Any Race District Science < 30 < 30
Native Hawaiian or OtherPacific Islander
District Science
Two or More Races District Science < 30 < 30
White District Science 99.7% 52%
Economically Disadvantaged District Science 100% 39.4%
English Language Learners District Science
Students With Disabilities District Science 100% 15.1%
All Students Statewide Social Studies 96.7% 57.5%
Bottom 30% Statewide Social Studies 8.8%
American Indian Statewide Social Studies 95.9% 52.3%
African American Statewide Social Studies 92.4% 27.9%
Asian Statewide Social Studies 99% 73.6%
Hispanic of Any Race Statewide Social Studies 96.1% 43%
Native Hawaiian or OtherPacific Islander
Statewide Social Studies 93.2% 59.7%
Two or More Races Statewide Social Studies 97.6% 53.5%
White Statewide Social Studies 98% 64.7%
Economically Disadvantaged Statewide Social Studies 95.1% 40.3%
English Language Learners Statewide Social Studies 96.4% 19.6%
Students With Disabilities Statewide Social Studies 91.9% 22.3%
All Students District Social Studies 99.3% 66.7%
Bottom 30% District Social Studies 13.2%
American Indian District Social Studies
African American District Social Studies < 30 < 30
Asian District Social Studies < 30 < 30
Hispanic of Any Race District Social Studies < 30 < 30
Page 9 of A service of the Center for Educational Performance and Information20

12/11/2013
Annual Education ReportW.R. Bush Elementary School
Accountability Details Subject Data
Testing Group Location Subject % Tested Total(Goal95%)
% Proficient forAccountability*
Native Hawaiian or OtherPacific Islander
District Social Studies
Two or More Races District Social Studies < 30 < 30
White District Social Studies 99.3% 67.1%
Economically Disadvantaged District Social Studies 99.4% 55.6%
English Language Learners District Social Studies
Students With Disabilities District Social Studies 100% 22.6%
All Students Statewide Writing 98.2% 69.4%
Bottom 30% Statewide Writing 21.9%
American Indian Statewide Writing 97.7% 61.6%
African American Statewide Writing 95.6% 48.8%
Asian Statewide Writing 98.9% 82.9%
Hispanic of Any Race Statewide Writing 98% 59.7%
Native Hawaiian or OtherPacific Islander
Statewide Writing 94.5% 74.4%
Two or More Races Statewide Writing 98.9% 68.5%
White Statewide Writing 98.9% 74.3%
Economically Disadvantaged Statewide Writing 97.3% 55.7%
English Language Learners Statewide Writing 97.3% 42.1%
Students With Disabilities Statewide Writing 96.6% 27.9%
All Students District Writing 99.8% 74%
Bottom 30% District Writing 16.4%
American Indian District Writing
African American District Writing < 30 < 30
Asian District Writing < 30 < 30
Hispanic of Any Race District Writing < 30 < 30
Native Hawaiian or OtherPacific Islander
District Writing < 30 < 30
Two or More Races District Writing < 30 < 30
White District Writing 99.7% 75.4%
Economically Disadvantaged District Writing 100% 67.7%
English Language Learners District Writing
Students With Disabilities District Writing 100% 21.4%Page 10 of A service of the Center for Educational Performance and Information20

* All data based on students enrolled for a full academic year.
12/11/2013
Annual Education ReportW.R. Bush Elementary School
Accountability Details Graduation Data
Testing Group Location Accountability Scorecard Completion Rate(High Schools only) (Goal 80%)
All Students Statewide 76.2%
American Indian Statewide 66.4%
African American Statewide 59.9%
Asian Statewide 87.4%
Hispanic of Any Race Statewide 64.3%
Migrant Statewide 68.3%
Native Hawaiian or Other Pacific Islander Statewide 73.2%
Two or More Races Statewide 73.5%
White Statewide 81.5%
Female Statewide 80.8%
Male Statewide 72%
Economically Disadvantaged Statewide 64%
English Language Learners Statewide 63.1%
Students With Disabilities Statewide 53.5%
Homeless Statewide 53.8%
All Students District 92.4%
White District 93.2%
Economically Disadvantaged District 90%
Page 11 of A service of the Center for Educational Performance and Information20

* All data based on students enrolled for a full academic year.
12/11/2013
Annual Education ReportW.R. Bush Elementary School
Accountability Details Attendance Data
Testing Group Location Attendance Rate (Goal 90%)
All Students Statewide 94%
All Students District 97%
All Students School 94%
Page 12 of A service of the Center for Educational Performance and Information20

12/11/2013
Annual Education ReportW.R. Bush Elementary School
Accountability Status District Data
DistrictName
ReadingStatus
ReadingScore
WritingStatus
WritingScore
Math Status Math Score ScienceStatus
ScienceScore
SocialStudiesStatus
SocialStudiesScore
OverallStatus
OverallScore
No Data to Display
Page 13 of A service of the Center for Educational Performance and Information20

12/11/2013
Annual Education ReportW.R. Bush Elementary School
Accountability Status School Data
DistrictName
SchoolName
Title 1Status
ReadingStatus
ReadingScore
WritingStatus
WritingScore
MathStatus
MathScore
ScienceStatus
ScienceScore
SocialStudiesStatus
SocialStudiesScore
OverallStatus
OverallScore
No Data to Display
Page 14 of A service of the Center for Educational Performance and Information20
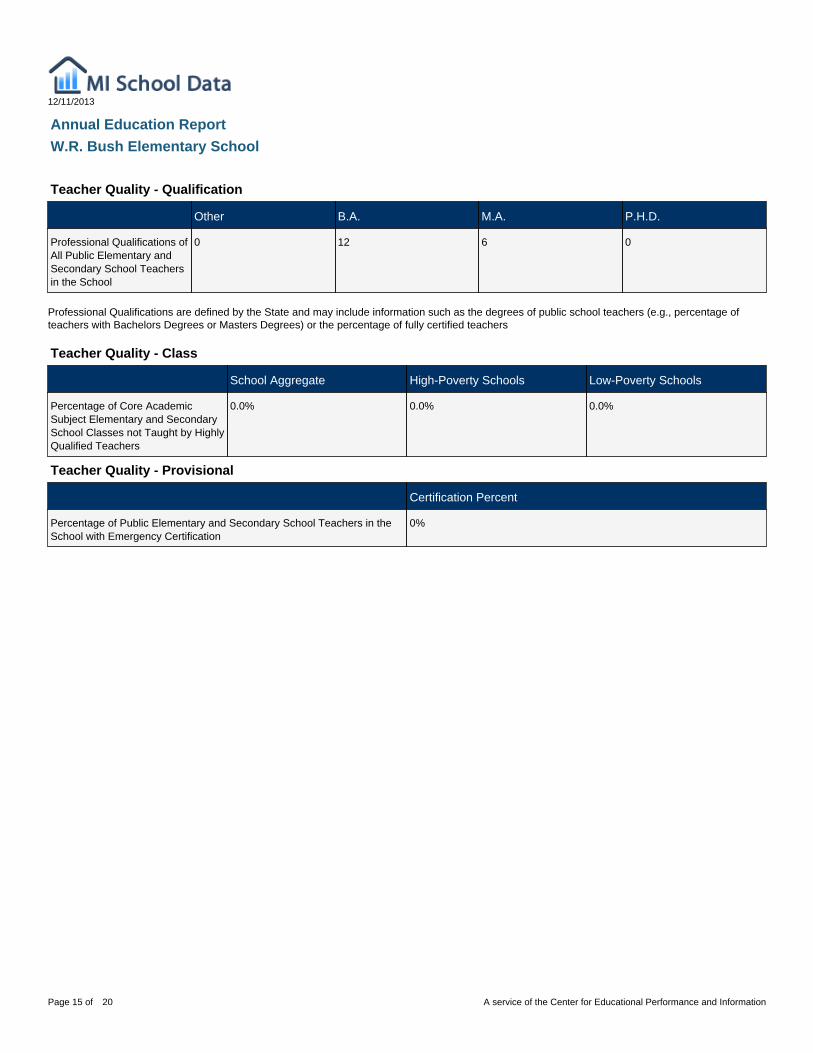
Professional Qualifications are defined by the State and may include information such as the degrees of public school teachers (e.g., percentage ofteachers with Bachelors Degrees or Masters Degrees) or the percentage of fully certified teachers
12/11/2013
Annual Education ReportW.R. Bush Elementary School
Teacher Quality - Qualification
Other B.A. M.A. P.H.D.
Professional Qualifications ofAll Public Elementary andSecondary School Teachersin the School
0 12 6 0
Teacher Quality - Class
School Aggregate High-Poverty Schools Low-Poverty Schools
Percentage of Core AcademicSubject Elementary and SecondarySchool Classes not Taught by HighlyQualified Teachers
0.0% 0.0% 0.0%
Teacher Quality - Provisional
Certification Percent
Percentage of Public Elementary and Secondary School Teachers in theSchool with Emergency Certification
0%
Page 15 of A service of the Center for Educational Performance and Information20
‡ Reporting Standards not met. Note: Observed differences are not necessarily statistically significant. Detail may not sum to total because of rounding.SOURCE: U.S. Department of Education. Institute for Education Sciences. National Center for Education Statistics. National Assessment Program(NAEP) 2011 Mathematics Achievement.
12/11/2013
Annual Education ReportW.R. Bush Elementary School
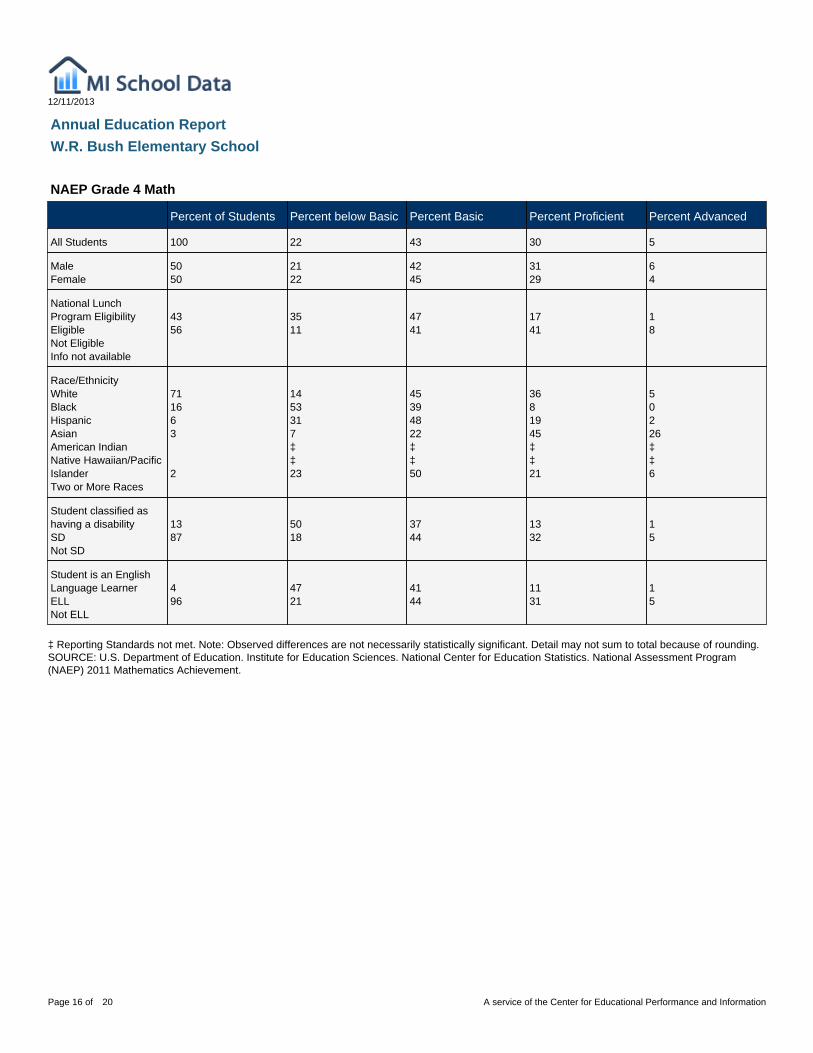
NAEP Grade 4 Math
Percent of Students Percent below Basic Percent Basic Percent Proficient Percent Advanced
All Students 100 22 43 30 5
MaleFemale
5050
2122
4245
3129
64
National LunchProgram EligibilityEligibleNot EligibleInfo not available
4356
3511
4741
1741
18
Race/EthnicityWhiteBlackHispanicAsianAmerican IndianNative Hawaiian/PacificIslanderTwo or More Races
711663
2
1453317‡‡23
45394822‡‡50
3681945‡‡21
50226‡‡6
Student classified ashaving a disabilitySDNot SD
1387
5018
3744
1332
15
Student is an EnglishLanguage LearnerELLNot ELL
496
4721
4144
1131
15
Page 16 of A service of the Center for Educational Performance and Information20

‡ Reporting Standards not met. NOTE: Detail may not sum to totals because of rounding. Some apparent differences between estimates may not bestatistically significant. SOURCE: U.S. Department of Education. Institute for Education Sciences. National Center for Education Statistics. NationalAssessment Program (NAEP) 2011 Mathematics Achievement.
12/11/2013
Annual Education ReportW.R. Bush Elementary School
NAEP Grade 8 Math
Percent of Students Percent below Basic Percent Basic Percent Proficient Percent Advanced
All Students 100 29 40 25 6
MaleFemale
5149
2830
3941
2624
75
National LunchProgram EligibilityEligibleNot EligibleInfo not available
4258
4518
3941
1532
29
Race/EthnicityWhiteBlackHispanicAsianAmerican IndianNative Hawaiian/PacificIslanderTwo or More Races
7416431
2
22662613‡‡‡
43264125‡‡‡
2971831‡‡‡
60532‡‡‡
Student classified ashaving a disabilitySDNot SD
1288
7025
2341
527
16
Student is an EnglishLanguage LearnerELLNot ELL
298
5729
2740
725
106
Page 17 of A service of the Center for Educational Performance and Information20

# Rounds to zero ‡ Reporting Standards not met. NOTE: Detail may not sum to totals because of rounding. Some apparent differences between estimates may not bestatistically significant. SOURCE: U.S. Department of Education, Institute of Education Sciences, National Center for Education Statistics, NationalAssessment of Educational Progress (NAEP), 2011 Reading Assessment.
12/11/2013
Annual Education ReportW.R. Bush Elementary School
NAEP Grade 4 Reading
Percent of Students Percent below Basic Percent Basic Percent Proficient Percent Advanced
All Students 100 34 34 25 6
MaleFemale
5050
3831
3336
2426
67
National LunchProgram EligibilityEligibleNot EligibleInfo not available
4555 51
21
3236
1533
210
Race/EthnicityWhiteBlackHispanicAsianAmerican IndianNative Hawaiian/PacificIslanderTwo or More Races
7017630
2
26675119‡‡36
37242933‡‡31
3071733‡‡19
71315‡‡14
Student classified ashaving a disabilitySDNot SD
1387
7330
1736
827
27
Student is an EnglishLanguage LearnerELLNot ELL
397
6733
2635
725
07
Page 18 of A service of the Center for Educational Performance and Information20

# Rounds to zero ‡ Reporting Standards not met. NOTE: Detail may not sum to totals because of rounding. Some apparent differences between estimates may not bestatistically significant. SOURCE: U.S. Department of Education, Institute of Education Sciences, National Center for Education Statistics, NationalAssessment of Educational Progress (NAEP), 2011 Reading Assessment.
12/11/2013
Annual Education ReportW.R. Bush Elementary School
NAEP Grade 8 Reading
Percent of Students Percent below Basic Percent Basic Percent Proficient Percent Advanced
All Students 100 23 45 29 3
MaleFemale
5050
2818
4743
2435
24
National LunchProgram EligibilityEligibleNot EligibleInfo not available
4258
3514
4644
1837
04
Race/EthnicityWhiteBlackHispanicAsianAmerican IndianNative Hawaiian/PacificIslanderTwo or More Races
7416431
1
18462519‡‡‡
46435027‡‡‡
33102539‡‡‡
30114‡‡‡
Student classified ashaving a disabilitySDNot SD
1288
6719
2746
631
03
Student is an EnglishLanguage LearnerELLNot ELL
298
5222
4045
830
03
Page 19 of A service of the Center for Educational Performance and Information20

12/11/2013
Annual Education ReportW.R. Bush Elementary School
NAEP Participation Data
Grade Subject Participation Rate forStudents withDisabilities
Standard Error Participation Rate forLimited EnglishProficient Students
Standard Error
4 MathReading
8575
2.03.1
7393
3.32.4
8 MathReading
7363
2.53.3
8379
4.74.5
Page 20 of A service of the Center for Educational Performance and Information20