essentials of heijunka (production leveling) in lab … of heijunka (production leveling) in lab...
TRANSCRIPT

1
© Ortho-Clinical Diagnostics, Inc.
Essentials of Heijunka (Production Leveling) in Lab Work Flow Dale Hershfield, Sr. Lean Consultant
Lab Quality Confab and Process Improvement Institute
San Antonio | November 6 – 7, 2012
©2011Ortho-Clinical Diagnostics, Inc. Ortho-Clinical Diagnostics Confidential - Not For Further Distribution
©2012 Ortho Clinical Diagnostics Ortho Clinical Diagnostics -- Confidential | Not for further distribution
Session Objectives •! Learn
•! Do
•! Repeat
2
2
©2011Ortho-Clinical Diagnostics, Inc. Ortho-Clinical Diagnostics Confidential - Not For Further Distribution
©2012 Ortho Clinical Diagnostics Ortho Clinical Diagnostics -- Confidential | Not for further distribution
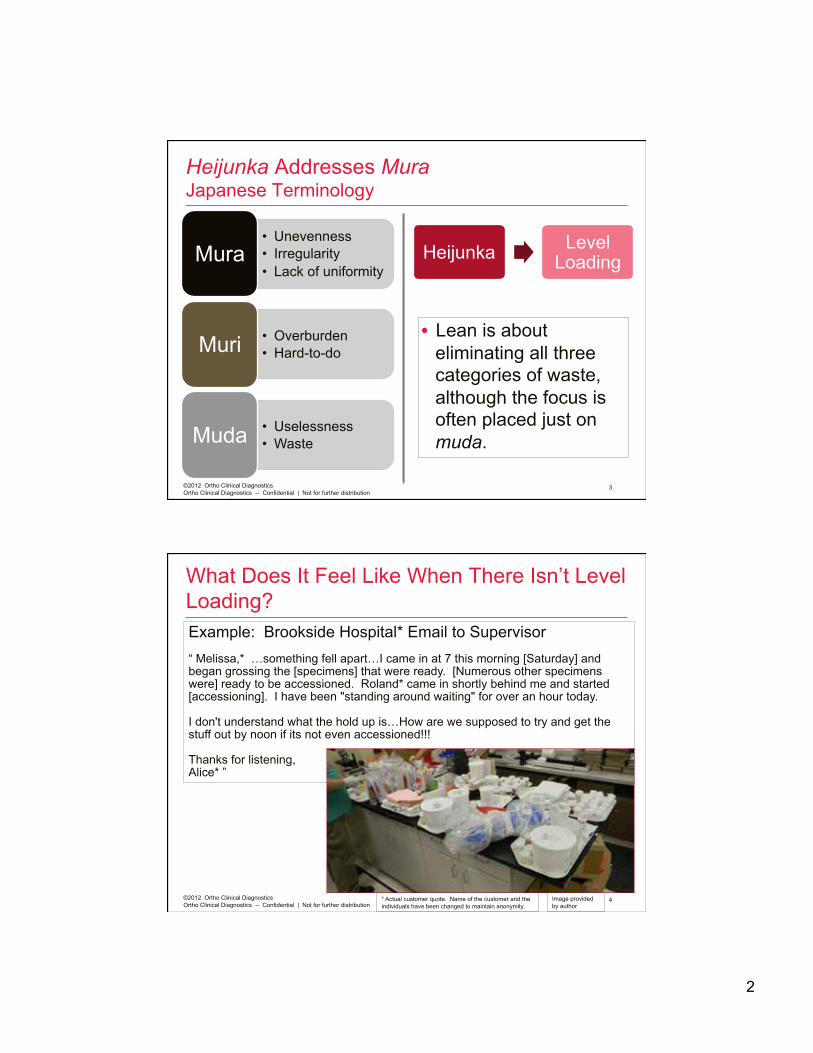
Heijunka Addresses Mura Japanese Terminology
•! Unevenness •! Irregularity •! Lack of uniformity
Mura
•! Overburden •! Hard-to-do Muri
•! Uselessness •! Waste Muda
•! Lean is about eliminating all three categories of waste, although the focus is often placed just on muda.
3
Heijunka Level Loading
©2011Ortho-Clinical Diagnostics, Inc. Ortho-Clinical Diagnostics Confidential - Not For Further Distribution
©2012 Ortho Clinical Diagnostics Ortho Clinical Diagnostics -- Confidential | Not for further distribution
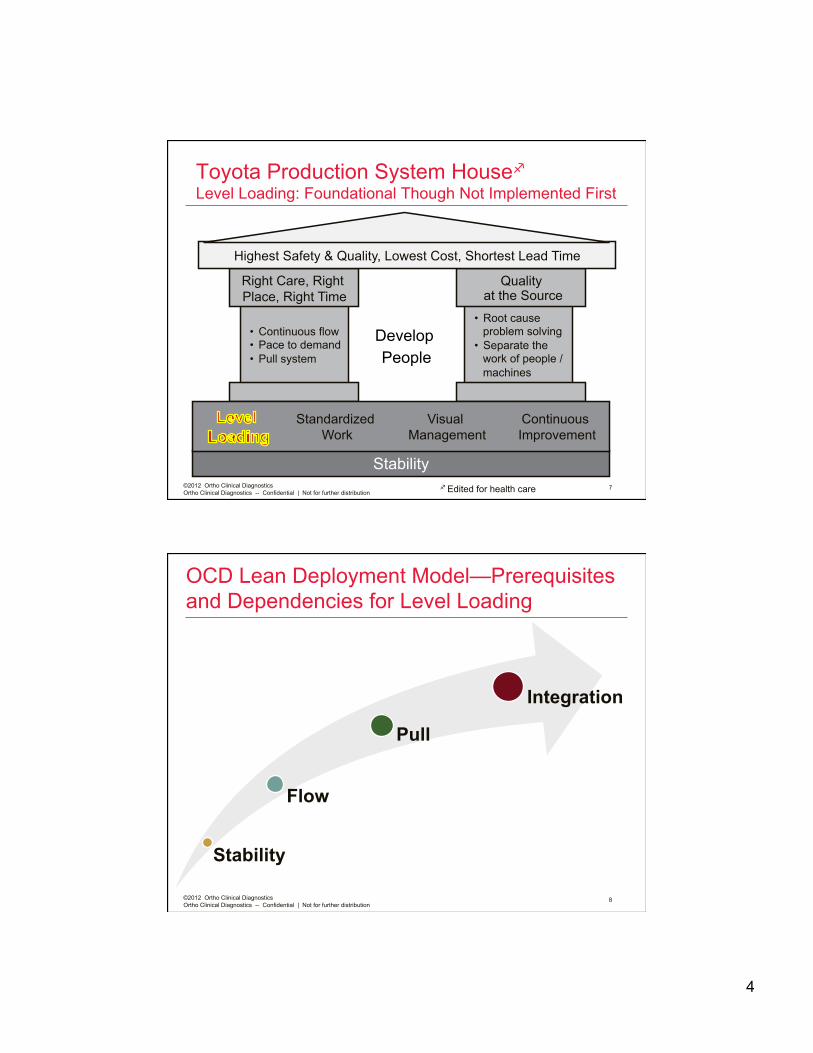
What Does It Feel Like When There Isn’t Level Loading?
4
Example: Brookside Hospital* Email to Supervisor “ Melissa,* …something fell apart…I came in at 7 this morning [Saturday] and began grossing the [specimens] that were ready. [Numerous other specimens were] ready to be accessioned. Roland* came in shortly behind me and started [accessioning]. I have been "standing around waiting" for over an hour today.
I don't understand what the hold up is…How are we supposed to try and get the stuff out by noon if its not even accessioned!!!
Thanks for listening, Alice* ”
* Actual customer quote. Name of the customer and the individuals have been changed to maintain anonymity.
Image provided by author

3
©2011Ortho-Clinical Diagnostics, Inc. Ortho-Clinical Diagnostics Confidential - Not For Further Distribution
©2012 Ortho Clinical Diagnostics Ortho Clinical Diagnostics -- Confidential | Not for further distribution
Work Practices Frequently Create, or Exacerbate, Unevenness
5
!! !! !! !! !! !! !! !! !! !! !! !! !! !! !! !! !! !! !! !! !! !! !! !! !! !! !! !! !! !! !! !! !! !! !! !! !! !! !! !! !! !! !! !! !! !! !! !! !! !! !! !! !! !! !! !! !! !! !! !!
!!
" ! " " " " " " 60 Minutes " " " " " " #
Example: Vibrant Energy Hospital*
Outpatient Blood Draw Average 1 per minute Transport specimens to core lab Once per 40 minutes
Load specimens on analyzer Once per 60 minutes
0 60
* Actual customer data. Name of the customer has been changed to maintain anonymity.
©2011Ortho-Clinical Diagnostics, Inc. Ortho-Clinical Diagnostics Confidential - Not For Further Distribution
©2012 Ortho Clinical Diagnostics Ortho Clinical Diagnostics -- Confidential | Not for further distribution
Why Is Mura (Unevenness) Bad? It Creates a Bullwhip-Like Effect In Your Operations
6
Unevenness
Ope
rati
onal
Im
pact
Over-stocking
Idle Then
Frenetic Slower
Response Time
Poor Utilization
4
©2011Ortho-Clinical Diagnostics, Inc. Ortho-Clinical Diagnostics Confidential - Not For Further Distribution
©2012 Ortho Clinical Diagnostics Ortho Clinical Diagnostics -- Confidential | Not for further distribution
7
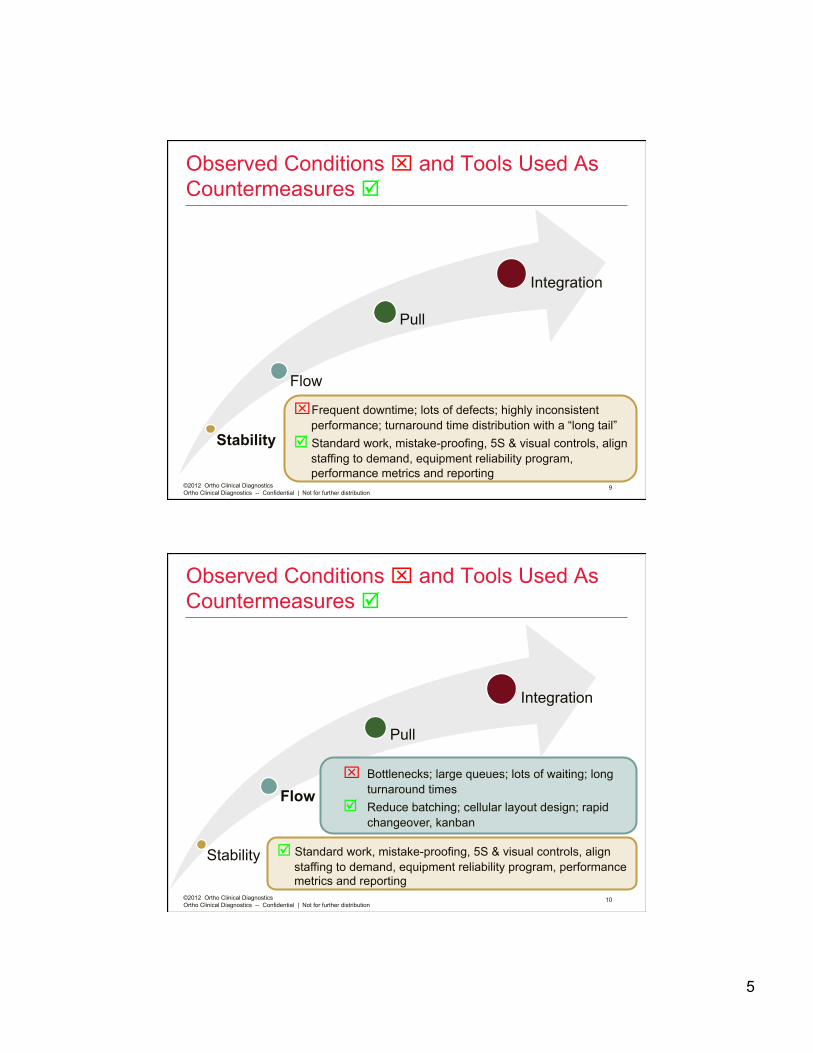
Toyota Production System House! Level Loading: Foundational Though Not Implemented First
Stability
•! Root cause problem solving •! Separate the
work of people / machines
Quality at the Source
•! Continuous flow •! Pace to demand •! Pull system
Right Care, Right Place, Right Time
Highest Safety & Quality, Lowest Cost, Shortest Lead Time
Develop People
Standardized Work
Continuous Improvement
Visual Management
! Edited for health care
©2011Ortho-Clinical Diagnostics, Inc. Ortho-Clinical Diagnostics Confidential - Not For Further Distribution
©2012 Ortho Clinical Diagnostics Ortho Clinical Diagnostics -- Confidential | Not for further distribution
OCD Lean Deployment Model—Prerequisites and Dependencies for Level Loading
8
Stability
Flow
Pull
Integration
5
©2011Ortho-Clinical Diagnostics, Inc. Ortho-Clinical Diagnostics Confidential - Not For Further Distribution
©2012 Ortho Clinical Diagnostics Ortho Clinical Diagnostics -- Confidential | Not for further distribution
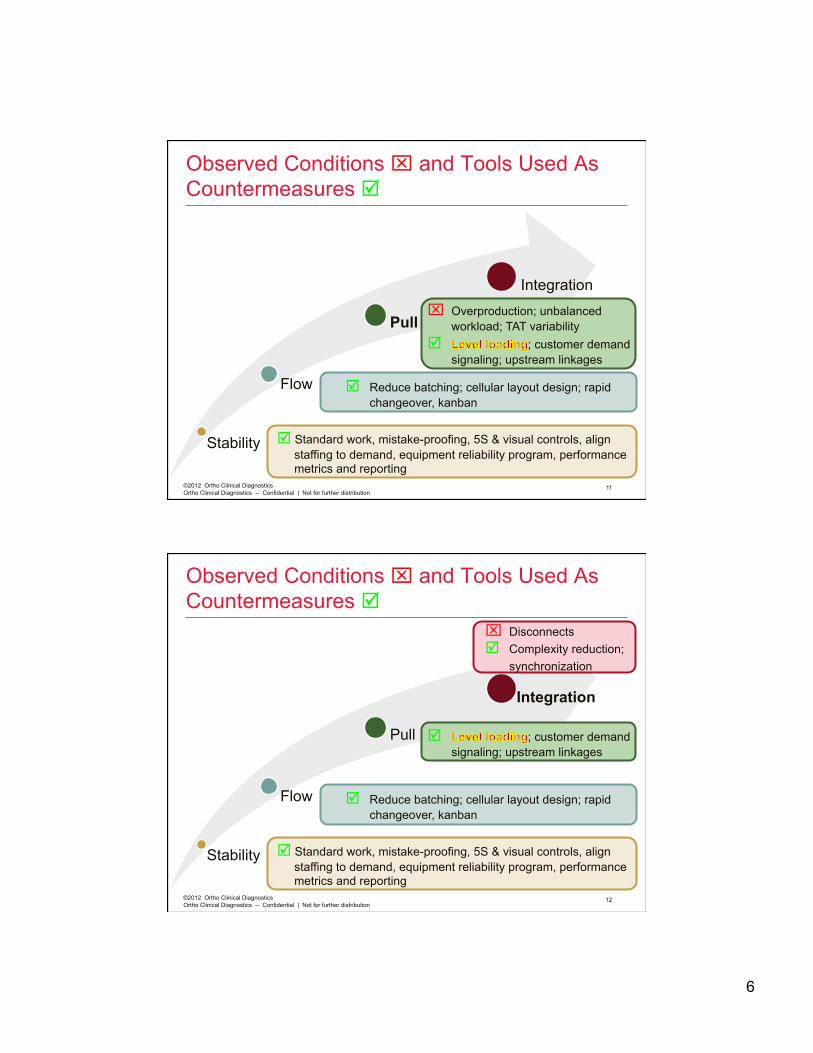
Observed Conditions " and Tools Used As Countermeasures #
9
" Frequent downtime; lots of defects; highly inconsistent performance; turnaround time distribution with a “long tail”
# Standard work, mistake-proofing, 5S & visual controls, align staffing to demand, equipment reliability program, performance metrics and reporting
Stability
Flow
Pull
Integration
©2011Ortho-Clinical Diagnostics, Inc. Ortho-Clinical Diagnostics Confidential - Not For Further Distribution
©2012 Ortho Clinical Diagnostics Ortho Clinical Diagnostics -- Confidential | Not for further distribution
Observed Conditions " and Tools Used As Countermeasures #
Stability
Flow
Pull
Integration
10
# Standard work, mistake-proofing, 5S & visual controls, align staffing to demand, equipment reliability program, performance metrics and reporting
" Bottlenecks; large queues; lots of waiting; long turnaround times
# Reduce batching; cellular layout design; rapid changeover, kanban
6
©2011Ortho-Clinical Diagnostics, Inc. Ortho-Clinical Diagnostics Confidential - Not For Further Distribution
©2012 Ortho Clinical Diagnostics Ortho Clinical Diagnostics -- Confidential | Not for further distribution
Observed Conditions " and Tools Used As Countermeasures #
Stability
Flow
Pull
Integration
11
# Standard work, mistake-proofing, 5S & visual controls, align staffing to demand, equipment reliability program, performance metrics and reporting
# Reduce batching; cellular layout design; rapid changeover, kanban
" Overproduction; unbalanced workload; TAT variability
# ; customer demand signaling; upstream linkages
©2011Ortho-Clinical Diagnostics, Inc. Ortho-Clinical Diagnostics Confidential - Not For Further Distribution
©2012 Ortho Clinical Diagnostics Ortho Clinical Diagnostics -- Confidential | Not for further distribution
Observed Conditions " and Tools Used As Countermeasures #
Stability
Flow
Pull
Integration
12
# Standard work, mistake-proofing, 5S & visual controls, align staffing to demand, equipment reliability program, performance metrics and reporting
# Reduce batching; cellular layout design; rapid changeover, kanban
# ; customer demand signaling; upstream linkages
" Disconnects # Complexity reduction;
synchronization

7
©2011Ortho-Clinical Diagnostics, Inc. Ortho-Clinical Diagnostics Confidential - Not For Further Distribution
©2012 Ortho Clinical Diagnostics Ortho Clinical Diagnostics -- Confidential | Not for further distribution
Lean Maturity Check - Instructions •! Self assessment
–!5 minutes
•! Table discussion –!5 minutes
•! Full group debrief –!5 minutes
13
©2011Ortho-Clinical Diagnostics, Inc. Ortho-Clinical Diagnostics Confidential - Not For Further Distribution
©2012 Ortho Clinical Diagnostics Ortho Clinical Diagnostics -- Confidential | Not for further distribution
Lean Maturity Check for Labs Elements 1 – 4
Element Entry Intermediate Advanced Standard work Policies and procedures for
CAP and Joint Commission (only); few or no job role-specific work guides
Some standard work documents by job role that include task sequence, timing and standard work-in-process
Standard work for all job roles is regularly audited and updated
Visual management
Individual staff members arrange items in the work area according to their own preferences. Both frequently and infrequently used supplies are within close reach at work stations. No standardization.
Many work areas have visual indicators to designate locations for tools and supplies and for incoming / in-process / completed work. Standards established. Periodic audits.
Anyone can walk up to any workstation and within 30 seconds know full operational status, just by observation. Routine audits.
Metrics Key performance measures with current year goals are documented. Actual results shared with staff at least monthly.
Daily reporting of key performance measures. Staff engaged each day in improvement efforts based on target versus actual outcomes.
Hourly reporting of key metrics. Comprehensive improvement plan aligned with hospital (parent organization’s) strategic initiatives.
Materials management
For many supplies items, maintain 2 – 3 months worth of supply in the lab.
Use kanban system for most supplies. Measure and track supply turns.
Kanban system helps synchronize the flow of work
14

8
©2011Ortho-Clinical Diagnostics, Inc. Ortho-Clinical Diagnostics Confidential - Not For Further Distribution
©2012 Ortho Clinical Diagnostics Ortho Clinical Diagnostics -- Confidential | Not for further distribution
Lean Maturity Check for Labs Elements 5 – 7
Element Entry Intermediate Advanced Layout Each function! within the
department has its own work area. Isolated islands of production. Physical layout impedes smooth flow.
Physical layout promotes flow. High volume, automated testing, regardless of function, is grouped in a cell(s).
Cellular layout. Lab physical space is highly flexible and reconfigurable to support changes in volume and types of testing.
Level loading and flow
Routinely process large batches of material and/or information. Often group like items to process them together.
Small, consistent-sized batches of material are processed in 10 – 15 minute time increments. Sequencing of part types is not controlled or coordinated.
Release and process small batches of material at a pace matched to customer demand. Part types are evenly distributed among batches.
Value stream integration
It’s been >2 years since you had a thorough conversation with multiple customers about their requirements. You provide limited (or no) feedback to upstream suppliers on their quality level and defect rate. You collaborate infrequently with suppliers on joint improvement projects.
A value stream map, or comparable process characterization, provides the basis for an annual value stream improvement plan.
Value stream planning engages the full spectrum of stakeholders, including external suppliers and customers. You collaborate with upstream suppliers to smooth the volume and mix of demand.
15 ! Functions include chemistry, hematology, coag, microbiology, etc.
©2011Ortho-Clinical Diagnostics, Inc. Ortho-Clinical Diagnostics Confidential - Not For Further Distribution
©2012 Ortho Clinical Diagnostics Ortho Clinical Diagnostics -- Confidential | Not for further distribution
The Costs and Impact of Unevenness
16
More Space
•! More storage areas •! Bigger
storage areas •! Bigger bench
top work area or just more benches •! Leads to
longer walk distances
Bigger Equipment •! More
expensive •! Less flexible •! Takes up
more space
Lower Labor Productivity •! Periods of
feast and famine •! Overstaffing
to handle peak loads or chronic understaffing •! Staff burn out
Less Agile
•! Harder to switch to higher priority work •! More stress—
pressure when faced with huge amount of work or are short staffed
Less Consistency •! Longer, more
variable lead times •! Requires
increased vigilance •! Lower quality •! Increased risk
9
©2011Ortho-Clinical Diagnostics, Inc. Ortho-Clinical Diagnostics Confidential - Not For Further Distribution
©2012 Ortho Clinical Diagnostics Ortho Clinical Diagnostics -- Confidential | Not for further distribution
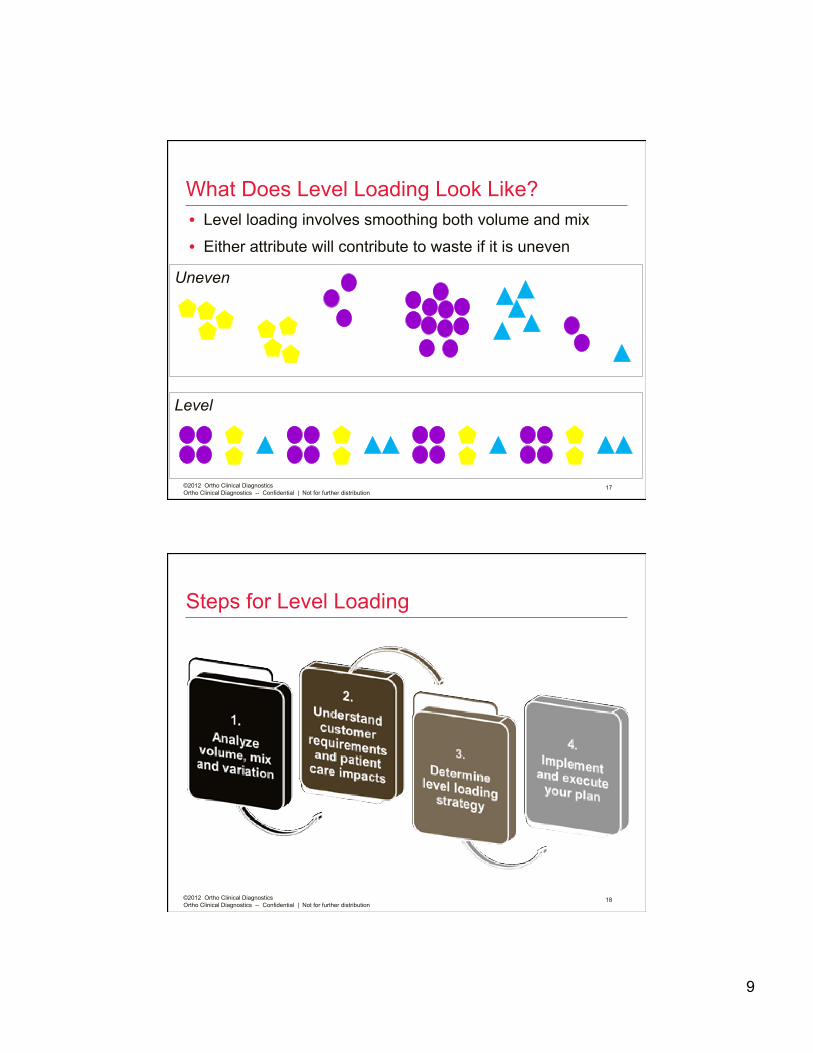
What Does Level Loading Look Like? •! Level loading involves smoothing both volume and mix
•! Either attribute will contribute to waste if it is uneven
17
Uneven
Level
©2011Ortho-Clinical Diagnostics, Inc. Ortho-Clinical Diagnostics Confidential - Not For Further Distribution
©2012 Ortho Clinical Diagnostics Ortho Clinical Diagnostics -- Confidential | Not for further distribution
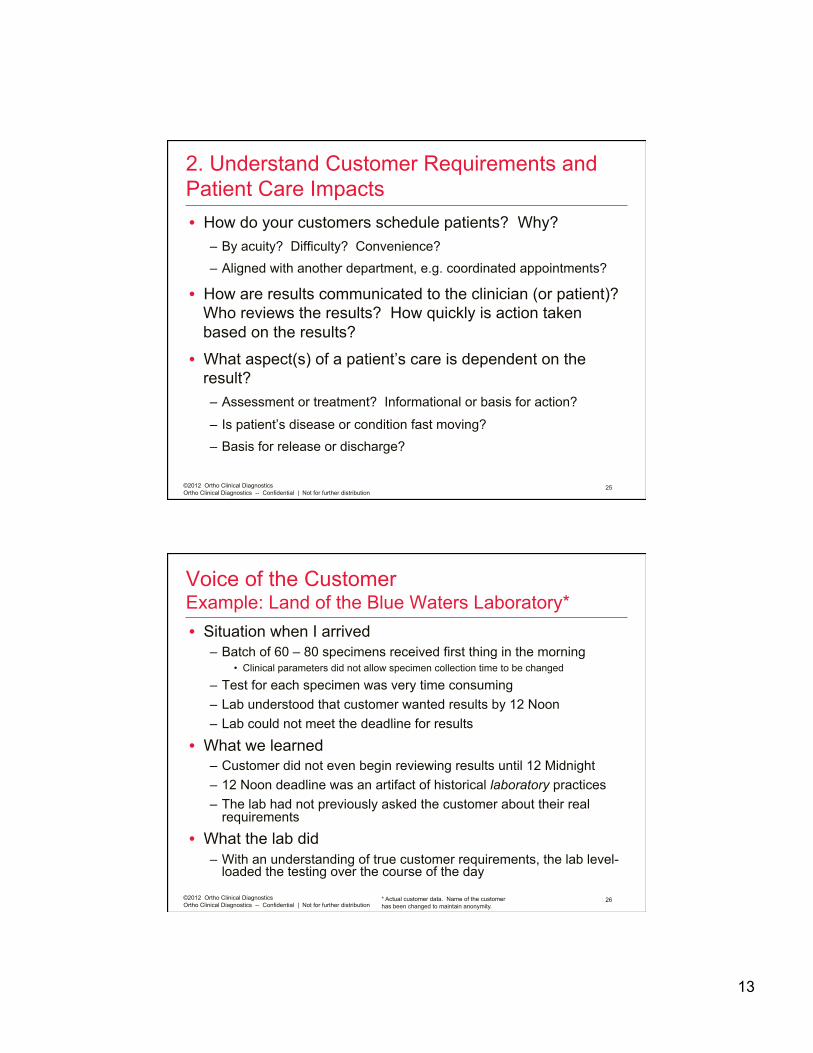
Steps for Level Loading
18

10
©2011Ortho-Clinical Diagnostics, Inc. Ortho-Clinical Diagnostics Confidential - Not For Further Distribution
©2012 Ortho Clinical Diagnostics Ortho Clinical Diagnostics -- Confidential | Not for further distribution
1. Analyze Volume, Mix and Variation •! Volume
–!How does it change over time?
–! Are there predictable peaks and troughs?
–! Tools •! Run chart / timeline chart of
volume versus time
•! Bar chart of volume by hour of day •! Moving average chart
•! Mix –! Product – quantity analysis •! Pareto Principle (80-20 Rule)
–!Group technology analysis –! Tools •! Excel spreadsheet
•! Variation –!How variable is demand for
each product type? –! Tools •! Standard deviation
•! Coefficient of variation ( = standard deviation divided by the mean)
19 Reference “Lean Production Simplified”, Pascal Dennis
©2011Ortho-Clinical Diagnostics, Inc. Ortho-Clinical Diagnostics Confidential - Not For Further Distribution
©2012 Ortho Clinical Diagnostics Ortho Clinical Diagnostics -- Confidential | Not for further distribution
Tackle The Challenges of Variability With Solid Data and Analysis •! Get data
–!Understand real versus perceived variation in volume and mix
–!Quantify variation
•! Remember that Stability is the first stage of the lean deployment model –!Don’t confuse lack of reliability with variability in demand
20
$ Good news: the data almost always show that variability is much lower than it is perceived to be

11
©2011Ortho-Clinical Diagnostics, Inc. Ortho-Clinical Diagnostics Confidential - Not For Further Distribution
©2012 Ortho Clinical Diagnostics Ortho Clinical Diagnostics -- Confidential | Not for further distribution
* Actual customer data. Name of the customer has been changed to maintain anonymity.
Mix and Variation Analysis Dr. B’s* Consistent Pathology Interpretation Times
21
TThheeyy’’rree aallll ddii
ffffeerreenntt
Each case is unique
It’s different every time
You never know until you get the case
$ Understand sources and amount of variation
©2011Ortho-Clinical Diagnostics, Inc. Ortho-Clinical Diagnostics Confidential - Not For Further Distribution
©2012 Ortho Clinical Diagnostics Ortho Clinical Diagnostics -- Confidential | Not for further distribution
Volume and Variation Analysis Example: Fairlake Hospital* Volume by Time of Day
22
Dialysis Day Regular Day
Lab receipt peak volumes on Dialysis Day are more than 4X the highest peak on a regular day
* Actual customer data. Name of the customer has been changed to maintain anonymity.

12
©2011Ortho-Clinical Diagnostics, Inc. Ortho-Clinical Diagnostics Confidential - Not For Further Distribution
©2012 Ortho Clinical Diagnostics Ortho Clinical Diagnostics -- Confidential | Not for further distribution
Product – Quantity Analysis Example: Riverhill Hospital* AP Lab January 2012
•! 9054 cases
•! 297 part types (case types)
•! 21% of the case types = 80.2% of specimen volume –! 63 case types
•! 3% of case types = 50.7% of specimen volume –! Just 17 case types
23
""
""
* Actual customer data. Name of the customer has been changed to maintain anonymity.
©2011Ortho-Clinical Diagnostics, Inc. Ortho-Clinical Diagnostics Confidential - Not For Further Distribution
©2012 Ortho Clinical Diagnostics Ortho Clinical Diagnostics -- Confidential | Not for further distribution
Group Technology Analysis Simplified Example Analyze Mix According to Similar and Recurring Tasks
24
1. Rank order specimen types by volume 2. Look for similarities
in processing steps
13
©2011Ortho-Clinical Diagnostics, Inc. Ortho-Clinical Diagnostics Confidential - Not For Further Distribution
©2012 Ortho Clinical Diagnostics Ortho Clinical Diagnostics -- Confidential | Not for further distribution
2. Understand Customer Requirements and Patient Care Impacts •! How do your customers schedule patients? Why?
–! By acuity? Difficulty? Convenience? –! Aligned with another department, e.g. coordinated appointments?
•! How are results communicated to the clinician (or patient)? Who reviews the results? How quickly is action taken based on the results?
•! What aspect(s) of a patient’s care is dependent on the result? –! Assessment or treatment? Informational or basis for action?
–! Is patient’s disease or condition fast moving? –! Basis for release or discharge?
25
©2011Ortho-Clinical Diagnostics, Inc. Ortho-Clinical Diagnostics Confidential - Not For Further Distribution
©2012 Ortho Clinical Diagnostics Ortho Clinical Diagnostics -- Confidential | Not for further distribution
Voice of the Customer Example: Land of the Blue Waters Laboratory* •! Situation when I arrived
–! Batch of 60 – 80 specimens received first thing in the morning •! Clinical parameters did not allow specimen collection time to be changed
–! Test for each specimen was very time consuming –! Lab understood that customer wanted results by 12 Noon –! Lab could not meet the deadline for results
•! What we learned –!Customer did not even begin reviewing results until 12 Midnight –! 12 Noon deadline was an artifact of historical laboratory practices –! The lab had not previously asked the customer about their real
requirements
•! What the lab did –!With an understanding of true customer requirements, the lab level-
loaded the testing over the course of the day
26 * Actual customer data. Name of the customer has been changed to maintain anonymity.

14
©2011Ortho-Clinical Diagnostics, Inc. Ortho-Clinical Diagnostics Confidential - Not For Further Distribution
©2012 Ortho Clinical Diagnostics Ortho Clinical Diagnostics -- Confidential | Not for further distribution
3. Determine Level Loading Strategy Within the Lab
Category Attributes Strategy Options Green Stream •! High volume
•! High frequency •! Low variation
•! Dedicated line or work cell •! Focused work cell
Amber Stream •! Moderate volume •! Moderate frequency •! Moderate variation
•! Piggy back on Green Stream •! Work cells
Blue Stream •! Low volume •! Low frequency •! High variation
•! Piggy back on Amber Stream •! Produce to order in own work area •! Assess for outsourcing •! Evaluate alternative tests / procedures
27 References: “Lean Production Simplified”, Pascal Dennis; "Breaking Through to Flow“, Ian Glenday
©2011Ortho-Clinical Diagnostics, Inc. Ortho-Clinical Diagnostics Confidential - Not For Further Distribution
©2012 Ortho Clinical Diagnostics Ortho Clinical Diagnostics -- Confidential | Not for further distribution
3. Determine Level Loading Strategy Potential Collaboration with Customers and Suppliers •! Adjust specimen collection / delivery times •! Schedule outpatient draws (instead of walk-up) •! Lab “pull” specimens instead of supplier “pushing” them
–! Implement a “courier” staffed by the lab to collect specimens from in-house procedure areas
•! Increase communication with suppliers, especially regarding schedules –! Better align lab staffing and operations with customers
•! Adjust courier schedules –!Often difficult and costly—though not always
•! Other actions, informed by customer requirements, that better align lab with customer
28
15
©2011Ortho-Clinical Diagnostics, Inc. Ortho-Clinical Diagnostics Confidential - Not For Further Distribution
©2012 Ortho Clinical Diagnostics Ortho Clinical Diagnostics -- Confidential | Not for further distribution
4. Implement and Execute Your Plan •! Conduct a risk assessment and develop a control plan to
support implementation •! Develop and implement appropriate tools
–!Heijunka box: traditional production scheduling tool that specifies production sequence by product type, quantity and time increment
–! In Step 1 (Analyze Volume, Mix and Variation) and Step 3 (Determine Level Loading Strategy) you determine what “chunks of work” you will level load in your operation. Create a visual management approach to manage the release of these “chunks” into your operation for processing—a heijunka box is one method.
•! Use standard work to secure and sustain your level loading design
29
©2011Ortho-Clinical Diagnostics, Inc. Ortho-Clinical Diagnostics Confidential - Not For Further Distribution
©2012 Ortho Clinical Diagnostics Ortho Clinical Diagnostics -- Confidential | Not for further distribution
Benefits of Level Loading
•! Fewer peaks and valleys that tend to strain people, equipment and suppliers –! Fewer adjustments and less sizeable adjustments
•! Better able to maintain the pace or pulse of operation –! Sets a standard to readily distinguish normal operation from not
normal
•! Faster response and better control of abnormal conditions and quality problems
•! More responsive to changes in demand and/or priorities •! Shorter lead times •! Lower inventory levels to support production volumes •! Improved utilization of people and equipment •! Time and (mental) space for improvement activities
30 References: “Lean Production Simplified”, Pascal Dennis; The Lean Thinker Blog, Mark Rosenthal

16
©2011Ortho-Clinical Diagnostics, Inc. Ortho-Clinical Diagnostics Confidential - Not For Further Distribution
©2012 Ortho Clinical Diagnostics Ortho Clinical Diagnostics -- Confidential | Not for further distribution
University of Michigan Health System Case Study Inpatient CT Exam Turnaround Time—Background
•! 20,400 inpatient CT exams per year •! Turnaround time (TAT) for inpatient CT scan: > 20 hours on
average •! Ordering physicians could not predict when they would
receive results (highly variable TAT) •! Radiology staff assumed they could not affect timing of
demand (i.e. timing of orders) •! Unit clerks batched CT orders; radiology batched the
processing of orders –!No prioritization of inpatient orders (vs. outpatient)
•! Large number of CT protocols •! Complex process with many hand-offs
–! Frequent defects e.g. patient not prepped or not meet criteria for scan 31 Reference: “In by 9 Out by 6 – Level Loading”, Kate Bombach and Susan
Fisher. White Paper published on the Institute of Industrial Engineers website.
©2011Ortho-Clinical Diagnostics, Inc. Ortho-Clinical Diagnostics Confidential - Not For Further Distribution
©2012 Ortho Clinical Diagnostics Ortho Clinical Diagnostics -- Confidential | Not for further distribution
University of Michigan Health System Case Study Inpatient CT Exam Turnaround Time—Approach 1
•! Developed CT questionnaire and prep sheets for nursing –! Ensured patient was properly prepared
–!Reduced the time it took a nurse to do the preparations
•! Dedicated one CT scanner to inpatients 8 AM – 4 PM, dedicated a second 11 AM – 2 PM
•! Educated and trained everyone who is involved in the process –!Ordering physicians: order early (before 9 AM)
–!Radiologists: don’t batch •! First case read time
With batching—up to 6.3 hours Without batching—58 minutes
32
Reference: “In by 9 Out by 6 – Level Loading”, Kate Bombach and Susan Fisher. White Paper published on the Institute of Industrial Engineers website.

17
©2011Ortho-Clinical Diagnostics, Inc. Ortho-Clinical Diagnostics Confidential - Not For Further Distribution
©2012 Ortho Clinical Diagnostics Ortho Clinical Diagnostics -- Confidential | Not for further distribution
University of Michigan Health System Case Study Inpatient CT Exam Turnaround Time—Approach 2
•! Hired a nurse practitioner to handle protocoling –! Able to protocol 98% of cases independent of radiologist
–!Released radiologist time to read scans and report results –!Reduced protocoling time to 16 minutes from 54 minutes
•! Added priority code for inpatient exams in the radiology information system –! Alert flag for radiologists
•! Published regular report with CT exam turnaround times by division and by physician
33
Reference: “In by 9 Out by 6 – Level Loading”, Kate Bombach and Susan Fisher. White Paper published on the Institute of Industrial Engineers website.
©2011Ortho-Clinical Diagnostics, Inc. Ortho-Clinical Diagnostics Confidential - Not For Further Distribution
©2012 Ortho Clinical Diagnostics Ortho Clinical Diagnostics -- Confidential | Not for further distribution
University of Michigan Health System Case Study Inpatient CT Exam Turnaround Time—Results
•! Percent of CT orders received by 9 AM increased to 32% from 19% within 60 days
•! 69% of exams received by 9 AM are scanned by 2 PM •! 79% of exams received by 9 AM are dictated by 6 PM
34
Reference: “In by 9 Out by 6 – Level Loading”, Kate Bombach and Susan Fisher. White Paper published on the Institute of Industrial Engineers website.
18
©2011Ortho-Clinical Diagnostics, Inc. Ortho-Clinical Diagnostics Confidential - Not For Further Distribution
©2012 Ortho Clinical Diagnostics Ortho Clinical Diagnostics -- Confidential | Not for further distribution ©2012 Ortho Clinical Diagnostics Ortho Clinical Diagnostics -- Confidential | Not for further distribution
SCENARIO EXERCISES
35
©2011Ortho-Clinical Diagnostics, Inc. Ortho-Clinical Diagnostics Confidential - Not For Further Distribution
©2012 Ortho Clinical Diagnostics Ortho Clinical Diagnostics -- Confidential | Not for further distribution
Scenario Exercises - Instructions •! Read, discuss and propose countermeasures
(improvement actions) for each scenario with your table team –!Select one person to be a scribe
–!25 minutes
•! Full group debrief –!15 minutes
36

19
©2011Ortho-Clinical Diagnostics, Inc. Ortho-Clinical Diagnostics Confidential - Not For Further Distribution
©2012 Ortho Clinical Diagnostics Ortho Clinical Diagnostics -- Confidential | Not for further distribution
Exercise—Neapolitan Shores Laboratory* Background 1
•! The problem: lab turnaround time (TAT) for patients in critical care units exceeds the target level and is highly variable –!Order-to-receive TAT •! Target: 30 minutes. Actual: 59 minutes
•! Morning draws are scheduled for 3:30 AM
•! Phlebotomists typically send morning draw specimens to the lab in batches of 30 or more
•! Lab spent $600,000 on overtime last year
37 * Actual customer data. Name of the customer has been changed to maintain anonymity.
©2011Ortho-Clinical Diagnostics, Inc. Ortho-Clinical Diagnostics Confidential - Not For Further Distribution
©2012 Ortho Clinical Diagnostics Ortho Clinical Diagnostics -- Confidential | Not for further distribution
Exercise—Neapolitan Shores Laboratory* Background 2
•! Peak demand: 7,200 specimens at 3 AM
•! Incorrect orders / incorrect patient location occurred frequently (36% defect rate)
•! Peak staffing: 12 phlebotomists at 5:30 AM
•! Phlebotomist work practices were ad hoc. No defined methods or procedures.
•! No target defined for collect-to-receive times
•! Phlebotomist productivity: < 2 draws per hour
38 * Actual customer data. Name of the customer has been changed to maintain anonymity.

20
©2011Ortho-Clinical Diagnostics, Inc. Ortho-Clinical Diagnostics Confidential - Not For Further Distribution
©2012 Ortho Clinical Diagnostics Ortho Clinical Diagnostics -- Confidential | Not for further distribution
Exercise—Neapolitan Shores Laboratory* Approach
•! Create standard work for phlebotomists –!Detail work tasks and performance expectations –!Instead of batching, send specimens to laboratory using
‘single piece flow’ (send after drawing 2 – 3 patients)
•! Smooth the demand for blood draws by changing the routine draw times on nursing floors
•! Revise phlebotomist schedule to match staffing with demand
•! Implement metrics to monitor turnaround time and phlebotomist productivity –!Track draws with day-by-the-hour sheets
39 * Actual customer data. Name of the customer has been changed to maintain anonymity.
©2011Ortho-Clinical Diagnostics, Inc. Ortho-Clinical Diagnostics Confidential - Not For Further Distribution
©2012 Ortho Clinical Diagnostics Ortho Clinical Diagnostics -- Confidential | Not for further distribution
Exercise—Neapolitan Shores Laboratory* Results 1
40
New draw schedule for routine tests: peak hour volume is 2,200 specimens—69% decrease
* Actual customer data. Name of the customer has been changed to maintain anonymity.

21
©2011Ortho-Clinical Diagnostics, Inc. Ortho-Clinical Diagnostics Confidential - Not For Further Distribution
©2012 Ortho Clinical Diagnostics Ortho Clinical Diagnostics -- Confidential | Not for further distribution
Exercise—Neapolitan Shores Laboratory* Results 2
41
Baseline scheduling
New scheduling
•! Reduced order-to-receive cycle time by 29% •! Reassigned 6 phlebotomists to open lab positions,
saving $160,000 •! Established 9 draws per hour productivity standard
(vs. 2 per hour) * Actual customer data. Name of the customer has been changed to maintain anonymity.
©2011Ortho-Clinical Diagnostics, Inc. Ortho-Clinical Diagnostics Confidential - Not For Further Distribution
©2012 Ortho Clinical Diagnostics Ortho Clinical Diagnostics -- Confidential | Not for further distribution
Exercise—U’Pere Health System* Microbiology Background •! North Dakota* lab with aggressive outreach and reference lab
business •! Micro specimens incubated for 12 hours (minimum); read at 5 AM •! Existing outreach contracts with multi-state clients and offshore
accounts create challenges for the lab –! Specimens from offshore clients received in the evening +1 day, i.e.
Tuesday’s specimens received Wednesday evening –! One tech devoted to plating specimens when they arrive
•! Other techs then overburdened by routine lab volumes
•! Lab is concerned about the service level for offshore clients given that specimens aren’t read until +3 days (finalized +4 days) –! Tuesday’s specimens are received Wednesday evening, then read on
Friday morning (specimens have not incubated long enough for the Thursday 5 AM read time), and are finalized on Saturday after appropriate workup
42 * Actual customer data. Name of the customer has been changed to maintain anonymity.
22
©2011Ortho-Clinical Diagnostics, Inc. Ortho-Clinical Diagnostics Confidential - Not For Further Distribution
©2012 Ortho Clinical Diagnostics Ortho Clinical Diagnostics -- Confidential | Not for further distribution
Exercise—U’Pere Health System* Microbiology Approach and Results
•! Read micro specimens two times per day, 5 AM and 5 PM –!Use visual controls to indicate which specimens to read at which
time
•! Implement cycles of work for all lab techs to more effectively maintain the flow of work volumes when courier drops arrive –! In each 10 – 12 minute cycle, each tech sequences through work
tasks at specific work stations
•! Result: achieved service level targets for offshore clients –! Spin-off benefit for local patients: twice-a-day reads enabled faster
clinical intervention for local patients with positive reads
43 * Actual customer data. Name of the customer has been changed to maintain anonymity.
©2011Ortho-Clinical Diagnostics, Inc. Ortho-Clinical Diagnostics Confidential - Not For Further Distribution
©2012 Ortho Clinical Diagnostics Ortho Clinical Diagnostics -- Confidential | Not for further distribution
Exercise—Sandy Shores Healthcare System* Background 1
•! Seven hospital system in a large metro area –! All anatomical pathology (AP) specimens processed at an AP lab at
the Medical Center site
•! Couriers crisscross the metro area throughout the day picking up specimens at physician’s offices and outlying hospitals and delivering them to the Medical Center site –! The majority of volume arrives at the Medical Center lab in the early
evening
•! Turnaround times are well in excess of targets
44 * Actual customer data. Name of the customer has been changed to maintain anonymity.

23
©2011Ortho-Clinical Diagnostics, Inc. Ortho-Clinical Diagnostics Confidential - Not For Further Distribution
©2012 Ortho Clinical Diagnostics Ortho Clinical Diagnostics -- Confidential | Not for further distribution
Exercise—Sandy Shores Healthcare System* Background 2 •! When large batches of specimens arrive by courier or are
delivered from the Medical Center’s large OR, the lab gets completely bogged down. Biopsy specimens, which should be prioritized to report results promptly, get lost in the shuffle, even though they require less overall processing time.
•! Lab assistants in accessioning receive specimens, handle them in batches and “push” them to the next step, which is grossing
•! Pathology assistants gross specimens in batches and “push” them to the next operations step, which is tissue processing
•! Tissue processing takes 3.5 hours (biopsies) or 9.5 hours (other) and is the bottleneck operation –!Histology has a regular schedule for running the tissue processors,
however, they generally do not follow it –! Some tissue processors are idle (not scheduled) when they could be
running 45 * Actual customer data. Name of the customer
has been changed to maintain anonymity.
©2011Ortho-Clinical Diagnostics, Inc. Ortho-Clinical Diagnostics Confidential - Not For Further Distribution
©2012 Ortho Clinical Diagnostics Ortho Clinical Diagnostics -- Confidential | Not for further distribution
Exercise—Sandy Shores Healthcare System* Approach •! Modify courier routes and schedule to deliver more volume to the lab
earlier in the day –! Previously, several existing courier routes ran very close to the Medical Center
at mid-day, yet did not stop for delivery until the end of the day •! Implement an internal courier to “pull” specimens from OR and in-house
procedure areas once per hour (during day shift) •! Adjust tissue processor schedule to maximize utilization of processors •! Track and report actual-versus-plan for the tissue processing schedule •! Synchronize the flow of specimens from grossing to histology to align
with the processor schedule (instead of “push”) •! Dedicate one pathology assistant to grossing biopsies, the largest
volume of work by number of specimens •! Define three categories of specimens (including biopsies) to enable
level loading of grossing. Implement single piece flow “pull” system between accessioning and grossing
46 * Actual customer data. Name of the customer has been changed to maintain anonymity.

24
©2011Ortho-Clinical Diagnostics, Inc. Ortho-Clinical Diagnostics Confidential - Not For Further Distribution
©2012 Ortho Clinical Diagnostics Ortho Clinical Diagnostics -- Confidential | Not for further distribution
Exercise—Sandy Shores Healthcare System* Results
•! Processed a greater portion of biopsy volume earlier in the day. Improved conformance with tissue processing schedule.
•! Other improvements still in progress…
47
Proportion of Tissue Processed after 4 PM
Proportion of Biopsies Received in Histology before 4 PM
Proportion of Biopsies Processed before 4 PM
Before 87% 8% 0% After 77% 23% 23%
* Actual customer data. Name of the customer has been changed to maintain anonymity.
©2011Ortho-Clinical Diagnostics, Inc. Ortho-Clinical Diagnostics Confidential - Not For Further Distribution
©2012 Ortho Clinical Diagnostics Ortho Clinical Diagnostics -- Confidential | Not for further distribution
Discussion of Scenarios
48

25
©2011Ortho-Clinical Diagnostics, Inc. Ortho-Clinical Diagnostics Confidential - Not For Further Distribution
©2012 Ortho Clinical Diagnostics Ortho Clinical Diagnostics -- Confidential | Not for further distribution
Contact Information •! Dale Hershfield
•! Sr. Lean Consultant ValuMetrix Services Ortho Clinical Diagnostics PART OF THE Johnson & Johnson FAMILY OF COMPANIES
•! Phone: 830-305-7051
•! Email: [email protected]
49