esn analyser investment research - zonavalue.com · esn analyser investment research page 2 of 60...
TRANSCRIPT

ESN Analyser
Investment Research
Page 1 of 60
Produced & Distributed by the Members of ESN (see last page of this report)
ESN Analyser
Investment Research
14 November 2016
DEAR CLIENT,
INVITATION
“31st ESN EUROPEAN CONFERENCE”
London, 13 December 2016
Merchant Taylors’ Hall (30 Threadneedle Street, London, EC2R 8JB)
Companies available for one-to-one meetings Please consult the ESN website conference dedicated page
http://www.esnpartnership.eu/conferences/actual
ESN Top Picks
Roadshows
Corporate Events
Tactical Sector Views
ESN European Top Picks
ANIMA (IN)- SMALL & MID CAPS
CELLNEX TELECOM (IN)- SMALL & MID CAPS
EUSKALTEL (IN)- SMALL & MID CAPS
RECOMMENDATION CHANGES
UnipolSai downgraded to Neutral from Accumulate Conference call: some highlights – Downgrade from Accumulate to Neutral
Credem upgraded to Accumulate from Neutral Q3 16 results
STRATEGY NEWS
European Strategy News: ESN Fundamental Value Monitor
NEWS BY SECTOR
AUTOMOBILES & PARTS
Stern Groep (Buy) Further progress in divesting property; book profit 5m
BANKS
Banco Santander (Buy) Potential repurchase of 50% of its AM
Credem (Accumulate) Q3 16 results
Creval (Neutral) Partnership in factoring
Deutsche Pfandbriefbank (Buy) Adj. Q3 results in line, extra dividend more likely
UBI Banca (Buy) Feed-back from results’ presentation

ESN Analyser
Investment Research
Page 2 of 60
Produced & Distributed by the Members of ESN (see last page of this report)
FINANCIAL SERVICES
Anima (Buy) 3Q16 results in line with estimates
Ferratum (Buy) Model Update
TIP Tamburi Investment Partners (Buy) 9M 16 results
FOOD & BEVERAGE
Enervit (Accumulate) Q3 16 results in line with our estimates
La Doria (Neutral) 9M 16 results weak as expected
FOOD & DRUG RETAILERS
Sector News Portugal - Prices in the “Food and non-alcoholic beverages” segment in October 2016 (+0.45% YoY)
Marr (Accumulate) Q3 16 results preview
GENERAL INDUSTRIALS
Kendrion (Buy) Good progress in strategy and results are recovering
HEALTHCARE
Pihlajalinna (Buy) Promising signs of profitability
HOUSEHOLD GOODS
Fila (Buy) 9M 16 results: good top line growth
INDUSTRIAL ENGINEERING
Biesse (Accumulate) Positive 9M results and FY 16 guidance update
Datalogic (Accumulate) 9M 16 results: profitability slightly higher than expected
Emak (Accumulate) 9M 16 results
Prima Industrie (Buy) Q3: good results, improving profitability
INSURANCE
Cattolica Assicurazioni (Neutral) 3Q16 better than expected – 2017 targets revised down
UnipolSai (Neutral) Conference call: some highlights – Downgrade from Accumulate to Neutral
MATERIALS, CONSTRUCTION & INFRASTRUCTURE
Atlantia (Accumulate) Sound results in Q3
Heijmans (Buy) CFO to leave early next year
Lehto (Accumulate) Guidance upgrade, target price to EUR 10
Sacyr (Buy) Meeting held with the company
SIAS (Buy) Q3 results good and better than expected
Trevi (Accumulate) Oil & gas division expected to hit Q3 results
MEDIA
Sector News ESN Fundamental Value Monitor
Lagardère (Accumulate) Post Q3 revenues: confirmation of FY guidance
OIL SERVICES
Technip (Buy) Confirmation of the acceleration in draft-design studies
PERSONAL GOODS
Salvatore Ferragamo (Accumulate) Ferragamo: 9M 16 results preview
ESN Analyser
Investment Research
Page 3 of 60
Produced & Distributed by the Members of ESN (see last page of this report)
REAL ESTATE
ADLER Real Estate (Buy) Q3 results in line with expectations on FFO I level
Hispania Activos Inmobiliarios (Buy) 9m’16 results: good operating momentum
SOFTWARE & COMPUTER SERVICES
Exprivia (Accumulate) 9m 2016 Post: back to growth with ACS, higher debt
TomTom (Buy) Technology Day feedback – a positive afternoon
SUPPORT SERVICES
Cellnex Telecom (Buy) Excessive and unjustified fall
Edenred (Buy) Roadshow feedback: compelling growth prospects
Openjobmetis (Buy) Positive 9M 16 results
TELECOMMUNICATIONS
Sector News Altice’s CFO argues that sport content costs will impact consumer prices in Portugal
Euskaltel (Buy) Investments increasing…
Telecom Italia (Accumulate) Conversion of EUR 1.3bn bond
UTILITIES
Snam (Accumulate) We expect a declining set of figures in 9M 2016 Y/Y

ESN Top Picks
Page 4 of 60
Produced & Distributed by the Members of ESN (see last page of this report)
Blue Chips Top Picks
Compa ny Count r y S e c t or I de a Ra t i ngP r i c e a s of
13 / 11/ 2 0 16
Ta r ge t
P r i c e
Upsi de /
Downsi deEnt r y da t e
Ent r y
pr i c e
Ent r y
pr i c e
( D i v .
Adj )
Tot a l
Re t ur n
Ent r y To
Da t e
Re l . Cml . d
pe r f . v s Eur o
S t ox x
AM ADEUS Spain Sof t ware & Comput er Services Long Buy 40.31 50.70 26% 18/ 08/ 2016 41.96 41.96 - 3 . 9 % -4.5%
CI E FI N . R I CHEM ONT Swit zerland Personal Goods Long Buy 66.15 76.00 15% 17/ 10/ 2016 66.30 66.30 - 0 . 2 % 0.3%
I NDI TEX Spain General Ret ailers Long Accumulat e 30.49 36.10 18% 18/ 08/ 2016 30.93 30.33 0 . 5 % -0.1%
KP N TELECOM Net herlands Telecommunicat ions Long Buy 2.69 3.55 32% 20/ 09/ 2016 2.82 2.82 - 4 . 8 % -5.6%
P OS TE I TALI ANE It aly Banks Long Accumulat e 5.97 7.90 32% 03/ 11/ 2016 5.96 5.96 0 . 3 % -0.7%
RELX Net herlands Media Long Accumulat e 14.18 16.75 18% 27/ 10/ 2016 15.14 15.14 - 6 . 3 % -4.3%
S TORA ENS O Finland Basic Resources Long Accumulat e 8.72 9.30 7% 17/ 10/ 2016 8.16 8.16 6 . 9 % 7.4%
TECHNI P France Oil Services Long Buy 62.93 67.00 6% 18/ 102016 58.60 58.60 7 . 4 % 7.5%
source: ESN Members’ estimates
M/S Caps Top Picks
Compa ny Count r y S e c t or I de a Ra t i ngP r i c e a s of
13 / 11/ 2 0 16
Ta r ge t
P r i c e
Upsi de /
Downsi deEnt r y da t e
Ent r y
pr i c e
Ent r y pr i c e
( D i v . Adj )
Tot a l
Re t ur n
Ent r y To
Da t e
Re l . Cml . d
pe r f . v s
Eur o
S t ox x
ACERI NOX Spain Basic Resources Long Buy 11.85 14.00 18% 18/ 08/ 2016 11.71 11.71 1. 2 % 0.6%
ALTRAN France Sof t ware & Comput er Services Long Buy 12.28 15.00 22% 17/ 10/ 2016 13.20 13.20 - 7 . 0 % -6.4%
ANI M A It aly Financial Services Long Buy 4.89 5.80 19% 11/ 11/ 2016 4.13 4.13 18 . 3 % 18.8%
CAF Spain Indust r ial Transport at ion Long Accumulat e 344.80 390.00 13% 18/ 08/ 2016 342.80 342.80 0 . 6 % -0.0%
CELLNEX TELECOM Spain Support Services Long Buy 12.77 19.60 53% 11/ 11/ 2016 13.03 13.03 - 2 . 0 % -2.8%
DEUTS CHE P FANDBRI EFBANK Germany Banks Long Buy 9.73 12.30 26% 22/ 08/ 2016 8.10 8.10 2 0 . 1% 19.4%
EUS KALTEL Spain Telecommunicat ions Long Buy 8.43 12.00 42% 11/ 11/ 2016 8.62 8.62 - 2 . 2 % -4.1%
FOLLI FOLLI E GROUP Greece General Ret ailers Long Buy 20.64 27.70 34% 07/ 11/ 2016 20.91 20.91 - 1. 3 % -3.2%
FORFARM ERS Net herlands Food & Beverage Long Buy 6.93 8.30 20% 28/ 09/ 2016 6.48 6.48 7 . 0 % 6.3%
FUGRO Net herlands Oil Services Long Buy 15.26 19.00 25% 20/ 10/ 2016 15.56 15.56 - 1. 9 % -0.2%
J UM BO Greece General Ret ailers Long Buy 11.77 14.99 27% 21/ 10/ 2016 12.62 12.35 - 4 . 7 % -2.6%
NH HOTEL GROUP Spain Travel & Leisure Long Buy 3.90 6.80 74% 18/ 08/ 2016 4.00 4.00 - 2 . 5 % -3.1%
NOS Port ugal Telecommunicat ions Long Buy 5.62 7.00 25% 17/ 10/ 2016 5.89 5.89 - 4 . 6 % -4.0%
RI B S OFTWARE Germany Sof t ware & Comput er Services Long Buy 13.67 14.00 2% 20/ 06/ 2016 8.29 8.29 6 4 . 9 % 58.8%
TECHNOGYM It aly Personal Goods Long Buy 3.80 4.95 30% 15/ 06/ 2016 3.78 3.78 0 . 6 % -7.0%
THE NAVI GATOR COM P ANY Port ugal Basic Resources Long Buy 2.63 4.60 75% 22/ 06/ 2016 2.72 2.72 - 3 . 3 % -5.4%
YOOX NET- A- P ORTER It aly General Ret ailers Long Buy 24.70 31.30 27% 17/ 10/ 2016 27.82 27.82 - 11. 2 % -10.6%
source: ESN Members’ estimates
This selection of stocks is not intended to provide a recommended portfolio; therefore there is no point in comparing its performance with any benchmark. The performance of each stock has to be considered independently. Risk factors are taken into account when selecting individual stocks but the risk profile of the selection as a whole is not considered. The approach used to select each investment idea is opportunistic with an absolute return target.

ESN Top Picks
Page 5 of 60
Produced & Distributed by the Members of ESN (see last page of this report)
SMALL & MID CAPS (IN)
ANIMA
The upside will be underpinned by the opportunities for growth arising from the strategic partner networks and the success of the agreement with Poste (net inflows of c. EUR 15bn by 2020), which could also be able to offset the loss of Montepaschi assets (we estimate c. EUR 23bn will be completely lost in 7 years starting from 2019). The need of Italian wealth to obtain a decent yield in the present low rates environment can determine further growth in the retail segment. Some opportunities are also likely to arise from the Popolari bank M&As in 2017 and 2018, which could speed up some aggregations of appealing asset management companies, (first of all with Aletti Gestielle and/or Arca), fostering the economies of scale.. Mr Carreri, Anima’s CEO, confirmed to be interested in combining with Aletti Gestielle (Banco Popolare’s asset management company). The non-binding offer presented together with Poste and CDP for Pioneer could be the trigger in the short term. We also underline that the role of asset management in banks’ profitability remains strategic in the medium term as long as interest rates remain low. In 2017 Poste could contribute its asset management company (BancoPosta Fondi SGR) to ANIMA Holding, trying to increase the stake in ANIMA from the current 10.32% up to a maximum of 24.9% of ANIMA voting rights. This operation will allow as of the beginning, to count on over EUR 147bn in assets (as of 30 September 2016) and is subject to Anima’s shareholder meeting approval. By applying the FCFE method we obtained a TP of EUR 5.8 per share. We stick to buy rating.
Despite a pure peer comparison could be misleading, due to Anima’s peculiar business model, in terms of multiple P/E 2016 and 2017 Anima is trading with a discount of c. 21% and 18% respectively vs its main European peers (Man, Henderson, Schroders, Vontobel). In terms of market capitalization on total assets, Anima is trading around 1.9% and 1.8% for 2016 and 2017, compared to 2.3% and 2.2% respectively of the same European peers.

ESN Top Picks
Page 6 of 60
Produced & Distributed by the Members of ESN (see last page of this report)
CELLNEX TELECOM
TSR growths lean on the organic rise in PoPs (above forecasts in last results 9M'16) and the change in the consolidation perimeter (Galata TEF’s towers Protelindo Commscon Bouygues Shere).Our recommendation leans on the following aspects: visibility and recurrent cash flows (OpCF’17e yield of 6.4%), deleveraging capacity, neutrality (unlike other peers: Telxius, Inwit and EI Towers), long term anchor contracts with clients (Wind, Telefonica, Yoigo, KPN, Bouygues), diversified pipeline, operating leverage and potential to widen margins, structural strength in core business and nitche sectors (small cells, backhauling), very competitive cost of debt with over 60% at a fixed rate and possible rationalisation of the network in Europe.
We don't think yesterday drop of the CLNX' share price (-6.2%) was justified. It has been an overreaction due to the potencial higher interest rates in US that could penalize American peers as Towers/SBA Comm./Crown Castle.Acquisitions accretive as from Day 1. The recent M&A (4 acquisitions since its listing) implies increasing FCRA from EUR27m annual base considering incurred financial costs. The average EBITDA mg reached 77% and cash transformation 70%. Although we expect debt to reach 4.5x at year-end, the increasing cash generation and deleveraging capacity makes the additional debt manageable.
Guidance reiterated, bearing in mind the consolidation of the recent M&A move. Including: 1) Similar adjusted EBITDA as in 3Q’16 for the rest of the year; 2) maintenance capex representing 3% total revenues; 3) interests paid according to the final debt structure (majority paid in 3Q’16); 4) taxes in lien with 2015 despite the perimeter changes; 5) leveraged recurrent cash flow per share with >20% growth Y/Y; 6) organic growth of POPs around 3%; and 7) WC tending towards neutral.
TP EUR19.6/sh. = 70% DCF (EUR19.4/sh.) 30% M&A hypotesis considering potential synergies. Lasts M&A movements
included in our estimates.

ESN Top Picks
Page 7 of 60
Produced & Distributed by the Members of ESN (see last page of this report)
EUSKALTEL
Euskaltel’s shares have fallen -25.6% YTD, however, in our view the stock will consolidate the positive trend that has begun. Although, in the medium term EKT’s market share will erode (mainly in fixed BB and pay-tv; on the contrary in mobile due to the positive effects from convergence) while operators such as VOD and ORA accelerate their FTTH deployments, there are enough short/medium term drivers to back our recommendation change from Neutral to Buy and fair value from EUR9 to EUR12/share.
- National/International roadshow to introduce the new CEO, Mr. F. Arteche.
- The upcoming 4Q’16 results will reflect synergies from the integration with R. These are evolving well and EKT anticipated more ambitious synergies with R Cable during the results CC (proceeding from uniting central services, administration homogenising investments, e-billing and IT) even despite the non-existence geographic over-lapping and not uniting the brand.
- News on attractive dividends: EKT mentioned its intention to set a 90% pay-out on 2016 results. The high cash generation will permit less than 4.5x net debt/EBITDA in 2017 (excluding dividends).
We have revised our estimates up mainly in revenues and operating leverage due to the higher synergies in the integration with R. We have also reduced capex to 14/15% 2019-20e, increasing the tax rate (32%) and beta from 0.8 to 0.9 due to the lower management risk. TP EUR12/sh.
Roadshows
Page 8 of 60
Produced & Distributed by the Members of ESN (see last page of this report)
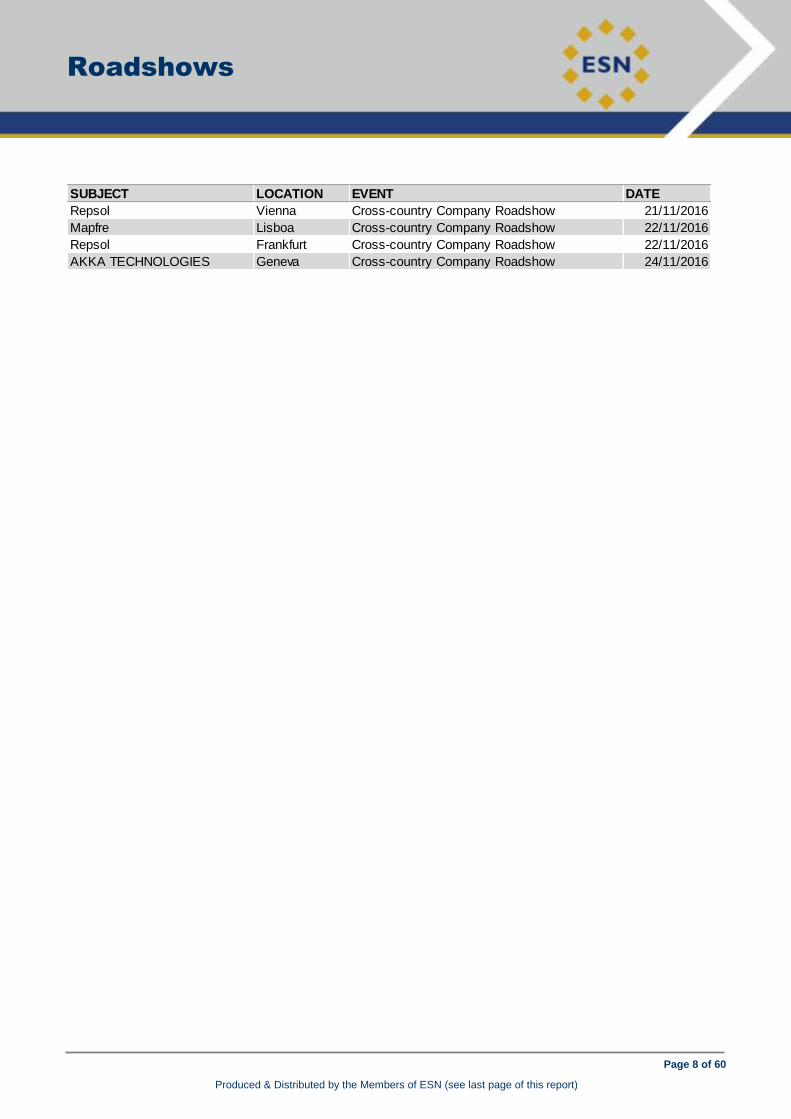
SUBJECT LOCATION EVENT DATE
Repsol Vienna Cross-country Company Roadshow 21/11/2016
Mapfre Lisboa Cross-country Company Roadshow 22/11/2016
Repsol Frankfurt Cross-country Company Roadshow 22/11/2016
AKKA TECHNOLOGIES Geneva Cross-country Company Roadshow 24/11/2016

Corporate Events
Page 9 of 60
Produced & Distributed by the Members of ESN (see last page of this report)
Corporate Events today
Source: Precise
CompanyBloomberg
codeDate Event Type Description
ACS ACS SM 14/11/16 Results Q3 2016 Results
ADLER REAL ESTATE ADL GY 14/11/16 Results Q3 2016 Results
AEROPORTS DE PARIS ADP FP 14/11/16 Sales October Traffic Figures
BOLLORE BOL FP 14/11/16 Trading Update Q3 2016 Sales
CORP. FINANCIERA ALBA ALB SM 14/11/16 Results Q3 2016 Results
DEUTSCHE EUROSHOP DEQ GR 14/11/16 Results Q3 2016 Results
DEUTSCHE PFANDBRIEFBANKPBB GR 14/11/16 Results Q3 2016 Results
HISPANIA ACTIVOS INMOBILIARIOSHIS SM 14/11/16 Results Q3 2016 Earnings conference call {English}
IMA IMA IM 14/11/16 Results Q3 2016 Results
INDRA SISTEMAS IDR SM 14/11/16 Results Q3 2016 Earnings conference call / Webcast
IDR SM 14/11/16 Results Q3 2016 Results
MARR MARR IM 14/11/16 Results Q3 2016 Results
MAX AUTOMATION AG MXH GR 14/11/16 Results Q3 2016 Results
OBRASCON HUARTE LAIN OHL SM 14/11/16 Results Q3 2016 Results
OHL SM 14/11/16 Results Q3 2016 Earnings conference call / Webcast
SALVATORE FERRAGAMO SFER IM 14/11/16 Results Q3 2016 Earnings conference call / Webcast
SFER IM 14/11/16 Results Q3 2016 Results
SMT SCHARF AG S4A GY 14/11/16 Results Q3 2016 Results
SNAM SRG IM 14/11/16 Results Q3 2016 Results
SONAE INDUSTRIA SONI PL 14/11/16 Results Q3 2016 Earnings conference call
SURTECO SUR GR 14/11/16 Results Q3 2016 Results
TELEPERFORMANCE RCF FP 14/11/16 Trading Update Q3 2016 Sales conference call
RCF FP 14/11/16 Trading Update Q3 2016 Sales
TREVI TFI IM 14/11/16 Results Q3 2016 Results
VISCOM V6C GR 14/11/16 Results Q3 2016 Results
V6C GR 14/11/16 Results Q3 2016 Earnings conference call

ESN Tactical Sector Views
Page 10 of 60
Produced & Distributed by the Members of ESN (see last page of this report)
Tactical Sector Allocation Matrix July 2016
SectorCurrent Tactical
ViewAction
Previous
Tactical View
Stoxx 600
Weighting
LATEST REVIEW
DATE
Automobiles & Parts + upgrade = 3% Jul-16
Banks - - 10% Jul-16
Basic Resources = = 2% Jul-16
Chemicals = = 5% Jul-16
Construction & Materials + + 3% Jul-16
Financial Services - dow ngrade = 2% Jul-16
Food & Beverage + + 7% Jul-16
Healthcare + upgrade = 14% Jul-16
Industrial Good & Services + upgrade = 11% Jul-16
Insurance - dow ngrade + 6% Jul-16
Media - dow ngrade = 3% Jul-16
Oil & Gas = = 5% Jul-16
Personal & Household Goods + + 9% Jul-16
Real Estate + upgrade - 2% Jul-16
Retail - dow ngrade = 3% Jul-16
Technology + upgrade = 4% Jul-16
Telecommunications = dow ngrade + 5% Jul-16
Travel & Leisure + + 2% Jul-16
Utilities + upgrade - 4% Jul-16
Legend: + (Overw eight); =/+ (Slightly Overw eight); = (Market Weight); =/- (Slightly Underw eight); - (Underw eight);
Note: The tactical sector view is the shorter term trading view of the ESN strategy team and it can vary from the longer term
fundamental view of the relevant ESN sector analyst team
Page 11 of 60
Produced & Distributed by the Members of ESN (see last page of this report)
Strategy Update Summary
Analyser
$SECTOR$
European Strategy News: ESN Fundamental Value Monitor
ESN Fundamental Value Monitor
Conventional valuation measures for equity markets can be deceptive whenever earnings are significantly at
variance to their long term trend lines and/or whenever real interest rates / bond yields are significantly at variance
to their long run equilibrium levels. We see equity markets as being priced at fair value for the long run when the trend
line level of earnings is yielding 6%, consistent with a mean reverting required real total return of 6% per annum (which
decomposes into a mean reverting required real risk-free return of 3% plus a required equity risk premium of 3%).
Since the last cycle trough in 2009, cyclical expansion has pushed US earnings back above the long run trend line
(notwithstanding the subsidence over recent quarters which now appears to be reversing). In the aftermath of the Euro-
zone debt crisis, European earnings have struggled to recover cyclically and languish well below trend. Meanwhile, real
interest rates and bond yields remain at historically low levels, way below our assumptions for long run equilibrium. There
is some recent evidence of tentative upward cyclical pressure in the US albeit less so in Europe and elsewhere.
Looking beyond immediate cyclical forces, more important structural forces will continue to determine the propensity for
earnings and real interest rates / bond yields to reside above or below their long term trend/equilibrium levels over the
medium to longer term. We see excess global labour supply (stemming from globalisation and closely linked to excess
global savings) as the common factor linking the tendency over recent years/decades towards structurally low interest rates
and structurally high corporate profitability. We expect any structural mean reversion of profitability and interest rates to be
slow and tentative (albeit that recent anti-globalisation political drift in the US and Europe warrants caution against
complacency), suggesting that likely continuation of the current global economic expansion cycle could sustain earnings at
or above trend levels in a relatively benign structural interest rate environment for a time yet. This suggests that, over the
medium term, conventional valuation models (concentrating on current levels for earnings and interest rates) could be
making equity markets look cheaper than will ultimately prove to have been sustainable over the longer term.
Hypothetically assuming immediate mean reversion of both earnings and bond yields to their long run trend levels,
prospective long run equity risk premiums across the five main European markets (UK, France, Germany, Spain
and Italy) are currently averaging at 4.08% (as per the index data we use). This is above the long run mean-
reverting required level of 3% per annum and consistent with expected long run real total returns averaging 7.08%
compared to the required level of 6.0%. These figures are consistent with the main European markets having
potential upsides to fair value of about 18% on average. On the same mean-reversionary assumption, the prospective
risk premium for the US equity market is particularly inadequate at 1.03%, consistent with a prospective long run real total
return of 4.03% and implying downside to fundamental fair value of about 33%.
A significant caveat is that the index data shows trend growth rates in earnings for some of the main European
markets somewhat higher than might be considered sustainable/credible, implying the potential for progressive
overstatement of the fair value level of the market from some point in the past or future. However, we estimate that
the five main European markets on average would still be priced to deliver the long run required real total return of
6% if the trend earnings level was as low as 85% of the currently indicated level on the charts. So there is a margin
of comfort.
We conclude that European equities are at least modestly undervalued for the long run. Our confidence in the US earnings and index data inclines us to the trend earnings based indication that this market is quite significantly overvalued for the longer term, although it could continue to look reasonably attractive on conventional valuation measures (comparing the current earnings yield with current real interest rates/bond yields) for some time yet. Indeed, European equity markets could continue to look all the more attractive on such conventional measures for quite some time.
Authors: Bernard McAlinden, ESN, +353 87 241 4826, [email protected]
Kate O’Dowd, ESN, +39.02.4344.4447, [email protected]
Page 12 of 60
Produced & Distributed by the Members of ESN (see last page of this report)
Stern Groep
Netherlands/Automobiles & Parts Analyser
AUTOMOBILES & PARTS
Stern Groep (Buy) ESN Fundamental Value Monitor Buy
18.50
closing price as of 10/11/2016
22.00
Target Price unchanged
Recommendation unchanged
Target price: EUR
Share price: EUR
Reuters/Bloomberg ARTN.AS/STRN NA
Market capitalisation (EURm) 110
Current N° of shares (m) 6
Free float 26%
Daily avg. no. trad. sh. 12 mth 5
Daily avg. trad. vol. 12 mth (m) 64
Price high 12 mth (EUR) 19.89
Price low 12 mth (EUR) 15.25
Abs. perf. 1 mth -3.90%
Abs. perf. 3 mth -3.39%
Abs. perf. 12 mth 18.21%
Key financials (EUR) 12/15 12/16e 12/17e
Sales (m) 1,095 1,071 1,107
EBITDA (m) 29 34 39
EBITDA margin 2.7% 3.1% 3.5%
EBIT (m) 19 23 28
EBIT margin 1.7% 2.1% 2.5%
Net Profit (adj.)(m) 12 15 19
ROCE 3.2% 4.2% 5.0%
Net debt/(cash) (m) 296 265 260
Net Debt/Equity 2.0 1.7 1.5
Debt/EBITDA 10.2 7.9 6.6
Int. cover(EBITDA/Fin. int) 5.8 7.3 8.3
EV/Sales 0.3 0.3 0.3
EV/EBITDA 12.5 9.9 8.4
EV/EBITDA (adj.) 12.5 9.9 8.4
EV/EBIT 19.3 14.5 11.7
P/E (adj.) 8.9 7.2 5.8
P/BV 0.7 0.7 0.6
OpFCF yield -12.4% 34.4% 11.3%
Dividend yield 0.0% 5.5% 7.0%
EPS (adj.) 2.03 2.56 3.22
BVPS 26.09 28.01 29.18
DPS 0.00 1.02 1.29
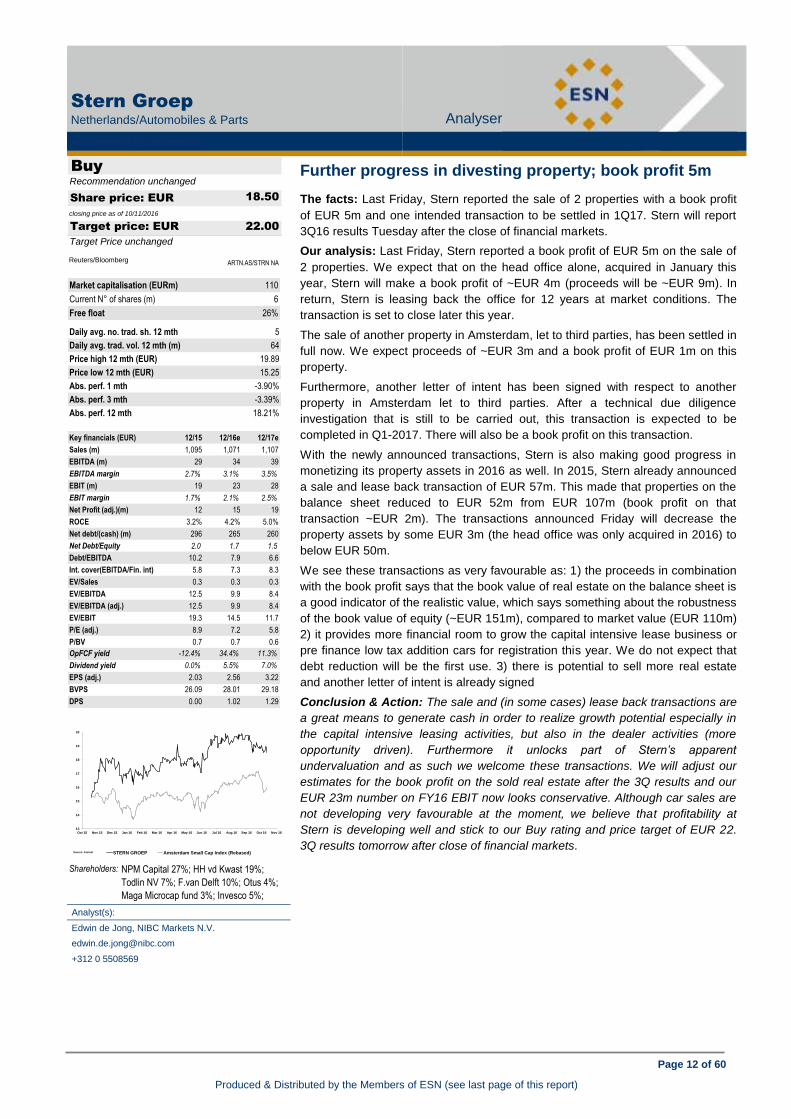
Further progress in divesting property; book profit 5m
The facts: Last Friday, Stern reported the sale of 2 properties with a book profit
of EUR 5m and one intended transaction to be settled in 1Q17. Stern will report
3Q16 results Tuesday after the close of financial markets.
Our analysis: Last Friday, Stern reported a book profit of EUR 5m on the sale of
2 properties. We expect that on the head office alone, acquired in January this
year, Stern will make a book profit of ~EUR 4m (proceeds will be ~EUR 9m). In
return, Stern is leasing back the office for 12 years at market conditions. The
transaction is set to close later this year.
The sale of another property in Amsterdam, let to third parties, has been settled in
full now. We expect proceeds of ~EUR 3m and a book profit of EUR 1m on this
property.
Furthermore, another letter of intent has been signed with respect to another
property in Amsterdam let to third parties. After a technical due diligence
investigation that is still to be carried out, this transaction is expected to be
completed in Q1-2017. There will also be a book profit on this transaction.
With the newly announced transactions, Stern is also making good progress in
monetizing its property assets in 2016 as well. In 2015, Stern already announced
a sale and lease back transaction of EUR 57m. This made that properties on the
balance sheet reduced to EUR 52m from EUR 107m (book profit on that
transaction ~EUR 2m). The transactions announced Friday will decrease the
property assets by some EUR 3m (the head office was only acquired in 2016) to
below EUR 50m.
We see these transactions as very favourable as: 1) the proceeds in combination
with the book profit says that the book value of real estate on the balance sheet is
a good indicator of the realistic value, which says something about the robustness
of the book value of equity (~EUR 151m), compared to market value (EUR 110m)
2) it provides more financial room to grow the capital intensive lease business or
pre finance low tax addition cars for registration this year. We do not expect that
debt reduction will be the first use. 3) there is potential to sell more real estate
and another letter of intent is already signed
Conclusion & Action: The sale and (in some cases) lease back transactions are
a great means to generate cash in order to realize growth potential especially in
the capital intensive leasing activities, but also in the dealer activities (more
opportunity driven). Furthermore it unlocks part of Stern’s apparent
undervaluation and as such we welcome these transactions. We will adjust our
estimates for the book profit on the sold real estate after the 3Q results and our
EUR 23m number on FY16 EBIT now looks conservative. Although car sales are
not developing very favourable at the moment, we believe that profitability at
Stern is developing well and stick to our Buy rating and price target of EUR 22.
3Q results tomorrow after close of financial markets.
13
14
15
16
17
18
19
20
Oct 15 Nov 15 Dec 15 Jan 16 Feb 16 Mar 16 Apr 16 May 16 Jun 16 Jul 16 Aug 16 Sep 16 Oct 16 Nov 16
vvdsvdvsdy
STERN GROEP Amsterdam Small Cap Index (Rebased)Source: Factset Shareholders: NPM Capital 27%; HH vd Kwast 19%;
Todlin NV 7%; F.van Delft 10%; Otus 4%;
Maga Microcap fund 3%; Invesco 5%; Analyst(s):
Edwin de Jong, NIBC Markets N.V.
+312 0 5508569
Page 13 of 60
Produced & Distributed by the Members of ESN (see last page of this report)
Banco Santander
Spain/Banks Analyser
BANKS
Banco Santander (Buy) Further progress in divesting property; book profit 5m
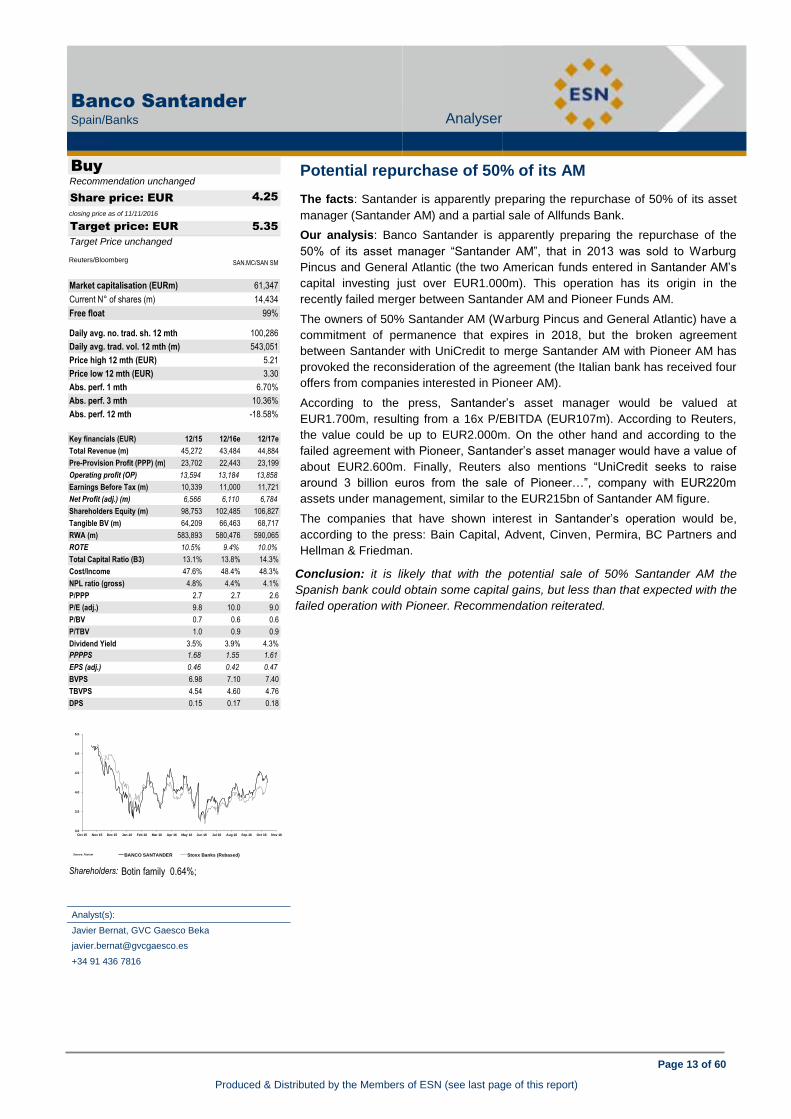
Potential repurchase of 50% of its AM
The facts: Santander is apparently preparing the repurchase of 50% of its asset
manager (Santander AM) and a partial sale of Allfunds Bank.
Our analysis: Banco Santander is apparently preparing the repurchase of the
50% of its asset manager “Santander AM”, that in 2013 was sold to Warburg
Pincus and General Atlantic (the two American funds entered in Santander AM’s
capital investing just over EUR1.000m). This operation has its origin in the
recently failed merger between Santander AM and Pioneer Funds AM.
The owners of 50% Santander AM (Warburg Pincus and General Atlantic) have a
commitment of permanence that expires in 2018, but the broken agreement
between Santander with UniCredit to merge Santander AM with Pioneer AM has
provoked the reconsideration of the agreement (the Italian bank has received four
offers from companies interested in Pioneer AM).
According to the press, Santander’s asset manager would be valued at
EUR1.700m, resulting from a 16x P/EBITDA (EUR107m). According to Reuters,
the value could be up to EUR2.000m. On the other hand and according to the
failed agreement with Pioneer, Santander’s asset manager would have a value of
about EUR2.600m. Finally, Reuters also mentions “UniCredit seeks to raise
around 3 billion euros from the sale of Pioneer…”, company with EUR220m
assets under management, similar to the EUR215bn of Santander AM figure.
The companies that have shown interest in Santander’s operation would be,
according to the press: Bain Capital, Advent, Cinven, Permira, BC Partners and
Hellman & Friedman.
Conclusion: it is likely that with the potential sale of 50% Santander AM the
Spanish bank could obtain some capital gains, but less than that expected with the
failed operation with Pioneer. Recommendation reiterated.
Analyst(s):
Javier Bernat, GVC Gaesco Beka
+34 91 436 7816
Buy
4.25
closing price as of 11/11/2016
5.35
Target Price unchanged
Recommendation unchanged
Target price: EUR
Share price: EUR
Reuters/Bloomberg SAN.MC/SAN SM
Market capitalisation (EURm) 61,347
Current N° of shares (m) 14,434
Free float 99%
Daily avg. no. trad. sh. 12 mth 100,286
Daily avg. trad. vol. 12 mth (m) 543,051
Price high 12 mth (EUR) 5.21
Price low 12 mth (EUR) 3.30
Abs. perf. 1 mth 6.70%
Abs. perf. 3 mth 10.36%
Abs. perf. 12 mth -18.58%
Key financials (EUR) 12/15 12/16e 12/17e
Total Revenue (m) 45,272 43,484 44,884
Pre-Provision Profit (PPP) (m) 23,702 22,443 23,199
Operating profit (OP) 13,594 13,184 13,858
Earnings Before Tax (m) 10,339 11,000 11,721
Net Profit (adj.) (m) 6,566 6,110 6,784
Shareholders Equity (m) 98,753 102,485 106,827
Tangible BV (m) 64,209 66,463 68,717
RWA (m) 583,893 580,476 590,065
ROTE 10.5% 9.4% 10.0%
Total Capital Ratio (B3) 13.1% 13.8% 14.3%
Cost/Income 47.6% 48.4% 48.3%
NPL ratio (gross) 4.8% 4.4% 4.1%
P/PPP 2.7 2.7 2.6
P/E (adj.) 9.8 10.0 9.0
P/BV 0.7 0.6 0.6
P/TBV 1.0 0.9 0.9
Dividend Yield 3.5% 3.9% 4.3%
PPPPS 1.68 1.55 1.61
EPS (adj.) 0.46 0.42 0.47
BVPS 6.98 7.10 7.40
TBVPS 4.54 4.60 4.76
DPS 0.15 0.17 0.18
3.0
3.5
4.0
4.5
5.0
5.5
Oct 15 Nov 15 Dec 15 Jan 16 Feb 16 Mar 16 Apr 16 May 16 Jun 16 Jul 16 Aug 16 Sep 16 Oct 16 Nov 16
vvdsvdvsdy
BANCO SANTANDER Stoxx Banks (Rebased)Source: Factset
Shareholders: Botin family 0.64%;

Page 14 of 60
Produced & Distributed by the Members of ESN (see last page of this report)
Credem
Italy/Banks Analyser
BANKS
Credem (Accumulate) Potential repurchase of 50% of its AM
Q3 16 results
The facts: Credem published Q3 16 results last Friday after market closing.
Our analysis: Credem closed Q3 16 with a net profit up 6.5% Y/Y to EUR 31m
vs. our flattish expectation, thanks to a slightly better operating performance.
The CET1 ratio improved 10bps Q/Q to 13.5% phased-in and 12.3% fully-loaded.
(EUR m) Q3 16A Q3 16E Differ. Q3 15A Y/Y Q2 16A Q/Q
Revenues 258 255 1.2% 248 4.0% 258 0.0%
Operating
costs -183 -182 0.5% -172 6.4% -193 -5.2%
GOP 75 73 2.7% 76 -1.3% 65 15.4%
Loan
provisions -16 -16 0.0% -18 -11.1% -21 -23.8%
Net Profit 33 31 6.5% 31 6.5% 24 37.5%
Total revenues increased 4% Y/Y to EUR 258m or EUR 3m more than expected,
as net commissions were almost flat Y/Y at EUR 119m vs. our 117.5m estimate
and the insurance income jumped from EUR 8.5m in Q3 15 to EUR 14.5m vs. our
12m forecast. The NII was up a mere 1% Y/Y to EUR 112m as anticipated, while
the trading income was a limited EUR 8m as expected.
Operating costs grew 6.5% Y/Y to EUR 183m as anticipated, fuelled by
continuous hiring and investments, leading to a gross operating profit (GOP)
down 1.3% Y/Y to EUR 75m or EUR 2m more than expected, with a C/I ratio of
70.9%.
Loan impairments were 11% lower Y/Y to EUR 16m as estimated, with a very low
cost of credit risk of less than 30bps thanks to an outstanding credit quality
confirmed by a net NPL ratio of 1.65%.
Finally, the bank booked EUR 9.5m provisions for risks and charges related the
annual contribution to the Deposit Guarantee Scheme.
Conclusion & Action: After a long underperformance, the stock has now a more
adequate valuation of 0.7x 17e P/TBV for 7% 17e ROTE. We upgrade the stock
from Neutral to Accumulate with an unchanged EUR 6.2 target price.
Analyst(s):
Luigi Tramontana, Banca Akros
+39 02 4344 4239
Accumulate
5.28
closing price as of 11/11/2016
6.20
Target Price unchanged
from Neutral
Target price: EUR
Share price: EUR
Reuters/Bloomberg EMBI.MI/CE IM
Market capitalisation (EURm) 1,754
Current N° of shares (m) 332
Free float 23%
Daily avg. no. trad. sh. 12 mth 271
Daily avg. trad. vol. 12 mth (m) 1,183
Price high 12 mth (EUR) 6.99
Price low 12 mth (EUR) 4.81
Abs. perf. 1 mth 3.33%
Abs. perf. 3 mth -0.85%
Abs. perf. 12 mth -15.52%
Key financials (EUR) 12/15 12/16e 12/17e
Total Revenue (m) 1,127 1,072 1,129
Pre-Provision Profit (PPP) (m) 385 314 354
Operating profit (OP) 271 245 263
Earnings Before Tax (m) 239 195 248
Net Profit (adj.) (m) 189 148 179
Shareholders Equity (m) 2,480 2,547 2,666
Tangible BV (m) 2,192 2,259 2,378
RWA (m) 13,251 14,061 14,803
ROTE 7.8% 5.9% 6.9%
Total Capital Ratio (B3) 14.8% 14.4% 14.4%
Cost/Income 64.3% 70.0% 67.9%
NPL ratio (gross) 3.8% 3.6% 3.4%
P/PPP 5.9 5.6 5.0
P/E (adj.) 12.1 11.9 9.8
P/BV 1.0 0.8 0.7
P/TBV 1.0 0.8 0.7
Dividend Yield 2.8% 2.8% 3.8%
PPPPS 1.16 0.94 1.07
EPS (adj.) 0.57 0.44 0.54
BVPS 6.60 6.80 7.16
TBVPS 6.60 6.80 7.16
DPS 0.15 0.15 0.20
4.0
4.5
5.0
5.5
6.0
6.5
7.0
ott 15 nov 15 dic 15 gen 16 feb 16 mar 16 apr 16 mag 16 giu 16 lug 16 ago 16 set 16 ott 16 nov 16
vvdsvdvsdy
CREDEM Stoxx Banks (Rebased)Source: Factset
Shareholders: Credemholding 77%;
Page 15 of 60
Produced & Distributed by the Members of ESN (see last page of this report)
Creval
Italy/Banks Analyser
BANKS
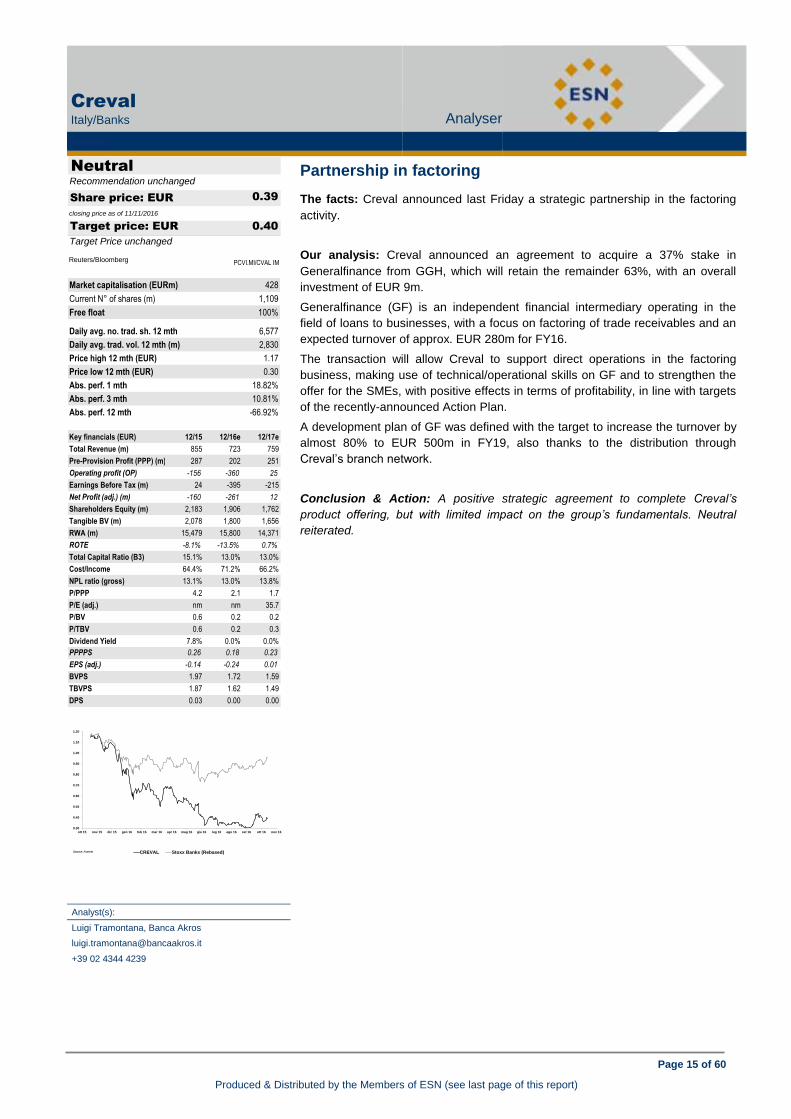
Creval (Neutral) Q3 16 results
Partnership in factoring
The facts: Creval announced last Friday a strategic partnership in the factoring
activity.
Our analysis: Creval announced an agreement to acquire a 37% stake in
Generalfinance from GGH, which will retain the remainder 63%, with an overall
investment of EUR 9m.
Generalfinance (GF) is an independent financial intermediary operating in the
field of loans to businesses, with a focus on factoring of trade receivables and an
expected turnover of approx. EUR 280m for FY16.
The transaction will allow Creval to support direct operations in the factoring
business, making use of technical/operational skills on GF and to strengthen the
offer for the SMEs, with positive effects in terms of profitability, in line with targets
of the recently-announced Action Plan.
A development plan of GF was defined with the target to increase the turnover by
almost 80% to EUR 500m in FY19, also thanks to the distribution through
Creval’s branch network.
Conclusion & Action: A positive strategic agreement to complete Creval’s
product offering, but with limited impact on the group’s fundamentals. Neutral
reiterated.
Analyst(s):
Luigi Tramontana, Banca Akros
+39 02 4344 4239
Neutral
0.39
closing price as of 11/11/2016
0.40
Target Price unchanged
Recommendation unchanged
Target price: EUR
Share price: EUR
Reuters/Bloomberg PCVI.MI/CVAL IM
Market capitalisation (EURm) 428
Current N° of shares (m) 1,109
Free float 100%
Daily avg. no. trad. sh. 12 mth 6,577
Daily avg. trad. vol. 12 mth (m) 2,830
Price high 12 mth (EUR) 1.17
Price low 12 mth (EUR) 0.30
Abs. perf. 1 mth 18.82%
Abs. perf. 3 mth 10.81%
Abs. perf. 12 mth -66.92%
Key financials (EUR) 12/15 12/16e 12/17e
Total Revenue (m) 855 723 759
Pre-Provision Profit (PPP) (m) 287 202 251
Operating profit (OP) -156 -360 25
Earnings Before Tax (m) 24 -395 -215
Net Profit (adj.) (m) -160 -261 12
Shareholders Equity (m) 2,183 1,906 1,762
Tangible BV (m) 2,078 1,800 1,656
RWA (m) 15,479 15,800 14,371
ROTE -8.1% -13.5% 0.7%
Total Capital Ratio (B3) 15.1% 13.0% 13.0%
Cost/Income 64.4% 71.2% 66.2%
NPL ratio (gross) 13.1% 13.0% 13.8%
P/PPP 4.2 2.1 1.7
P/E (adj.) nm nm 35.7
P/BV 0.6 0.2 0.2
P/TBV 0.6 0.2 0.3
Dividend Yield 7.8% 0.0% 0.0%
PPPPS 0.26 0.18 0.23
EPS (adj.) -0.14 -0.24 0.01
BVPS 1.97 1.72 1.59
TBVPS 1.87 1.62 1.49
DPS 0.03 0.00 0.00
0.30
0.40
0.50
0.60
0.70
0.80
0.90
1.00
1.10
1.20
ott 15 nov 15 dic 15 gen 16 feb 16 mar 16 apr 16 mag 16 giu 16 lug 16 ago 16 set 16 ott 16 nov 16
vvdsvdvsdy
CREVAL Stoxx Banks (Rebased)Source: Factset
Shareholders:

Page 16 of 60
Produced & Distributed by the Members of ESN (see last page of this report)
Deutsche Pfandbriefbank
Germany/Banks Analyser
BANKS
Deutsche Pfandbriefbank (Buy) Partnership in factoring
Adj. Q3 results in line, extra dividend more likely
The facts: Friday evening Dt Pfandbriefbank reported Q3 results which were
better than expected both on an adjusted and a non-adjusted pretax profit level.
Pretax profit tripled yoy to EUR 159m (equine: EUR 141m) due to the positive
one-off resulting from Heta as PBB booked lower provisions than expected (delta
of EUR 18m). On an adjusted level pretax profit stood at EUR 42m which was
slightly above our forecast of EUR 41m; positively, NII was with EUR 97m above
our forecast of EUR 94m. Negatively, costs and risk provisions were above our
forecasts. For 2016e PBB is targeting an adjusted operating profit of EUR 170m
(equinet: EUR 186m), for 2017 an operating profit of between EUR 150m and
EUR 170m (equinet: EUR 185m, consensus: EUR 168m). Most importantly PBB
said that it was contemplating an extra dividend from the Heta one-off for 2016.
Our analysis: New business amounted to EUR 2bn in Q3 ’15 which was down by
31% yoy but slightly up by 10% qoq. New business margin in Real Estate Finance
remained in line with H1 at 170 basis points. Negatively, pbb is forecasting a tax
rate of 35% for 2016 which is well above previous guidance of 17% - this will have
a negative impact on the distributable income, i.e. our dividend forecast.
Conclusion & Action: While Q3 results are somewhat mixed and the outlook is
below our expectation but in line with consensus, the fact that PBB is
contemplating an extra dividend from the Heta one-off is clearly positive news.
Hence, we reiterate our Buy recommendation with a target price of EUR 12.30.
While pbb is clearly not a growth story, we like the shares as they offer a high
normal dividend yield of 6% for 2016 which should be even at 9% if including an
expected extra dividend related to Heta. The higher guided tax rate may however
somewhat reduce our dividend expectation. Additionally PBB is strongly
capitalized (CT1 B3 FL: 19%) and has a high asset quality (NPL ratio of 1.3%)
while trading at 2017e P/B of 0.4x.
Analyst(s):
Philipp Häßler, CFA, equinet Bank
+49 69 58997 414
Buy
9.73
closing price as of 11/11/2016
12.30
Target Price unchanged
Recommendation unchanged
Target price: EUR
Share price: EUR
Reuters/Bloomberg PBBG.DE/PBB GR
Market capitalisation (EURm) 1,309
Current N° of shares (m) 134
Free float 80%
Daily avg. no. trad. sh. 12 mth 319
Daily avg. trad. vol. 12 mth (m) 3,710
Price high 12 mth (EUR) 11.30
Price low 12 mth (EUR) 7.43
Abs. perf. 1 mth 9.72%
Abs. perf. 3 mth 9.31%
Abs. perf. 12 mth -8.88%
Key financials (EUR) 12/15 12/16e 12/17e
Total Revenue (m) 421 402 424
Pre-Provision Profit (PPP) (m) 214 191 210
Operating profit (OP) 215 166 175
Earnings Before Tax (m) 195 186 185
Net Profit (adj.) (m) 230 154 155
Shareholders Equity (m) 2,731 2,746 2,805
Tangible BV (m) 2,731 2,746 2,805
RWA (m) 13,402 13,804 14,218
ROTE 7.4% 5.6% 5.6%
Total Capital Ratio (B3) 0.0% 0.0% 0.0%
Cost/Income 49.2% 52.5% 50.3%
NPL ratio (gross) 1.3% 1.2% 1.2%
P/PPP 7.0 6.9 6.2
P/E (adj.) 6.5 8.5 8.5
P/BV 0.6 0.5 0.5
P/TBV 0.6 0.5 0.5
Dividend Yield 4.4% 5.9% 5.9%
PPPPS 1.59 1.42 1.56
EPS (adj.) 1.71 1.15 1.15
BVPS 20.31 20.42 20.86
TBVPS 20.31 20.42 20.86
DPS 0.43 0.57 0.58
6.5
7.0
7.5
8.0
8.5
9.0
9.5
10.0
10.5
11.0
11.5
Oct 15 Nov 15 Dec 15 Jan 16 Feb 16 Mar 16 Apr 16 May 16 Jun 16 Jul 16 Aug 16 Sep 16 Oct 16 Nov 16
vvdsvdvsdy
DEUTSCHE PFANDBRIEFBANK Stoxx Banks (Rebased)Source: Factset
Shareholders: Federal Republic of Germany 20%;
Deutsche Pfandbriefbank - Preview Q3 2016
EUR m Q3 '16 Q3 '16e Q3 '15 yoy Consensus delta
Revenues 214 185 98 118% 214 -14%
of which NII 97 94 95 2% 94 0%
Expenses 53 50 52 2% 52 -4%
CIR 24.8% 27.0% 53.1% -2829 BP na na
Risk provis. -3 -6 -3 na 2 na
EBT 159 141 53 200% 154 -8%
Net income 121 139 53 128% 116 20%
Sources: PBB, equinet Research
Page 17 of 60
Produced & Distributed by the Members of ESN (see last page of this report)
UBI Banca
Italy/Banks Analyser
BANKS
UBI Banca (Buy) Adj. Q3 results in line, extra dividend more likely
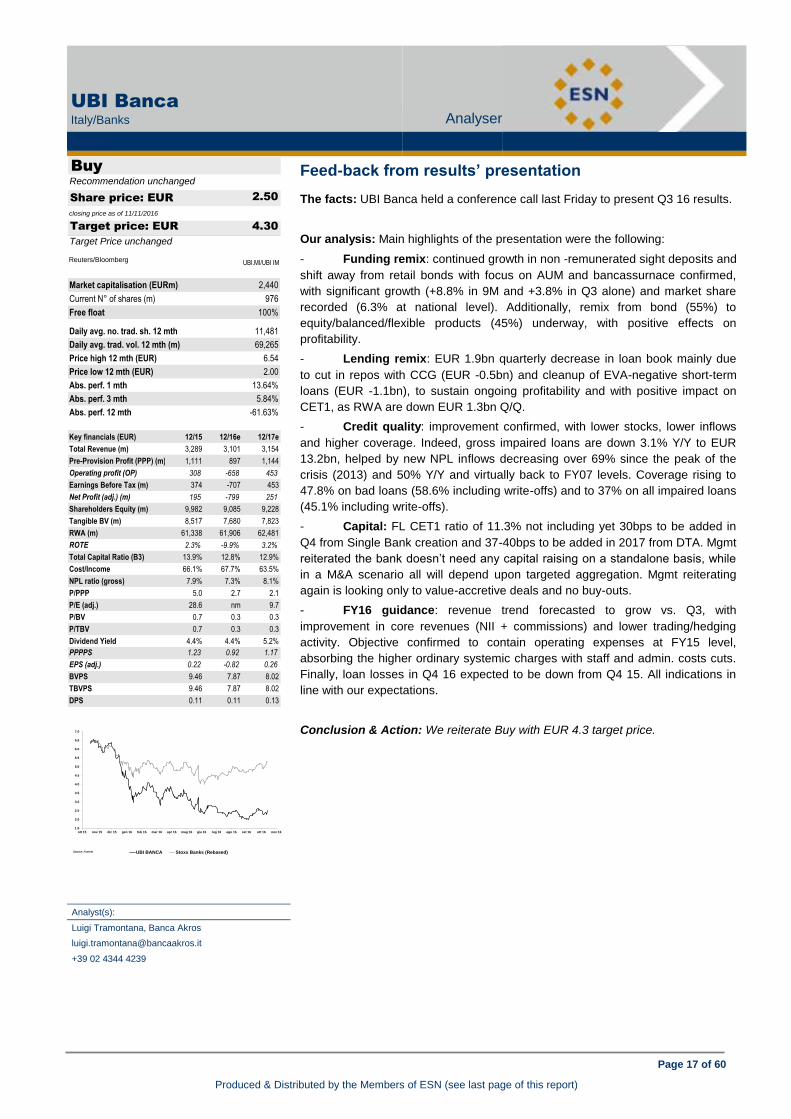
Feed-back from results’ presentation
The facts: UBI Banca held a conference call last Friday to present Q3 16 results.
Our analysis: Main highlights of the presentation were the following:
- Funding remix: continued growth in non -remunerated sight deposits and
shift away from retail bonds with focus on AUM and bancassurnace confirmed,
with significant growth (+8.8% in 9M and +3.8% in Q3 alone) and market share
recorded (6.3% at national level). Additionally, remix from bond (55%) to
equity/balanced/flexible products (45%) underway, with positive effects on
profitability.
- Lending remix: EUR 1.9bn quarterly decrease in loan book mainly due
to cut in repos with CCG (EUR -0.5bn) and cleanup of EVA-negative short-term
loans (EUR -1.1bn), to sustain ongoing profitability and with positive impact on
CET1, as RWA are down EUR 1.3bn Q/Q.
- Credit quality: improvement confirmed, with lower stocks, lower inflows
and higher coverage. Indeed, gross impaired loans are down 3.1% Y/Y to EUR
13.2bn, helped by new NPL inflows decreasing over 69% since the peak of the
crisis (2013) and 50% Y/Y and virtually back to FY07 levels. Coverage rising to
47.8% on bad loans (58.6% including write-offs) and to 37% on all impaired loans
(45.1% including write-offs).
- Capital: FL CET1 ratio of 11.3% not including yet 30bps to be added in
Q4 from Single Bank creation and 37-40bps to be added in 2017 from DTA. Mgmt
reiterated the bank doesn’t need any capital raising on a standalone basis, while
in a M&A scenario all will depend upon targeted aggregation. Mgmt reiterating
again is looking only to value-accretive deals and no buy-outs.
- FY16 guidance: revenue trend forecasted to grow vs. Q3, with
improvement in core revenues (NII + commissions) and lower trading/hedging
activity. Objective confirmed to contain operating expenses at FY15 level,
absorbing the higher ordinary systemic charges with staff and admin. costs cuts.
Finally, loan losses in Q4 16 expected to be down from Q4 15. All indications in
line with our expectations.
Conclusion & Action: We reiterate Buy with EUR 4.3 target price.
Analyst(s):
Luigi Tramontana, Banca Akros
+39 02 4344 4239
Buy
2.50
closing price as of 11/11/2016
4.30
Target Price unchanged
Recommendation unchanged
Target price: EUR
Share price: EUR
Reuters/Bloomberg UBI.MI/UBI IM
Market capitalisation (EURm) 2,440
Current N° of shares (m) 976
Free float 100%
Daily avg. no. trad. sh. 12 mth 11,481
Daily avg. trad. vol. 12 mth (m) 69,265
Price high 12 mth (EUR) 6.54
Price low 12 mth (EUR) 2.00
Abs. perf. 1 mth 13.64%
Abs. perf. 3 mth 5.84%
Abs. perf. 12 mth -61.63%
Key financials (EUR) 12/15 12/16e 12/17e
Total Revenue (m) 3,289 3,101 3,154
Pre-Provision Profit (PPP) (m) 1,111 897 1,144
Operating profit (OP) 308 -658 453
Earnings Before Tax (m) 374 -707 453
Net Profit (adj.) (m) 195 -799 251
Shareholders Equity (m) 9,982 9,085 9,228
Tangible BV (m) 8,517 7,680 7,823
RWA (m) 61,338 61,906 62,481
ROTE 2.3% -9.9% 3.2%
Total Capital Ratio (B3) 13.9% 12.8% 12.9%
Cost/Income 66.1% 67.7% 63.5%
NPL ratio (gross) 7.9% 7.3% 8.1%
P/PPP 5.0 2.7 2.1
P/E (adj.) 28.6 nm 9.7
P/BV 0.7 0.3 0.3
P/TBV 0.7 0.3 0.3
Dividend Yield 4.4% 4.4% 5.2%
PPPPS 1.23 0.92 1.17
EPS (adj.) 0.22 -0.82 0.26
BVPS 9.46 7.87 8.02
TBVPS 9.46 7.87 8.02
DPS 0.11 0.11 0.13
1.5
2.0
2.5
3.0
3.5
4.0
4.5
5.0
5.5
6.0
6.5
7.0
ott 15 nov 15 dic 15 gen 16 feb 16 mar 16 apr 16 mag 16 giu 16 lug 16 ago 16 set 16 ott 16 nov 16
vvdsvdvsdy
UBI BANCA Stoxx Banks (Rebased)Source: Factset
Shareholders:

Page 18 of 60
Produced & Distributed by the Members of ESN (see last page of this report)
Anima
Italy/Financial Services Analyser
FINANCIAL SERVICES
Anima (Buy) Feed-back from results’ presentation
3Q16 results in line with estimates
The facts: Anima reported its 3Q16 numbers on Friday, during trading hours, followed by a
conference call.
3Q16 9M16 Y/Y A/E 3Q16E 9M16E
Net commissions 52 160 2% 0% 53 160
Performance fees 1 5 -89% 22% 1 4
Other income 5 16 -5% -1% 5 16
Total revenues 59 181 -17% 0% 58 181
Operating expense -15 -48 -9% -4% -17 -51
Other income / costs -12 -27 -2% 1% -9 -27
EBT 32 106 -23% 3% 32 103
Net profit 16 63 -34% 6% 21 60
Adj. Net profit 30 88 -22% 4% 27 85
Our analysis: numbers were in line with estimates, and well below last year due to the lack
of performance fees (EUR 5m vs EUR 45m in 9M15) and to c. EUR 9m of non-recurring
costs due a tax settlement covering the period 2004 – 2014 and already disclosed to the
market in mid-July. Anyway, the net commissions rose c. 2% Y/Y (+4% Y/Y in 1H 16)
mainly thanks to the growth in AuM (EUR 71.5bn vs EUR 71.2bn in 1H16, EUR 70.3bn at
the end of 1Q16 and vs EUR 64.3bn in 9M 15). The cost income ratio, ex performance fees,
still improved to 27.4% (in line) from 28.2% in 1H16 (25.88% in 3Q26) vs 30.6% in 9M15:
this was mainly due to the renegotiations of some contracts in G&A costs. The net
commission margin on avg. assets decreased q/q, leading profitability to c. 30.1bps in 9M16
from 30.5bps in 1H 16, mainly due to the increase in weight of institutional mandates during
the quarter.
On the basis of the deal with Anima announced on Friday, Poste ought to contribute around
EUR 75bn, of which c. EUR 68bn of Life insurance, of which c EUR 40bn related to
traditional Life products. This operation could allow as of the beginning, to count on
over EUR 147bn in assets (as of 30 September 2016), but anyway it will be
subject to Anima’s shareholder meeting approval. That said, potentially we are
talking about the third largest asset manager in Italy, which could rely on Poste’s
distribution strength in the medium-long term, considering the size of Poste’s
network and the huge amount of money (over EUR 500bn) managed by Poste at
the moment. The synergies could come from volume side and not from costs. The
offer on Pioneer will not require a capital increase according to Anima’s
management.
Conclusion & Action: We stick to Buy. Despite a pure peer comparison could be
misleading, due to Anima’s peculiar business model, in terms of multiple P/E 2016 and 2017
Anima is trading with a discount of c. 14% and 11% respectively vs its main European peers
(Man, Henderson, Schroders, Vontobel). In terms of market capitalization on total assets,
Anima is trading around 2% and 1.9% for 2016 and 2017, compared to 2.3% and 2.1%
respectively of the same European peers.
Analyst(s):
Enrico Esposti, CIIA, Banca Akros
+39 02 4344 4022
Buy
4.89
closing price as of 11/11/2016
5.80
Target Price unchanged
Recommendation unchanged
Target price: EUR
Share price: EUR
Reuters/Bloomberg ANIM.MI/ANIM IM
Market capitalisation (EURm) 1,466
Current N° of shares (m) 300
Free float 75%
Daily avg. no. trad. sh. 12 mth 1,543
Daily avg. trad. vol. 12 mth (m) 29,265
Price high 12 mth (EUR) 8.76
Price low 12 mth (EUR) 3.90
Abs. perf. 1 mth 21.40%
Abs. perf. 3 mth 8.23%
Abs. perf. 12 mth -43.92%
Key financials (EUR) 12/15 12/16e 12/17e
Total Revenue (m) 291 242 262
Pre-Provision Profit (PPP) (m) 202 155 175
Operating profit (OP) 202 155 175
Earnings Before Tax (m) 183 138 168
Net Profit (adj.) (m) 151 118 133
Shareholders Equity (m) 796 802 876
Tangible BV (m) 0 0 0
RWA (m) 0 0 0
ROTE 20.0% 14.7% 15.9%
Total Capital Ratio (B3) 0.0% 0.0% 0.0%
Cost/Income 30.6% 35.8% 33.3%
P/PPP 11.9 9.5 8.4
P/E (adj.) 16.0 12.4 11.0
P/BV 3.0 1.8 1.7
P/TBV nm nm nm
Dividend Yield 5.1% 2.8% 3.9%
PPPPS 0.67 0.52 0.58
EPS (adj.) 0.50 0.39 0.44
BVPS 2.66 2.68 2.92
TBVPS 0.00 0.00 0.00
DPS 0.25 0.13 0.19
3.5
4.0
4.5
5.0
5.5
6.0
6.5
7.0
7.5
8.0
8.5
9.0
ott 15 nov 15 dic 15 gen 16 feb 16 mar 16 apr 16 mag 16 giu 16 lug 16 ago 16 set 16 ott 16 nov 16
vvdsvdvsdy
ANIMA FTSE Italy All Share (Rebased)Source: Factset
Shareholders: BPM 15%; Poste Italiane 10%;
Page 19 of 60
Produced & Distributed by the Members of ESN (see last page of this report)
Ferratum
Germany/Financial Services Analyser
FINANCIAL SERVICES
Ferratum (Buy) 3Q16 results in line with estimates
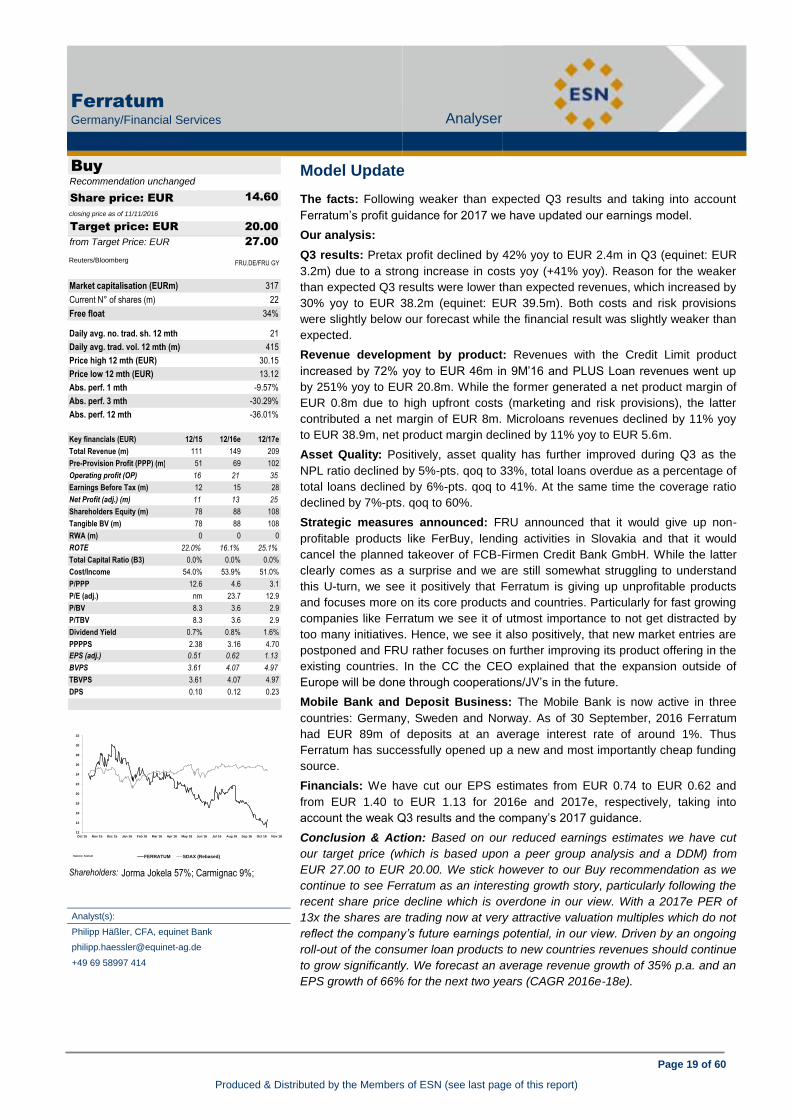
Model Update
The facts: Following weaker than expected Q3 results and taking into account
Ferratum’s profit guidance for 2017 we have updated our earnings model.
Our analysis:
Q3 results: Pretax profit declined by 42% yoy to EUR 2.4m in Q3 (equinet: EUR
3.2m) due to a strong increase in costs yoy (+41% yoy). Reason for the weaker
than expected Q3 results were lower than expected revenues, which increased by
30% yoy to EUR 38.2m (equinet: EUR 39.5m). Both costs and risk provisions
were slightly below our forecast while the financial result was slightly weaker than
expected.
Revenue development by product: Revenues with the Credit Limit product
increased by 72% yoy to EUR 46m in 9M’16 and PLUS Loan revenues went up
by 251% yoy to EUR 20.8m. While the former generated a net product margin of
EUR 0.8m due to high upfront costs (marketing and risk provisions), the latter
contributed a net margin of EUR 8m. Microloans revenues declined by 11% yoy
to EUR 38.9m, net product margin declined by 11% yoy to EUR 5.6m.
Asset Quality: Positively, asset quality has further improved during Q3 as the
NPL ratio declined by 5%-pts. qoq to 33%, total loans overdue as a percentage of
total loans declined by 6%-pts. qoq to 41%. At the same time the coverage ratio
declined by 7%-pts. qoq to 60%.
Strategic measures announced: FRU announced that it would give up non-
profitable products like FerBuy, lending activities in Slovakia and that it would
cancel the planned takeover of FCB-Firmen Credit Bank GmbH. While the latter
clearly comes as a surprise and we are still somewhat struggling to understand
this U-turn, we see it positively that Ferratum is giving up unprofitable products
and focuses more on its core products and countries. Particularly for fast growing
companies like Ferratum we see it of utmost importance to not get distracted by
too many initiatives. Hence, we see it also positively, that new market entries are
postponed and FRU rather focuses on further improving its product offering in the
existing countries. In the CC the CEO explained that the expansion outside of
Europe will be done through cooperations/JV’s in the future.
Mobile Bank and Deposit Business: The Mobile Bank is now active in three
countries: Germany, Sweden and Norway. As of 30 September, 2016 Ferratum
had EUR 89m of deposits at an average interest rate of around 1%. Thus
Ferratum has successfully opened up a new and most importantly cheap funding
source.
Financials: We have cut our EPS estimates from EUR 0.74 to EUR 0.62 and
from EUR 1.40 to EUR 1.13 for 2016e and 2017e, respectively, taking into
account the weak Q3 results and the company’s 2017 guidance.
Conclusion & Action: Based on our reduced earnings estimates we have cut
our target price (which is based upon a peer group analysis and a DDM) from
EUR 27.00 to EUR 20.00. We stick however to our Buy recommendation as we
continue to see Ferratum as an interesting growth story, particularly following the
recent share price decline which is overdone in our view. With a 2017e PER of
13x the shares are trading now at very attractive valuation multiples which do not
reflect the company’s future earnings potential, in our view. Driven by an ongoing
roll-out of the consumer loan products to new countries revenues should continue
to grow significantly. We forecast an average revenue growth of 35% p.a. and an
EPS growth of 66% for the next two years (CAGR 2016e-18e).
Analyst(s):
Philipp Häßler, CFA, equinet Bank
+49 69 58997 414
Buy
14.60
closing price as of 11/11/2016
20.00
27.00from Target Price: EUR
Recommendation unchanged
Target price: EUR
Share price: EUR
Reuters/Bloomberg FRU.DE/FRU GY
Market capitalisation (EURm) 317
Current N° of shares (m) 22
Free float 34%
Daily avg. no. trad. sh. 12 mth 21
Daily avg. trad. vol. 12 mth (m) 415
Price high 12 mth (EUR) 30.15
Price low 12 mth (EUR) 13.12
Abs. perf. 1 mth -9.57%
Abs. perf. 3 mth -30.29%
Abs. perf. 12 mth -36.01%
Key financials (EUR) 12/15 12/16e 12/17e
Total Revenue (m) 111 149 209
Pre-Provision Profit (PPP) (m) 51 69 102
Operating profit (OP) 16 21 35
Earnings Before Tax (m) 12 15 28
Net Profit (adj.) (m) 11 13 25
Shareholders Equity (m) 78 88 108
Tangible BV (m) 78 88 108
RWA (m) 0 0 0
ROTE 22.0% 16.1% 25.1%
Total Capital Ratio (B3) 0.0% 0.0% 0.0%
Cost/Income 54.0% 53.9% 51.0%
P/PPP 12.6 4.6 3.1
P/E (adj.) nm 23.7 12.9
P/BV 8.3 3.6 2.9
P/TBV 8.3 3.6 2.9
Dividend Yield 0.7% 0.8% 1.6%
PPPPS 2.38 3.16 4.70
EPS (adj.) 0.51 0.62 1.13
BVPS 3.61 4.07 4.97
TBVPS 3.61 4.07 4.97
DPS 0.10 0.12 0.23
12
14
16
18
20
22
24
26
28
30
32
Oct 15 Nov 15 Dec 15 Jan 16 Feb 16 Mar 16 Apr 16 May 16 Jun 16 Jul 16 Aug 16 Sep 16 Oct 16 Nov 16
vvdsvdvsdy
FERRATUM SDAX (Rebased)Source: Factset
Shareholders: Jorma Jokela 57%; Carmignac 9%;
Page 20 of 60
Produced & Distributed by the Members of ESN (see last page of this report)
TIP - Tamburi Investment Partners
Italy/Financial Services
Analyser
FINANCIAL SERVICES
TIP Tamburi Investment Partners (Buy) Model Update
9M 16 results
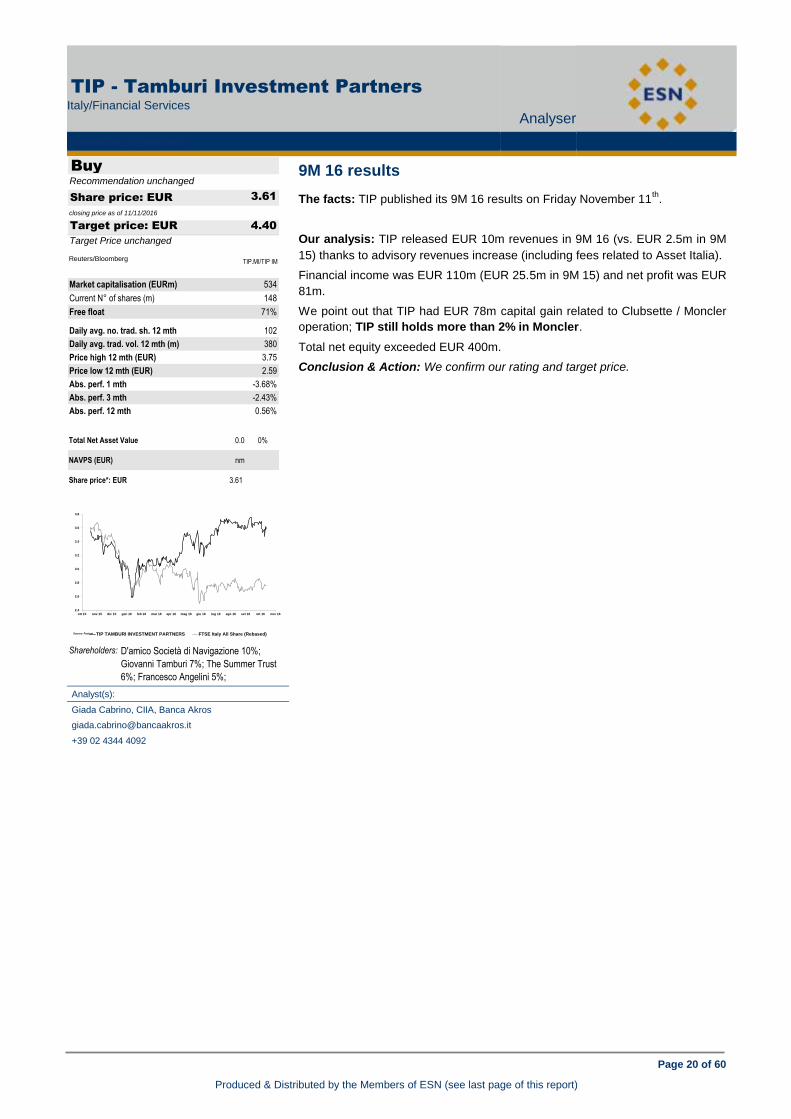
The facts: TIP published its 9M 16 results on Friday November 11th
.
Our analysis: TIP released EUR 10m revenues in 9M 16 (vs. EUR 2.5m in 9M
15) thanks to advisory revenues increase (including fees related to Asset Italia).
Financial income was EUR 110m (EUR 25.5m in 9M 15) and net profit was EUR
81m.
We point out that TIP had EUR 78m capital gain related to Clubsette / Moncler
operation; TIP still holds more than 2% in Moncler.
Total net equity exceeded EUR 400m.
Conclusion & Action: We confirm our rating and target price.
Analyst(s):
Giada Cabrino, CIIA, Banca Akros
+39 02 4344 4092
Buy
3.61
closing price as of 11/11/2016
4.40
Target Price unchanged
Recommendation unchanged
Target price: EUR
Share price: EUR
Reuters/Bloomberg TIP.MI/TIP IM
Market capitalisation (EURm) 534
Current N° of shares (m) 148
Free float 71%
Daily avg. no. trad. sh. 12 mth 102
Daily avg. trad. vol. 12 mth (m) 380
Price high 12 mth (EUR) 3.75
Price low 12 mth (EUR) 2.59
Abs. perf. 1 mth -3.68%
Abs. perf. 3 mth -2.43%
Abs. perf. 12 mth 0.56%
Total Net Asset Value 0.0 0%
NAVPS (EUR) nm nm
Share price*: EUR 3.61 3.61
2.4
2.6
2.8
3.0
3.2
3.4
3.6
3.8
ott 15 nov 15 dic 15 gen 16 feb 16 mar 16 apr 16 mag 16 giu 16 lug 16 ago 16 set 16 ott 16 nov 16
vvdsvdvsdy
TIP TAMBURI INVESTMENT PARTNERS FTSE Italy All Share (Rebased)Source: Factset
Shareholders: D'amico Società di Navigazione 10%;
Giovanni Tamburi 7%; The Summer Trust
6%; Francesco Angelini 5%;

Page 21 of 60
Produced & Distributed by the Members of ESN (see last page of this report)
Enervit
Italy/Food & Beverage Analyser
FOOD & BEVERAGE
Enervit (Accumulate) 9M 16 results
Q3 16 results in line with our estimates
The facts: we remind investors that Enervit’s sales are seasonal, with Q1 and Q3
generally each accounting for 20% of annual volumes, while Q2 and Q4
accounting for c. 60%.
Q3 16 Enervit sales were at EUR 11.5m, with an increase of 3.4% Y/Y and they
were in line with our forecasts.
9M 16 Enervit sales were at EUR 34.0m, with an increase of 4.5% Y/Y. 9M 16
Italian business unit sales were up 4.5% Y/Y and 9M 16 International business
unit sales increased by 119.3% Y/Y.
Conclusion & Action: 9M sales were overall in line with our estimates, so we
confirm our DCF- based Target Price is of EUR 2.85 per share and our
Accumulate recommendation.
Analyst(s):
PaolaSaglietti, Banca Akros
+39 02 4344 4287
Accumulate
2.81
closing price as of 11/11/2016
2.85
Target Price unchanged
Recommendation unchanged
Target price: EUR
Share price: EUR
Reuters/Bloomberg ENVT.MI/ENV IM
Market capitalisation (EURm) 50
Current N° of shares (m) 18
Free float 16%
Daily avg. no. trad. sh. 12 mth 4
Daily avg. trad. vol. 12 mth (m) 16
Price high 12 mth (EUR) 3.16
Price low 12 mth (EUR) 1.97
Abs. perf. 1 mth 7.26%
Abs. perf. 3 mth 17.90%
Abs. perf. 12 mth -9.48%
Key financials (EUR) 12/15 12/16e 12/17e
Sales (m) 52 55 57
EBITDA (m) 4 5 6
EBITDA margin 6.9% 9.0% 9.7%
EBIT (m) 2 3 4
EBIT margin 3.4% 5.5% 6.3%
Net Profit (adj.)(m) 0 2 2
ROCE 6.7% 11.9% 13.4%
Net debt/(cash) (m) 1 2 2
Net Debt/Equity 0.0 0.1 0.1
Debt/EBITDA 0.3 0.5 0.3
Int. cover(EBITDA/Fin. int) 45.2 63.5 64.3
EV/Sales 1.0 1.0 0.9
EV/EBITDA 14.5 10.8 9.5
EV/EBITDA (adj.) 14.5 10.8 9.5
EV/EBIT 29.3 17.6 14.7
P/E (adj.) nm 28.2 23.6
P/BV 2.5 2.9 2.7
OpFCF yield -2.7% 5.3% 2.5%
Dividend yield 1.1% 1.3% 1.5%
EPS (adj.) 0.02 0.10 0.12
BVPS 1.15 0.96 1.04
DPS 0.03 0.04 0.04
1.8
2.0
2.2
2.4
2.6
2.8
3.0
3.2
ott 15 nov 15 dic 15 gen 16 feb 16 mar 16 apr 16 mag 16 giu 16 lug 16 ago 16 set 16 ott 16 nov 16
vvdsvdvsdy
ENERVIT Stoxx Food & Beverage (Rebased)Source: Factset
Shareholders: Sorbini Alberto 18%; Sorbini Giuseppe
18%; Alessandri Nerio 31%; Sorbini
Maurizia 15%; Baldini Stefano 2.00%;

Page 22 of 60
Produced & Distributed by the Members of ESN (see last page of this report)
La Doria
Italy/Food & Beverage Analyser
FOOD & BEVERAGE
La Doria (Neutral) Q3 16 results in line with our estimates
9M 16 results weak as expected
- 9M 16 sales decreased by 12.6%: this result was due to the drop in sales
prices and a negative Forex impact.
- 9M 16 EBITDA decreased by 23.7%: the revenues decrease and the
continuous competitive pressure negatively impacted the profitability.
LA DORIA: 9M 16 results
H1 15a H1 16a %Chg.
Sales 562.6 491.6 -12.6%
EBITDA 58.9 44.9 -23.7%
EBITDA margin 10.5% 9.1%
Source: Company Data
Outlook on FY 16: the management expect a continuous contraction in revenues
and margins owing to the deflationary effects on sales prices largely due to the
2015 and 2016 tomato processing campaigns. Furthermore, the unfavourable
EUR-GBP exchange rate movements will continue to impact the current year.
Conclusion & Action: based on the still negative scenario we confirm our
Neutral recommendation.
Analyst(s):
Paola Saglietti, Banca Akros
+39 02 4344 4287
Neutral
7.20
closing price as of 11/11/2016
11.00
Target Price unchanged
Recommendation unchanged
Target price: EUR
Share price: EUR
Reuters/Bloomberg LDO.MI/LD IM
Market capitalisation (EURm) 223
Current N° of shares (m) 31
Free float 37%
Daily avg. no. trad. sh. 12 mth 64
Daily avg. trad. vol. 12 mth (m) 475
Price high 12 mth (EUR) 13.33
Price low 12 mth (EUR) 7.20
Abs. perf. 1 mth -10.06%
Abs. perf. 3 mth -38.30%
Abs. perf. 12 mth -43.40%
Key financials (EUR) 12/15 12/16e 12/17e
Sales (m) 748 656 660
EBITDA (m) 78 57 50
EBITDA margin 10.4% 8.7% 7.6%
EBIT (m) 61 42 37
EBIT margin 8.1% 6.3% 5.6%
Net Profit (adj.)(m) 45 29 25
ROCE 11.6% 8.0% 7.0%
Net debt/(cash) (m) 130 112 100
Net Debt/Equity 0.7 0.5 0.4
Debt/EBITDA 1.7 2.0 2.0
Int. cover(EBITDA/Fin. int) 21.8 27.3 24.9
EV/Sales 0.8 0.6 0.6
EV/EBITDA 7.5 6.7 7.4
EV/EBITDA (adj.) 7.5 6.7 7.4
EV/EBIT 9.6 9.2 10.0
P/E (adj.) 9.0 7.7 8.9
P/BV 2.0 1.0 1.0
OpFCF yield 11.5% 15.0% 11.4%
Dividend yield 3.9% 4.2% 4.4%
EPS (adj.) 1.45 0.94 0.81
BVPS 6.40 7.06 7.57
DPS 0.28 0.30 0.32
7
8
9
10
11
12
13
14
ott 15 nov 15 dic 15 gen 16 feb 16 mar 16 apr 16 mag 16 giu 16 lug 16 ago 16 set 16 ott 16 nov 16
vvdsvdvsdy
LA DORIA FTSE Italy All Share (Rebased)Source: Factset
Shareholders: Ferraioli family 63%;

Page 23 of 60
Produced & Distributed by the Members of ESN (see last page of this report)
Food & Drug Retailers
Analyser
FOOD & DRUG RETAILERS
9M 16 results weak as expected Portugal - Prices in the “Food and non-alcoholic
beverages” segment in October 2016 (+0.45% YoY)
210
220
230
240
250
260
270
280
Oct 15 Nov 15 Dec 15 Jan 16 Feb 16 Mar 16 Apr 16 May 16 Jun 16 Jul 16 Aug 16 Sep 16 Oct 16 Nov 16
vvdsvdvsdy
The facts: According to the Portuguese statistical office (INE) the variation of
the price index for the “Food and non-alcoholic beverages” segment was
+0.45% YoY in October vs. +1.0% in September and +1.82% YoY in August.
Our analysis: The total CPI annual rate in Portugal was +0.88% YoY in October
vs. +0.63% YoY in September. The main drivers for that YoY variation were
“Restaurants and hotels” (+4.2% YoY) and “Communications” (+3.1% YoY).
Exhibit: Portugal - Price index evolution* (YoY)
Source: INE & CaixaBI Equity Research. *Index for “Food and non-alcoholic beverages”
Conclusion & Action: The evolution of prices in the Food segment continued
positive in September in spite of a deceleration in the growth rate when
comparted to the most recent months. The average monthly price evolution is
now close to 0.48% YoY in 2016 (with +1.50% YoY in the 3Q16).
If this trend on prices remains visible in the coming months (low but positive
inflation), the food sector can aspire to rebalance its pricing competition, thus
allowing companies to consider accommodating some margin protection. In
fact, during its 9M16 results conference call (held on 10 November), Sonae
stated that “food retail prices may have reached equilibrium”; the company can
sustain current price investment levels without further margin deterioration.
However, both Jerónimo Martins and Sonae are ready to further deepen its
commercial aggressiveness if local competitors attempt to threaten its market
position. Overall, the main companies in the country continue to emphasize the
idea that the market remains strongly driven by promotions and their focus on
discounts could not be reduced in the next quarters.
Sonae generates over 90% of its sales in Portugal while for Jerónimo Martins
local sales account for around 30% of revenues. According to their most recent
results presentations, Jerónimo Martins presented a LfL sales growth of 0.9%
YoY in 9M16 for Pingo Doce (+2.4% in 3Q16) and +4.4% YoY for the cash &
carry unit Recheio (+5.9% in 3Q16). In the case of Sonae, the LfL sales growth
in the food retail unit was at 1.8% YoY in 9M16 (+4.1% YoY in 3Q16).
---------- Stoxx Food & Drug Retailers,
DJ Stoxx TMI rebased on sector
Analyst(s):
André Rodrigues Caixa-Banco de Investimento
+351 21 389 68 39
José Mota Freitas, CFA, Caixa-Banco de
Investimento
+351 22 607 09 31
1.0%
0.5%
-2%
-1%
0%
1%
2%
3%
Oct-14 Jan-15 Apr-15 Jul-15 Oct-15 Jan-16 Apr-16 Jul-16 Oct-16

Page 24 of 60
Produced & Distributed by the Members of ESN (see last page of this report)
Marr
Italy/Food & Drug Retailers Analyser
FOOD & DRUG RETAILERS
Marr (Accumulate) Portugal - Prices in the “Food and non-alcoholic beverages” segment in October 2016 (+0.45% YoY)
Q3 16 results preview
The facts: Q3 16 results are due out on 14th
November.
Our analysis: we forecast a 6.0% increase in revenues in Q3 16 to EUR 482.3m,
driven by a 4.0% growth in the Street Market channel and by the positive
contribution of DE.AL acquired in April. We expect Q3 16e EBITDA at EUR
42.8m, with an EBITDA margin of 8.9% in line with the previous year.
The following table shows our Q3/9M 16 forecast:
MARR: Q3 16e and 9M 16e preview
Q3 15a Q3 16e %Chg. 9M 15a 9M 16e %Chg.
Sales 454.8 482.3 6.0% 1,152.7 1,205.1 4.5%
EBITDA 40.7 42.8 5.0% 88.0 92.3 4.9%
Margin % 8.9% 8.9% 7.6% 7.7%
Source: Company data, Banca Akros estimates
Conclusion & Action: we confirm our Accumulate recommendation.
Analyst(s):
Paola Saglietti, Banca Akros
+39 02 4344 4287
Accumulate
16.70
closing price as of 11/11/2016
20.30
Target Price unchanged
Recommendation unchanged
Target price: EUR
Share price: EUR
Reuters/Bloomberg MARR.MI/MARR IM
Market capitalisation (EURm) 1,103
Current N° of shares (m) 66
Free float 49%
Daily avg. no. trad. sh. 12 mth 60
Daily avg. trad. vol. 12 mth (m) 1,206
Price high 12 mth (EUR) 19.60
Price low 12 mth (EUR) 15.74
Abs. perf. 1 mth -3.58%
Abs. perf. 3 mth -8.14%
Abs. perf. 12 mth -9.97%
Key financials (EUR) 12/15 12/16e 12/17e
Sales (m) 1,481 1,566 1,629
EBITDA (m) 106 111 116
EBITDA margin 7.1% 7.1% 7.1%
EBIT (m) 89 95 100
EBIT margin 6.0% 6.0% 6.1%
Net Profit (adj.)(m) 57 64 68
ROCE 15.4% 14.4% 14.9%
Net debt/(cash) (m) 165 198 185
Net Debt/Equity 0.6 0.7 0.6
Debt/EBITDA 1.6 1.8 1.6
Int. cover(EBITDA/Fin. int) 15.6 (48,724.6) 1,718.4
EV/Sales 0.9 0.8 0.8
EV/EBITDA 13.2 11.4 10.8
EV/EBITDA (adj.) 13.2 11.4 10.8
EV/EBIT 15.7 13.5 12.6
P/E (adj.) 28.9 22.3 21.1
P/BV 4.6 3.8 3.5
OpFCF yield 5.2% -1.8% 5.9%
Dividend yield 4.0% 4.1% 4.3%
EPS (adj.) 0.66 0.75 0.79
BVPS 4.11 4.43 4.77
DPS 0.66 0.69 0.71
15.5
16.0
16.5
17.0
17.5
18.0
18.5
19.0
19.5
20.0
ott 15 nov 15 dic 15 gen 16 feb 16 mar 16 apr 16 mag 16 giu 16 lug 16 ago 16 set 16 ott 16 nov 16
vvdsvdvsdy
MARR FTSE Italy STAR (Rebased)Source: Factset
Shareholders: Cremonini S.p.a. 51%;

Page 25 of 60
Produced & Distributed by the Members of ESN (see last page of this report)
Kendrion
Netherlands/General Industrials Analyser
GENERAL INDUSTRIALS
Kendrion (Buy) Q3 16 results preview Buy
26.12
closing price as of 11/11/2016
30.00
27.00from Target Price: EUR
Recommendation unchanged
Target price: EUR
Share price: EUR
Reuters/Bloomberg SVEL.AS/KENDR NA
Market capitalisation (EURm) 350
Current N° of shares (m) 13
Free float 68%
Daily avg. no. trad. sh. 12 mth 18
Daily avg. trad. vol. 12 mth (m) 94
Price high 12 mth (EUR) 27.87
Price low 12 mth (EUR) 19.00
Abs. perf. 1 mth -2.72%
Abs. perf. 3 mth 4.90%
Abs. perf. 12 mth 32.25%
Key financials (EUR) 12/15 12/16e 12/17e
Sales (m) 442 444 465
EBITDA (m) 45 47 57
EBITDA margin 10.2% 10.6% 12.3%
EBIT (m) 22 23 33
EBIT margin 5.0% 5.2% 7.1%
Net Profit (adj.)(m) 21 23 29
ROCE 6.3% 7.7% 9.6%
Net debt/(cash) (m) 69 63 51
Net Debt/Equity 0.4 0.4 0.3
Debt/EBITDA 1.5 1.3 0.9
Int. cover(EBITDA/Fin. int) 13.7 18.4 31.8
EV/Sales 0.9 0.9 0.9
EV/EBITDA 8.6 8.8 7.1
EV/EBITDA (adj.) 8.4 7.9 6.9
EV/EBIT 17.7 17.8 12.4
P/E (adj.) 15.0 15.1 12.3
P/BV 1.9 2.0 1.9
OpFCF yield 5.8% 4.8% 6.3%
Dividend yield 3.0% 3.0% 3.3%
EPS (adj.) 1.61 1.73 2.12
BVPS 12.88 13.09 13.75
DPS 0.78 0.78 0.87
Good progress in strategy and results are recovering
The facts: We published an update on Kendrion. We slightly raise our price
target to EUR 30 and maintain out Buy rating.
Our analysis: Kendrion is making good progress with its strategy which is
focused on simplifying its organisation. It already announced the closure of its
facility in Brazil and recently the closure of another relatively small facility in
Switzerland was announced. Total annual cost savings are now expected to be
EUR 5m. Over the next 12-18 months, the company will gradually announce more
measures which will increase total cost savings to an estimated EUR 10m,
reflecting a margin improvement of 200bps. Based on cost savings and operating
leverage we see further margin potential towards 9.5% in 2018 (+230bps versus
7.2% in 2016E).
Following a disappointing 2H15, Kendrion is showing improving revenue trends in
2016. In Q3, organic revenue growth was 2% versus flat in Q2 and a decline of
3% in Q1. Growth is driven by a better performance within Passenger Cars whilst
Commercial Vehicles still faced tough market conditions. Industrial is growing
slightly in a stable German machine building industry. The focus on high growth
niche markets should gradually pay off and result in an accelerating organic
revenue growth. We have lowered our 2016 growth forecast to 1% but still expect
a strong acceleration towards 5% in 2017 (unchanged) and 7% in 2018 (was
6.5%).
Kendrion’s financial position is strong with solvency at 50% and net debt /
EBITDA of 1.2 this year expected to improve to 0.5 in 2018. The dividend policy
remains at a pay-out ratio of 30-50% (2015: 60%). Although we think that the
primary focus is on organic revenue growth, management won’t shy away from
acquisitions if they become available (most targets are family owned). Kendrion
has a ‘war chest’ of EUR 100m, offering ample room for add-on acquisitions. If
this is not used for acquisitions we expect the company to return more cash to
shareholders.
We have slightly adjusted our estimates. Our revenue forecast for 2016 is
lowered somewhat which also has an impact on our 2017 and 2018 estimates. As
growth in 2016 is slower than we previously estimated, we now take into account
a CAGR of 4% in the period 2016-2018, slightly below company target of 5%. As
cost savings are higher than previously estimated we raise our margin forecast for
2016 a bit and maintain our margin forecast of 9.5% for 2018, thereby assuming
that the company will be able to reach the 10% level as from the end of 2018. On
our new estimates we arrive at a DCF-based price target of EUR 30.00 (was EUR
27.00).
Conclusion & Action: Kendrion is making good progress with its new strategic
direction which was set in May of this year. Costs saving measures are being
taken which will underpin margin potential in the next few years. Kendrion’s focus
on high growth niche markets should gradually pay off, with high potential for its
damping systems and sound systems. The new strategy should result in organic
revenue growth of 5% on average and a return to an EBITA level of 10% as from
the end of 2018, which still seems reasonable and achievable. We slightly raised
our margin estimate for 2016 and our estimates assume an EBITA CAGR of 20%
in the 2016-2018 period. Kendrion is valued at an EV/EBITDA of 6.9 for 2017,
which shows a large discount of 20-30% to industrial peers. We have raised our
price target to EUR 30.00 and the company offers a good dividend yield of 3-4%.
We maintain our Buy rating.
16
18
20
22
24
26
28
Oct 15 Nov 15 Dec 15 Jan 16 Feb 16 Mar 16 Apr 16 May 16 Jun 16 Jul 16 Aug 16 Sep 16 Oct 16 Nov 16
vvdsvdvsdy
KENDRION EuroNext (Rebased)Source: Factset Shareholders: Delta Lloyd Deelnemingen 10%; Kempen
CM 6%; Janivo 6%; Darlin 5%; T. Rowe
Price 5%; Analyst(s):
Johan van den Hooven, NIBC Markets N.V.
+312 0 5508518

Page 26 of 60
Produced & Distributed by the Members of ESN (see last page of this report)
Pihlajalinna
EUR million 2013 2014 2015 2016E 2017E 2018E
Sales 104 149 213 402 431 450
Sales Growth (%) 121% 43% 43% 88% 7% 4%
EBIT excl non rec items 7.3 6.0 3.6 15.5 22.1 32.1
EBIT (%) 7.0 % 4.0 % 1.7 % 3.9 % 5.1 % 7.1 %
PTP - - 1 11 16 24
EPS - - 0.03 0.39 0.65 0.98
DPS - - 0.02 0.14 0.32 0.49
Yield (%) - - 0.1% 0.9% 2.0% 3.0%
EV/Sales - - 1.9 0.8 0.8 0.7
EV/EBITDA - - 34.6 12.1 9.6 7.0
P/E - - 590.0 40.8 24.8 16.5
P/B - - 4.4 3.2 2.8 2.5
ROE - - 0% 8% 11% 15%
ROCE - - 3% 10% 15% 22%
Equity Ratio - - 45% 46% 49% 51%
Gearing - - 45% 9% -3% -15%
Source: OP
Pihlajalinna
Finland/Healthcare Analyser
HEALTHCARE
Pihlajalinna (Buy) Good progress in strategy and results are recovering
Promising signs of profitability
The facts: As a whole, Pihlajalinna’s Q3 results were good even though the
reported sales were below expectations and the company slightly downgraded its
sales guidance. The sales generated by outsourcing agreements will remain
slightly below the original estimate as certain items have been transferred from
the joint venture to a municipality. The change will have no effect on earnings. Q3
EBITDA (EUR 6.8m) was better than expected (EUR 5.2m) and it thus offered a
positive image of the company's earnings potential. The results of the L&E
segment were soft as expected in a seasonally weak Q3 (summer months), but
the solid profitability of P&S (11% EBITDA margin) was a positive surprise. As a
result of provisions for holiday pay, Q3 was exceptionally good for this segment.
Our analysis: With regard to outsourcing contracts, Pihlajalinna was awarded
with the contract with Tervola after the second examination, as we assumed. The
contract is worth about EUR 13m and the current plan is to start service
production on 1 July 2017. To our surprise, Pihlajalinna did not tender for the
Tesoma wellbeing centre in Tampere (value EUR 10m), as the terms and
conditions of the contract were not reasonable. The possible contract with Forssa
has been specified to be worth around EUR 95–115m, but the scope of the
contract may still change. Kouvola has predicted that the contract with the city is
worth EUR 84m, which is considerably less than our preliminary estimate (EUR
240m; it is not likely to be a total outsourcing). It is still open whether Kauhajoki
will join the Kuusiokunnat agreement and there is no deadline set for the decision.
The draft law for the social and health care reform will be circulated for comments
in November and December. It seems that the freedom of choice will be more
restricted than anticipated in 2019, but it will notably be extended in 2021. The
final entity is still open but we consider the key role of private companies
inevitable in service production.
Conclusion & Action: We see no reason to change our positive view of the
company. We retain our target price at EUR 20 (70% EV/EBITDA 10x and 30%
DCF) and our Buy recommendation.
Analyst(s):
Kimmo Stenvall, OP Corporate Bank
+358 10 252 4561
Buy
16.10
closing price as of 11/11/2016
20.00
Target Price unchanged
Recommendation unchanged
Target price: EUR
Share price: EUR
Reuters/Bloomberg PIHLIS.HE/PIHLIS FH
Market capitalisation (EURm) 332
Current N° of shares (m) 21
Free float 70%
Daily avg. no. trad. sh. 12 mth 38
Daily avg. trad. vol. 12 mth (m) 456
Price high 12 mth (EUR) 19.20
Price low 12 mth (EUR) 12.95
Abs. perf. 1 mth -1.65%
Abs. perf. 3 mth -1.23%
Abs. perf. 12 mth 7.26%
Key financials (EUR) 12/15 12/16e 12/17e
Sales (m) 213 422 449
EBITDA (m) 12 27 33
EBITDA margin 5.4% 6.3% 7.3%
EBIT (m) 4 14 21
EBIT margin 1.7% 3.4% 4.7%
Net Profit (adj.)(m) 0 7 13
ROCE 2.1% 8.9% 13.0%
Net debt/(cash) (m) 27 10 (2)
Net Debt/Equity 0.3 0.1 0.0
Debt/EBITDA 2.3 0.4 -0.1
Int. cover(EBITDA/Fin. int) 4.8 16.6 20.5
EV/Sales 1.8 0.8 0.7
EV/EBITDA 33.7 12.9 10.0
EV/EBITDA (adj.) 33.7 12.9 10.0
EV/EBIT nm 23.8 15.5
P/E (adj.) nm 46.0 25.9
P/BV 3.9 3.2 2.9
OpFCF yield -7.4% 6.7% 5.9%
Dividend yield 0.1% 0.8% 1.9%
EPS (adj.) 0.00 0.35 0.62
BVPS 4.54 4.97 5.61
DPS 0.02 0.12 0.31
12
13
14
15
16
17
18
19
20
Oct 15 Nov 15 Dec 15 Jan 16 Feb 16 Mar 16 Apr 16 May 16 Jun 16 Jul 16 Aug 16 Sep 16 Oct 16 Nov 16
vvdsvdvsdy
PIHLAJALINNA OMXH (Rebased)Source: Factset
Shareholders: Sentica Buyout 16%; Mww Corporation
11%; Lähitapiola Mutual Insurance
Company 7%;

Page 27 of 60
Produced & Distributed by the Members of ESN (see last page of this report)
Fila
Italy/Household Goods Analyser
HOUSEHOLD GOODS
Fila (Buy) Promising signs of profitability
9M 16 results: good top line growth
The facts: Fila released its 9M 16 results on Friday November 11th after market
closure, a conference call followed.
Our analysis: Fila released another good quarter, in line with expectations. The
top line was driven by 8.2% organic growth (4.5% est. in Q3 16) and by EUR
82.7m M&A effect (Writefine, Daler Rowney and St. Cuthberts), notably Writefine
grew double digits; negative forex impact was EUR 9m in 9M1 6. Organic growth
was in Central and South America, Europe (in particular Italy, Spain, Russia,
Poland, Greece and Scandinavia) and North America. By product, organic growth
was given by all the product categories: other creativity instruments (+13.7%,
43.3% on sales); colored pencils (+4.8%; 42.5%) and by office and industrial
products (+6.9%, 14.2%). EBITDA grew 12% excluding the M&A (EUR 10m
positive contribution to EBITDA from M&A) and forex effects. EUR 6.2m
adjustments relate to extraordinary costs for the acquisitions.
Net debt at the end of September was EUR 175.7m vs. EUR 38.7m net debt YE
2015. The difference (EUR 137.1m) was given by both extraordinary and ordinary
effects. Extraordinary effect: -EUR 87.2m net debt of the newly acquired
companies, -EUR 23.7m for acquisitions. Net of these effects the net debt would
be EUR 64.9 (+26m vs. 9M 16).
Cash flow before trade working capital was EUR 41m (EUR 27.3m in 9M 15).
Trade working capital absorbed EUR 53.8m (EUR 56.2m in 9M 15), capex was
EUR 7.3m, dividends EUR 4.3m, interest paid EUR 3.9m and positive forex effect
EUR 3m.
Fila: 9M 16 results
(EUR m) Q3 15 Q3 16 Y/Y 9M 15 9M 16 Y/Y
Sales 76.3 107.8 41.3% 217.8 309.3 42.0%
EBITDA 11.9 17.8 49.8% 37.9 49.0 29.3%
% on sales 15.7% 16.5%
17.40% 15.8%
EBITDA adj.* 13.1 18.6 42.1% 40.9 55.2 35.0%
% on sales 17.1% 17.3%
18.8% 17.8%
Net income 6.1 9.6 nm -28.2 22.7 nn
Net income adj.** 7.4 10.3 39.2% 20.7 27.3 31.9%
Source: company data and Banca Akros elaborations
Conclusion & Action: Fila reported another good set of results. Canson (EUR
100m sales and est. EBITDA EUR 7.5m in FY 15) acquisition, consolidated
starting from October 2016, gives boost to our investment case, thanks to the
synergies arising especially with Fila and Daler Rowney (est. EUR 4.5m in FY
17E, EUR 9m in FY 18E synergies); according to our new estimates (not
reflected in our price target yet, an update will follow) Fila should reach 17%
EBITDA margin in FY 19E and even higher in the following years.
Analyst(s):
Giada Cabrino, CIIA, Banca Akros
+39 02 4344 4092
Buy
12.89
closing price as of 11/11/2016
14.80
Target Price unchanged
Recommendation unchanged
Target price: EUR
Share price: EUR
Reuters/Bloomberg FILA.MI/FILA IM
Market capitalisation (EURm) 531
Current N° of shares (m) 41
Free float 26%
Daily avg. no. trad. sh. 12 mth 33
Daily avg. trad. vol. 12 mth (m) 57
Price high 12 mth (EUR) 14.00
Price low 12 mth (EUR) 9.85
Abs. perf. 1 mth -3.88%
Abs. perf. 3 mth 1.42%
Abs. perf. 12 mth 26.37%
7
8
9
10
11
12
13
14
15
ott 15 nov 15 dic 15 gen 16 feb 16 mar 16 apr 16 mag 16 giu 16 lug 16 ago 16 set 16 ott 16 nov 16
vvdsvdvsdy
FILA FTSE Italy Microcap (Rebased)Source: Factset
Shareholders: Pencil 66%; VEI 8%;
Key financials (EUR)
12/15 12/16e
12/17e Sales (m) 275 394 419 EBITDA adj. (m) 47.5 65.1 71 EBITDA margin adj. 17.3
% 16.5
% 17.0
% EBIT (m) 34 52 59 EBIT margin 12.3
% 13.1
% 14.2
% Net Profit (adj.)(m) 25 32 35 ROCE 9.8
% 8.6
% 9.2
% Net debt/(cash) (m)
39 129 109 Net Debt/Equity 0.2 0.5 0.3 Debt/EBITDA
0.9 2.0 1.5 Int. cover(EBITDA/Fin. int) high 9.3 12.3 EV/Sales 1.9 1.8 1.6 EV/EBITDA 12.4 11.1 9.6 EV/EBITDA (adj.) 10.9 10.7 9.6 EV/EBIT 15.3 13.6 11.5 P/E (adj.) 18.1 16.8 15.1 P/BV 2.4 2.4 2.1 OpFCF yield -
9.0% -
20.6% 4.5
% Dividend yield 0.7
% 1.2
% 1.5
% EPS (adj.) 0.60 0.77 0.86 BVPS 4.50 5.51 6.22 DPS 0.09 0.15 0.19
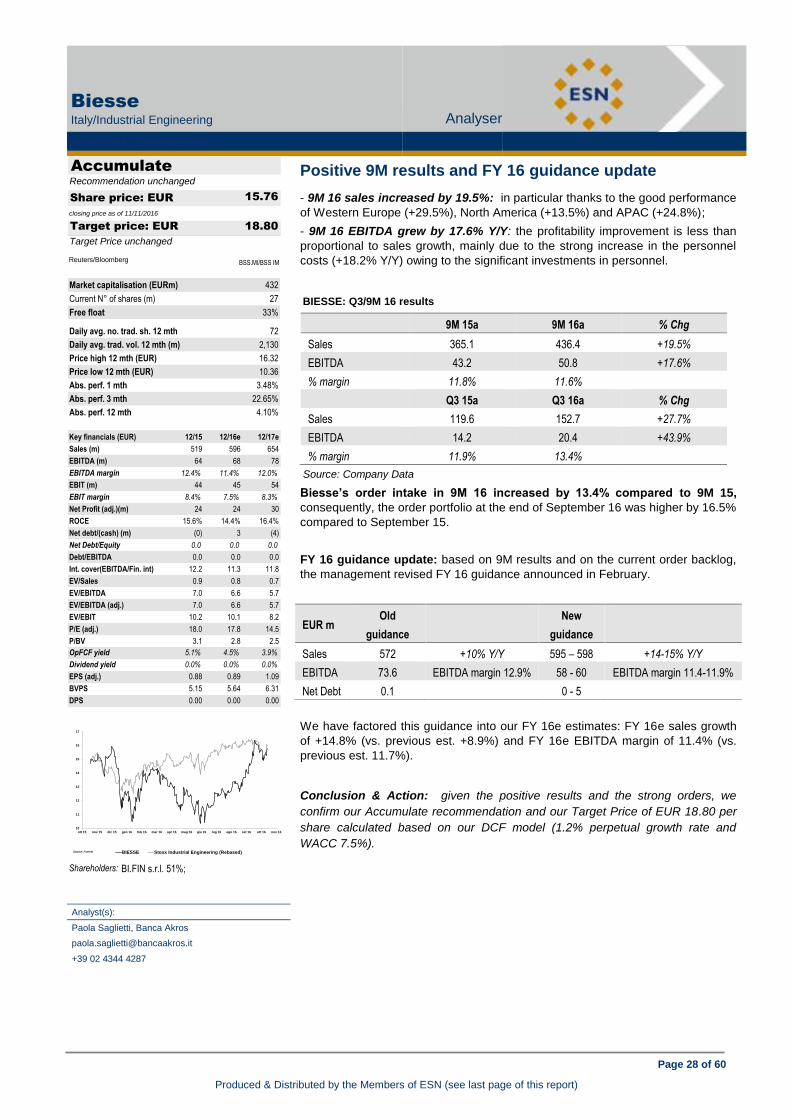
Page 28 of 60
Produced & Distributed by the Members of ESN (see last page of this report)
Biesse
Italy/Industrial Engineering Analyser
INDUSTRIAL ENGINEERING
Biesse (Accumulate) 9M 16 results: good top line growth
Positive 9M results and FY 16 guidance update
- 9M 16 sales increased by 19.5%: in particular thanks to the good performance
of Western Europe (+29.5%), North America (+13.5%) and APAC (+24.8%);
- 9M 16 EBITDA grew by 17.6% Y/Y: the profitability improvement is less than
proportional to sales growth, mainly due to the strong increase in the personnel
costs (+18.2% Y/Y) owing to the significant investments in personnel.
BIESSE: Q3/9M 16 results
9M 15a 9M 16a % Chg
Sales 365.1 436.4 +19.5%
EBITDA 43.2 50.8 +17.6%
% margin 11.8% 11.6%
Q3 15a Q3 16a % Chg
Sales 119.6 152.7 +27.7%
EBITDA 14.2 20.4 +43.9%
% margin 11.9% 13.4%
Source: Company Data
Biesse’s order intake in 9M 16 increased by 13.4% compared to 9M 15,
consequently, the order portfolio at the end of September 16 was higher by 16.5%
compared to September 15.
FY 16 guidance update: based on 9M results and on the current order backlog,
the management revised FY 16 guidance announced in February.
EUR m Old
guidance
New
guidance
Sales 572 +10% Y/Y 595 – 598 +14-15% Y/Y
EBITDA 73.6 EBITDA margin 12.9% 58 - 60 EBITDA margin 11.4-11.9%
Net Debt 0.1 0 - 5
We have factored this guidance into our FY 16e estimates: FY 16e sales growth
of +14.8% (vs. previous est. +8.9%) and FY 16e EBITDA margin of 11.4% (vs.
previous est. 11.7%).
Conclusion & Action: given the positive results and the strong orders, we
confirm our Accumulate recommendation and our Target Price of EUR 18.80 per
share calculated based on our DCF model (1.2% perpetual growth rate and
WACC 7.5%).
Analyst(s):
Paola Saglietti, Banca Akros
+39 02 4344 4287
Accumulate
15.76
closing price as of 11/11/2016
18.80
Target Price unchanged
Recommendation unchanged
Target price: EUR
Share price: EUR
Reuters/Bloomberg BSS.MI/BSS IM
Market capitalisation (EURm) 432
Current N° of shares (m) 27
Free float 33%
Daily avg. no. trad. sh. 12 mth 72
Daily avg. trad. vol. 12 mth (m) 2,130
Price high 12 mth (EUR) 16.32
Price low 12 mth (EUR) 10.36
Abs. perf. 1 mth 3.48%
Abs. perf. 3 mth 22.65%
Abs. perf. 12 mth 4.10%
Key financials (EUR) 12/15 12/16e 12/17e
Sales (m) 519 596 654
EBITDA (m) 64 68 78
EBITDA margin 12.4% 11.4% 12.0%
EBIT (m) 44 45 54
EBIT margin 8.4% 7.5% 8.3%
Net Profit (adj.)(m) 24 24 30
ROCE 15.6% 14.4% 16.4%
Net debt/(cash) (m) (0) 3 (4)
Net Debt/Equity 0.0 0.0 0.0
Debt/EBITDA 0.0 0.0 0.0
Int. cover(EBITDA/Fin. int) 12.2 11.3 11.8
EV/Sales 0.9 0.8 0.7
EV/EBITDA 7.0 6.6 5.7
EV/EBITDA (adj.) 7.0 6.6 5.7
EV/EBIT 10.2 10.1 8.2
P/E (adj.) 18.0 17.8 14.5
P/BV 3.1 2.8 2.5
OpFCF yield 5.1% 4.5% 3.9%
Dividend yield 0.0% 0.0% 0.0%
EPS (adj.) 0.88 0.89 1.09
BVPS 5.15 5.64 6.31
DPS 0.00 0.00 0.00
10
11
12
13
14
15
16
17
ott 15 nov 15 dic 15 gen 16 feb 16 mar 16 apr 16 mag 16 giu 16 lug 16 ago 16 set 16 ott 16 nov 16
vvdsvdvsdy
BIESSE Stoxx Industrial Engineering (Rebased)Source: Factset
Shareholders: BI.FIN s.r.l. 51%;

Page 29 of 60
Produced & Distributed by the Members of ESN (see last page of this report)
Datalogic
Italy/Industrial Engineering Analyser
INDUSTRIAL ENGINEERING
Datalogic (Accumulate) Positive 9M results and FY 16 guidance update
9M 16 results: profitability slightly higher than expected
As previously announced, 9M 16 sales increased by 7.8% Y/Y to EUR 421.8m.
The group recorded a good sales growth in both divisions: 1) revenues in the
ADC division grew by 9.3% Y/Y, especially thanks to the sales of POS check out
fixed scanners, the new mobile computers and the new products Joya Touch and
Shop Evolution 7; 2) the IA sector sales grew by 9.2% Y/Y.
In terms of geographic sales, all markets recorded a robust trend. Europe
achieved robust growth in IA (+13.4%) and in ADC (+8.6%); North America
recorded double digit growth in ADC division and a decrease in IA sector due to a
seasonality effect impacting T&L projects; lastly, the group achieved a strong
revenues growth in China mainly driven by IA and in Latin America thanks to
ADC.
9M 16 EBITDA improved by 25.5% (slightly better than our est of +23.3%): the
EBITDA margin increased from 13.6% in 9M 15 to 15.8% in 9M 16 (vs our
estimates 15.5%). This improvement was due to a strong cost control and a lower
incidence of the distribution costs.
DATALOGIC: Q3/9M 16 results
9M 15a 9M 16a % Chg
Sales 391.3 421.8 +7.8%
EBITDA 53.1 66.6 +25.5%
% margin 13.6% 15.8%
Q3 15a Q3 16a % Chg
Sales 133.8 139.9 +4.6%
EBITDA 18.8 21.7 +15.6%
% margin 14.0% 15.5%
Source: Company Data
Positive outlook on FY 16 confirmed: based on the booking during Q3 16 (EUR
138.1m, +3.5% vs Q3 15) FY 16 revenues growth will be in line with the trend of
the first nine months; 2) the profitability will continue to improve.
So, we confirm our FY 16 estimates, which are in line with the indications.
Conclusion & Action: we maintain our positive stance on the stock and, based
on the positive outlook, we confirm our Accumulate recommendation and our
target price of EUR 19.20 per share (DCF model - WACC at 7.00% and 1.5%
perpetual growth rate).
Analyst(s):
PaolaSaglietti, Banca Akros
+39 02 4344 4287
Accumulate
18.00
closing price as of 11/11/2016
19.20
Target Price unchanged
Recommendation unchanged
Target price: EUR
Share price: EUR
Reuters/Bloomberg DAL.MI/DAL IM
Market capitalisation (EURm) 1,052
Current N° of shares (m) 58
Free float 33%
Daily avg. no. trad. sh. 12 mth 42
Daily avg. trad. vol. 12 mth (m) 228
Price high 12 mth (EUR) 19.30
Price low 12 mth (EUR) 12.52
Abs. perf. 1 mth -2.70%
Abs. perf. 3 mth 2.27%
Abs. perf. 12 mth 12.78%
Key financials (EUR) 12/15 12/16e 12/17e
Sales (m) 535 578 617
EBITDA (m) 74 89 97
EBITDA margin 13.8% 15.3% 15.8%
EBIT (m) 56 67 75
EBIT margin 10.4% 11.7% 12.2%
Net Profit (adj.)(m) 47 56 66
ROCE 11.1% 12.1% 12.3%
Net debt/(cash) (m) 21 2 (23)
Net Debt/Equity 0.1 0.0 -0.1
Debt/EBITDA 0.3 0.0 -0.2
Int. cover(EBITDA/Fin. int) 16.6 20.6 24.0
EV/Sales 1.9 1.9 1.8
EV/EBITDA 14.0 12.5 11.1
EV/EBITDA (adj.) 14.0 12.5 11.1
EV/EBIT 18.7 16.5 14.4
P/E (adj.) 23.6 20.9 17.9
P/BV 3.2 3.0 2.6
OpFCF yield 5.2% 2.4% 2.7%
Dividend yield 0.9% 0.9% 0.9%
EPS (adj.) 0.69 0.86 1.01
BVPS 5.10 5.96 6.97
DPS 0.15 0.15 0.16
12
13
14
15
16
17
18
19
20
Oct 15 Nov 15 Dec 15 Jan 16 Feb 16 Mar 16 Apr 16 May 16 Jun 16 Jul 16 Aug 16 Sep 16 Oct 16 Nov 16
vvdsvdvsdy
DATALOGIC FTSE Italy STAR (Rebased)Source: Factset
Shareholders: Hydra 67%;

Page 30 of 60
Produced & Distributed by the Members of ESN (see last page of this report)
Emak
Italy/Industrial Engineering Analyser
INDUSTRIAL ENGINEERING
Emak (Accumulate) 9M 16 results: profitability slightly higher than expected
9M 16 results
Positive sales trend: 9M 16 sales grew by 2.5% Y/Y; despite a negative forex
impact for 1.2%, the sales benefited from organic growth +3.1% Y/Y and external
growth +0.6%. The “Outdoor power equipment” sector recorded a positive
performance (+2.0% Y/Y) thanks to a sales acceleration in Q3; “Pumps and High
pressure water jetting” sector recorded a slight positive sales growth of +1.5% Y/Y
and “Components and accessories” division achieved a growth of +4.4% Y/Y.
Good improvement in profitability: 9M 16 EBITDA grew by 11.4%. The
profitability benefited from a strong costs reduction.
EMAK: 9M 16 results
9M 15a 9M 16a %Chg.
Sales 302.2 309.7 +2.5%
EBITDA 32.6 36.3 +11.4%
EBITDA margin 10.8% 11.7%
Source: Company Data and BANCA AKROS estimates
Outlook on FY 16: based on 9M results and on the visibility on Q4 trend, the
management is confident that the group will achieve a FY 16 turnover at around
390m and an EBITDA at around EUR 40m.
Our FY 16 estimates are substantially in line with the foregoing indications.
Conclusion & Action: we confirm our Accumulate recommendation and our
target price of EUR 0.93 per share calculated based on our DCF model (perpetual
growth rate of 1.5% and WACC of 7.5%).
Analyst(s):
PaolaSaglietti, Banca Akros
+39 02 4344 4287
Accumulate
0.84
closing price as of 11/11/2016
0.93
Target Price unchanged
Recommendation unchanged
Target price: EUR
Share price: EUR
Reuters/Bloomberg EM.MI/EM IM
Market capitalisation (EURm) 138
Current N° of shares (m) 164
Free float 26%
Daily avg. no. trad. sh. 12 mth 55
Daily avg. trad. vol. 12 mth (m) 218
Price high 12 mth (EUR) 0.84
Price low 12 mth (EUR) 0.60
Abs. perf. 1 mth 3.83%
Abs. perf. 3 mth 22.77%
Abs. perf. 12 mth 2.56%
Key financials (EUR) 12/15 12/16e 12/17e
Sales (m) 382 391 397
EBITDA (m) 36 40 41
EBITDA margin 9.4% 10.3% 10.4%
EBIT (m) 23 26 25
EBIT margin 6.1% 6.6% 6.4%
Net Profit (adj.)(m) 12 13 12
ROCE 5.8% 6.3% 6.2%
Net debt/(cash) (m) 99 98 89
Net Debt/Equity 0.6 0.6 0.5
Debt/EBITDA 2.8 2.4 2.2
Int. cover(EBITDA/Fin. int) 7.9 6.9 7.1
EV/Sales 0.6 0.6 0.6
EV/EBITDA 6.6 6.1 5.7
EV/EBITDA (adj.) 6.6 6.1 5.7
EV/EBIT 10.1 9.5 9.3
P/E (adj.) 14.3 10.6 11.3
P/BV 0.8 0.8 0.8
OpFCF yield -7.3% 19.5% 10.0%
Dividend yield 4.2% 4.2% 4.2%
EPS (adj.) 0.05 0.08 0.07
BVPS 1.02 1.06 1.10
DPS 0.04 0.04 0.04
0.60
0.65
0.70
0.75
0.80
0.85
0.90
Oct 15 Nov 15 Dec 15 Jan 16 Feb 16 Mar 16 Apr 16 May 16 Jun 16 Jul 16 Aug 16 Sep 16 Oct 16 Nov 16
vvdsvdvsdy
EMAK Stoxx Industrial Engineering (Rebased)Source: Factset
Shareholders: YAMA Group 74%;

Page 31 of 60
Produced & Distributed by the Members of ESN (see last page of this report)
Prima Industrie
Italy/Industrial Engineering Analyser
INDUSTRIAL ENGINEERING
Prima Industrie (Buy) 9M 16 results
Q3: good results, improving profitability
The facts: Prima Industrie released Q3 & 9M 2016 results on November 11th
.
Our analysis: 9M and Q3 results came in almost in line with our estimates, with
slightly below revenues and slightly better profitability (EBITDA margin came in
0.3pp above our expectations). Net profit came in significantly above 9M 15 figure
due to better comparison base (9-months 2015 were impacted by EUR 2.1m non-
recurring financial charges related to the Finpolar loan advance repayment) and
to lower than expected tax rate driven by company’s available tax credits in Italy
and in Finland.
EUR m Q3
15A Q3-16A Y/Y
Q3
16E
9M-
15A
9M-
16A Y/Y
9M-
16E
Sales 84.2 91.2 8.4% 94.7 260.1 274.5 5.6% 278
EBITDA 7.0 9.2 32.0% 8.7 21.7 24.0 10.7% 23.5
EBITDA margin 8.3% 10.1%
9.2% 8.3% 8.8%
8.5%
D&A -3.4 -4.0 17.9% -3.2 -9.9 -11.7 18.2% -10.9
EBIT 3.6 5.2 45.4% 5.5 11.8 12.3 4.4% 12.6
EBIT margin 4.3% 5.7%
5.8% 4.5% 4.5%
4.5%
Net Profit 0.9 2.7 nm 1.8 2.2 5.6 nm 4.7
Source: Banca Akros estimates, Prima Industrie
Geographic. Q3 confirmed the strong contribution from Americas and APAC
(+22% and +46% Y/Y respectively) that more than offset the negative contribution
of EMEA (-5% Y/Y in Q3). EMEA sales drop in the period was mainly driven by
Prima Electro (-43% Y/Y) due to decline in Oil & Gas related product sales.
EMEA’s weight further declined to 56.7% (1pp less than in H1 and 7pp less than
in 9M 15) in 9M, confirming PRI's increasing international exposure.
Net Debt. Net Debt at the end of September reached EUR 122m, increasing from
June (EUR 104m) as usual for seasonal reasons related to NWC expansion (from
EUR 76m in H1 to current EUR 96m). Q4 sales will contribute to a material NWC
reduction thus leading Net Debt to be almost in line with previous year. We
remind investors that the debt covenants are calculated only in June and
December thus providing the company a higher flexibility over the other two
quarters.
Backlog. Orders intake increased by 12% Y/Y in 9M to EUR 305.8m, thus
contributing to a very sound order intake of EUR 144.7m in Sep-16, further
increased to EUR 159.1m in Oct-16.
Conclusion & Action: Good set of results confirming our projections and our
investment case based on a continuous internationalisation of the company. On
the back of 9M figures we adjust our estimates to factor in lower tax rate and
slight increase in Capex (from EUR 11m to EUR 12.7m) on FY 16. We believe the
very sound backlog at the end of October should allow the company to meet our
estimates on 2016 and provide better than usual visibility on begin-2017 too. Net
debt should not represent an issue at year end. Buy confirmed.
Analyst(s):
Enrico Filippi, CEFA, Banca Akros
+39 02 4344 4071
Buy
14.24
closing price as of 11/11/2016
16.40
Target Price unchanged
Recommendation unchanged
Target price: EUR
Share price: EUR
Reuters/Bloomberg PRII.MI/PRI IM
Market capitalisation (EURm) 149
Current N° of shares (m) 10
Free float 43%
Daily avg. no. trad. sh. 12 mth 13
Daily avg. trad. vol. 12 mth (m) 243
Price high 12 mth (EUR) 15.11
Price low 12 mth (EUR) 8.75
Abs. perf. 1 mth 4.71%
Abs. perf. 3 mth 12.30%
Abs. perf. 12 mth -6.87%
Key financials (EUR) 12/15 12/16e 12/17e
Sales (m) 364 395 428
EBITDA (m) 31 36 43
EBITDA margin 8.6% 9.1% 10.1%
EBIT (m) 17 21 28
EBIT margin 4.8% 5.2% 6.6%
Net Profit (adj.)(m) 6 10 15
ROCE 4.2% 4.7% 6.2%
Net debt/(cash) (m) 102 104 96
Net Debt/Equity 0.8 0.7 0.6
Debt/EBITDA 3.2 2.9 2.2
Int. cover(EBITDA/Fin. int) 3.4 5.1 6.4
EV/Sales 0.7 0.7 0.6
EV/EBITDA 8.3 7.1 5.7
EV/EBITDA (adj.) 8.3 7.1 5.7
EV/EBIT 14.9 12.4 8.7
P/E (adj.) 25.8 14.3 10.1
P/BV 1.2 1.1 1.0
OpFCF yield -7.5% 4.9% 6.6%
Dividend yield 1.8% 2.1% 2.5%
EPS (adj.) 0.57 1.00 1.41
BVPS 12.37 13.12 14.24
DPS 0.25 0.30 0.35
8
9
10
11
12
13
14
15
16
Oct 15 Nov 15 Dec 15 Jan 16 Feb 16 Mar 16 Apr 16 May 16 Jun 16 Jul 16 Aug 16 Sep 16 Oct 16 Nov 16
vvdsvdvsdy
PRIMA INDUSTRIE Stoxx Industrial Engineering (Rebased)Source: Factset
Shareholders: Management 7%; Stable Financial
Investors 50%;

Page 32 of 60
Produced & Distributed by the Members of ESN (see last page of this report)
Cattolica Assicurazioni
Italy/Insurance Analyser
INSURANCE
Cattolica Assicurazioni (Neutral) Q3: good results, improving profitability
3Q16 better than expected – 2017 targets revised down
The facts: Cattolica reported its 9M16 numbers on Friday during trading hours,
followed by a conference call.
3Q16 9M16 Y/Y A/E 3Q16E 9M16E
Net premiums 942 3,192 -15% 2% 886 3,136
Net Profit 28 45 -46% 17% 21 38
Net Profit Adj. 31 95 -9% 2% 21 93
CoR 93.6% 93.2% 1% 0% 93.5% 93.1%
Our analysis: net profit adj. was better than our estimates. More in detail, the
net premiums achieved EUR 3.192bn, -15% Y/Y. The direct premiums in Life
business recorded a decrease around -25% Y/Y, mainly still due to the slowdown
in Banca Popolare di Vicenza’s distribution channel. P&C premiums decreased
around -2.9% Y/Y (-3.5% in 1H16). Auto business premiums decrease c. -3.3%
Y/Y (-4.4% Y/Y in 1H16), mainly due to the reduction in average premium,
although at a slower pace, and despite the increase in the number of policies sold
around 2% YTD compared to 1.7% YTD in the 1H16. The Non-Auto business
premiums decreased c. 2.4% Y/Y (-2.4% Y/Y in the 1H16). CoR closed around
93.2%, essentially in line with estimates, vs 92.5% at the end of 1H16: the
increase was due to the decrease in average premium, which is still going on,
and to the Italian’s August earthquake. The Solvency II ratio, calculated using the
standard formula, close at 1.75 (1.88 in 1H16), worse than our expectations
(1.89). The 2017 consolidate net profit guidance was revised down to EUR
150m from EUR 200m, mainly due to current tough market conditions.
Conference call highlights: the average premium in Auto business ought to
increase in 2017; the negotiations with BPVI are going on; despite M&A is still on
the table, the rumours on a possible acquisition of Groupama’s Italian assets are
groundless according to Cattolica’s management.
Conclusion & Action: numbers were a little bit better than expected. Anyway,
the revision downward of the net profit guidance for 2017, the increase expected
in Auto business frequency of claims and the still negative trend of premiums of
the joint ventures with BPVI, convinced us to revise down our EPS estimate
around 15% for 2017. On the other side, we increase 2016 EPS around 5% vs
previous estimate. We stick to neutral, but we reduce our target price to EUR 6.0
from EUR 6.4. We remind readers that, the exercise price of the put option on
BPVI’s JVs ought to be c. EUR 175m. Cattolica ought to lose c. EUR 500m of
premiums distributed by this channel and net profits between EUR 8m and EUR
10m according to our calculation. The NPV of the transaction, if the put is
exercised, ought to be c. EUR 60m, equal to c. 6% of Cattolica’s current market
cap. On the other side, the overhang risk could also increase, considering that the
BPVI’s 15% in Cattolica could be sold after the exercise of the option. The
transformation of Cattolica into a joint stock company or a more likely
improvement in corporate governance remains the most important upside
potential for the medium – long term.
Analyst(s):
Enrico Esposti, CIIA, Banca Akros
+39 02 4344 4022
Neutral
5.53
closing price as of 11/11/2016
6.00
6.40from Target Price: EUR
Recommendation unchanged
Target price: EUR
Share price: EUR
Reuters/Bloomberg CASS.MI/CASS IM
Market capitalisation (EURm) 946
Current N° of shares (m) 171
Free float 85%
Daily avg. no. trad. sh. 12 mth 523
Daily avg. trad. vol. 12 mth (m) 4,012
Price high 12 mth (EUR) 7.49
Price low 12 mth (EUR) 4.98
Abs. perf. 1 mth 6.45%
Abs. perf. 3 mth 2.41%
Abs. perf. 12 mth -23.41%
Key financials (EUR) 12/15 12/16e 12/17e
Life Gross premiums (m) 3,129 2,256 2,202
Non-Life Gross prem.(m) 2,079 2,023 2,060
Total Net Revenues (m) 5,429 4,406 4,349
Life Ins.Tech.Result (m) 0 0 0
Non-Life Ins. Tech.Result 0 0 0
EBIT (m) 225 232 226
Net Profit (adj.) (m) 140 120 93
Shareholders Equity (m) 1,912 1,951 1,992
ANAV (m) 1,696 1,734 1,776
ROE (adj.) (%) 7.3 6.3 4.8
Combined ratio (%) 91.5 93.1 92.6
Solvency Ratio 209.6% 214.3% 217.1%
P/E (adj.) 9.0 7.9 10.1
P/BV 0.7 0.5 0.5
P/ANAV nm nm nm
P/EbV nm nm nm
Dividend Yield 6.3% 5.4% 4.9%
EPS (adj.) 0.82 0.70 0.54
BVPS 11.17 11.40 11.64
ANAVPS 0.00 0.00 0.00
EbVPS 0.00 0.00 0.00
DPS 0.35 0.30 0.27
4.5
5.0
5.5
6.0
6.5
7.0
7.5
ott 15 nov 15 dic 15 gen 16 feb 16 mar 16 apr 16 mag 16 giu 16 lug 16 ago 16 set 16 ott 16 nov 16
vvdsvdvsdy
CATTOLICA ASSICURAZIONI FTSE Italy All Share (Rebased)Source: Factset
Shareholders: Banca Popolare di Vicenza 15%;
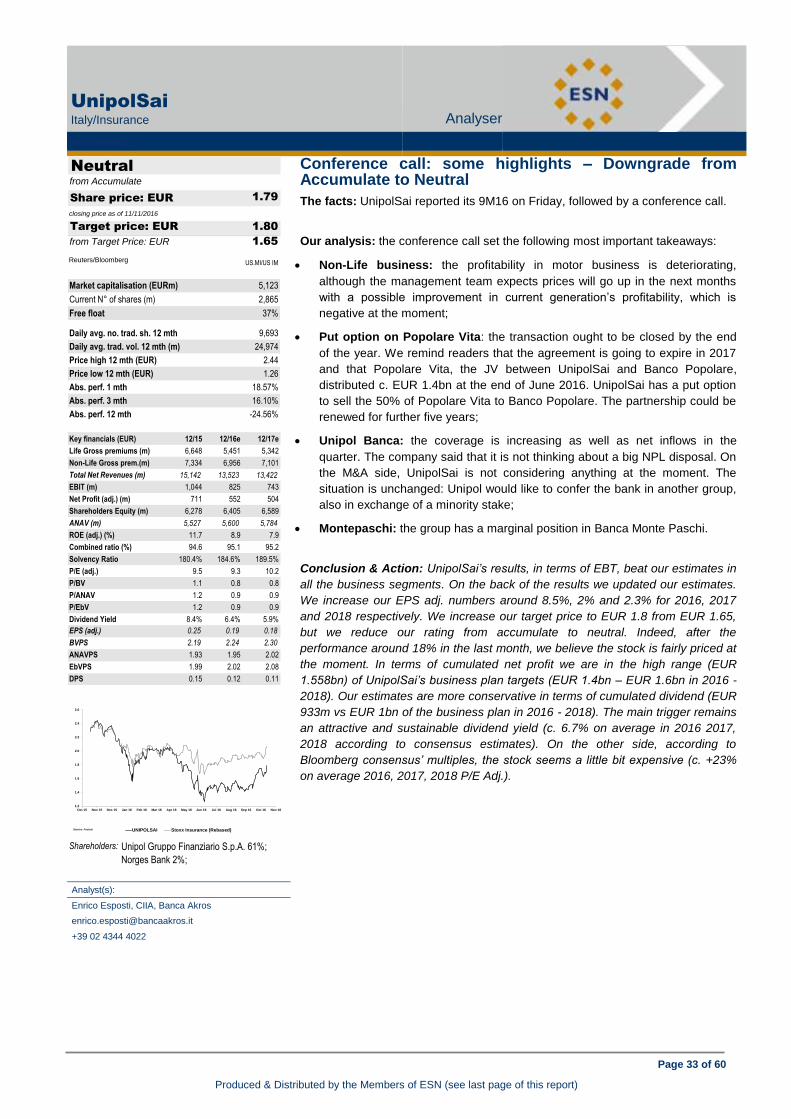
Page 33 of 60
Produced & Distributed by the Members of ESN (see last page of this report)
UnipolSai
Italy/Insurance Analyser
INSURANCE
UnipolSai (Neutral) 3Q16 better than expected – 2017 targets revised down
Conference call: some highlights – Downgrade from Accumulate to Neutral
The facts: UnipolSai reported its 9M16 on Friday, followed by a conference call.
Our analysis: the conference call set the following most important takeaways:
Non-Life business: the profitability in motor business is deteriorating,
although the management team expects prices will go up in the next months
with a possible improvement in current generation’s profitability, which is
negative at the moment;
Put option on Popolare Vita: the transaction ought to be closed by the end
of the year. We remind readers that the agreement is going to expire in 2017
and that Popolare Vita, the JV between UnipolSai and Banco Popolare,
distributed c. EUR 1.4bn at the end of June 2016. UnipolSai has a put option
to sell the 50% of Popolare Vita to Banco Popolare. The partnership could be
renewed for further five years;
Unipol Banca: the coverage is increasing as well as net inflows in the
quarter. The company said that it is not thinking about a big NPL disposal. On
the M&A side, UnipolSai is not considering anything at the moment. The
situation is unchanged: Unipol would like to confer the bank in another group,
also in exchange of a minority stake;
Montepaschi: the group has a marginal position in Banca Monte Paschi.
Conclusion & Action: UnipolSai’s results, in terms of EBT, beat our estimates in
all the business segments. On the back of the results we updated our estimates.
We increase our EPS adj. numbers around 8.5%, 2% and 2.3% for 2016, 2017
and 2018 respectively. We increase our target price to EUR 1.8 from EUR 1.65,
but we reduce our rating from accumulate to neutral. Indeed, after the
performance around 18% in the last month, we believe the stock is fairly priced at
the moment. In terms of cumulated net profit we are in the high range (EUR
1.558bn) of UnipolSai’s business plan targets (EUR 1.4bn – EUR 1.6bn in 2016 -
2018). Our estimates are more conservative in terms of cumulated dividend (EUR
933m vs EUR 1bn of the business plan in 2016 - 2018). The main trigger remains
an attractive and sustainable dividend yield (c. 6.7% on average in 2016 2017,
2018 according to consensus estimates). On the other side, according to
Bloomberg consensus’ multiples, the stock seems a little bit expensive (c. +23%
on average 2016, 2017, 2018 P/E Adj.).
Analyst(s):
Enrico Esposti, CIIA, Banca Akros
+39 02 4344 4022
Neutral
1.79
closing price as of 11/11/2016
1.80
1.65from Target Price: EUR
from Accumulate
Target price: EUR
Share price: EUR
Reuters/Bloomberg US.MI/US IM
Market capitalisation (EURm) 5,123
Current N° of shares (m) 2,865
Free float 37%
Daily avg. no. trad. sh. 12 mth 9,693
Daily avg. trad. vol. 12 mth (m) 24,974
Price high 12 mth (EUR) 2.44
Price low 12 mth (EUR) 1.26
Abs. perf. 1 mth 18.57%
Abs. perf. 3 mth 16.10%
Abs. perf. 12 mth -24.56%
Key financials (EUR) 12/15 12/16e 12/17e
Life Gross premiums (m) 6,648 5,451 5,342
Non-Life Gross prem.(m) 7,334 6,956 7,101
Total Net Revenues (m) 15,142 13,523 13,422
EBIT (m) 1,044 825 743
Net Profit (adj.) (m) 711 552 504
Shareholders Equity (m) 6,278 6,405 6,589
ANAV (m) 5,527 5,600 5,784
ROE (adj.) (%) 11.7 8.9 7.9
Combined ratio (%) 94.6 95.1 95.2
Solvency Ratio 180.4% 184.6% 189.5%
P/E (adj.) 9.5 9.3 10.2
P/BV 1.1 0.8 0.8
P/ANAV 1.2 0.9 0.9
P/EbV 1.2 0.9 0.9
Dividend Yield 8.4% 6.4% 5.9%
EPS (adj.) 0.25 0.19 0.18
BVPS 2.19 2.24 2.30
ANAVPS 1.93 1.95 2.02
EbVPS 1.99 2.02 2.08
DPS 0.15 0.12 0.11
1.2
1.4
1.6
1.8
2.0
2.2
2.4
2.6
Oct 15 Nov 15 Dec 15 Jan 16 Feb 16 Mar 16 Apr 16 May 16 Jun 16 Jul 16 Aug 16 Sep 16 Oct 16 Nov 16
vvdsvdvsdy
UNIPOLSAI Stoxx Insurance (Rebased)Source: Factset
Shareholders: Unipol Gruppo Finanziario S.p.A. 61%;
Norges Bank 2%;
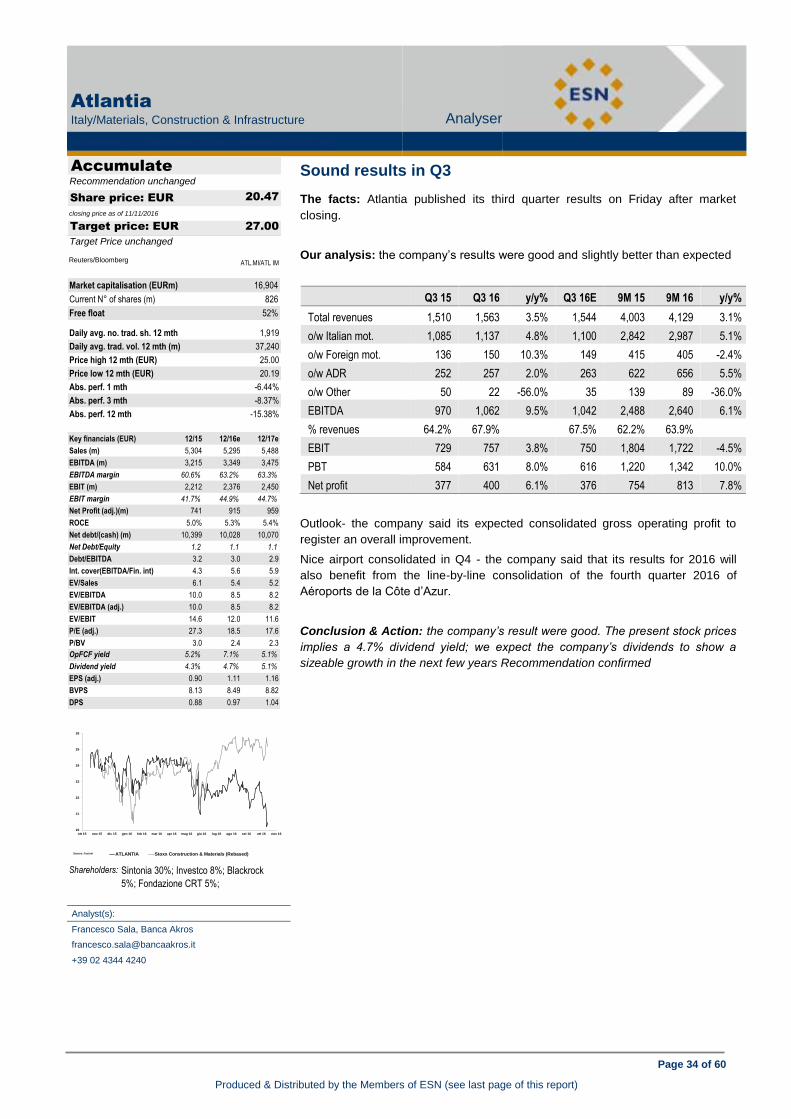
Page 34 of 60
Produced & Distributed by the Members of ESN (see last page of this report)
Atlantia
Italy/Materials, Construction & Infrastructure Analyser
MATERIALS, CONSTRUCTION & INFRASTRUCTURE
Atlantia (Accumulate) Conference call: some highlights – Downgrade from Accumulate to Neutral
Sound results in Q3
The facts: Atlantia published its third quarter results on Friday after market
closing.
Our analysis: the company’s results were good and slightly better than expected
Q3 15 Q3 16 y/y% Q3 16E 9M 15 9M 16 y/y%
Total revenues 1,510 1,563 3.5% 1,544 4,003 4,129 3.1%
o/w Italian mot. 1,085 1,137 4.8% 1,100 2,842 2,987 5.1%
o/w Foreign mot. 136 150 10.3% 149 415 405 -2.4%
o/w ADR 252 257 2.0% 263 622 656 5.5%
o/w Other 50 22 -56.0% 35 139 89 -36.0%
EBITDA 970 1,062 9.5% 1,042 2,488 2,640 6.1%
% revenues 64.2% 67.9%
67.5% 62.2% 63.9%
EBIT 729 757 3.8% 750 1,804 1,722 -4.5%
PBT 584 631 8.0% 616 1,220 1,342 10.0%
Net profit 377 400 6.1% 376 754 813 7.8%
Outlook- the company said its expected consolidated gross operating profit to
register an overall improvement.
Nice airport consolidated in Q4 - the company said that its results for 2016 will
also benefit from the line-by-line consolidation of the fourth quarter 2016 of
Aéroports de la Côte d’Azur.
Conclusion & Action: the company’s result were good. The present stock prices
implies a 4.7% dividend yield; we expect the company’s dividends to show a
sizeable growth in the next few years Recommendation confirmed
Analyst(s):
Francesco Sala, Banca Akros
+39 02 4344 4240
Accumulate
20.47
closing price as of 11/11/2016
27.00
Target Price unchanged
Recommendation unchanged
Target price: EUR
Share price: EUR
Reuters/Bloomberg ATL.MI/ATL IM
Market capitalisation (EURm) 16,904
Current N° of shares (m) 826
Free float 52%
Daily avg. no. trad. sh. 12 mth 1,919
Daily avg. trad. vol. 12 mth (m) 37,240
Price high 12 mth (EUR) 25.00
Price low 12 mth (EUR) 20.19
Abs. perf. 1 mth -6.44%
Abs. perf. 3 mth -8.37%
Abs. perf. 12 mth -15.38%
Key financials (EUR) 12/15 12/16e 12/17e
Sales (m) 5,304 5,295 5,488
EBITDA (m) 3,215 3,349 3,475
EBITDA margin 60.6% 63.2% 63.3%
EBIT (m) 2,212 2,376 2,450
EBIT margin 41.7% 44.9% 44.7%
Net Profit (adj.)(m) 741 915 959
ROCE 5.0% 5.3% 5.4%
Net debt/(cash) (m) 10,399 10,028 10,070
Net Debt/Equity 1.2 1.1 1.1
Debt/EBITDA 3.2 3.0 2.9
Int. cover(EBITDA/Fin. int) 4.3 5.6 5.9
EV/Sales 6.1 5.4 5.2
EV/EBITDA 10.0 8.5 8.2
EV/EBITDA (adj.) 10.0 8.5 8.2
EV/EBIT 14.6 12.0 11.6
P/E (adj.) 27.3 18.5 17.6
P/BV 3.0 2.4 2.3
OpFCF yield 5.2% 7.1% 5.1%
Dividend yield 4.3% 4.7% 5.1%
EPS (adj.) 0.90 1.11 1.16
BVPS 8.13 8.49 8.82
DPS 0.88 0.97 1.04
20
21
22
23
24
25
26
ott 15 nov 15 dic 15 gen 16 feb 16 mar 16 apr 16 mag 16 giu 16 lug 16 ago 16 set 16 ott 16 nov 16
vvdsvdvsdy
ATLANTIA Stoxx Construction & Materials (Rebased)Source: Factset
Shareholders: Sintonia 30%; Investco 8%; Blackrock
5%; Fondazione CRT 5%;

Page 35 of 60
Produced & Distributed by the Members of ESN (see last page of this report)
Heijmans
Netherlands/Materials, Construction & Infrastructure Analyser
MATERIALS, CONSTRUCTION & INFRASTRUCTURE
Heijmans (Buy) Sound results in Q3 Buy
5.83
closing price as of 11/11/2016
10.00
Target Price unchanged
Recommendation unchanged
Target price: EUR
Share price: EUR
Reuters/Bloomberg HEIJ.AS/HEIJM NA
Market capitalisation (EURm) 125
Current N° of shares (m) 21
Free float 90%
Daily avg. no. trad. sh. 12 mth 130
Daily avg. trad. vol. 12 mth (m) 1,418
Price high 12 mth (EUR) 9.20
Price low 12 mth (EUR) 5.69
Abs. perf. 1 mth -31.31%
Abs. perf. 3 mth -31.55%
Abs. perf. 12 mth -9.08%
Key financials (EUR) 12/15 12/16e 12/17e
Sales (m) 1,979 2,155 2,291
EBITDA (m) (10) 11 50
EBITDA margin nm 0.5% 2.2%
EBIT (m) (29) (11) 26
EBIT margin nm nm 1.1%
Net Profit (adj.)(m) (26) (10) 9
ROCE -17.4% -6.6% 17.0%
Net debt/(cash) (m) 10 10 (23)
Net Debt/Equity 0.0 0.0 -0.1
Debt/EBITDA -1.0 0.9 -0.5
Int. cover(EBITDA/Fin. int) (1.0) 1.4 6.5
EV/Sales 0.1 0.1 0.0
EV/EBITDA nm 12.5 2.1
EV/EBITDA (adj.) nm 12.5 2.1
EV/EBIT nm nm 4.0
P/E (adj.) nm nm 14.4
P/BV 0.6 0.5 0.5
OpFCF yield -7.7% -0.2% 26.4%
Dividend yield 0.0% 0.0% 2.4%
EPS (adj.) (1.28) (0.48) 0.41
BVPS 12.87 11.75 12.09
DPS 0.00 0.00 0.14
CFO to leave early next year
The facts: CFO Mark van den Biggelaar will be leaving Heijmans early 2017 after
the FY16 results. He will be available until the end of June to ensure a good
transition.
Our analysis: We expect that this is a personal decision, as Heijmans’
Supervisory Board states in the press release that it “recognizes Mr. van den
Biggelaar’s contribution to the development of Heijmans over the past seven
years and regrets his departure but respects his choice”.
However, the departure of Mr. van den Biggelaar can not be seen separately from
the financial troubles that Heijmans currently is in. With the tremendous strain on
the company, we can imagine that tensions have built up in the organization.
We believe that Mr. van den Biggelaar has had a great contribution to Heijmans
with the fit for cash working capital program and the efforts to strengthen the IT
(BIM/ERP) and financial control functions. Of course, Mr. van den Biggelaar has
also been responsible for negotiating the terms for the current credit facilities
which now appear to be very tight. Although Mr. van den Biggelaar will be in the
board until early 2017, his position will clearly not be as strong and this puts more
risk to our investment case.
The financial function is very important, certainly at a construction company like
Heijmans to get a firm grip on the organization and as such the supervisory board
will have to find another solid personality with not only financial skills. The
supervisory board has started the process that will result in the appointment of a
new CFO and we would welcome a swift process.
Conclusion & Action: We expect that Heijmans will continue to act in the best
interest of shareholders and as such, Mr. van den Biggelaar’s leaving changes
nothing to our investment case that all focus should be on settling problem
projects to take away uncertainty. If this leads to a breach of covenants in the
short term, Heijmans should push for a waiver and not for adding extra equity, as
this is not the solution for the problem which is simply too low profitability. Of
course there is a relatively high risk in this investment case, but we stick to our
Buy rating and PT of EUR 10.
5.5
6.0
6.5
7.0
7.5
8.0
8.5
9.0
9.5
Oct 15 Nov 15 Dec 15 Jan 16 Feb 16 Mar 16 Apr 16 May 16 Jun 16 Jul 16 Aug 16 Sep 16 Oct 16 Nov 16
vvdsvdvsdy
HEIJMANS Midkap (Rebased)Source: Factset Shareholders: ASR 5%; Delta Lloyd 5%; Fidelity 5%;
Analyst(s):
Edwin de Jong, NIBC Markets N.V.
+312 0 5508569

Page 36 of 60
Produced & Distributed by the Members of ESN (see last page of this report)
Lehto Group
EURm 2013 2014 2015 2016e 2017e 2018e
Sales 113 171 276 340 440 493
Sales growth (%) 0.0 % 50.8 % 61.1 % 23.2 % 29.4 % 12.2 %
EBIT 9.2 5.8 27.2 35.7 43.7 48.5
EBIT (%) 8.1 % 3.4 % 9.9 % 10.5 % 9.9 % 9.8 %
EPS 0.11 0.07 0.36 0.48 0.59 0.65
DPS 0.05 0.12 0.14 0.19 0.23 0.26
EV/Sales 1.4 1.1 1.0
EV/EBIT 13.2 10.8 9.7
P/E 18.9 15.4 13.8
P/E (kassaoikaistu) 16.9 13.8 12.4
EV/FCF -389.2 47.4 29.3
ROE 44% 25% 64% 25% 26% 24%
ROCE 41% 19% 54% 27% 28% 27%
Gearing -16% 51% -8% -48% -39% -34%
Equity ratio 41% 27% 37% 60% 60% 62%
Source: OP
Lehto
Finland/Materials, Construction & Infrastructure Analyser
MATERIALS, CONSTRUCTION & INFRASTRUCTURE
Lehto (Accumulate) CFO to leave early next year
Guidance upgrade, target price to EUR 10
The facts: Lehto upgraded its guidance for 2016. Sales are estimated to increase
by 20–25% (previously at least 10–15%), while our forecast was 22% (consensus
20%). Lehto estimated that its EBIT will be about 10–11% of sales in 2016
(previously 8–10%). Our forecast was 9.8% (cons. 9.7%). The mid-point of the
guidance range indicates a higher EBIT of 8% compared to our forecast and the
upper end an EBIT that is 15% higher for 2016. The key factors affecting net
sales and operating profit are the recognition based on delivery of developer
contracting housing production, the number of apartments sold, as well as start
and sales of social care and educational premises and other business premises
projects.
Our analysis: Even though part of the guidance upgrade results from a more
specific completion schedule, solid sales and the start of new projects also
support the outlook for 2017. Therefore, we are raising our forecast for the EBIT
margin in 2017 to 10%. We will also include in our forecasts the recently reported
acquisition in building renovation (Wareco, annual sales EUR 29m), a module
construction project worth EUR 25m for the Pyhäjoki nuclear power plant site and
agreements on the construction of more than 200 rental apartments. We upgrade
our EBIT forecast by 8% for 2016, 13% for 2017 and 11% for 2018. Lehto will
issue a more limited business review for Q3 on 17 November compared to a half
year financial report.
Conclusion & Action: We are raising our target price for Lehto Group to EUR 10
(from EUR 9) while maintaining the Accumulate recommendation after the
company upgraded its 2016 guidance a week before the Q3 revision. We are
raising forecasts for upcoming years as a result of good sales and the recently
reported acquisition and new orders. The target price is based on forecasts for
2018 and EV/EBIT valuation at 11. Lehto benefits from a solid demand and the
company is excellently positioned in the growing sub-segments of the industry.
On the basis of the forecasts for 2017, Lehto’s EV/EBIT valuation is at the peer
group level (11) at the current share price without a premium of a good growth
profile.
Analyst(s):
Matias Rautionmaa, OP Corporate Bank
+358 10 252 4408
Reuters/Bloomberg LEHTO.HE/LEHTO FH
Market capitalisation (EURm) 524
Current N° of shares (m) 58
Free float 28%
Daily avg. no. trad. sh. 12 mth 104
Daily avg. trad. vol. 12 mth (m) 1,558
Price high 12 mth (EUR) 9.65
Price low 12 mth (EUR) 5.70
Abs. perf. 1 mth 0.33%
Abs. perf. 3 mth 25.91%
Abs. perf. 12 mth
Key financials (EUR) 12/15 12/16e 12/17e
Sales (m) 276 336 413
EBITDA (m) 29 35 41
EBITDA margin 10.4% 10.4% 10.0%
EBIT (m) 27 33 39
EBIT margin 9.9% 9.8% 9.4%
Net Profit (adj.)(m) 21 26 30
ROCE 108.3% 52.3% 41.2%
Net debt/(cash) (m) (8) (54) (51)
Net Debt/Equity -0.2 -0.5 -0.4
Debt/EBITDA -0.3 -1.6 -1.2
Int. cover(EBITDA/Fin. int) high high high
EV/Sales 1.4 1.1
EV/EBITDA 13.1 11.3
EV/EBITDA (adj.) 13.1 11.3
EV/EBIT 14.0 12.0
P/E (adj.) 20.4 17.3
P/BV 4.8 4.1
OpFCF yield 0.7% 1.3%
Dividend yield 1.5% 2.0% 2.3%
EPS (adj.) 0.36 0.44 0.52
BVPS 0.57 1.86 2.21
DPS 0.14 0.18 0.21
5.5
6.0
6.5
7.0
7.5
8.0
8.5
9.0
9.5
10.0
Mar 16 Apr 16 May 16 Jun 16 Jul 16 Aug 16 Sep 16 Oct 16 Nov 16
vvdsvdvsdy
LEHTO OMXH (Rebased)Source: Factset
Shareholders: Lehto Invest Oy 37%; Myllymäki Asko
11%; Kinnunen Mikko 4%;
Accumulat
e8.9
9 closing price as of 11/11/2016 10.0
0 From Target Price EUR 9.00
Recommendation unchanged
Target price: EUR
Share price: EUR

Page 37 of 60
Produced & Distributed by the Members of ESN (see last page of this report)
Sacyr
Spain/Materials, Construction & Infrastructure Analyser
MATERIALS, CONSTRUCTION & INFRASTRUCTURE
Sacyr (Buy) Guidance upgrade, target price to EUR 10
Meeting held with the company
The facts: Last Friday we held a meeting with the company and clients
Our analysis: From the meeting we highlight the following aspects mentioned:
Repsol: The intention is to continue reducing the Repsol risk, thus the Company
is studying various structures. 16% of the stake held in Repsol (8.4%) has no risk
trading under EUR10.7/share and a rise above EUR15.6/share book value is
guaranteed. The current finance ends in 2018.
Equity concessions: The corresponding contribution to 2016 has taken place
and for 2017 the Company estimates investing EUR80-90m. To date the policy
has been to rotate assets (21 assets in 5 years) and releveraging.
Itínere. The sales process continues and offers are expected at the end of the
year. The book value amounts to EUR240m. The destination would be to reduce
corporate debt (EUR260m, EUR289m convertibles) and contribute equity to
concessions.
Construction: Recovery in Somague not foreseen, but Sacyr is positive
regarding the rest of the construction activity once restructured. In addition, is the
fact that 42% of the portfolio proceeds from new concessions awarded. The
Employment Reduction Schemes amount to EUR25m in Spain and EUR10m in
Somague.
Pedemontana. Finance expected to be completed in 1Q’17. The motor way is
under construction (EUR500m executed) and financed with subsidies (EUR614m)
and equity contributed by partners (EUR100m).
US: Sacyr is the preferred bidder for the construction of two waste treatment
plants and the contract is expected to be signed in 1Q’17. Another contract is also
under negotiations. At the moment, Sacyr is not present in construction or
concessions in the US.
Services: Favourable outlook, especially in Industrials.
Conclusion: Sacyr’s operating trend continues positive (despite construction)
which we value positively. However, our doubts are on financing the equity to be
contributed to concessions that up to year 2020 amounts to over EUR500m. The
sale of Itinere is a revenues source to consider, but not enough, considering the
expected reduction in corporate debt. We maintain our positive outlook for the
meantime.
Analyst(s):
Rafael Fernández de Heredia, GVC Gaesco Beka
+34 91 436 78 08
Buy
1.97
closing price as of 11/11/2016
2.02
Target Price unchanged
Recommendation unchanged
Target price: EUR
Share price: EUR
Reuters/Bloomberg SCYR.MC/SCYR SM
Market capitalisation (EURm) 1,017
Current N° of shares (m) 517
Free float 74%
Daily avg. no. trad. sh. 12 mth 5,396
Daily avg. trad. vol. 12 mth (m) 8,432
Price high 12 mth (EUR) 2.41
Price low 12 mth (EUR) 1.29
Abs. perf. 1 mth 0.00%
Abs. perf. 3 mth 21.52%
Abs. perf. 12 mth -18.63%
Key financials (EUR) 12/15 12/16e 12/17e
Sales (m) 2,949 2,973 3,129
EBITDA (m) 318 344 389
EBITDA margin 10.8% 11.6% 12.4%
EBIT (m) 148 230 261
EBIT margin 5.0% 7.7% 8.3%
Net Profit (adj.)(m) (227) 118 146
ROCE 5.5% 11.1% 11.1%
Net debt/(cash) (m) 4,180 4,019 4,048
Net Debt/Equity 2.2 2.0 1.9
Debt/EBITDA 13.1 11.7 10.4
Int. cover(EBITDA/Fin. int) 1.3 1.5 1.7
EV/Sales 1.3 1.3 1.2
EV/EBITDA 12.3 11.2 10.0
EV/EBITDA (adj.) 12.3 11.2 10.0
EV/EBIT 26.4 16.7 14.9
P/E (adj.) nm 8.6 7.0
P/BV 0.6 0.6 0.5
OpFCF yield 3.1% 7.6% 14.6%
Dividend yield 2.5% 2.6% 2.7%
EPS (adj.) (0.44) 0.23 0.28
BVPS 3.20 3.38 3.61
DPS 0.05 0.05 0.05
1.2
1.4
1.6
1.8
2.0
2.2
2.4
2.6
Oct 15 Nov 15 Dec 15 Jan 16 Feb 16 Mar 16 Apr 16 May 16 Jun 16 Jul 16 Aug 16 Sep 16 Oct 16 Nov 16
vvdsvdvsdy
SACYR Stoxx Construction & Materials (Rebased)Source: Factset
Shareholders: Grupo Carceller 13%; Jose Manuel
Loureda 8%; Manuel Manrique 5%;

Page 38 of 60
Produced & Distributed by the Members of ESN (see last page of this report)
SIAS
Italy/Materials, Construction & Infrastructure Analyser
MATERIALS, CONSTRUCTION & INFRASTRUCTURE
SIAS (Buy) Meeting held with the company
Q3 results good and better than expected
The facts: Sias published its third quarter results on Friday before market
closing.
Our analysis: the company’s results were sizeably better than expected because
of much higher than expected margins.
Q3 15 Q3 16 y/y Q3 16e 9M 15 9M 16 y/y
Revenues 310.2 311.8 0.5% 310.0 828.5 829.8 0.2%
o/w motorways 284.2 292.7 3.0% 282.0 744.3 770.0 3.5%
EBITDA 198.5 209.2 5.4% 196.4 510.8 523.7 2.5%
EBITDA % 64.0% 67.1%
63.4% 61.7% 63.1%
Interim dividend at EUR 0.14/sh- the board approved the distribution of an interim
dividend of EUR 0.14/sh -.
Conclusion & Action: the company’s results were good and better than
expected. Buy confirmed
Analyst(s):
Francesco Sala, Banca Akros
+39 02 4344 4240
Buy
7.99
closing price as of 11/11/2016
11.50
Target Price unchanged
Recommendation unchanged
Target price: EUR
Share price: EUR
Reuters/Bloomberg SIS.MI/SIS IM
Market capitalisation (EURm) 1,818
Current N° of shares (m) 228
Free float 18%
Daily avg. no. trad. sh. 12 mth 141
Daily avg. trad. vol. 12 mth (m) 882
Price high 12 mth (EUR) 10.32
Price low 12 mth (EUR) 7.51
Abs. perf. 1 mth -3.62%
Abs. perf. 3 mth -8.06%
Abs. perf. 12 mth -22.80%
Key financials (EUR) 12/15 12/16e 12/17e
Sales (m) 1,088 1,090 1,201
EBITDA (m) 652 642 713
EBITDA margin 59.9% 58.9% 59.3%
EBIT (m) 357 345 445
EBIT margin 32.8% 31.7% 37.0%
Net Profit (adj.)(m) 161 158 215
ROCE 5.3% 5.0% 6.4%
Net debt/(cash) (m) 1,575 1,591 1,158
Net Debt/Equity 0.8 0.7 0.5
Debt/EBITDA 2.4 2.5 1.6
Int. cover(EBITDA/Fin. int) 8.8 10.1 11.6
EV/Sales 3.0 2.7 2.1
EV/EBITDA 5.0 4.5 3.5
EV/EBITDA (adj.) 5.0 4.5 3.5
EV/EBIT 9.1 8.4 5.6
P/E (adj.) 13.9 11.5 8.5
P/BV 1.3 1.0 0.9
OpFCF yield 0.6% 3.6% 27.3%
Dividend yield 4.0% 4.3% 4.6%
EPS (adj.) 0.71 0.69 0.94
BVPS 7.71 8.04 8.67
DPS 0.32 0.34 0.37
7.5
8.0
8.5
9.0
9.5
10.0
10.5
11.0
ott 15 nov 15 dic 15 gen 16 feb 16 mar 16 apr 16 mag 16 giu 16 lug 16 ago 16 set 16 ott 16 nov 16
vvdsvdvsdy
SIAS Stoxx Construction & Materials (Rebased)Source: Factset
Shareholders: Gavio Group 73%; Lazard AM 5%;
Generali Group 4%;

Page 39 of 60
Produced & Distributed by the Members of ESN (see last page of this report)
Trevi
Italy/Materials, Construction & Infrastructure Analyser
MATERIALS, CONSTRUCTION & INFRASTRUCTURE
Trevi (Accumulate) Q3 results good and better than expected
Oil & gas division expected to hit Q3 results
The facts: Trevi is publishing its third quarter results on November 14th
.-
Our analysis: we summarize our preview in the following table:
Q3 15 Q3 16e Y/Y 9M 15 9M 16e Y/Y
Revenues 355.2 276.6 -22.1% 956.3 795.9 -16.8%
Value of production 363.5 295.6
991.0 853.5
EBITDA 32.8 30.3 -7.9% -15.9 92.6 nm
EBITDA margin 9.2% 10.9%
-1.7% 11.6%
EBIT 15.9 13.0
-88.6 38.6 nm
EBIT margin 4.5% 4.7%
-9.3% 4.8%
EBT 0.0 8.0 nm -124.4 2.3 nm
Net profit -3.3 6.1 nm -131.4 -17.1 nm
Source: Company data, Banca Akros estimates
We expect the company’s results to be negatively affected by the performance og
the oil&gas division with revenues down almost 65% y/y in Q3.
Conclusion & Action: the company has been hit by the plunge in oil prices; the
visibility on the oil & gas sector remains low. However the present stock price
barely discounts any recovery in this division.
Analyst(s):
Francesco Sala, Banca Akros
+39 02 4344 4240
Accumulate
1.38
closing price as of 11/11/2016
2.00
Target Price unchanged
Recommendation unchanged
Target price: EUR
Share price: EUR
Reuters/Bloomberg TFI.MI/TFI IM
Market capitalisation (EURm) 227
Current N° of shares (m) 165
Free float 50%
Daily avg. no. trad. sh. 12 mth 1,008
Daily avg. trad. vol. 12 mth (m) 393
Price high 12 mth (EUR) 1.83
Price low 12 mth (EUR) 1.06
Abs. perf. 1 mth 16.10%
Abs. perf. 3 mth 12.87%
Abs. perf. 12 mth 11.95%
Key financials (EUR) 12/15 12/16e 12/17e
Sales (m) 1,342 1,136 1,485
EBITDA (m) 9 112 136
EBITDA margin 0.7% 9.8% 9.2%
EBIT (m) (88) 38 63
EBIT margin nm 3.3% 4.2%
Net Profit (adj.)(m) (115) (6) 23
ROCE -6.4% 2.7% 4.7%
Net debt/(cash) (m) 419 439 379
Net Debt/Equity 0.7 0.8 0.7
Debt/EBITDA 46.9 3.9 2.8
Int. cover(EBITDA/Fin. int) 0.2 2.8 5.7
EV/Sales 0.6 0.7 0.5
EV/EBITDA 90.3 6.6 5.1
EV/EBITDA (adj.) 90.3 6.6 5.1
EV/EBIT nm 19.7 11.1
P/E (adj.) nm nm 9.9
P/BV 0.5 0.4 0.4
OpFCF yield 17.8% 0.5% 26.6%
Dividend yield 0.0% 0.0% 0.0%
EPS (adj.) (0.70) (0.04) 0.14
BVPS 3.43 3.26 3.40
DPS 0.00 0.00 0.00
0.6
0.8
1.0
1.2
1.4
1.6
1.8
2.0
ott 15 nov 15 dic 15 gen 16 feb 16 mar 16 apr 16 mag 16 giu 16 lug 16 ago 16 set 16 ott 16 nov 16
vvdsvdvsdy
TREVI FTSE Italy All Share (Rebased)Source: Factset
Shareholders: Trevi family 33%; FSI 17%;
Page 40 of 60
Produced & Distributed by the Members of ESN (see last page of this report)
Spanish Media
Analyser
MEDIA
Oil & gas division expected to hit Q3 results SPAIN: The EU endorses the RTVE finance model
270
280
290
300
310
320
330
340
350
Oct 15 Nov 15 Dec 15 Jan 16 Feb 16 Mar 16 Apr 16 May 16 Jun 16 Jul 16 Aug 16 Sep 16 Oct 16 Nov 16
vvdsvdvsdy
The fats: The EU’ Court of Justice found against the appeal presented by
Canal+DTS (2014) which questions RTVE’s financial system.
Our analysis: With this sentence, and for the 3rd
time, finds in favour of
RTVE’s financial system in which advertising was eliminated from the public TV
chain in exchange for FTA, pay TV and telco groups contributing a fee. In
addition, the EU stated that if said contributions did not suffice to cover RTVE’s
costs it is the State that should cover the difference.
We recall that in 2010 the financial model for RTVE was approved, in which the
government set the rates for telco/audio-visual operators (3% revenues for FTA
TV providers, 1.5% pay-TV and 0.9% gross operating revenues for telco
operators) to finance the public chain’s activity and thus eliminating advertising.
This model was chosen, and leaving aside (for the moment) a possible fee on
behalf of citizens, as Spain is one of the few countries in the EU that does not
do so.
Consequently, RTBE cannot broadcast publicity except for self-
promotion, institutional communications, electoral campaigns, social
character campaigns, and for example sponsors for sports events, but
cannot charge a fee. In addition the possibility of RTVE broadcasting a pay TV
theme channel has been eliminated.
Conclusion: Positive news continues for free-to-air operators (A3M/MSE).
Although the CNMC urged a change in the finance model due to the low
predictability of revenues, the entity used obsolete 2014 data when the deficit
was much higher.
In our opinion, the problem of refinancing RTVE is not the revenues but the
costs.
In addition, with the new Single Digital Market, the OTTS acquire the same
obligations as are audiovisual groups and thus RTVE would receive additional
revenues.
---------- Stoxx Media,
DJ Stoxx TMI rebased on sector
Analyst(s):
Eduardo Garcia Arguelles, GVC Gaesco Beka
+34 914 367 810

Page 41 of 60
Produced & Distributed by the Members of ESN (see last page of this report)
Lagardère
France/Media Analyser
MEDIA
Lagardère (Accumulate) SPAIN: The EU endorses the RTVE finance model
Post Q3 revenues: confirmation of FY guidance
The facts: No major information was disclosed at the Q3 conference call on
Thursday.
Our analysis: 1) Publishing: the Q3 figure (+10.9%) should not be extrapolated
as it was helped by the renewal of school programmes in France and the success
of the new Harry Potter in the UK; Q4 will face high comps (Q4-15: +9.2%),
chiefly thanks to Astérix; 2) Active: Q4 looks to be worse than Q3 (-3.1% over 9M)
in publicity; the group thus reiterated its guidance of -4-5% y-o-y; 3) Travel Retail:
the pace of growth continues to slow but remained high in Q3 (+5.7%), despite
the challenging environment in France and the deterioration of the Chinese
travellers mix, which was more than offset by the development of networks and
new services (food service); Q4 should carry on the Q3 trend; 4) Distribution: the
Belgian and Canadian subsidiaries are expected to be sold by year-end for an
estimated EUR70m; the last country, Hungary (revenues of roughly EUR150m) is
more difficult to sell; 4) guidance of EBIT growth on a comparable basis ‘slightly
higher than 10%’ was confirmed; we maintain our forecast of +13%
(EUR403mE).
Conclusion & Action: We expect the group to publish FY results well within
guidance. IV adjusted from EUR23 to EUR24 to take into account the solid trend
in Travel Retail (30% of operating assets).
Analyst(s):
Eric Ravary, CM - CIC Market Solutions
+33 1 53 48 80 71
Accumulate
23.13
closing price as of 11/11/2016
24.00
Target Price unchanged
Recommendation unchanged
Target price: EUR
Share price: EUR
Reuters/Bloomberg LAGA.PA/MMB FP
Market capitalisation (EURm) 3,102
Current N° of shares (m) 134
Free float 87%
Daily avg. no. trad. sh. 12 mth 332
Daily avg. trad. vol. 12 mth (m) 7,610
Price high 12 mth (EUR) 28.16
Price low 12 mth (EUR) 18.48
Abs. perf. 1 mth 4.28%
Abs. perf. 3 mth 2.60%
Abs. perf. 12 mth -17.11%
Key financials (EUR) 12/15 12/16e 12/17e
Sales (m) 7,193 7,373 7,121
EBITDA (m) 501 515 575
EBITDA margin 7.0% 7.0% 8.1%
EBIT (m) 165 303 370
EBIT margin 2.3% 4.1% 5.2%
Net Profit (adj.)(m) 183 179 226
ROCE 4.5% 6.4% 6.6%
Net debt/(cash) (m) 1,551 1,503 1,500
Net Debt/Equity 0.7 0.7 0.7
Debt/EBITDA 3.1 2.9 2.6
Int. cover(EBITDA/Fin. int) 7.6 8.0 8.7
EV/Sales 0.7 0.6 0.6
EV/EBITDA 9.9 8.5 7.6
EV/EBITDA (adj.) 8.0 7.1 7.0
EV/EBIT 30.0 14.5 11.9
P/E (adj.) 21.3 18.2 14.5
P/BV 1.8 1.5 1.5
OpFCF yield 9.3% 2.9% 5.9%
Dividend yield 5.6% 5.6% 5.6%
EPS (adj.) 1.29 1.27 1.60
BVPS 14.87 14.94 15.38
DPS 1.30 1.30 1.30
18
19
20
21
22
23
24
25
26
27
28
29
Oct 15 Nov 15 Dec 15 Jan 16 Feb 16 Mar 16 Apr 16 May 16 Jun 16 Jul 16 Aug 16 Sep 16 Oct 16 Nov 16
vvdsvdvsdy
LAGARDERE Stoxx Media (Rebased)Source: Factset
Shareholders: LCM 8%; Employees' Mutual Funds 3%;
Treasury stock 1.77%;

Page 42 of 60
Produced & Distributed by the Members of ESN (see last page of this report)
Technip
France/Oil Services Analyser
OIL SERVICES
Technip (Buy) Post Q3 revenues: confirmation of FY guidance
Confirmation of the acceleration in draft-design studies
The facts: In a meeting with sell-side analysts as part of the roadshow linked to
their merger project, the CEOs of Technip and FMC, Mr Pilenko and Mr
Pferdehirt, reviewed the progress of the project and trends in market conditions.
Our analysis: While Technip and FMC have received most of the necessary
antitrust approvals – the only missing ones are the EU and Brazil, which last year
approved the creation of the Forsys joint venture (Brazil’s authorisation is not a
blocking point) – the two MDs have highlighted the acceleration in clients’
interests to develop integrated projects. The Forsys joint venture won three FEED
contracts (Front end engineering) during its eight months of existence, then
thirteen during the next eight, and four in the last four weeks. A FEED contract
was converted into an integrated contract. Furthermore, Technip and FMC are
well positioned for the ambitious Mad Dog 2 project (BP). Both responded to the
call for tender separately (fourth bid for FMC which won the first three times, third
for Technip). Moreover, out of the 20 largest market projects, none was in the call
for tender phase one year ago. There are currently eight, and some are in the
tender response process.
Clients are changing their stance and are switching from specific designs for each
operator to Vendor Based Solutions, which factor in their many experiences in
field development. Operators favour rapid payback developments:
Interconnections between fields that have been recently discovered or not with
existing production infrastructures. These are not necessarily small projects; for
example, Trestakk, awarded by STL to Technip and FMC last week: over
USD600m of which ~USD200m for TECFMC. The solidity of the balance sheet is
also an advantage. Technip was selected for a project over two cheaper
competitors.
Conclusion & Action: The reassuring messages continue to support confidence
in the outlook on Technip FMC.
Analyst(s):
Jean-Luc Romain, CM - CIC Market Solutions
+33 1 53 48 80 66
Buy
62.93
closing price as of 11/11/2016
67.00
Target Price unchanged
Recommendation unchanged
Target price: EUR
Share price: EUR
Reuters/Bloomberg TECF.PA/TEC FP
Market capitalisation (EURm) 7,883
Current N° of shares (m) 125
Free float 85%
Daily avg. no. trad. sh. 12 mth 994
Daily avg. trad. vol. 12 mth (m) 59,602
Price high 12 mth (EUR) 64.08
Price low 12 mth (EUR) 36.13
Abs. perf. 1 mth 8.05%
Abs. perf. 3 mth 25.23%
Abs. perf. 12 mth 29.29%
Key financials (EUR) 12/15 12/16e 12/17e
Sales (m) 12,209 11,193 10,368
EBITDA (m) 627 1,191 1,205
EBITDA margin 5.1% 10.6% 11.6%
EBIT (m) 331 900 921
EBIT margin 2.7% 8.0% 8.9%
Net Profit (adj.)(m) 559 565 587
ROCE 2.5% 14.9% 15.3%
Net debt/(cash) (m) (24) (356) (697)
Net Debt/Equity 0.0 -0.1 -0.1
Debt/EBITDA 0.0 -0.3 -0.6
Int. cover(EBITDA/Fin. int) 7.4 14.1 16.7
EV/Sales 0.4 0.6 0.7
EV/EBITDA 8.6 6.1 5.7
EV/EBITDA (adj.) 8.6 6.1 5.7
EV/EBIT 16.3 8.1 7.5
P/E (adj.) 10.2 14.0 13.4
P/BV 1.4 1.8 1.7
OpFCF yield 9.9% 7.5% 7.8%
Dividend yield 3.3% 3.5% 3.7%
EPS (adj.) 4.46 4.51 4.69
BVPS 33.20 35.60 38.09
DPS 2.10 2.21 2.32
35
40
45
50
55
60
65
Oct 15 Nov 15 Dec 15 Jan 16 Feb 16 Mar 16 Apr 16 May 16 Jun 16 Jul 16 Aug 16 Sep 16 Oct 16 Nov 16
vvdsvdvsdy
TECHNIP CAC 40 (Rebased)Source: Factset
Shareholders: Oppenheimer Funds 5%; ING Group NV
5%; Employees 1.90%; Treasury stock
3%;

Page 43 of 60
Produced & Distributed by the Members of ESN (see last page of this report)
Salvatore Ferragamo
Italy/Personal Goods Analyser
PERSONAL GOODS
Salvatore Ferragamo (Accumulate) Confirmation of the acceleration in draft-design studies
Ferragamo: 9M 16 results preview
The facts: Ferragamo is due to publish its 9M 16 results on Monday November
14th
after market closure. A conf. call will follow @ 6:00 pm CET (ITALY: +39 023
0350 9005; UK: +44 (0)207 1620 177; USA: +1 646 934 6795).
Our analysis: We remind readers that the conference call will be held by Mr.
Greco and by Mr. Eraldo Poletto, recently appointed company’s CEO.
According to our estimates, there should have been an improvement in the top
line in Q3 16 (+1% increase). We forecasts profitability improvements thanks to
gross profit increase, and operating costs containment (excluding approx. EUR 3
/ 4 m one-off, we estimate EBITDA margin up 80 bps in 9M 16E Y/Y).
Ferragamo: 9M 16 results preview
EUR m Q3 15 Q3 16E Y/Y Chg. 9M 15 9M 16E Y/Y Chg.
Europe 86.2 78.0 -9.4% 281.7 267.0 -5.2%
North America 70.2 73.5 4.6% 234.7 241.0 2.7%
Japan 31.8 27.1 -14.7% 94.3 90.7 -3.8%
Asia Pacific 95.3 105.3 10.5% 361.0 361.0 0.0%
Latam 15.1 17.6 16.2% 49.4 52.1 5.5%
Total revenues 298.7 301.6 1.0% 1,021.0 1,011.7 -0.9%
Wholesale 98.9 86.9 -12.1% 371.5 355.8 -4.2%
Retail 193.6 208.4 7.7% 631.7 638.1 1.0%
Licences 3.0 3.0 0.5% 8.2 8.2 -0.5%
Rental Income 3.2 3.2 0.2% 9.7 9.7 0.2%
Total revenues 298.7 301.6 1.0% 1,021.0 1,011.7 -0.9%
Gross Profit 196.9 202.3 2.8% 672.1 677.9 0.9%
% on sales 65.9% 67.1%
65.8% 67.0%
EBITDA 53.0 54.1 2.1% 217.6 220.2 1.2%
% on sales 17.7% 17.9%
21.3% 21.8%
Operating profit 38.1 38.1 0.1% 173.6 173.6 0.0%
% on sales 12.7% 12.6%
17.0% 17.2%
Profit/(loss) - group 24.1 24.2 0.4% 112.3 114.5 2.0%
Source: Company data, Banca Akros estimates
Conclusion & Action: All in all, excluding the one-off costs, we expect a decent
improvement in EBITDA margin. We welcome the appointment of Mr. Poletto as
a new CEO and we confirm our Accumulate.
Analyst(s):
Giada Cabrino, CIIA, Banca Akros
+39 02 4344 4092
Accumulate
21.99
closing price as of 11/11/2016
22.60
Target Price unchanged
Recommendation unchanged
Target price: EUR
Share price: EUR
Reuters/Bloomberg SFER.MI/SFER IM
Market capitalisation (EURm) 3,712
Current N° of shares (m) 169
Free float 25%
Daily avg. no. trad. sh. 12 mth 717
Daily avg. trad. vol. 12 mth (m) 9,521
Price high 12 mth (EUR) 23.88
Price low 12 mth (EUR) 17.53
Abs. perf. 1 mth -3.00%
Abs. perf. 3 mth 5.87%
Abs. perf. 12 mth -10.83%
Key financials (EUR) 12/15 12/16e 12/17e
Sales (m) 1,430 1,449 1,514
EBITDA (m) 324 334 367
EBITDA margin 22.7% 23.1% 24.2%
EBIT (m) 265 269 299
EBIT margin 18.5% 18.6% 19.7%
Net Profit (adj.)(m) 173 173 200
ROCE 30.5% 31.2% 31.1%
Net debt/(cash) (m) 10 (46) (130)
Net Debt/Equity 0.0 -0.1 -0.2
Debt/EBITDA 0.0 -0.1 -0.4
Int. cover(EBITDA/Fin. int) 24.5 27.8 52.4
EV/Sales 2.8 2.7 2.5
EV/EBITDA 12.2 11.7 10.4
EV/EBITDA (adj.) 12.2 11.7 10.4
EV/EBIT 15.0 14.6 12.8
P/E (adj.) 21.2 21.4 18.5
P/BV 6.5 5.6 4.8
OpFCF yield 3.4% 3.6% 4.6%
Dividend yield 2.1% 2.3% 2.6%
EPS (adj.) 1.02 1.03 1.19
BVPS 3.34 3.91 4.59
DPS 0.46 0.51 0.58
17
18
19
20
21
22
23
24
ott 15 nov 15 dic 15 gen 16 feb 16 mar 16 apr 16 mag 16 giu 16 lug 16 ago 16 set 16 ott 16 nov 16
vvdsvdvsdy
SALVATORE FERRAGAMO Stoxx Personal Goods (Rebased)Source: Factset
Shareholders: Ferragamo Finanziaria 58%; Ferragamo
Family 11%; Majestic Honour - Peter
Woo 6%;
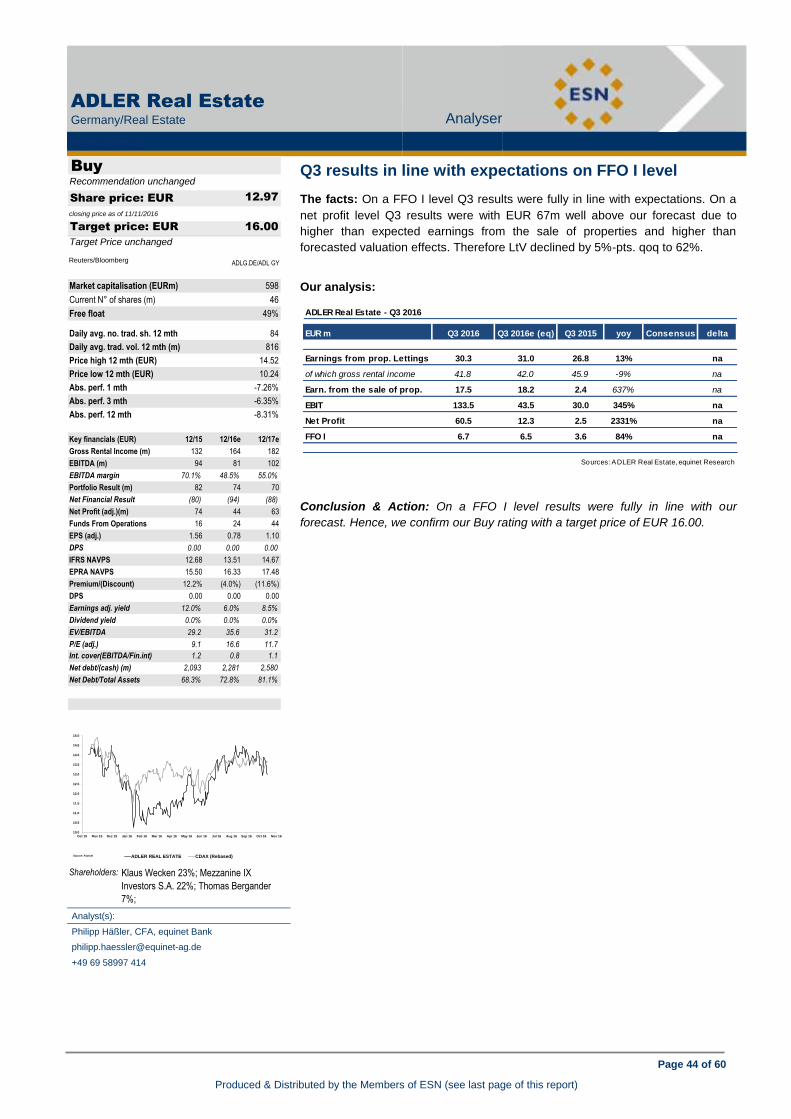
Page 44 of 60
Produced & Distributed by the Members of ESN (see last page of this report)
ADLER Real Estate
Germany/Real Estate Analyser
REAL ESTATE
ADLER Real Estate (Buy) Ferragamo: 9M 16 results preview
Q3 results in line with expectations on FFO I level
The facts: On a FFO I level Q3 results were fully in line with expectations. On a
net profit level Q3 results were with EUR 67m well above our forecast due to
higher than expected earnings from the sale of properties and higher than
forecasted valuation effects. Therefore LtV declined by 5%-pts. qoq to 62%.
Our analysis:
Conclusion & Action: On a FFO I level results were fully in line with our
forecast. Hence, we confirm our Buy rating with a target price of EUR 16.00.
Analyst(s):
Philipp Häßler, CFA, equinet Bank
+49 69 58997 414
Buy
12.97
closing price as of 11/11/2016
16.00
Target Price unchanged
Recommendation unchanged
Target price: EUR
Share price: EUR
Reuters/Bloomberg ADLG.DE/ADL GY
Market capitalisation (EURm) 598
Current N° of shares (m) 46
Free float 49%
Daily avg. no. trad. sh. 12 mth 84
Daily avg. trad. vol. 12 mth (m) 816
Price high 12 mth (EUR) 14.52
Price low 12 mth (EUR) 10.24
Abs. perf. 1 mth -7.26%
Abs. perf. 3 mth -6.35%
Abs. perf. 12 mth -8.31%
Key financials (EUR) 12/15 12/16e 12/17e
Gross Rental Income (m) 132 164 182
EBITDA (m) 94 81 102
EBITDA margin 70.1% 48.5% 55.0%
Portfolio Result (m) 82 74 70
Net Financial Result (80) (94) (88)
Net Profit (adj.)(m) 74 44 63
Funds From Operations 16 24 44
EPS (adj.) 1.56 0.78 1.10
DPS 0.00 0.00 0.00
IFRS NAVPS 12.68 13.51 14.67
EPRA NAVPS 15.50 16.33 17.48
Premium/(Discount) 12.2% (4.0%) (11.6%)
DPS 0.00 0.00 0.00
Earnings adj. yield 12.0% 6.0% 8.5%
Dividend yield 0.0% 0.0% 0.0%
EV/EBITDA 29.2 35.6 31.2
P/E (adj.) 9.1 16.6 11.7
Int. cover(EBITDA/Fin.int) 1.2 0.8 1.1
Net debt/(cash) (m) 2,093 2,281 2,580
Net Debt/Total Assets 68.3% 72.8% 81.1%
10.0
10.5
11.0
11.5
12.0
12.5
13.0
13.5
14.0
14.5
15.0
Oct 15 Nov 15 Dec 15 Jan 16 Feb 16 Mar 16 Apr 16 May 16 Jun 16 Jul 16 Aug 16 Sep 16 Oct 16 Nov 16
vvdsvdvsdy
ADLER REAL ESTATE CDAX (Rebased)Source: Factset
Shareholders: Klaus Wecken 23%; Mezzanine IX
Investors S.A. 22%; Thomas Bergander
7%;
ADLER Real Estate - Q3 2016
EUR m Q3 2016 Q3 2016e (eq) Q3 2015 yoy Consensus delta
Earnings from prop. Lettings 30.3 31.0 26.8 13% na
of which gross rental income 41.8 42.0 45.9 -9% na
Earn. from the sale of prop. 17.5 18.2 2.4 637% na
EBIT 133.5 43.5 30.0 345% na
Net Profit 60.5 12.3 2.5 2331% na
FFO I 6.7 6.5 3.6 84% na
Sources: ADLER Real Estate, equinet Research

Page 45 of 60
Produced & Distributed by the Members of ESN (see last page of this report)
Hispania Activos Inmobiliarios
Spain/Real Estate Analyser
REAL ESTATE
Hispania Activos Inmobiliarios (Buy) Q3 results in line with expectations on FFO I level
9m’16 results: good operating momentum
The facts: Hispania released 9m’16 results. EPRA NAV grew 4.7%
(EUR12.24/sh vs. EUR11.69 Dec’15). All P&L lines grew substantially due to the
acquisitions realised and organic growth.
Our analysis Sales reached EUR100m, NOI EUR77m and net profit EUR136m.
The annualised NOI increased to EUR101m (excluding hotels under management
and repositioned assets), above our estimated EUR97.7m. The majority of the
activity proceeds from hotels where the operating lines have evolved very
positively. In hotels with fixed and variable yields, revpar increases 18.5% and in
Canary Islands 20.5%. EBITDAR in Bay and Atlantis reached 21%.
In offices occupancy continued to improve (84% vs. 77% Dec’15) and the
average rent 7%. Residentials: the new rents on refurbished assets are higher
than before changes: +74% in Isla del Cielo and +31% in Sanchinarro, the
average rent increases 7.9% vs. 2015 and occupancy drops from 86% to 82%
9m’16.
Net debt rises to EUR281m which implies net LTV 16%.
Operating CF increases to EUR37.4m vs. EUR4.6m 1H’16. The adjusted FFO
comes to EUR32.6m vs. EUR20.8m 1H’16.
GAV increased 18.1% (EUR1,684m vs. EUR1,425m Dec’15) due to the new
investments +8%), capex (2.3%) and revaluation of assets (8%).
Conclusion: Good results, leaning mainly on organic growth which overflows to
all products. Positive outlook maintained.
Analyst(s):
Rafael Fernández de Heredia, GVC Gaesco Beka
+34 91 436 78 08
Buy
10.20
closing price as of 11/11/2016
14.08
Target Price unchanged
Recommendation unchanged
Target price: EUR
Share price: EUR
Reuters/Bloomberg HIS.MC/HIS SM
Market capitalisation (EURm) 1,105
Current N° of shares (m) 108
Free float 42%
Daily avg. no. trad. sh. 12 mth 240
Daily avg. trad. vol. 12 mth (m) 2,056
Price high 12 mth (EUR) 13.02
Price low 12 mth (EUR) 9.99
Abs. perf. 1 mth -10.99%
Abs. perf. 3 mth -14.57%
Abs. perf. 12 mth -18.40%
Key financials (EUR) 12/15 12/16e 12/17e
Gross Rental Income (m) 38 117 133
EBITDA (m) 10 78 95
EBITDA margin 25.9% 66.6% 71.3%
Portfolio Result (m) 78 221 238
Net Financial Result (4) (16) (17)
Net Profit (adj.)(m) (12) 62 78
Funds From Operations 7 62 78
EPS (adj.) -0.17 0.65 0.72
DPS 0.00 0.37 0.41
IFRS NAVPS 12.33 14.22 16.53
EPRA NAVPS 11.69 12.50 15.07
Premium/(Discount) (1.0%) (28.3%) (38.3%)
DPS 0.00 0.37 0.41
Earnings adj. yield nm 6.4% 7.1%
Dividend yield 0.0% 3.6% 4.0%
EV/EBITDA 142.4 20.0 17.5
P/E (adj.) nm 15.7 14.1
Int. cover(EBITDA/Fin.int) 2.3 4.9 5.7
Net debt/(cash) (m) 339 290 375
Net Debt/Total Assets 19.7% 13.5% 14.9%
9M15 9M16 %
Hotels 7.7 81.7 961.7%
Offices 8.6 13.8 59.9%
Residential 3.3 4.7 42.0%
SALES 19.6 100.1 411.2%
9M15 9M16 %
Hotels 3.5 63.5 1694.7%
Offices 6.7 10.9 62.9%
Residential 2.4 3.1 31.5%
NOI 12.6 77.5 514.5%
ACCOUNT 9M15 9M16 %
Costs -10.8 -15.2 40.6%
EBITDA 1.8 62.3 -
Financial result -1.7 -15.8 843.2%
Other 14.4 111.9 -
Taxes -1.3 -1.9 46.2%
Minoritaries -0.4 -19.7 -
Net Income 12.9 136.7 959.8%
Source: Hispania
9.0
9.5
10.0
10.5
11.0
11.5
12.0
12.5
13.0
13.5
Oct 15 Nov 15 Dec 15 Jan 16 Feb 16 Mar 16 Apr 16 May 16 Jun 16 Jul 16 Aug 16 Sep 16 Oct 16 Nov 16
vvdsvdvsdy
HISPANIA ACTIVOS INMOBILIARIOS IGBM (Rebased)Source: Factset
Shareholders: Soros 17%; Paulson 10%; FMR 10%;
Other 22%;

Page 46 of 60
Produced & Distributed by the Members of ESN (see last page of this report)
Exprivia
Italy/Software & Computer Services Analyser
SOFTWARE & COMPUTER SERVICES
Exprivia (Accumulate) 9m’16 results: good operating momentum
9m 2016 Post: back to growth with ACS, higher debt
The facts: publication of Q3 2016 results.
Our analysis: Q3 results were broadly in line/better than our estimates on
revenues and EBITDA, while the net debt position was higher than expected. The
top-line was back to growth in the quarter thanks to the contribution of ACS
(completed on June 23) which added EUR 2.5m, along with EUR 0.7m to the
EBITDA line. We note that the underlying trend was in any case improving with
around 3% organic revenue decline, vs. -8% in the first half. The results were still
affected by delays in the BPO segment and a decline in the international unit (still
down by above 20% Y/Y in Q3). On the positive, the finance segment was up by
6% in Q3, the industry segment by 4.7%. We note the higher than expected net
debt, increased by EUR 9.6m in the quarter and was due to EUR 12.4m net
investments in the period, partly related to the impact of ACS (c EUR 4/5m) and
partly to seasonal net working capital dynamics, this year not offset by the
utilization of factoring, in our view.
Exprivia 9m 2016 results (EUR m)
Q3 15 Q3 16e Q3 16a Y/Y 9M 15 9M 16a Y/Y
Sales Revenues 31.7 33.5 32.9 3.5% 102.2 98.6 -3.5%
Total Turnover 32.5 34.5 34.1 4.9% 106.1 101.7 -4.1%
EBITDA 3.13 4.00 4.27 36.3% 10.03 8.31 -17.1%
Margin 9.6% 11.6% 12.5% 2.9% 9.5% 8.2% -1.3%
EBIT 2.05 2.70 2.98 45.2% 5.88 4.90 -16.5%
Margin 6.3% 6.9% 8.7% 2.4% 5.5% 4.8% -0.7%
EBT 1.47 2.00 2.27 54.0% 4.07 2.80 -31.1%
Net Income 0.59 1.15 1.37 131% 1.89 2.08 10.6%
Net Debt (Cash) 31.2 33.0 41.0 31.4% 31.2 41.0 31.4%
Source: Company data, BANCA AKROS estimates
Outlook: H2 2016 benefits from the full consolidation of ACS into the group
perimeter; the company said that it now expects for the year a decline in revenues
and stability in margins. We cut our estimates for 2016 by 2.7% and 3.3% on
revenues and EBITDA respectively, while on 2017/18 the cut is by 4/4.5% and
2.5/3%, assuming slower growth but better margins.
M&A. A key point in the investment case is represented by the negotiations with
Italtel for an acquisition, a deal which would radically change the size and scope
of the group. The company has set a new deadline by the end of November.
Conclusion & Action: Neutral set of results, limited estimates revision. We keep
a positive view on the stock.
Analyst(s):
Andrea Devita, CFA, Banca Akros
+39 02 4344 4031
Accumulate
0.64
closing price as of 11/11/2016
0.81
Target Price unchanged
Recommendation unchanged
Target price: EUR
Share price: EUR
Reuters/Bloomberg XPR.MI/XPR IM
Market capitalisation (EURm) 33
Current N° of shares (m) 52
Free float 43%
Daily avg. no. trad. sh. 12 mth 46
Daily avg. trad. vol. 12 mth (m) 8
Price high 12 mth (EUR) 0.83
Price low 12 mth (EUR) 0.61
Abs. perf. 1 mth -2.28%
Abs. perf. 3 mth -1.23%
Abs. perf. 12 mth -23.57%
Key financials (EUR) 12/15 12/16e 12/17e
Sales (m) 145 145 156
EBITDA (m) 15 15 17
EBITDA margin 10.6% 10.1% 11.0%
EBIT (m) 10 9 11
EBIT margin 6.9% 6.3% 7.3%
Net Profit (adj.)(m) 5 3 5
ROCE 5.4% 4.9% 6.1%
Net debt/(cash) (m) 36 36 31
Net Debt/Equity 0.5 0.5 0.4
Debt/EBITDA 2.4 2.4 1.8
Int. cover(EBITDA/Fin. int) 6.6 5.4 7.8
EV/Sales 0.6 0.6 0.5
EV/EBITDA 6.1 5.9 4.8
EV/EBITDA (adj.) 6.1 5.9 4.8
EV/EBIT 9.3 9.5 7.2
P/E (adj.) 8.7 12.2 7.0
P/BV 0.5 0.4 0.4
OpFCF yield -1.3% 8.4% 17.3%
Dividend yield 4.4% 3.3% 2.0%
EPS (adj.) 0.09 0.05 0.09
BVPS 1.43 1.46 1.54
DPS 0.03 0.02 0.01
0.60
0.65
0.70
0.75
0.80
0.85
ott 15 nov 15 dic 15 gen 16 feb 16 mar 16 apr 16 mag 16 giu 16 lug 16 ago 16 set 16 ott 16 nov 16
vvdsvdvsdy
EXPRIVIA FTSE Italy SmallCaps (Rebased)Source: Factset
Shareholders: Abaco Spa 49%; Merula Srl 5%; Data
Management Spa 2%; Own Shares
1.83%;
Page 47 of 60
Produced & Distributed by the Members of ESN (see last page of this report)
TomTom
Netherlands/Software & Computer Services Analyser
SOFTWARE & COMPUTER SERVICES
TomTom (Buy) 9m 2016 Post: back to growth with ACS, higher debt Buy
7.92
closing price as of 11/11/2016
10.00
Target Price unchanged
Recommendation unchanged
Target price: EUR
Share price: EUR
Reuters/Bloomberg TOM2.AS/TOM2 NA
Market capitalisation (EURm) 1,815
Current N° of shares (m) 229
Free float 56%
Daily avg. no. trad. sh. 12 mth 1,598
Daily avg. trad. vol. 12 mth (m) 45,456
Price high 12 mth (EUR) 12.29
Price low 12 mth (EUR) 6.21
Abs. perf. 1 mth -7.41%
Abs. perf. 3 mth -3.06%
Abs. perf. 12 mth -23.16%
Key financials (EUR) 12/15 12/16e 12/17e
Sales (m) 1,007 1,003 1,033
EBITDA (m) 124 138 154
EBITDA margin 12.3% 13.8% 14.9%
EBIT (m) 1 14 27
EBIT margin 0.1% 1.4% 2.6%
Net Profit (adj.)(m) 49 42 52
ROCE 0.0% 1.0% 1.8%
Net debt/(cash) (m) (99) (92) (106)
Net Debt/Equity -0.1 -0.1 -0.1
Debt/EBITDA -0.8 -0.7 -0.7
Int. cover(EBITDA/Fin. int) 133.8 138.2 220.3
EV/Sales 2.6 1.7 1.7
EV/EBITDA 20.8 12.6 11.2
EV/EBITDA (adj.) 20.8 12.6 11.2
EV/EBIT nm nm 63.6
P/E (adj.) nm 43.4 34.8
P/BV 2.7 1.9 1.9
OpFCF yield 0.4% 1.1% 2.1%
Dividend yield 0.0% 1.5% 1.3%
EPS (adj.) 0.21 0.18 0.23
BVPS 4.23 4.17 4.17
DPS 0.00 0.12 0.11
Technology Day feedback – a positive afternoon
The facts: Last Friday, TomTom organised a technology day for some 70
investors, analysts and media. Presentations were given by CEO Goddijn, board
member Alain de Taeye (Maps), Antoine Saucier (Automotive), Willem Strijbosch
(Autonomous driving) and Harold Schmidt (Telematics). As part of his
presentation, CEO Goddijn provided FY20 guidance for Telematics, Licensing
and Automotive combined, stating that revenue of the 3 divisions would grow with
a CAGR of 15%. Other key subjects were the competitive advantage versus Here,
operational leverage and the US OEMs as targets for Automotive.
Our analysis: It is positive that TomTom has provided some guidance beyond
the next year, which is what the company traditionally provides. Having said that,
the 15% CAGR is more or less in line with consensus (we are at 15.9%).
Nevertheless, the guidance does show that (assuming very modest growth for
Licensing and around 10-12% organic growth for Telematics) Automotive revenue
is set to grow substantially. This was reiterated to a large extent by CEO Goddijn
who stated that automotive revenue growth for FY17 and FY18 was “pretty much
in the bag”. All in all, Automotive revenue should therefore increase from EUR
127m in FY16 to around EUR 380m in FY20. Given a gross margin of around
70%, TomTom will see operational leverage kicking in even if more opex will be
added to be able to properly service all the OEMs and Tier1 and even if more
map database costs will be allocated to Automotive (allocation is based on
revenue development as well so if Consumer declines and Automotive grows,
more costs will be allocated to Automotive). So implicitly, the revenue guidance
also provides insight into the question on operational leverage.
With regards to Here and its technology, board member de Taeye explained that
Here still uses batch processing (albeit at a very high frequency) to refresh and
update maps. That is still possible in today’s markets but Here will have to go to
transactional map making (which is TomTom’s methodology) if it wants to
compete in the (semi) autonomous driving markets where updates must be made
available every hour or even faster. De Taeye also indicated that if Here were to
have unlimited funds available, it could replicate TomTom’s processes and
products within a 3 year time frame but that a chance of a failure is also a
possibility. De Taeye admitted that TomTom (TeleAtlas) only got it right the 3rd
time around. TomTom will continue to work on automating its map updating
process and that it expects the effectivity of that process to improve “not by
percentages but by orders of magnitude”. That also bodes well for operational
leverage going forward.
On the subject of winning clients like Ford and GM, Antoine Soucier answered
that the TomTom brand is not as strong in North America as it is in Europe.
During a break he added that TomTom’s Traffic service does not provide the
same strategic advantage in the US as it does in Europe because there are very
viable alternatives in the North American market. However, as dual sourcing is
the standard, he continues to expect that TomTom will eventually win contracts
from both players (Ford and GM are 100% Here clients). It is a “matter of time”.
When questioned about the future of Consumer within TomTom, CEO Goddijn
reiterated that the division remains important. Our take is that any speculation
about an equity carve out and sale is unrealistic.
Conclusion & Action: A positive afternoon with guidance that not only shows
confidence about Automotive and Telematics but also implies operational
leverage. We retain our positive stance but do expect FY17 to finally show the
anticipated operational leverage.
6
7
8
9
10
11
12
13
Oct 15 Nov 15 Dec 15 Jan 16 Feb 16 Mar 16 Apr 16 May 16 Jun 16 Jul 16 Aug 16 Sep 16 Oct 16 Nov 16
vvdsvdvsdy
TOMTOM EuroNext (Rebased)Source: Factset Shareholders: H.Goddijn 11%; C.Goddijn 11%; P.F.
Pauwels 11%; P.Geelen 11%;
Analyst(s):
Martijn den Drijver, NIBC Markets N.V.
+312 0 5508636

Page 48 of 60
Produced & Distributed by the Members of ESN (see last page of this report)
Cellnex Telecom
Spain/Support Services Analyser
SUPPORT SERVICES
Cellnex Telecom (Buy) Technology Day feedback – a positive afternoon
Excessive and unjustified fall
The facts: Cellnex’ shares have fallen 10% in the last week.
Our analysis: Having spoken to the Company, there are no reasons justifying the
negative performance. CLNX accumulates -25.9% YTD.
The main risks in CLNX would be:
Falling market share in DTT technology (78.2% 9m’16, -0.5pp Y/Y)
associated to TV consumption in favour of IPTV (7.1% 9m’16, +0.4pp
Y/Y). This aspect was considered by the Company and is precisely one of the
reasons why CLNX began to diversify towards mobile board band
infrastructures.
Interest rate hikes in Europe. In our opinion, these could begin to rise as
from 2018e, but with limited effects on CLNX’ debt as the majority is at a set
rate (96% thanks to the latest refinancing via bonds issue).
Merger of European operators. In this case, the risk resides in single-
handedly dismantling existing duplicities in infrastructures, not allowing CLNX
to participate and reporting these as integration synergies. In addition, CLNX
will also lose a potential client in each merger as the number of MROs
reduces.
High multiples in its acquisitions policy. Although some of the recent
acquisitions (Shere/Bouygues) the implicit EVEBITDA was around 16x, in our
opinion, it is backed by the high sharing ration, cash transformation, accretive
as from Year 1; strategic importance in portfolios, greater deleveraging
capacity and double digit IRRS (estimating 13-15%).
Conclusion: The risk/yield ratio is very attractive and is a clear opportunity
to buy at current trading levels.
Either way, the falls were general in the sector (as included in the table) since
Donald Trump was elected president of the US. The market discounts a possible
acceleration in interest rate hikes and this fact will affect CLNX’ main US peers:
American Towers/SBA Communications/Crown Castle. In our opinion, an
unjustified contagion effect has ocurred.
Analyst(s):
Eduardo Garcia Arguelles, GVC Gaesco Beka
+34 914 367 810
Buy
12.77
closing price as of 11/11/2016
19.60
Target Price unchanged
Recommendation unchanged
Target price: EUR
Share price: EUR
Reuters/Bloomberg CLNX.MC/CLNX SM
Market capitalisation (EURm) 2,959
Current N° of shares (m) 232
Free float 52%
Daily avg. no. trad. sh. 12 mth 1,165
Daily avg. trad. vol. 12 mth (m) 47,218
Price high 12 mth (EUR) 17.24
Price low 12 mth (EUR) 12.77
Abs. perf. 1 mth -17.08%
Abs. perf. 3 mth -20.56%
Abs. perf. 12 mth -19.81%
Key financials (EUR) 12/15 12/16e 12/17e
Sales (m) 612 717 794
EBITDA (m) 235 304 348
EBITDA margin 38.4% 42.4% 43.8%
EBIT (m) 81 136 175
EBIT margin 13.3% 18.9% 22.1%
Net Profit (adj.)(m) 47 85 118
ROCE 3.5% 4.9% 6.3%
Net debt/(cash) (m) 927 1,363 1,136
Net Debt/Equity 1.7 2.2 1.5
Debt/EBITDA 3.9 4.5 3.3
Int. cover(EBITDA/Fin. int) 8.6 11.8 12.6
EV/Sales 8.0 6.0 5.2
EV/EBITDA 20.9 14.2 11.8
EV/EBITDA (adj.) 20.9 14.2 11.8
EV/EBIT 60.4 31.9 23.3
P/E (adj.) nm 34.6 25.1
P/BV 8.8 5.5 4.5
OpFCF yield 3.9% 6.2% 7.4%
Dividend yield 0.7% 1.4% 1.5%
EPS (adj.) 0.20 0.37 0.51
BVPS 1.96 2.33 2.84
DPS 0.09 0.18 0.19
11
12
13
14
15
16
17
18
Oct 15 Nov 15 Dec 15 Jan 16 Feb 16 Mar 16 Apr 16 May 16 Jun 16 Jul 16 Aug 16 Sep 16 Oct 16 Nov 16
vvdsvdvsdy
CELLNEX TELECOM IBEX 35 (Rebased)Source: Factset
Shareholders: Abertis 34%; Threadneedle 8%;
Blackrock 6%;
Page 49 of 60
Produced & Distributed by the Members of ESN (see last page of this report)
Edenred
France/Support Services Analyser
SUPPORT SERVICES
Edenred (Buy) Excessive and unjustified fall
Roadshow feedback: compelling growth prospects
The facts: We highlight certain key points regarding strategy, following a post
Investor Day roadshow with Edenred.
Our analysis: It will be difficult to quantify the impact of the US elections on
business, which is not very exposed to the US, but well settled in Mexico. Even
though it is local, activity will be impacted by the trend in the Mexican peso, which
has lost 12% since 9 November (+/-5% +/-EUR1.5m EBIT15).
Employee Benefits: The plan provides for single-digit revenue growth driven
by a still underpenetrated market, but also by digitalisation of the offer, which
will help: 1) extend the addressable market; 2) improve pricing; 3) increase the
value proposed to affiliates with catchment area data analysis; and 4) increase
stickiness of the offer. In our view, Edenred could expand 3-5% in France, a
fairly mature market. The Brazilian situation and business appear to be
stabilising. The unemployment rate has to contract however (not until H2-17) for
activity to rebound.
Expense management: revenue growth set to be higher than 10%. Edenred is
settled in Brazil with Embratec, and the group is likely to step up diversification
in Europe by becoming the majority shareholder of UTA in early 2017. Edenred
is thus set to capitalise on UTA and LCCC (France) to extend its presence on
the Light Fleet and Heavy Fleet market. Edenred has gained its first foothold in
Asia, as it did with Fleetcore in the US a few years ago, by proposing the
software part of its card offers to oil groups ahead of outsourcing of their
management.
Corporate payments: the “bonus” to the medium-term targets at group level,
Edenred intends to integrate the payments scheme as part of B2B transactions.
Edenred will act as issuer, processor, acquirer and scheme by creating a closed
scheme that will enable it to regulate, filter, and administer the transaction and
above all create a relationship of trust between stakeholders.
Conclusion & Action: The vectors set up under this strategy are not new, but
help clarify the new management’s ambitions. New initiatives have been put in
place but remain a “bonus” to the financial targets in the Fast Forward plan,
which, in our view, are the minimum level of future performance. We maintain our
positive stance with a target price (present value) of EUR26.
Analyst(s):
Kévin Woringer, CM - CIC Market Solutions
+33 1 53 48 80 69
Buy
18.65
closing price as of 11/11/2016
26.00
Target Price unchanged
Recommendation unchanged
Target price: EUR
Share price: EUR
Reuters/Bloomberg EDEN.PA/EDEN FP
Market capitalisation (EURm) 4,312
Current N° of shares (m) 231
Free float 74%
Daily avg. no. trad. sh. 12 mth 869
Daily avg. trad. vol. 12 mth (m) 23,266
Price high 12 mth (EUR) 21.97
Price low 12 mth (EUR) 13.94
Abs. perf. 1 mth -6.23%
Abs. perf. 3 mth -10.34%
Abs. perf. 12 mth 7.90%
Key financials (EUR) 12/15 12/16e 12/17e
Sales (m) 1,069 1,135 1,255
EBITDA (m) 388 419 477
EBITDA margin 36.3% 36.9% 38.1%
EBIT (m) 341 368 424
EBIT margin 31.9% 32.4% 33.8%
Net Profit (adj.)(m) 200 213 244
ROCE -12.7% -13.0% -12.6%
Net debt/(cash) (m) 637 603 356
Net Debt/Equity -0.4 -0.4 -0.2
Debt/EBITDA 1.6 1.4 0.7
Int. cover(EBITDA/Fin. int) 8.3 8.4 8.7
EV/Sales 4.4 4.4 3.8
EV/EBITDA 12.2 11.9 10.0
EV/EBITDA (adj.) 12.2 11.9 10.0
EV/EBIT 13.8 13.6 11.3
P/E (adj.) 20.2 20.2 17.7
P/BV nm nm nm
OpFCF yield 7.7% 10.7% 11.9%
Dividend yield 4.5% 4.7% 5.4%
EPS (adj.) 0.87 0.92 1.05
BVPS (6.24) (6.27) (6.20)
DPS 0.84 0.88 1.00
13
14
15
16
17
18
19
20
21
22
Oct 15 Nov 15 Dec 15 Jan 16 Feb 16 Mar 16 Apr 16 May 16 Jun 16 Jul 16 Aug 16 Sep 16 Oct 16 Nov 16
vvdsvdvsdy
EDENRED SBF 120 (Rebased)Source: Factset
Shareholders: Colony Capital 11%; Morgan Stanley IM
9%; Veritas AM 5%;

Page 50 of 60
Produced & Distributed by the Members of ESN (see last page of this report)
Openjobmetis
Italy/Support Services Analyser
SUPPORT SERVICES
Openjobmetis (Buy) Roadshow feedback: compelling growth prospects
Positive 9M 16 results
OPENJOBMETIS: 9M 16 results
9M 15a 9M 16a % Chg
Sales 321.1 330.3 +2.9%
First contribution margin 43.0 43.1 +0.4%
% margin 13.4% 13.1%
EBITDA 10.9 10.6 -2.3%
% margin 3.5% 3.2%
EBIT 7.0 8.8 +26.3%
% margin 2.3% 2.7%
Net Profit 2.4 5.4 n.m.
% margin 0.9% 1.6%
Source: Company Data
Sales acceleration in Q3: after a stable sales growth in H1 16, Q3 revenues
showed a strong improvement (+5.1% Y/Y); this acceleration allowed the group to
achieved a positive sales growth in the first nine of the year.
Despite a stable trend of First contribution margin and a slight decrease in the
EBITDA margin, 9M 16 EBIT grew by +26.3% Y/Y thanks to a strong decrease in
depreciations and amortisations.
Further strengthening of the financial position: NFP was negative by EUR
33.9m, an improvement of around EUR 9.7m compared to approximately EUR
43.5m as of 31 December 2015. This decrease is the result of both the positive
contribution of cash flows from the group’s operating activities and the working
capital dynamics.
Outlook on FY 16: the management said that sales trend remained robust in
October, so they are confident to be able to increase the contract work revenues
and to continue the development of ancillary services in the last quarter of the
year and to improve further the profitability.
Furthermore, the management confirms the focus on the continuous network
expansion through the opening of 3 new branches in Emilia Romagna.
Conclusion & Action. We maintain our positive stance on the stock and confirm
our Buy recommendation and our target price of EUR 8.60 per share (valuation
based on our DCF model - 1.2% perpetual growth rates and WACC of 7.85%).
Analyst(s):
PaolaSaglietti, Banca Akros
+39 02 4344 4287
Buy
6.35
closing price as of 11/11/2016
8.60
Target Price unchanged
Recommendation unchanged
Target price: EUR
Share price: EUR
Reuters/Bloomberg OJM.MI/OJM IM
Market capitalisation (EURm) 87
Current N° of shares (m) 14
Free float 45%
Daily avg. no. trad. sh. 12 mth 8
Daily avg. trad. vol. 12 mth (m) 1
Price high 12 mth (EUR) 7.50
Price low 12 mth (EUR) 6.19
Abs. perf. 1 mth -4.01%
Abs. perf. 3 mth -11.63%
Abs. perf. 12 mth
Key financials (EUR) 12/15 12/16e 12/17e
Sales (m) 433 461 502
EBITDA (m) 15 18 21
EBITDA margin 3.4% 3.9% 4.2%
EBIT (m) 10 15 19
EBIT margin 2.4% 3.3% 3.7%
Net Profit (adj.)(m) 7 9 11
ROCE 5.9% 6.6% 7.6%
Net debt/(cash) (m) 44 39 31
Net Debt/Equity 0.7 0.5 0.4
Debt/EBITDA 2.9 2.2 1.5
Int. cover(EBITDA/Fin. int) 4.6 16.2 15.4
EV/Sales 0.3 0.3 0.2
EV/EBITDA 10.0 7.4 5.9
EV/EBITDA (adj.) 8.4 7.4 5.9
EV/EBIT 14.3 8.5 6.6
P/E (adj.) 22.2 9.7 8.0
P/BV 1.5 1.2 1.0
OpFCF yield 10.3% 10.0% 8.8%
Dividend yield 0.0% 0.0% 0.0%
EPS (adj.) 0.33 0.66 0.79
BVPS 4.85 5.51 6.30
DPS 0.00 0.00 0.00
5.4
5.6
5.8
6.0
6.2
6.4
6.6
6.8
7.0
7.2
7.4
7.6
Nov 15 Dec 15 Jan 16 Feb 16 Mar 16 Apr 16 May 16 Jun 16 Jul 16 Aug 16 Sep 16 Oct 16 Nov 16
vvdsvdvsdy
OPENJOBMETIS FTSE Italy STAR (Rebased)Source: Factset
Shareholders: M.T.I. Investimenti 5%; Omniafin 18%;
Wise Vwnture SGR 41%; Questio Capital
SGR 9%;

Page 51 of 60
Produced & Distributed by the Members of ESN (see last page of this report)
Telecommunications
Analyser
TELECOMMUNICATIONS
Positive 9M 16 results Altice’s CFO argues that sport content costs will
impact consumer prices in Portugal
280
290
300
310
320
330
340
350
360
370
380
390
Oct 15 Nov 15 Dec 15 Jan 16 Feb 16 Mar 16 Apr 16 May 16 Jun 16 Jul 16 Aug 16 Sep 16 Oct 16 Nov 16
vvdsvdvsdy
The facts: During the presentation to analysts of the 3Q16 results, Altice’s
CFO (Dennis Okhuijsen) argued that the increase of the content costs in the
Portuguese telecom market, namely sports content, will impact consumer
prices. According to the CFO, Altice’s operating margin should not be more
hurt than the rest of the other operators since this trend should also be pursued
by them (Souce: Jornal de Negócios).
Our analysis: In our opinion this is the most probable outcome arising from the
sports content cost increase, as we argued on our previous Company Update
for NOS (“New Telecom Order” – October 2016), since these costs have a
material impact in EBITDA margin. Please bear in mind that all Portuguese
telecom operators signed a MoU in July 2016 where it was agreed to share all
the existing and future costs related with sports content. Additionally, since all
the telecom operators are shareholders of SportTV (except Altice although it is
expected that the company will also enter the capital of the company in the
short-term) and the monthly fee of SportTV is already perceived as high.
Conclusion & Action: We argue that telecom operators in Portugal will have a
strong incentive to increase and practice similar prices for its base bundles in
order to accommodate the negative effect in terms of EBITDA related with the
increase of the sports content costs.
---------- Stoxx Telecommunications,
DJ Stoxx TMI rebased on sector
Analyst(s):
Artur Amaro Caixa-Banco de Investimento
+351 213 89 6822

Page 52 of 60
Produced & Distributed by the Members of ESN (see last page of this report)
Euskaltel
Spain/Telecommunications Analyser
TELECOMMUNICATIONS
Euskaltel (Buy) Altice’s CFO argues that sport content costs will impact consumer prices in Portugal
Investments increasing…
The facts: Some investors and the new CEO recently took positions in the
company.
Our analysis: 40 North Latitude acquired 1% capital. Other shareholders also
increased stakes such as Bestinver, UBS (9%) and Artemis (5%).
The CEO also acquired 5,000 shares at EUR9.05/sh thus is the second
manager behind Albert Garcia Erauzkin who holds 0.235% capital.
Conclusion: The operator was listed at EUR12/share and has performed
negatively on the market (-27.2% YTD) partially due to the sector and also
unstable management since the unexpected exit of the previous CEO. Short
positions reached 3.43% capital at the end of October. However, this scenario is
an opportunity to buy shares at current prices.
We lean on the following aspects: 1) important cash generation (c. 8% FCF
yield 2016e) and high margins (EIBTDA mg 48.6% 2016e), synergies arising
from the acquisition of R in the ramp-up period mainly in 4Q’16/2017,
attractive dividend policy and positive impressions from the meeting with
the new CEO (focus on value generation for shareholders, advance in
convergence and boosting n-play service sales while maintaining capex under
control).
Analyst(s):
Eduardo Garcia Arguelles, GVC Gaesco Beka
+34 914 367 810
Buy
8.43
closing price as of 11/11/2016
12.00
Target Price unchanged
Recommendation unchanged
Target price: EUR
Share price: EUR
Reuters/Bloomberg EKT.MC/EKT SM
Market capitalisation (EURm) 1,281
Current N° of shares (m) 152
Free float 61%
Daily avg. no. trad. sh. 12 mth 705
Daily avg. trad. vol. 12 mth (m) 3,751
Price high 12 mth (EUR) 11.72
Price low 12 mth (EUR) 7.69
Abs. perf. 1 mth -7.08%
Abs. perf. 3 mth 2.23%
Abs. perf. 12 mth -16.50%
Key financials (EUR) 12/15 12/16e 12/17e
Sales (m) 327 570 580
EBITDA (m) 143 277 290
EBITDA margin 43.6% 48.6% 50.0%
EBIT (m) 64 154 169
EBIT margin 19.5% 26.9% 29.2%
Net Profit (adj.)(m) 7 77 89
ROCE 2.3% 5.5% 5.8%
Net debt/(cash) (m) 1,358 1,238 1,132
Net Debt/Equity 1.9 1.6 1.2
Debt/EBITDA 9.5 4.5 3.9
Int. cover(EBITDA/Fin. int) 2.7 6.5 7.5
EV/Sales 9.0 4.2 4.1
EV/EBITDA 20.7 8.7 8.1
EV/EBITDA (adj.) 20.7 8.7 8.1
EV/EBIT 46.2 15.7 13.9
P/E (adj.) nm 13.9 12.1
P/BV 2.1 1.4 1.1
OpFCF yield 5.6% 8.0% 8.3%
Dividend yield 0.0% 0.0% 6.5%
EPS (adj.) 0.05 0.61 0.70
BVPS 5.56 6.16 7.39
DPS 0.00 0.00 0.55
7.0
7.5
8.0
8.5
9.0
9.5
10.0
10.5
11.0
11.5
12.0
Oct 15 Nov 15 Dec 15 Jan 16 Feb 16 Mar 16 Apr 16 May 16 Jun 16 Jul 16 Aug 16 Sep 16 Oct 16 Nov 16
vvdsvdvsdy
EUSKALTEL Stoxx Telecommunications (Rebased)Source: Factset
Shareholders: Kutxabank 25%; Corp. Financ. Alba 10%;
JP Morgan Chase 4%;

Page 53 of 60
Produced & Distributed by the Members of ESN (see last page of this report)
Telecom Italia
Italy/Telecommunications Analyser
TELECOMMUNICATIONS
Telecom Italia (Accumulate) Investments increasing…
Conversion of EUR 1.3bn bond
The facts: TI announced the terms of the conversion for the EUR 1.3bn
mandatory convertible bond issued three years ago which matures tomorrow. The
average price calculated between October 13 and November 10 was EUR 0.7634
(vs. a range of EUR 0.6801/0.8331), so that the company will issue 1,703m new
ordinary shares.
Our analysis: the new shares represent 11.2% of the previous ordinary capital,
8% on a fully diluted basis. Net debt will decline from EUR 26.7bn to EUR 25.4bn,
implying 3.1 times the adj EBITDA FY 2016e. The stake of Vivendi will be diluted
from the current 24.6% to around 22%.
Conclusion & Action: The impact on valuation based on our target price is
around EUR 3c. The impact on debt was obviously anticipated in the credit
market and by rating agencies. We would expect Vivendi to increase its stake
back to the original level close to the threshold of 25%.
Analyst(s):
Andrea Devita, CFA, Banca Akros
+39 02 4344 4031
Accumulate
0.71
closing price as of 11/11/2016
1.15
Target Price unchanged
Recommendation unchanged
Target price: EUR
Share price: EUR
Reuters/Bloomberg TLIT.MI/TIT IM
Market capitalisation (EURm) 13,150
Current N° of shares (m) 19,443
Free float 65%
Daily avg. no. trad. sh. 12 mth 102,501
Daily avg. trad. vol. 12 mth (m) 117,831
Price high 12 mth (EUR) 1.23
Price low 12 mth (EUR) 0.63
Abs. perf. 1 mth -1.11%
Abs. perf. 3 mth -9.51%
Abs. perf. 12 mth -39.23%
Key financials (EUR) 12/15 12/16e 12/17e
Sales (m) 19,718 18,836 18,382
EBITDA (m) 7,004 8,058 8,059
EBITDA margin 35.5% 42.8% 43.8%
EBIT (m) 2,962 3,730 3,681
EBIT margin 15.0% 19.8% 20.0%
Net Profit (adj.)(m) 774 1,685 1,235
ROCE 5.6% 5.2% 5.0%
Net debt/(cash) (m) 28,475 27,567 27,468
Net Debt/Equity 1.3 1.2 1.1
Debt/EBITDA 4.1 3.4 3.4
Int. cover(EBITDA/Fin. int) 2.8 5.2 5.1
EV/Sales 2.7 2.3 2.4
EV/EBITDA 7.6 5.4 5.4
EV/EBITDA (adj.) 6.6 5.4 5.4
EV/EBIT 17.9 11.7 11.9
P/E (adj.) 29.5 8.2 11.2
P/BV 1.3 0.7 0.7
OpFCF yield -4.5% 4.6% 2.2%
Dividend yield 0.0% 0.0% 0.0%
EPS (adj.) 0.04 0.09 0.06
BVPS 0.91 0.98 1.04
DPS 0.00 0.00 0.00
0.60
0.70
0.80
0.90
1.00
1.10
1.20
1.30
ott 15 nov 15 dic 15 gen 16 feb 16 mar 16 apr 16 mag 16 giu 16 lug 16 ago 16 set 16 ott 16 nov 16
vvdsvdvsdy
TELECOM ITALIA Stoxx Telecommunications (Rebased)Source: Factset
Shareholders: Vivendi 25%; brandes 2%; Findim 2.00%;
Blackrock 6%;

Page 54 of 60
Produced & Distributed by the Members of ESN (see last page of this report)
Snam
Italy/Utilities Analyser
UTILITIES
Snam (Accumulate) Conversion of EUR 1.3bn bond
We expect a declining set of figures in 9M 2016 Y/Y
The facts: Snam is unveiling its 9M 16 results tomorrow, before market opening.
Our analysis: the company ought to post declining results YoY:
EUR m 9M 15A 9M 16E Y/Y
Gas injected into the network (bcm) 49.9 51.4 3.0%
Total sales 2,748 2,586 -5.9%
EBITDA 2,108 1,968 -6.6%
EBITDA margin 76.7% 76.1%
EBIT 1,472 1293 -12.2%
EBIT margin 53.6% 50.0%
Pre-tax profit 1,292 1126 -12.8%
Net profit 888 786 -11.5%
Source: Company data, Banca Akros estimates
The volumes of gas injected into the network ought to be up by around 3%
YoY. It is worth noting that the gas demand was up by around 1.4% in 9M 16
YoY. In fact, consumptions recorded for thermoelectric uses were up by nearly
6%, residential were down by around 4%, while industrial demand was up YoY
(+3%). The difference between the gas demand and the gas transported is due to
the inflows from the storage sites. We remind readers that the inflows act
positively on the volumes transported. The inflows were around 3bcm in 9M 16,
while they were roughly 2.2bcm in 9M 2015.
Revenues. The decrease we expect in revenues is mainly due to the regulatory
review, which lowered the allowed return. Based on our estimates, this ought to
impact for around EUR 110m. The remaining around EUR 52m difference in
terms of revenues we estimated is due to lower pass-through (EUR 36m lower)
and non-regulated revenues (EUR 16m lower). Pass-through revenues ought to
be around EUR 82m vs. EUR 118m in H1 15.
Costs. Snam ought to be affected by higher costs YoY (in relative terms) related
to the movements of the risk and provisions funds (there was a release from the
fund for roughly EUR 15m in 9M 15; we expect this to be restored in 9M 16 and
thus the total impact ought to be a nearly EUR 30m impact in terms of costs YoY)
and to the one-off cost for the Italgas demerger. This explains the decrease in
EBITDA margin.
EBIT. At an EBIT level, we expect a reduction YoY as a consequence of higher
D&A (EUR 675m in 9M 2016 vs. EUR 636m in H1 2015).
Financial charges and NFP. Financial charges should be nearly EUR 258m,
EUR 277m in 9M 2015. The decrease is mainly due to the debt optimisation
process the company is successfully carrying on. Snam ought to post a net debt
of around EUR 14.0bn vs. EUR 14.2bn recorded as at the end of H1 2016. Based
on our estimates, the company’s cost of debt should be around 2.5%. Incomes
from associates are expected at nearly EUR 91m (EUR 97m in 9M 15).
Tax rate ought to be almost flat YoY at roughly 30% and thus the net profit
should be down by around 12%. Capex. In 9M 16, Snam should have invested
around EUR 845m (EUR 803m invested in 9M 15).
Conclusion & Action: we don’t believe 9M 2016 results may be considered a
catalyst for the stock. The catalyst remains, in our view, the releverage process
and the interest rate dynamic. At the current market price, based on our
estimates, the stock is trading at a nearly 5% premium vs. its equity RAB and it
offers an attractive 5.8% dividend yield. We confirm our positive stance on the
stock.
Analyst(s):
Dario Michi, Banca Akros
+39 02 4344 4237
Accumulate
3.57
closing price as of 11/11/2016
4.30
Target Price unchanged
Recommendation unchanged
Target price: EUR
Share price: EUR
Reuters/Bloomberg SRG.MI/SRG IM
Market capitalisation (EURm) 12,497
Current N° of shares (m) 3,501
Free float 69%
Daily avg. no. trad. sh. 12 mth 13,275
Daily avg. trad. vol. 12 mth (m) 73,618
Price high 12 mth (EUR) 4.55
Price low 12 mth (EUR) 3.56
Abs. perf. 1 mth -7.08%
Abs. perf. 3 mth -15.41%
Abs. perf. 12 mth -8.57%
Key financials (EUR) 12/15 12/16e 12/17e
Sales (m) 2,576 2,417 2,454
EBITDA (m) 2,052 1,953 2,003
EBITDA margin 79.7% 80.8% 81.6%
EBIT (m) 1,476 1,345 1,375
EBIT margin 57.3% 55.6% 56.0%
Net Profit (adj.)(m) 971 814 907
ROCE 6.6% 5.4% 5.9%
Net debt/(cash) (m) 10,317 10,700 10,775
Net Debt/Equity 1.6 1.6 1.6
Debt/EBITDA 5.0 5.5 5.4
Int. cover(EBITDA/Fin. int) 7.7 7.4 7.3
EV/Sales 8.9 9.0 8.9
EV/EBITDA 11.1 11.2 10.9
EV/EBITDA (adj.) 11.1 11.2 10.9
EV/EBIT 15.5 16.2 15.9
P/E (adj.) 14.3 15.4 13.8
P/BV 2.1 1.9 1.8
OpFCF yield 4.6% 2.8% 5.3%
Dividend yield 7.0% 5.9% 6.0%
EPS (adj.) 0.28 0.23 0.26
BVPS 1.88 1.90 1.95
DPS 0.25 0.21 0.22
3.2
3.4
3.6
3.8
4.0
4.2
4.4
4.6
ott 15 nov 15 dic 15 gen 16 feb 16 mar 16 apr 16 mag 16 giu 16 lug 16 ago 16 set 16 ott 16 nov 16
vvdsvdvsdy
SNAM Stoxx Utilities (Rebased)Source: Factset
Shareholders: CDP 31%;

Page 55 of 60
Produced & Distributed by the Members of ESN (see last page of this report)
European Coverage of the Members of ESN
A ero space & D efense M em(*) Bcp CBI Kemira OPG Corbion NIBC
Airbus Group CIC Bnp Paribas CIC Linde EQB Danone CIC
Dassault Aviation CIC Bper BAK Tikkurila OPG Ebro Foods GVC
Latecoere CIC Bpi CBIElectro nic & Electrical
EquipmentM em(*) Enervit BAK
Leonardo BAK Caixabank GVC Alstom CIC Fleury M ichon CIC
Lisi CIC Commerzbank EQB Areva CIC Forfarmers NIBC
M tu EQB Credem BAK Euromicron Ag EQB Heineken NIBC
Ohb Se EQB Credit Agrico le Sa CIC Kontron EQB Hkscan OPG
Safran CIC Creval BAK Legrand CIC La Doria BAK
Thales CIC Deutsche Bank EQB Neways Electronics NIBC Lanson-Bcc CIC
Zodiac Aerospace CIC Deutsche Pfandbriefbank EQB Nexans CIC Laurent Perrier CIC
A irlines M em(*) Eurobank IBG Pkc Group OPG Ldc CIC
Air France Klm CIC Ing Group NIBC Rexel CIC Naturex CIC
Finnair OPG Intesa Sanpaolo BAK Schneider Electric Se CIC Olvi OPG
Lufthansa EQB M ediobanca BAK Vaisala OPG Parmalat BAK
A uto mo biles & P arts M em(*) M erkur Bank EQB Viscom EQB Pernod Ricard CIC
Bittium Corporation OPG National Bank Of Greece IBG F inancial Services M em(*) Raisio OPG
Bmw EQB Natixis CIC Anima BAK Refresco Group NIBC
Brembo BAK Nordea OPG Athex Group IBG Remy Cointreau CIC
Continental EQB Piraeus Bank IBG Azimut BAK Vidrala GVC
Daimler Ag EQB Poste Italiane BAK Banca Generali BAK Vilmorin CIC
Elringklinger EQB Societe Generale CIC Banca Ifis BAK Viscofan GVC
Faurecia CIC Ubi Banca BAK Banca Sistema BAK Vranken Pommery M onopole CIC
Ferrari BAK Unicredit BAK Bb Biotech EQB Wessanen NIBC
Fiat Chrysler Automobiles BAK B asic R eso urces M em(*) Binckbank NIBC F o o d & D rug R etailers M em(*)
Landi Renzo BAK Acerinox GVC Bolsas Y M ercados Espanoles Sa GVC Ahold NIBC
Leoni EQB Altri CBI Capman OPG Carrefour CIC
M ichelin CIC Arcelormittal GVC Christian Dior CIC Casino Guichard-Perrachon CIC
Nokian Tyres OPG Corticeira Amorim CBI Cir BAK Dia GVC
Norma Group EQB Ence GVC Comdirect EQB Jeronimo M artins CBI
Piaggio BAK Europac GVC Corp. Financiera Alba GVC Kesko OPG
Plastic Omnium CIC M etka IBG Deutsche Boerse EQB M arr BAK
Sogefi BAK M etsä Board OPG Deutsche Forfait EQB M etro CIC
Stern Groep NIBC M ytilineos IBG Eq OPG Sligro NIBC
Valeo CIC Outokumpu OPG Euronext CIC Sonae CBI
Volkswagen EQB Semapa CBI Ferratum EQB General Industria ls M em(*)
B anks M em(*) Ssab OPG Finecobank BAK 2G Energy EQB
Aareal Bank EQB Stora Enso OPG Grenke EQB Aalberts NIBC
Abn Amro Group Nv NIBC Surteco EQB Hypoport Ag EQB Accell Group NIBC
Aktia OPG The Navigator Company CBI M lp EQB Ahlstrom OPG
Alpha Bank IBG Tubacex GVC Ovb Holding Ag EQB Arcadis NIBC
Banca Carige BAK Upm-Kymmene OPG Patrizia Ag EQB Aspo OPG
Banca M ps BAK B io techno lo gy M em(*) Rallye CIC Huhtamäki OPG
Banco Popolare BAK 4Sc EQB Unipol Gruppo Finanziario BAK Kendrion NIBC
Banco Popular GVC Cytotools Ag EQB F o o d & B everage M em(*) Nedap NIBC
Banco Sabadell GVC Epigenomics Ag EQB Acomo NIBC Pöyry OPG
Banco Santander GVC Wilex EQB Atria OPG Prelios BAK
Bankia GVC C hemicals M em(*) Bonduelle CIC Rubis CIC
Bankinter GVC Air Liquide CIC Campari BAK Saf-Holland EQB
Bbva GVC Holland Colours NIBC Coca Cola Hbc Ag IBG Serge Ferrari Group CIC

Page 56 of 60
Produced & Distributed by the Members of ESN (see last page of this report)
Siegfried Holding Ag EQB H o useho ld Go o ds M em(*) Axa CIC Thermador Groupe CIC
Tkh Group NIBC Bic CIC Banca M edio lanum BAK Titan Cement IBG
Wendel CIC De Longhi BAK Catto lica Assicurazioni BAK Trevi BAK
General R etailers M em(*) Fila BAK Delta Lloyd NIBC Uponor OPG
Banzai BAK Osram Licht Ag EQB Generali BAK Vicat CIC
Beter Bed Holding NIBC Seb Sa CIC Hannover Re EQB Vinci CIC
Elumeo Se EQB Zumtobel Group Ag EQB M apfre Sa GVC Yit OPG
Fielmann EQB Industria l Engineering M em(*) M unich Re EQB M edia M em(*)
Folli Fo llie Group IBG Accsys Technologies NIBC Nn Group Nv NIBC Ad Pepper EQB
Fourlis Holdings IBG Aixtron EQB Sampo OPG Alma M edia OPG
Groupe Fnac Sa CIC Ansaldo Sts BAK Talanx Group EQB Atresmedia GVC
Inditex GVC Biesse BAK Unipolsai BAK Axel Springer EQB
Jumbo IBG Cargotec Corp OPGM aterials, C o nstruct io n &
InfrastructureM em(*) Brill NIBC
M acintosh NIBC Cnh Industrial BAK Abertis GVC Cofina CBI
Rapala OPG Danieli BAK Acs GVC Cts Eventim EQB
Stockmann OPG Datalogic BAK Aena GVC Editoriale L'Espresso BAK
Yoox Net-A-Porter BAK Deutz Ag EQB Aeroports De Paris CIC Gl Events CIC
H ealthcare M em(*) Dmg M ori Seiki Ag EQB Astaldi BAK Havas CIC
Amplifon BAK Duro Felguera GVC Atlantia BAK Impresa CBI
Bayer EQB Emak BAK Bilfinger Se EQB Ipsos CIC
Biotest EQB Exel Composites OPG Boskalis Westminster NIBC Jcdecaux CIC
Diasorin BAK Gesco EQB Buzzi Unicem BAK Lagardere CIC
Fresenius EQB Ima BAK Caverion OPG M 6-M etropole Television CIC
Fresenius M edical Care EQB Interpump BAK Cramo OPG M ediaset BAK
Gerresheimer Ag EQB Kone OPG Eiffage CIC M ediaset Espana GVC
Korian CIC Konecranes OPG Ellaktor IBG Notorious Pictures BAK
M erck EQB Kuka EQB Eltel OPG Nrj Group CIC
Orio la-Kd OPG M anz Ag EQB Ezentis GVC Publicis CIC
Orion OPG M ax Automation Ag EQB Fcc GVC Rcs M ediagroup BAK
Orpea CIC M etso OPG Ferrovial GVC Relx NIBC
Pihlajalinna OPG Outotec OPG Fraport EQB Rtl Group EQB
Recordati BAK Pfeiffer Vacuum EQB Heidelberg Cement Ag CIC Sanoma OPG
Rhoen-Klinikum EQB Ponsse OPG Heijmans NIBC Solocal Group CIC
H o tels, T ravel & T o urism M em(*) Prima Industrie BAK Hochtief EQB Spir Communication CIC
Accor CIC Prysmian BAK Imerys CIC Syzygy Ag EQB
Autogrill BAK Smt Scharf Ag EQB Italcementi BAK Telegraaf M edia Groep NIBC
Beneteau CIC Technotrans EQB Lafargeholcim CIC Teleperformance CIC
Elior CIC Valmet OPG Lehto OPG Tf1 CIC
Europcar CIC Wärtsilä OPG Lemminkäinen OPG Ubisoft CIC
I Grandi Viaggi BAK Zardoya Otis GVC M aire Tecnimont BAK Vivendi CIC
Iberso l CBI Industria l T ranspo rtat io n M em(*) M ota Engil CBI Wolters Kluwer NIBC
Intralo t IBG Bollore CIC Obrascon Huarte Lain GVC Oil & Gas P ro ducers M em(*)
Kotipizza OPG Caf GVC Ramirent OPG Eni BAK
M elia Hotels International GVC Ctt CBI Royal Bam Group NIBC Galp Energia CBI
Nh Hotel Group GVC Deutsche Post EQB Sacyr GVC Gas Plus BAK
Opap IBG Hhla EQB Saint Gobain CIC Hellenic Petro leum IBG
Snowworld NIBC Logwin EQB Salini Impregilo BAK M aurel Et Prom CIC
Sodexo CIC Insurance M em(*) Sias BAK M otor Oil IBG
Sonae Capital CBI Aegon NIBC Sonae Industria CBI Neste Corporation OPG
Trigano CIC Allianz EQB Srv OPG Petrobras CBI
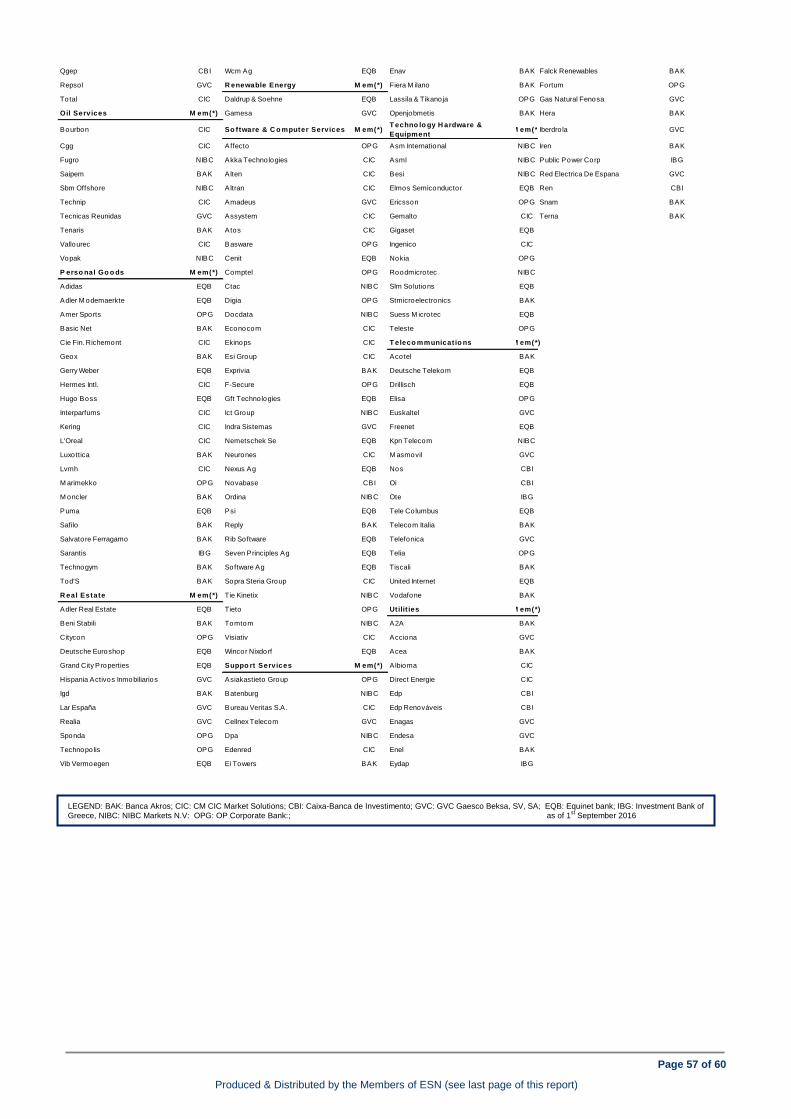
Page 57 of 60
Produced & Distributed by the Members of ESN (see last page of this report)
Qgep CBI Wcm Ag EQB Enav BAK Falck Renewables BAK
Repsol GVC R enewable Energy M em(*) Fiera M ilano BAK Fortum OPG
Total CIC Daldrup & Soehne EQB Lassila & Tikanoja OPG Gas Natural Fenosa GVC
Oil Services M em(*) Gamesa GVC Openjobmetis BAK Hera BAK
Bourbon CIC So ftware & C o mputer Services M em(*)T echno lo gy H ardware &
EquipmentM em(*)Iberdro la GVC
Cgg CIC Affecto OPG Asm International NIBC Iren BAK
Fugro NIBC Akka Technologies CIC Asml NIBC Public Power Corp IBG
Saipem BAK Alten CIC Besi NIBC Red Electrica De Espana GVC
Sbm Offshore NIBC Altran CIC Elmos Semiconductor EQB Ren CBI
Technip CIC Amadeus GVC Ericsson OPG Snam BAK
Tecnicas Reunidas GVC Assystem CIC Gemalto CIC Terna BAK
Tenaris BAK Atos CIC Gigaset EQB
Vallourec CIC Basware OPG Ingenico CIC
Vopak NIBC Cenit EQB Nokia OPG
P erso nal Go o ds M em(*) Comptel OPG Roodmicrotec NIBC
Adidas EQB Ctac NIBC Slm Solutions EQB
Adler M odemaerkte EQB Digia OPG Stmicroelectronics BAK
Amer Sports OPG Docdata NIBC Suess M icrotec EQB
Basic Net BAK Econocom CIC Teleste OPG
Cie Fin. Richemont CIC Ekinops CIC T eleco mmunicat io ns M em(*)
Geox BAK Esi Group CIC Acotel BAK
Gerry Weber EQB Exprivia BAK Deutsche Telekom EQB
Hermes Intl. CIC F-Secure OPG Drillisch EQB
Hugo Boss EQB Gft Technologies EQB Elisa OPG
Interparfums CIC Ict Group NIBC Euskaltel GVC
Kering CIC Indra Sistemas GVC Freenet EQB
L'Oreal CIC Nemetschek Se EQB Kpn Telecom NIBC
Luxottica BAK Neurones CIC M asmovil GVC
Lvmh CIC Nexus Ag EQB Nos CBI
M arimekko OPG Novabase CBI Oi CBI
M oncler BAK Ordina NIBC Ote IBG
Puma EQB Psi EQB Tele Columbus EQB
Safilo BAK Reply BAK Telecom Italia BAK
Salvatore Ferragamo BAK Rib Software EQB Telefonica GVC
Sarantis IBG Seven Principles Ag EQB Telia OPG
Technogym BAK Software Ag EQB Tiscali BAK
Tod'S BAK Sopra Steria Group CIC United Internet EQB
R eal Estate M em(*) Tie Kinetix NIBC Vodafone BAK
Adler Real Estate EQB Tieto OPG Utilit ies M em(*)
Beni Stabili BAK Tomtom NIBC A2A BAK
Citycon OPG Visiativ CIC Acciona GVC
Deutsche Euroshop EQB Wincor Nixdorf EQB Acea BAK
Grand City Properties EQB Suppo rt Services M em(*) Albioma CIC
Hispania Activos Inmobiliarios GVC Asiakastieto Group OPG Direct Energie CIC
Igd BAK Batenburg NIBC Edp CBI
Lar España GVC Bureau Veritas S.A. CIC Edp Renováveis CBI
Realia GVC Cellnex Telecom GVC Enagas GVC
Sponda OPG Dpa NIBC Endesa GVC
Technopolis OPG Edenred CIC Enel BAK
Vib Vermoegen EQB Ei Towers BAK Eydap IBG
LEGEND: BAK: Banca Akros; CIC: CM CIC Market Solutions; CBI: Caixa-Banca de Investimento; GVC: GVC Gaesco Beksa, SV, SA; EQB: Equinet bank; IBG: Investment Bank of
Greece, NIBC: NIBC Markets N.V: OPG: OP Corporate Bank:; as of 1st September 2016

Page 58 of 60
Produced & Distributed by the Members of ESN (see last page of this report)
List of ESN Analysts (**)
Ari Agopyan CIC +33 1 53 48 80 63 [email protected] Victoria Kruchevska (CFA,FRM) EQB +49 69 5 89 97 416 [email protected]
Artur Amaro CBI +351 213 89 6822 [email protected] Jean-Christophe Lefèvre-Moulenq CIC +33 1 53 48 80 65 [email protected]
Helena Barbosa CBI +351 21 389 6831 [email protected] Konstantinos Manolopoulos IBG +30 210 817 3388 [email protected]
Javier Bernat GVC +34 91 436 7816 jav [email protected] Dario Michi BAK +39 02 4344 4237 [email protected]
Dimitris Birbos IBG +30 210 81 73 392 [email protected] Marietta Miemietz CFA EQB +49-69-58997-439 [email protected]
Agnès Blazy CIC +33 1 53 48 80 67 [email protected] José Mota Freitas, CFA CBI +351 22 607 09 31 [email protected]
Charles Edouard Boissy CIC +33 01 53 48 80 81 [email protected] Henri Parkkinen OPG +358 10 252 4409 [email protected]
Rafael Bonardell GVC +34 91 436 78 171 [email protected] Victor Peiro Pérez GVC +34 91 436 7812 [email protected]
Louise Boyer CIC +33 1 53 48 80 68 [email protected] Francis Prêtre CIC +33 4 78 92 02 30 [email protected]
Giada Cabrino, CIIA BAK +39 02 4344 4092 [email protected] Francesco Previtera BAK +39 02 4344 4033 francesco.prev [email protected]
Arnaud Cadart CIC +33 1 53 48 80 86 [email protected] Jari Raisanen OPG +358 10 252 4504 [email protected]
Niclas Catani OPG +358 10 252 8780 [email protected] Hannu Rauhala OPG +358 10 252 4392 [email protected]
Pierre Chedeville CIC +33 1 53 48 80 97 [email protected] Matias Rautionmaa OPG +358 10 252 4408 [email protected]
Emmanuel Chevalier CIC +33 1 53 48 80 72 [email protected] Eric Ravary CIC +33 1 53 48 80 71 [email protected]
David Consalvo CIC +33 1 53 48 80 64 [email protected] Iñigo Recio Pascual GVC +34 91 436 7814 [email protected]
Edwin de Jong NIBC +312 0 5508569 [email protected] Gerard Rijk NIBC + 31 (0)20 550 8572 [email protected]
Martijn den Drijver NIBC +312 0 5508636 [email protected] André Rodrigues CBI +351 21 389 68 39 [email protected]
Christian Devismes CIC +33 1 53 48 80 85 [email protected] Jean-Luc Romain CIC +33 1 53 48 80 66 [email protected]
Andrea Devita, CFA BAK +39 02 4344 4031 [email protected] Jochen Rothenbacher, CEFA EQB +49 69 58997 415 [email protected]
Sebastian Droste EQB +49 69 58 99 74 34 [email protected] Vassilis Roumantzis IBG +30 2108173394 [email protected]
Enrico Esposti, CIIA BAK +39 02 4344 4022 [email protected] Sonia Ruiz De Garibay GVC +34 91 436 7841 [email protected]
Rafael Fernández de Heredia GVC +34 91 436 78 08 [email protected] Antti Saari OPG +358 10 252 4359 [email protected]
Enrico Filippi, CEFA BAK +39 02 4344 4071 [email protected] Paola Saglietti BAK +39 02 4344 4287 [email protected]
Gabriele Gambarova BAK +39 02 43 444 289 [email protected] Francesco Sala BAK +39 02 4344 4240 [email protected]
Eduardo Garcia Arguelles GVC +34 914 367 810 [email protected] Holger Schmidt, CEFA EQB +49 69 58 99 74 32 [email protected]
Alexandre Gérard CIC +33 1 53 48 80 93 [email protected] Cengiz Sen EQB +4969 58997 435 [email protected]
Philipp Häßler, CFA EQB +49 69 58997 414 [email protected] Pekka Spolander OPG +358 10 252 4351 [email protected]
Simon Heilmann EQB +49 69 58 997 413 [email protected] Kimmo Stenvall OPG +358 10 252 4561 [email protected]
Dr. Knud Hinkel EQB + 49 69 58997 419 [email protected] Natalia Svyrou-Svyriadi IBG +30 210 81 73 384 [email protected]
Marcell Houben NIBC +31 20 550 8649 [email protected] Luigi Tramontana BAK +39 02 4344 4239 [email protected]
Carlos Jesus CBI +351 21 389 6812 [email protected] Johan van den Hooven NIBC +312 0 5508518 [email protected]
Mark Josefson EQB +4969-58997-437 [email protected] Kévin Woringer CIC +33 1 53 48 80 69 [email protected]
(**) excluding: strategists, macroeconomists, heads of research not covering specific stocks, credit analysts, technical analysts

Page 59 of 60
Produced & Distributed by the Members of ESN (see last page of this report)
ESN Recommendation System The ESN Recommendation System is Absolute. It means that each stock is rated on the basis of
a total return, measured by the upside potential (including dividends and capital reimbursement)
over a 12 month time horizon.
The ESN spectrum of recommendations (or ratings) for each stock comprises 5 categories: Buy
(B), Accumulate (A), Neutral (N), Reduce (R) and Sell (S).
Furthermore, in specific cases and for a limited period of time, the analysts are allowed to rate the
stocks as Rating Suspended (RS) or Not Rated (NR), as explained below.
Meaning of each recommendation or rating:
Buy: the stock is expected to generate total return of over 15% during the next 12 months time horizon
Accumulate: the stock is expected to generate total return of 5% to 15% during the next 12 months time horizon
Neutral: the stock is expected to generate total return of -5% to +5% during the next 12 months time horizon
Reduce: the stock is expected to generate total return of -5% to -15% during the next 12 months time horizon
Sell: the stock is expected to generate total return under -15% during the next 12 months time horizon
Rating Suspended: the rating is suspended due to a change of analyst covering the stock or a capital operation (take-over bid, SPO, …) where the issuer of the document (a partner of ESN) or a related party of the issuer is or could be involved
Not Rated: there is no rating for a company being floated (IPO) by the issuer of the document (a partner of ESN) or a related party of the issuer
Certain flexibility on the limits of total return bands is permitted especially during higher phases of volatility on the markets
ESN Ratings Breakdown
Date and time of production: 14th November 2016 9 :18am CET First date and time of dissemination: 14th November 2016 9 :20am CET
Disclaimer: These reports have been prepared and issued by the Members of
European Securities Network LLP (‘ESN’). ESN, its Members and their
affiliates (and any director, officer or employee thereof), are neither liable
for the proper and complete transmission of these reports nor for any
delay in their receipt. Any unauthorised use, disclosure, copying,
distribution, or taking of any action in reliance on these reports is strictly
prohibited. The views and expressions in the reports are expressions of
opinion and are given in good faith, but are subject to change without
notice. These reports may not be reproduced in whole or in part or passed
to third parties without permission. The information herein was obtained
from various sources. ESN, its Members and their affiliates (and any
director, officer or employee thereof) do not guarantee their accuracy or
completeness, and neither ESN, nor its Members, nor its Members’
affiliates (nor any director, officer or employee thereof) shall be liable in
respect of any errors or omissions or for any losses or consequential
losses arising from such errors or omissions. Neither the information
contained in these reports nor any opinion expressed constitutes an offer,
or an invitation to make an offer, to buy or sell any securities or any
options, futures or other derivatives related to such securities (‘related
investments’). These reports are prepared for the clients of the Members
of ESN only. They do not have regard to the specific investment
objectives, financial situation and the particular needs of any specific
person who may receive any of these reports. Investors should seek
financial advice regarding the appropriateness of investing in any
securities or investment strategies discussed or recommended in these
reports and should understand that statements regarding future prospects
may not be realised. Investors should note that income from such
securities, if any, may fluctuate and that each security’s price or value may
rise or fall. Accordingly, investors may receive back less than originally
invested. Past performance is not necessarily a guide to future
performance. Foreign currency rates of exchange may adversely affect the
value, price or income of any security or related investment mentioned in
these reports. In addition, investors in securities such as ADRs, whose
value are influenced by the currency of the underlying security, effectively
assume currency risk. ESN, its Members and their affiliates may submit a
pre-publication draft (without mentioning neither the recommendation nor
the target price/fair value) of its reports for review to the Investor Relations
Department of the issuer forming the subject of the report, solely for the
purpose of correcting any inadvertent material inaccuracies. Like all
members employees, analysts receive compensation that is impacted by
overall firm profitability For further details about the analyst certification,
the specific risks of the company and about the valuation methods used to
determine the price targets included in this report/note, please refer to the
specific disclaimer pages prepared by the ESN Members. In the case of a
short note please refer to the latest relevant published research on single
stock or contact the analyst named on the front of the report/note for
detailed information on the valuation methods, earning estimates and
risks. A full description of all the organisational and administrative
measures taken by the Members of ESN to manage interest and conflicts
of interest are available on the website of the Members. Research is
available through the ESN Members sales representative. ESN will
provide periodic updates on companies or sectors based on company-
specific developments or announcements, market conditions or any other
publicly available information. Unless agreed in writing with an ESN
Member, this research is intended solely for internal use by the recipient.
Neither this document nor any copy of it may be taken or transmitted into
Australia, Canada or Japan or distributed, directly or indirectly, in
Australia, Canada or Japan or to any resident thereof. This document is
for distribution in the U.K. Only to persons who have professional
experience in matters relating to investments and fall within article 19(5) of
the financial services and markets act 2000 (financial promotion) order
2005 (the “order”) or (ii) are persons falling within article 49(2)(a) to (d) of
the order, namely high net worth companies, unincorporated associations
etc (all such persons together being referred to as “relevant persons”).
This document must not be acted on or relied upon by persons who are
not relevant persons. Any investment or investment activity to which this
document relates is available only to relevant persons and will be engaged
in only with relevant persons. The distribution of this document in other
jurisdictions or to residents of other jurisdictions may also be restricted by
law, and persons into whose possession this document comes should
inform themselves about, and observe, any such restrictions. By accepting
this report you agree to be bound by the foregoing instructions. You shall
indemnify ESN, its Members and their affiliates (and any director, officer or
employee thereof) against any damages, claims, losses, and detriments
resulting from or in connection with the unauthorized use of this document.
For disclosure upon “conflicts of interest” on the companies under
coverage by all the ESN Members and on each “company
recommendation history”, please visit the ESN website
(www.esnpartnership.eu) or refer to the ESN Members website. Additional
information is always available upon request. For additional information
and individual disclaimers please refer to www.esnpartnership.eu and
to each ESN Member websites:
www.bancaakros.it regulated by the CONSOB - Commissione Nazionale per le Società e la Borsa
www.caixabi.pt regulated by the CMVM - Comissão do Mercado de Valores Mobiliários
www.cmcicms.com regulated by the AMF - Autorité des marchés financiers
www.equinet-ag.de regulated by the BaFin - Bundesanstalt für Finanzdienstleistungsaufsicht
www.ibg.gr regulated by the HCMC - Hellenic Capital Market Commission
www.nibcmarkets.com regulated by the AFM - Autoriteit Financiële Markten
www.op.fi regulated by the Financial Supervision Authority
www.valores.gvcgaesco.es regulated by CNMV - Comisión Nacional del Mercado de Valores
Members of ESN (European Securities Network LLP)
Caixa-Banco de Investimento
Rua Barata Salgueiro, nº 33
1269-057 Lisboa
Portugal
Phone: +351 21 313 73 00
Fax: +351 21 389 68 98
GVC Gaesco Beka, SV, SA
C/ Marques de Villamagna 3
28001 Madrid
Spain
Phone: +34 91 436 7813
Investment Bank of Greece
32 Aigialeias Str & Paradissou,
151 25 Maroussi,
Greece
Tel: +30 210 81 73 383
Banca Akros S.p.A.
Viale Eginardo, 29
20149 MILANO
Italy
Phone: +39 02 43 444 389
Fax: +39 02 43 444 302
NIBC Markets N.V.
Nieuwezijds Voorburgwal 162
P.O.Box 235
1000 AE Amsterdam
The Netherlands
Phone: +31 20 550 8500
Fax: +31 20 626 8064
CM - CIC Market Solutions
6, avenue de Provence
75441 Paris
Cedex 09
France
Phone: +33 1 53 48 80 78
Fax: +33 1 53 48 82 25
equinet Bank AG
Gräfstraße 97
60487 Frankfurt am Main
Germany
Phone:+49 69 – 58997 – 212
Fax:+49 69 – 58997 – 299
OP Corporate Bank plc
P.O.Box 308
Teollisuuskatu 1, 00013 Helsinki
Finland
Phone: +358 10 252 011
Fax: +358 10 252 2703