ese customer satisfaction survey: charter school leaders ... · web viewthe following tables...
TRANSCRIPT
Charter School Leader ESE Satisfaction Survey Summary of Findings
Prepared for the Massachusetts Department of Elementary and Secondary Education
February, 2012
Charter School Satisfaction Survey – Summary of Findings Frequency Distributions
Survey Frequency Distributions
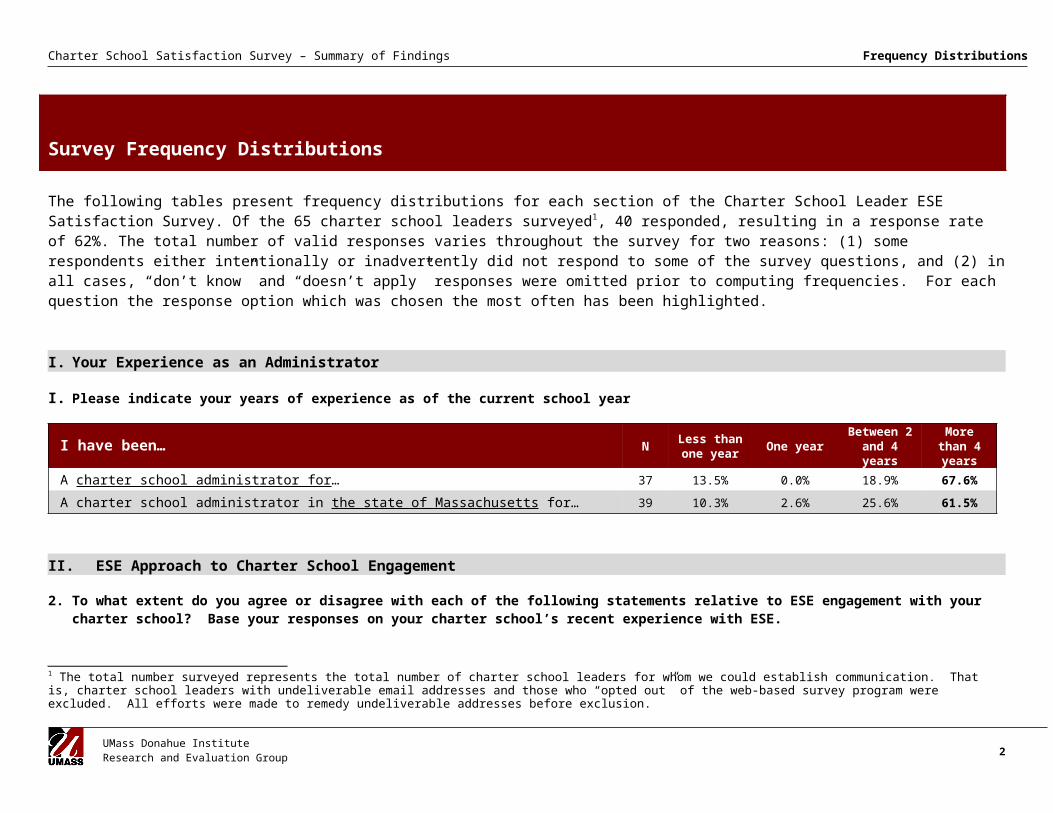
The following tables present frequency distributions for each section of the Charter School Leader ESE Satisfaction Survey. Of the 65 charter school leaders surveyed1, 40 responded, resulting in a response rate of 62%. The total number of valid responses varies throughout the survey for two reasons: (1) some respondents either intentionally or inadvertently did not respond to some of the survey questions, and (2) in all cases, “don’t know” and “doesn’t apply” responses were omitted prior to computing frequencies. For each question the response option which was chosen the most often has been highlighted.
I. Your Experience as an Administrator
I. Please indicate your years of experience as of the current school year
I have been… N Less than one year One year Between 2
and 4 yearsMore than
4 yearsA charter school administrator for… 37 13.5% 0.0% 18.9% 67.6%
A charter school administrator in the state of Massachusetts for… 39 10.3% 2.6% 25.6% 61.5%
II. ESE Approach to Charter School Engagement
2. To what extent do you agree or disagree with each of the following statements relative to ESE engagement with your charter school? Base your responses on your charter school’s recent experience with ESE.
ESE … N Strongly Agree
Somewhat Agree
Somewhat Disagree
Strongly Disagree
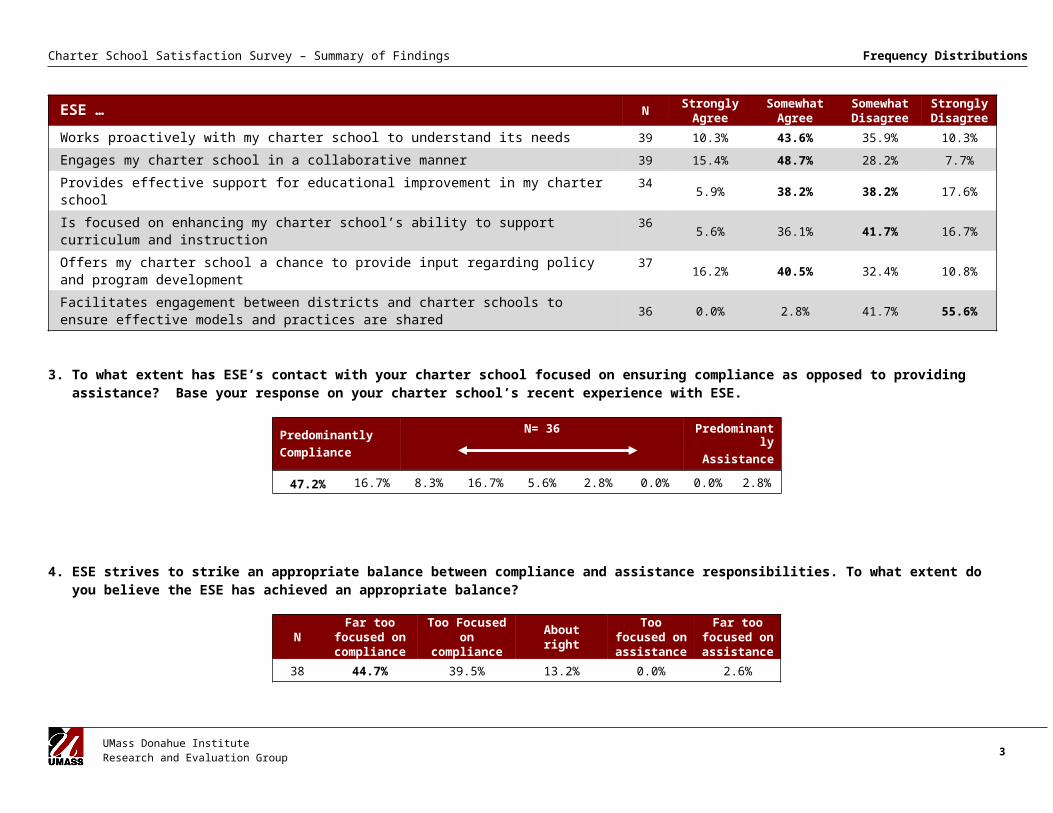
Works proactively with my charter school to understand its needs 39 10.3% 43.6% 35.9% 10.3%
Engages my charter school in a collaborative manner 39 15.4% 48.7% 28.2% 7.7%
Provides effective support for educational improvement in my charter school 34 5.9% 38.2% 38.2% 17.6%
Is focused on enhancing my charter school’s ability to support curriculum and instruction 36 5.6% 36.1% 41.7% 16.7%
1 The total number surveyed represents the total number of charter school leaders for whom we could establish communication. That is, charter school leaders with undeliverable email addresses and those who “opted out” of the web-based survey program were excluded. All efforts were made to remedy undeliverable addresses before exclusion.
UMass Donahue Institute Research and Evaluation Group 2
Charter School Satisfaction Survey – Summary of Findings Frequency Distributions
ESE … N Strongly Agree
Somewhat Agree
Somewhat Disagree
Strongly Disagree
Offers my charter school a chance to provide input regarding policy and program development 37 16.2% 40.5% 32.4% 10.8%
Facilitates engagement between districts and charter schools to ensure effective models and practices are shared
36 0.0% 2.8% 41.7% 55.6%
3. To what extent has ESE’s contact with your charter school focused on ensuring compliance as opposed to providing assistance? Base your response on your charter school’s recent experience with ESE.
PredominantlyCompliance
N= 36 PredominantlyAssistance
47.2% 16.7% 8.3% 16.7% 5.6% 2.8% 0.0% 0.0% 2.8%
4. ESE strives to strike an appropriate balance between compliance and assistance responsibilities. To what extent do you believe the ESE has achieved an appropriate balance?
NFar too
focused on compliance
Too Focused on
complianceAbout right
Too focused on
assistance
Far too focused on assistance
38 44.7% 39.5% 13.2% 0.0% 2.6%
UMass Donahue Institute Research and Evaluation Group 3
Charter School Satisfaction Survey – Summary of Findings Frequency Distributions
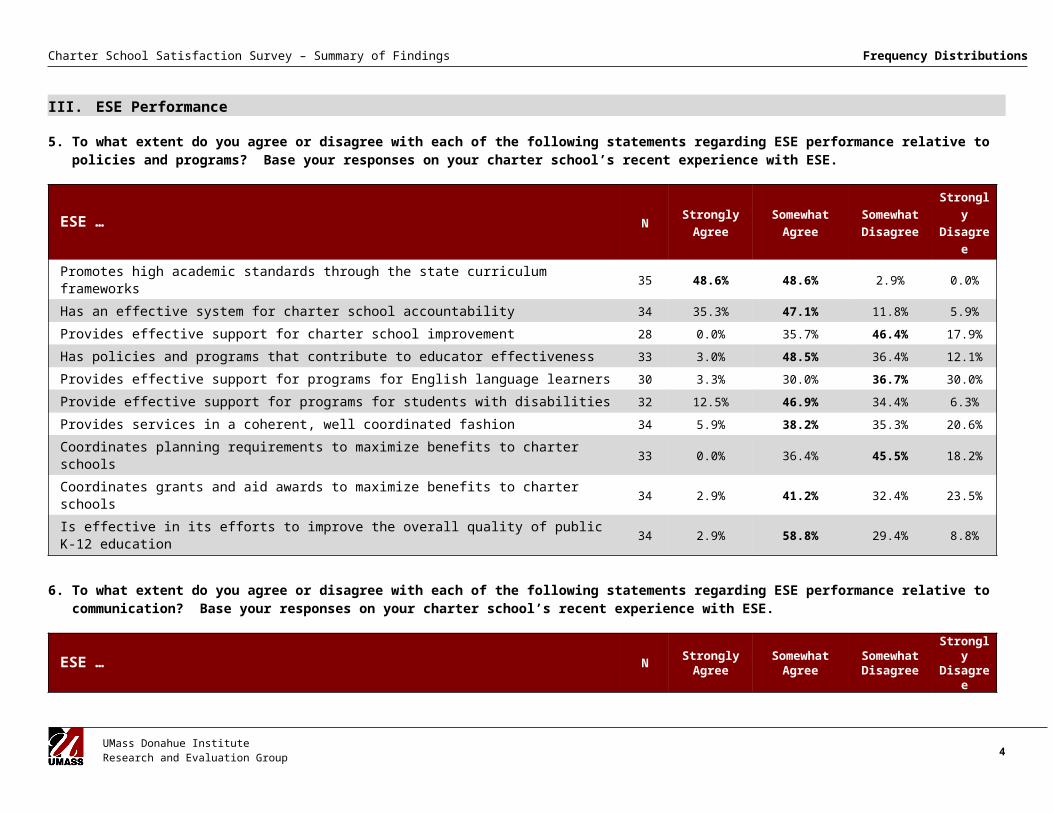
III. ESE Performance
5. To what extent do you agree or disagree with each of the following statements regarding ESE performance relative to policies and programs? Base your responses on your charter school’s recent experience with ESE.
ESE … NStrongly
AgreeSomewhat
AgreeSomewhat Disagree
Strongly Disagree
Promotes high academic standards through the state curriculum frameworks 35 48.6% 48.6% 2.9% 0.0%
Has an effective system for charter school accountability 34 35.3% 47.1% 11.8% 5.9%
Provides effective support for charter school improvement 28 0.0% 35.7% 46.4% 17.9%
Has policies and programs that contribute to educator effectiveness 33 3.0% 48.5% 36.4% 12.1%
Provides effective support for programs for English language learners 30 3.3% 30.0% 36.7% 30.0%
Provide effective support for programs for students with disabilities 32 12.5% 46.9% 34.4% 6.3%
Provides services in a coherent, well coordinated fashion 34 5.9% 38.2% 35.3% 20.6%
Coordinates planning requirements to maximize benefits to charter schools 33 0.0% 36.4% 45.5% 18.2%
Coordinates grants and aid awards to maximize benefits to charter schools 34 2.9% 41.2% 32.4% 23.5%
Is effective in its efforts to improve the overall quality of public K-12 education 34 2.9% 58.8% 29.4% 8.8%
6. To what extent do you agree or disagree with each of the following statements regarding ESE performance relative to communication? Base your responses on your charter school’s recent experience with ESE.
ESE … N Strongly Agree
Somewhat Agree
Somewhat Disagree
Strongly Disagree
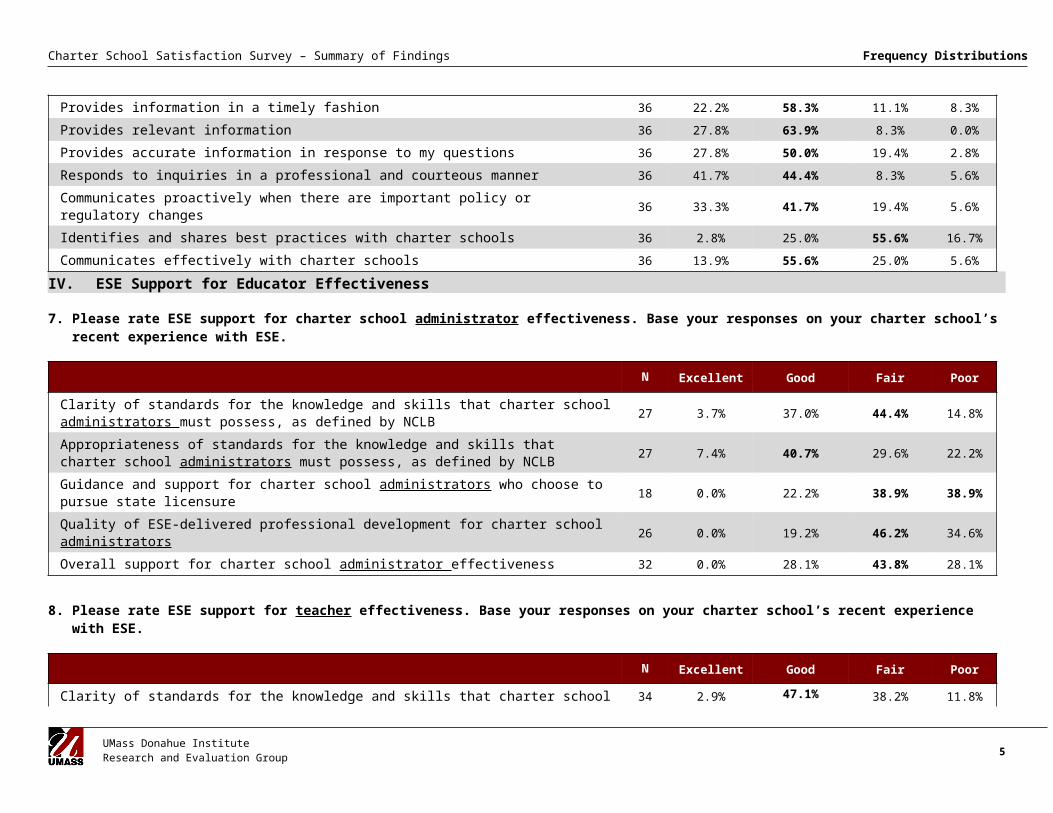
Provides information in a timely fashion 36 22.2% 58.3% 11.1% 8.3%
Provides relevant information 36 27.8% 63.9% 8.3% 0.0%
Provides accurate information in response to my questions 36 27.8% 50.0% 19.4% 2.8%
Responds to inquiries in a professional and courteous manner 36 41.7% 44.4% 8.3% 5.6%
Communicates proactively when there are important policy or regulatory changes 36 33.3% 41.7% 19.4% 5.6%
Identifies and shares best practices with charter schools 36 2.8% 25.0% 55.6% 16.7%
Communicates effectively with charter schools 36 13.9% 55.6% 25.0% 5.6%
UMass Donahue Institute Research and Evaluation Group 4
Charter School Satisfaction Survey – Summary of Findings Frequency Distributions
IV. ESE Support for Educator Effectiveness
7. Please rate ESE support for charter school administrator effectiveness. Base your responses on your charter school’s recent experience with ESE.
N Excellent Good Fair Poor
Clarity of standards for the knowledge and skills that charter school administrators must possess, as defined by NCLB
27 3.7% 37.0% 44.4% 14.8%
Appropriateness of standards for the knowledge and skills that charter school administrators must possess, as defined by NCLB
27 7.4% 40.7% 29.6% 22.2%
Guidance and support for charter school administrators who choose to pursue state licensure 18 0.0% 22.2% 38.9% 38.9%
Quality of ESE-delivered professional development for charter school administrators 26 0.0% 19.2% 46.2% 34.6%
Overall support for charter school administrator effectiveness 32 0.0% 28.1% 43.8% 28.1%
8. Please rate ESE support for teacher effectiveness. Base your responses on your charter school’s recent experience with ESE.
N Excellent Good Fair Poor
Clarity of standards for the knowledge and skills that charter school teachers must possess, as defined by NCLB
34 2.9% 47.1% 38.2% 11.8%
Appropriateness of standards for the knowledge and skills that charter school teachers must possess, as defined by NCLB
34 5.9% 44.1% 32.4% 17.6%
Guidance and support for charter school teachers who choose to pursue state licensure 32 3.1% 21.9% 40.6% 34.4%
Quality of ESE-delivered professional development for charter school teachers 29 0.0% 20.7% 55.2% 24.1%
Overall support for charter school teacher effectiveness 33 0.0% 27.3% 48.5% 24.2%
UMass Donahue Institute Research and Evaluation Group 5

Charter School Satisfaction Survey – Summary of Findings Frequency Distributions
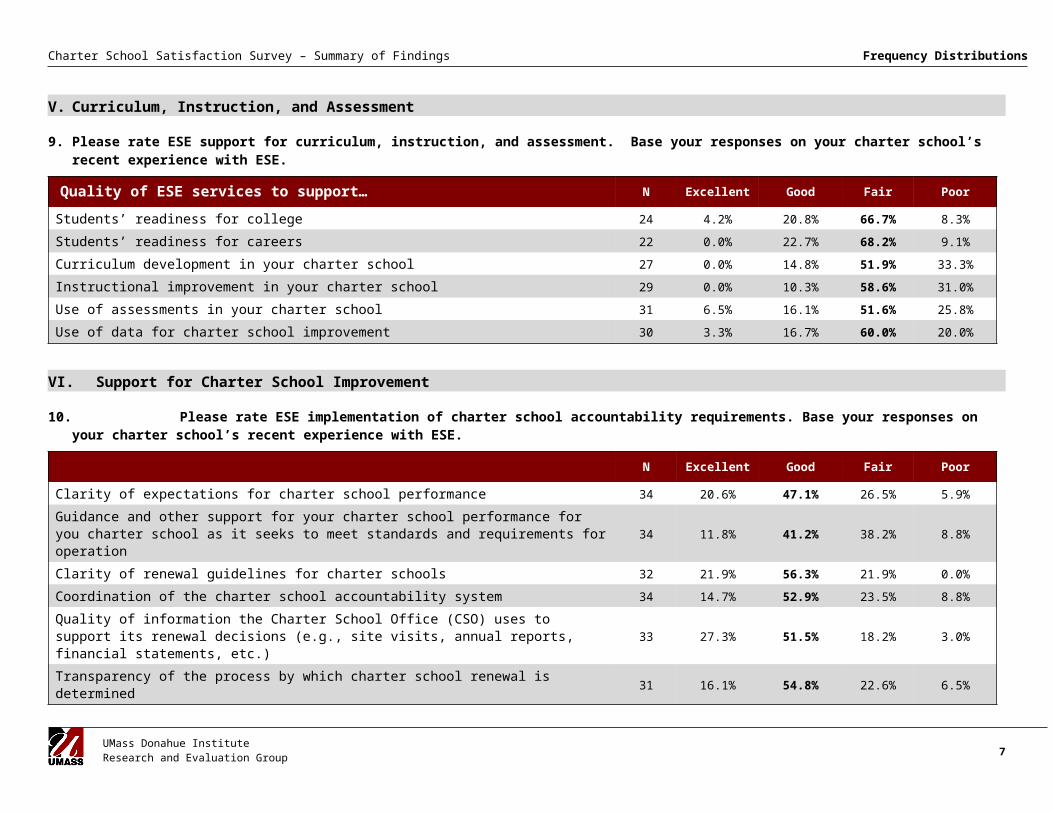
V. Curriculum, Instruction, and Assessment
9. Please rate ESE support for curriculum, instruction, and assessment. Base your responses on your charter school’s recent experience with ESE.
Quality of ESE services to support… N Excellent Good Fair Poor
Students’ readiness for college 24 4.2% 20.8% 66.7% 8.3%
Students’ readiness for careers 22 0.0% 22.7% 68.2% 9.1%
Curriculum development in your charter school 27 0.0% 14.8% 51.9% 33.3%
Instructional improvement in your charter school 29 0.0% 10.3% 58.6% 31.0%
Use of assessments in your charter school 31 6.5% 16.1% 51.6% 25.8%
Use of data for charter school improvement 30 3.3% 16.7% 60.0% 20.0%
VI. Support for Charter School Improvement
10. Please rate ESE implementation of charter school accountability requirements. Base your responses on your charter school’s recent experience with ESE.
N Excellent Good Fair Poor
Clarity of expectations for charter school performance 34 20.6% 47.1% 26.5% 5.9%
Guidance and other support for your charter school performance for you charter school as it seeks to meet standards and requirements for operation
34 11.8% 41.2% 38.2% 8.8%
Clarity of renewal guidelines for charter schools 32 21.9% 56.3% 21.9% 0.0%
Coordination of the charter school accountability system 34 14.7% 52.9% 23.5% 8.8%
Quality of information the Charter School Office (CSO) uses to support its renewal decisions (e.g., site visits, annual reports, financial statements, etc.)
33 27.3% 51.5% 18.2% 3.0%
Transparency of the process by which charter school renewal is determined 31 16.1% 54.8% 22.6% 6.5%
UMass Donahue Institute Research and Evaluation Group 6
Charter School Satisfaction Survey – Summary of Findings Frequency Distributions
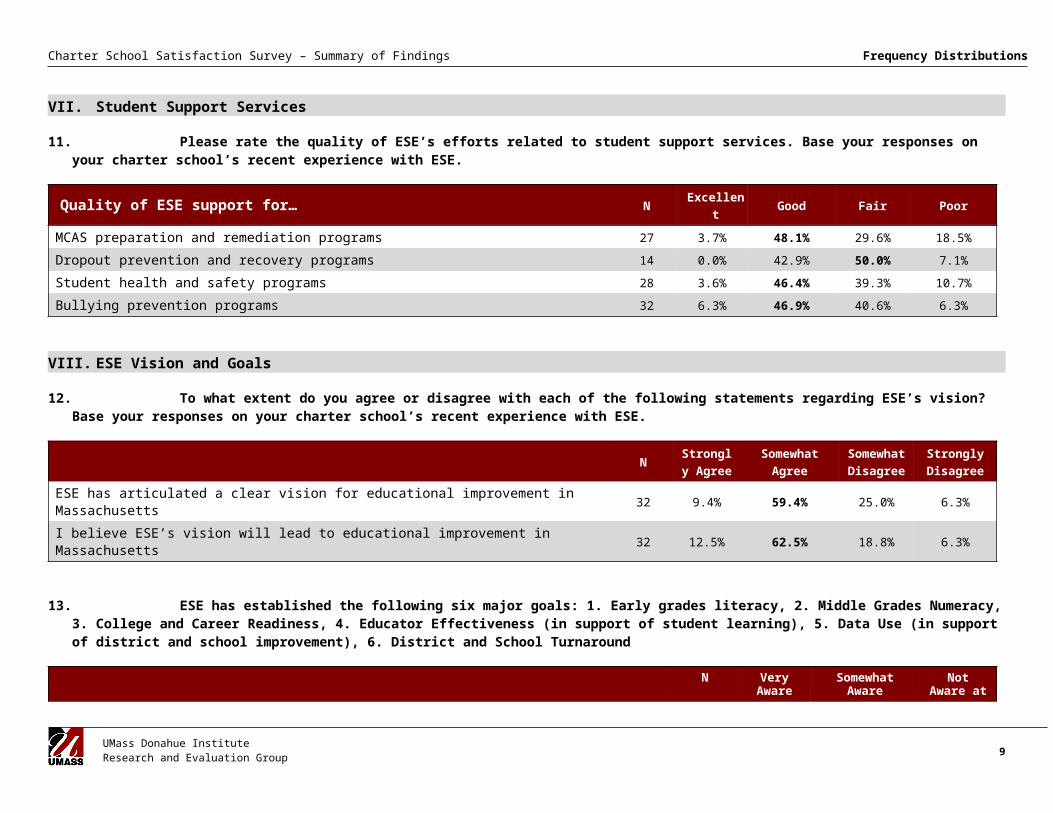
VII. Student Support Services
11. Please rate the quality of ESE’s efforts related to student support services. Base your responses on your charter school’s recent experience with ESE.
Quality of ESE support for… N Excellent Good Fair Poor
MCAS preparation and remediation programs 27 3.7% 48.1% 29.6% 18.5%
Dropout prevention and recovery programs 14 0.0% 42.9% 50.0% 7.1%
Student health and safety programs 28 3.6% 46.4% 39.3% 10.7%
Bullying prevention programs 32 6.3% 46.9% 40.6% 6.3%
VIII. ESE Vision and Goals
12. To what extent do you agree or disagree with each of the following statements regarding ESE’s vision? Base your responses on your charter school’s recent experience with ESE.
NStrongly
AgreeSomewhat
AgreeSomewhat Disagree
Strongly Disagree
ESE has articulated a clear vision for educational improvement in Massachusetts 32 9.4% 59.4% 25.0% 6.3%
I believe ESE’s vision will lead to educational improvement in Massachusetts 32 12.5% 62.5% 18.8% 6.3%
13. ESE has established the following six major goals: 1. Early grades literacy, 2. Middle Grades Numeracy, 3. College and Career Readiness, 4. Educator Effectiveness (in support of student learning), 5. Data Use (in support of district and school improvement), 6. District and School Turnaround
N Very Aware
Somewhat Aware
Not Aware at All
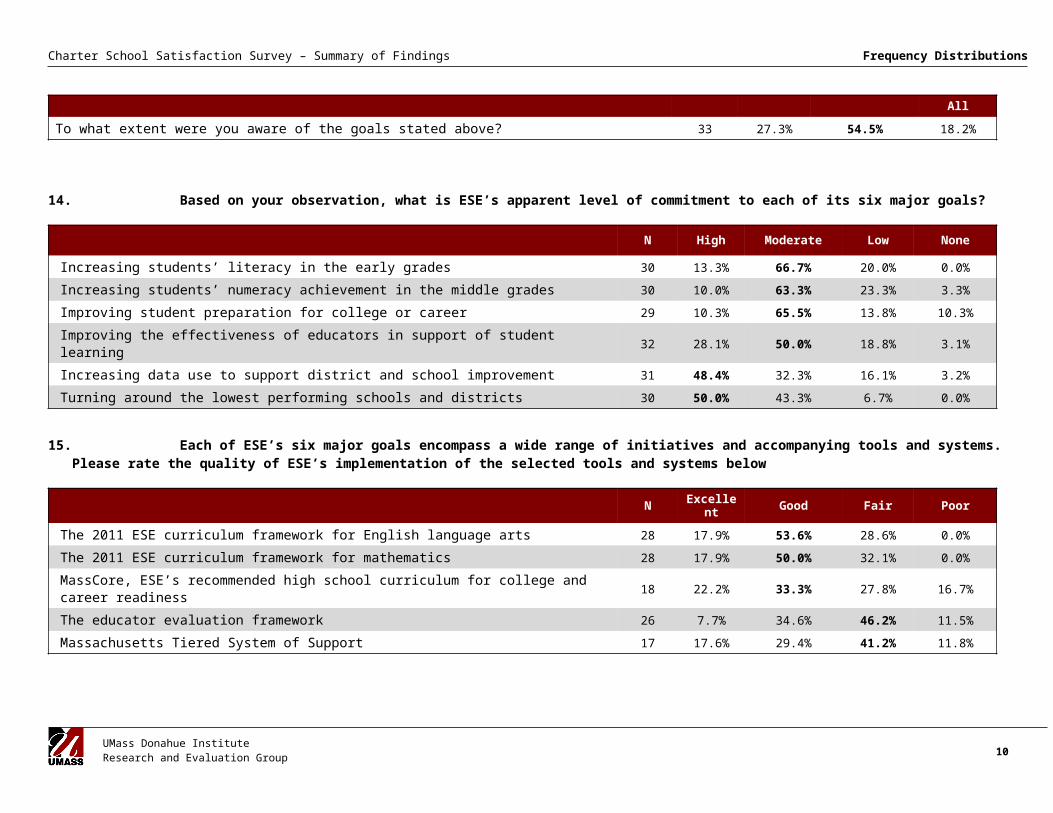
To what extent were you aware of the goals stated above? 33 27.3% 54.5% 18.2%
UMass Donahue Institute Research and Evaluation Group 7
Charter School Satisfaction Survey – Summary of Findings Frequency Distributions
14. Based on your observation, what is ESE’s apparent level of commitment to each of its six major goals?
N High Moderate Low None
Increasing students’ literacy in the early grades 30 13.3% 66.7% 20.0% 0.0%
Increasing students’ numeracy achievement in the middle grades 30 10.0% 63.3% 23.3% 3.3%
Improving student preparation for college or career 29 10.3% 65.5% 13.8% 10.3%
Improving the effectiveness of educators in support of student learning 32 28.1% 50.0% 18.8% 3.1%
Increasing data use to support district and school improvement 31 48.4% 32.3% 16.1% 3.2%
Turning around the lowest performing schools and districts 30 50.0% 43.3% 6.7% 0.0%
15. Each of ESE’s six major goals encompass a wide range of initiatives and accompanying tools and systems. Please rate the quality of ESE’s implementation of the selected tools and systems below
N Excellent Good Fair Poor
The 2011 ESE curriculum framework for English language arts 28 17.9% 53.6% 28.6% 0.0%
The 2011 ESE curriculum framework for mathematics 28 17.9% 50.0% 32.1% 0.0%
MassCore, ESE’s recommended high school curriculum for college and career readiness 18 22.2% 33.3% 27.8% 16.7%
The educator evaluation framework 26 7.7% 34.6% 46.2% 11.5%
Massachusetts Tiered System of Support 17 17.6% 29.4% 41.2% 11.8%
UMass Donahue Institute Research and Evaluation Group 8
Charter School Satisfaction Survey – Summary of Findings Frequency Distributions
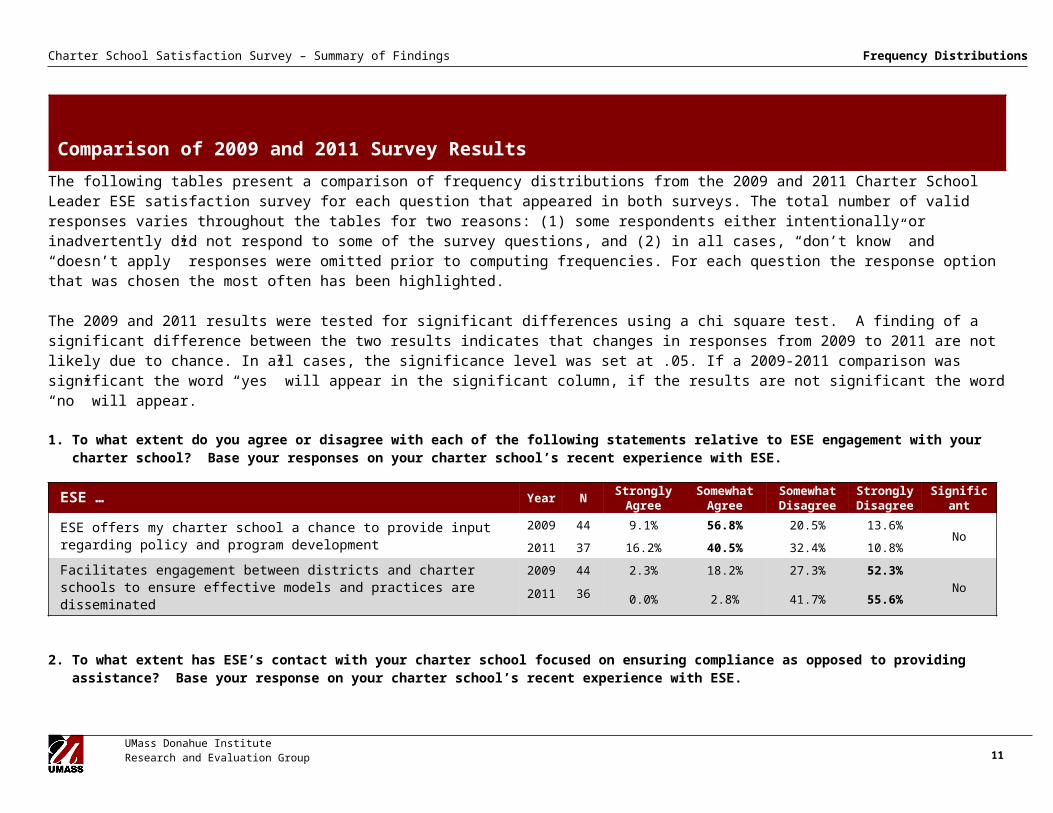
Comparison of 2009 and 2011 Survey ResultsThe following tables present a comparison of frequency distributions from the 2009 and 2011 Charter School Leader ESE satisfaction survey for each question that appeared in both surveys. The total number of valid responses varies throughout the tables for two reasons: (1) some respondents either intentionally or inadvertently did not respond to some of the survey questions, and (2) in all cases, “don’t know” and “doesn’t apply” responses were omitted prior to computing frequencies. For each question the response option that was chosen the most often has been highlighted.
The 2009 and 2011 results were tested for significant differences using a chi square test. A finding of a significant difference between the two results indicates that changes in responses from 2009 to 2011 are not likely due to chance. In all cases, the significance level was set at .05. If a 2009-2011 comparison was significant the word “yes” will appear in the significant column, if the results are not significant the word “no” will appear.
1. To what extent do you agree or disagree with each of the following statements relative to ESE engagement with your charter school? Base your responses on your charter school’s recent experience with ESE.
ESE … Year N Strongly Agree
Somewhat Agree
Somewhat Disagree
Strongly Disagree Significant
ESE offers my charter school a chance to provide input regarding policy and program development
2009 44 9.1% 56.8% 20.5% 13.6%No
2011 37 16.2% 40.5% 32.4% 10.8%
Facilitates engagement between districts and charter schools to ensure effective models and practices are disseminated
2009 44 2.3% 18.2% 27.3% 52.3%No
2011 36 0.0% 2.8% 41.7% 55.6%
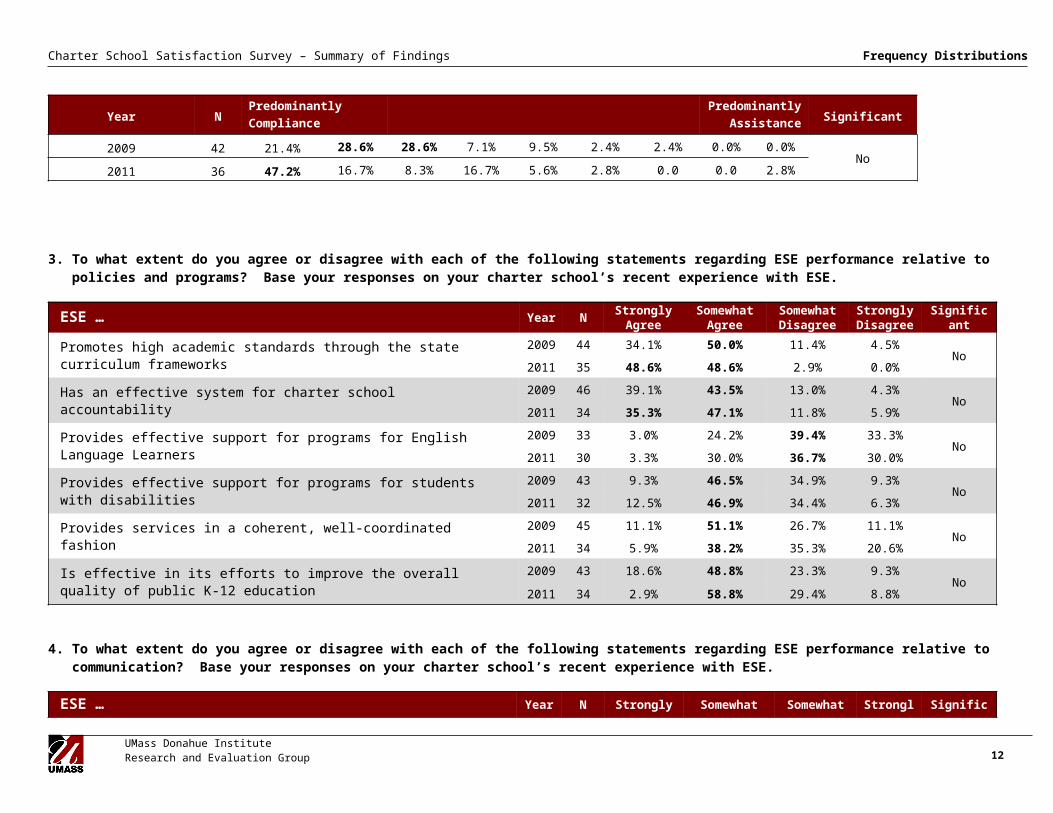
2. To what extent has ESE’s contact with your charter school focused on ensuring compliance as opposed to providing assistance? Base your response on your charter school’s recent experience with ESE.
Year NPredominantlyCompliance
PredominantlyAssistance Significant
2009 42 21.4% 28.6% 28.6% 7.1% 9.5% 2.4% 2.4% 0.0% 0.0%No
2011 36 47.2% 16.7% 8.3% 16.7% 5.6% 2.8% 0.0 0.0 2.8%
UMass Donahue Institute Research and Evaluation Group 9
Charter School Satisfaction Survey – Summary of Findings Frequency Distributions
3. To what extent do you agree or disagree with each of the following statements regarding ESE performance relative to policies and programs? Base your responses on your charter school’s recent experience with ESE.
ESE … Year N Strongly Agree
Somewhat Agree
Somewhat Disagree
Strongly Disagree Significant
Promotes high academic standards through the state curriculum frameworks2009 44 34.1% 50.0% 11.4% 4.5%
No2011 35 48.6% 48.6% 2.9% 0.0%
Has an effective system for charter school accountability2009 46 39.1% 43.5% 13.0% 4.3%
No2011 34 35.3% 47.1% 11.8% 5.9%
Provides effective support for programs for English Language Learners2009 33 3.0% 24.2% 39.4% 33.3%
No2011 30 3.3% 30.0% 36.7% 30.0%
Provides effective support for programs for students with disabilities2009 43 9.3% 46.5% 34.9% 9.3%
No2011 32 12.5% 46.9% 34.4% 6.3%
Provides services in a coherent, well-coordinated fashion2009 45 11.1% 51.1% 26.7% 11.1%
No2011 34 5.9% 38.2% 35.3% 20.6%
Is effective in its efforts to improve the overall quality of public K-12 education
2009 43 18.6% 48.8% 23.3% 9.3%No
2011 34 2.9% 58.8% 29.4% 8.8%
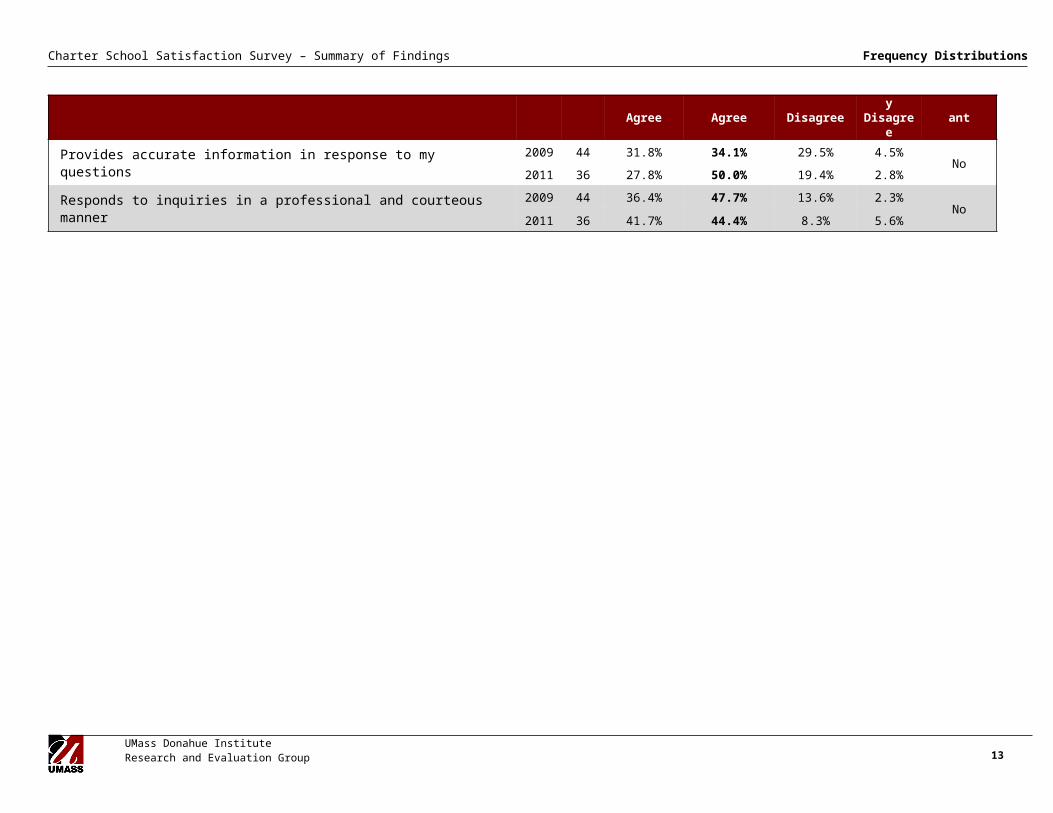
4. To what extent do you agree or disagree with each of the following statements regarding ESE performance relative to communication? Base your responses on your charter school’s recent experience with ESE.
ESE … Year N Strongly Agree
Somewhat Agree
Somewhat Disagree
Strongly Disagre
eSignificant
Provides accurate information in response to my questions2009 44 31.8% 34.1% 29.5% 4.5%
No2011 36 27.8% 50.0% 19.4% 2.8%
Responds to inquiries in a professional and courteous manner2009 44 36.4% 47.7% 13.6% 2.3%
No2011 36 41.7% 44.4% 8.3% 5.6%
UMass Donahue Institute Research and Evaluation Group 10
Charter School Satisfaction Survey – Summary of Findings Frequency Distributions
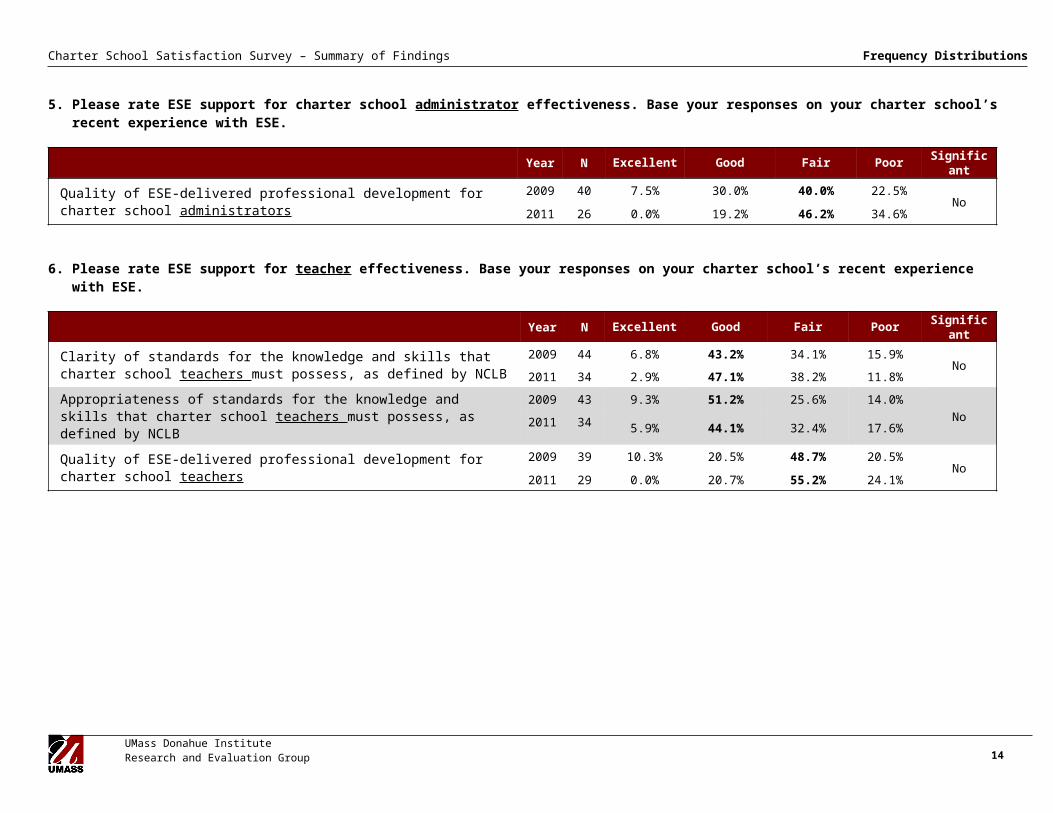
5. Please rate ESE support for charter school administrator effectiveness. Base your responses on your charter school’s recent experience with ESE.
Year N Excellent Good Fair Poor Significant
Quality of ESE-delivered professional development for charter school administrators
2009 40 7.5% 30.0% 40.0% 22.5%No
2011 26 0.0% 19.2% 46.2% 34.6%
6. Please rate ESE support for teacher effectiveness. Base your responses on your charter school’s recent experience with ESE.
Year N Excellent Good Fair Poor Significant
Clarity of standards for the knowledge and skills that charter school teachers must possess, as defined by NCLB
2009 44 6.8% 43.2% 34.1% 15.9%No
2011 34 2.9% 47.1% 38.2% 11.8%
Appropriateness of standards for the knowledge and skills that charter school teachers must possess, as defined by NCLB
2009 43 9.3% 51.2% 25.6% 14.0%No
2011 34 5.9% 44.1% 32.4% 17.6%
Quality of ESE-delivered professional development for charter school teachers
2009 39 10.3% 20.5% 48.7% 20.5%No
2011 29 0.0% 20.7% 55.2% 24.1%
UMass Donahue Institute Research and Evaluation Group 11
Charter School Satisfaction Survey – Summary of Findings Frequency Distributions
7. Please rate ESE support for curriculum, instruction, and assessment. Base your responses on your charter school’s recent experience with ESE.
Quality of ESE services to support… Year N Excellent Good Fair Poor Significant
Students’ readiness for college2009 40 12.5% 55.0% 22.5% 10.0%
Yes2011 24 4.2% 20.8% 66.7% 8.3%
Students’ readiness for career2009 37 16.2% 32.4% 37.8% 13.5%
No2011 22 0.0% 22.7% 68.2% 9.1%
Curriculum development in your charter school2009 34 2.9% 29.4% 35.3% 32.4%
No2011 27 0.0% 14.8% 51.9% 33.3%
Instructional improvement in your charter school2009 35 5.7% 11.4% 31.4% 51.4%
No2011 29 0.0% 10.3% 58.6% 31.0%
Use of assessments in your charter school2009 38 5.3% 21.1% 36.8% 36.8%
No2011 31 6.5% 16.1% 51.6% 25.8%
8. Please rate ESE implementation of charter school accountability requirements. Base your responses on your charter school’s recent experience with ESE.
Year N Excellent Good Fair Poor Significant
Clarity of expectations for charter school performance2009 42 33.3% 52.4% 9.5% 4.8%
No2011 34 20.6% 47.1% 26.5% 5.9%
Guidance and other support for your charter school as it seeks to meet standards and requirements for operation
2009 43 14.0% 58.1% 20.9% 7.0%No
2011 34 11.8% 41.2% 38.2% 8.8%
Clarity of renewal guidelines for charter schools2009 42 28.6% 59.5% 7.1% 4.8%
No2011 32 21.9% 56.3% 21.9% 0.0%
Coordination of the charter school accountability system2009 39 12.8% 56.4% 12.8% 17.9%
No2011 34 14.7% 52.9% 23.5% 8.8%
Quality of information the Charter School Office (CSO) uses to support its renewal decisions (e.g., site visits, annual reports, financial statements, etc.)
2009 41 29.3% 43.9% 19.5% 7.3%No
2011 33 27.3% 51.5% 18.2% 3.0%
UMass Donahue Institute Research and Evaluation Group 12
Charter School Satisfaction Survey – Summary of Findings Frequency Distributions
Year N Excellent Good Fair Poor Significant
Transparency of the process by which charter school renewal is determined2009 38 31.6% 50.0% 10.5% 7.9%
No2011 31 16.1% 54.8% 22.6% 6.5%
9. Please rate the quality of ESE’s efforts related to student support services. Base your responses on your charter school’s recent experience with ESE.
Quality of ESE support for… Year N Excellent Good Fair Poor Significant
MCAS preparation and remediation programs2009 35 8.6% 34.3% 34.3% 22.9%
No2011 27 3.7% 48.1% 29.6% 18.5%
Dropout prevention and recovery programs2009 24 12.5% 16.7% 50.0% 20.8%
No2011 14 0.0% 42.9% 50.0% 7.1%
Student health and safety programs2009 34 2.9% 41.2% 29.4% 26.5%
No2011 28 3.6% 46.4% 39.3% 10.7%
UMass Donahue Institute Research and Evaluation Group 13
Charter School Satisfaction Survey – Summary of Findings
UMass Donahue Institute Research and Evaluation Group 14