escapo stock optimization ‐ central stock
TRANSCRIPT

Stock Optimization ‐ Central Stock

1 Introduction Escapo
Agenda
2 Project Scope
3 Introduction 4C Consulting
4 Stock Optimization
5 Results
6 Next Steps
7

1 Introduction Escapo
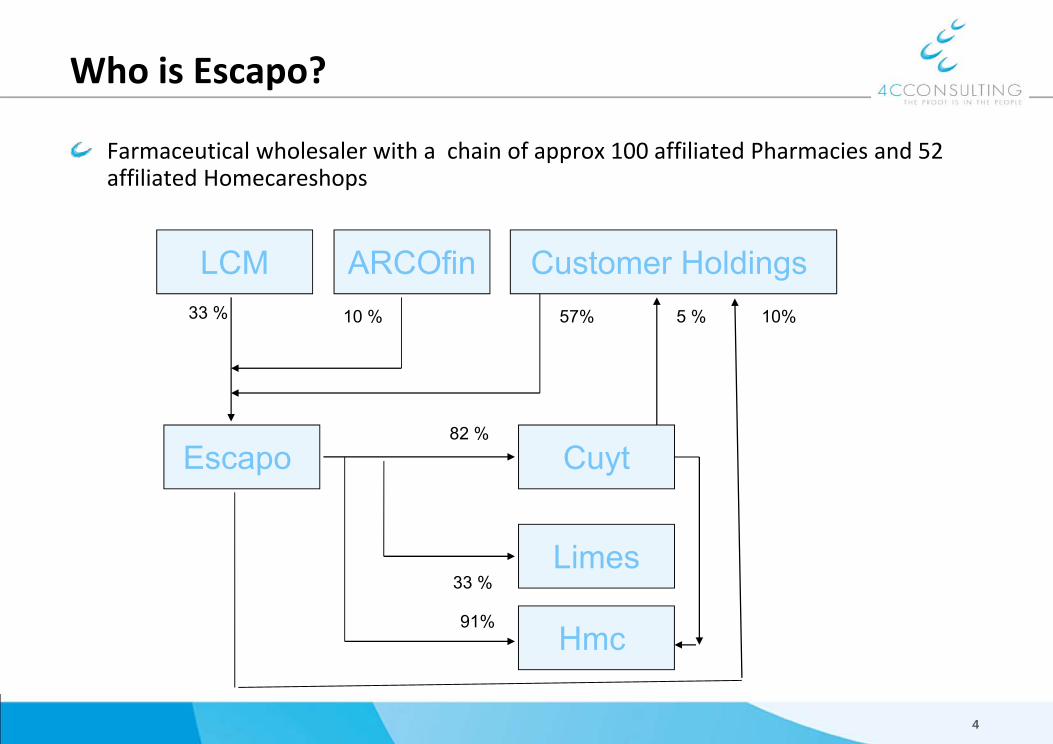
Who is Escapo?
Farmaceutical wholesaler with a chain of approx 100 affiliated Pharmacies and 52 affiliated Homecareshops
4
LCM ARCOfin Customer Holdings
Escapo Cuyt
Limes
33 % 10 % 57%
82 %
33 %
10%5 %
Hmc91%
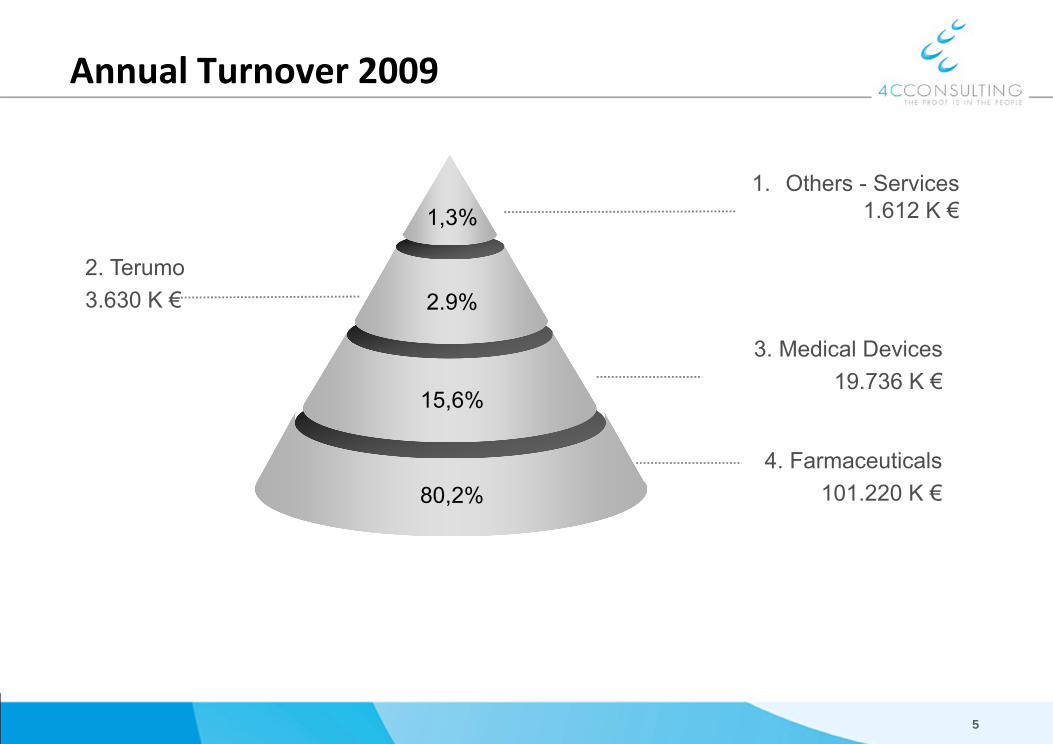
Annual Turnover 2009
5
1. Others - Services 1.612 K €
2. Terumo3.630 K €
3. Medical Devices19.736 K €
4. Farmaceuticals101.220 K €
2.9%
80,2%
15,6%
1,3%
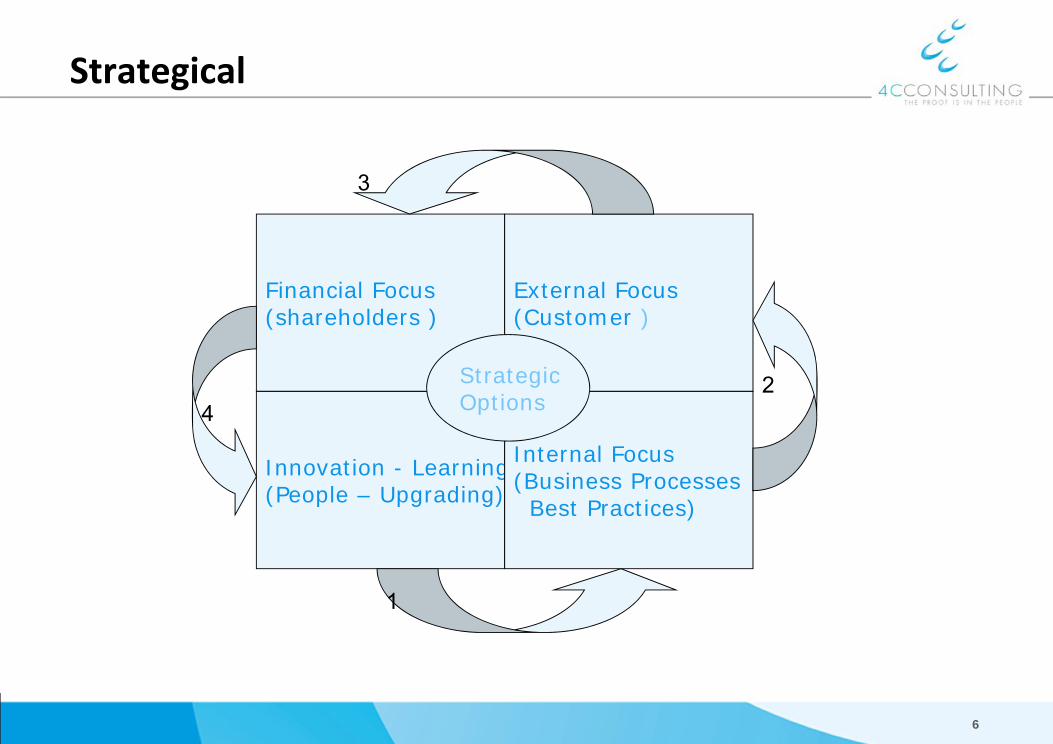
Strategical
6
Financial Focus(shareholders )
External Focus(Customer )
Innovation - Learning(People – Upgrading) )
Internal Focus(Business Processes
Best Practices)
StrategicOptions4
1
2
3

How
7
FINANCIAL CUSTOMER
Gross Margin Turnover reliability Perception
ROI Rotation Client NewCapital retention customers
Quality ShortenCoachint Lead times Reduce
Technical Sugestions to StocksKnowledge improve Avoid
process disturband ReduceEmpowerment costs
QualityPEOPLE INTERNAL
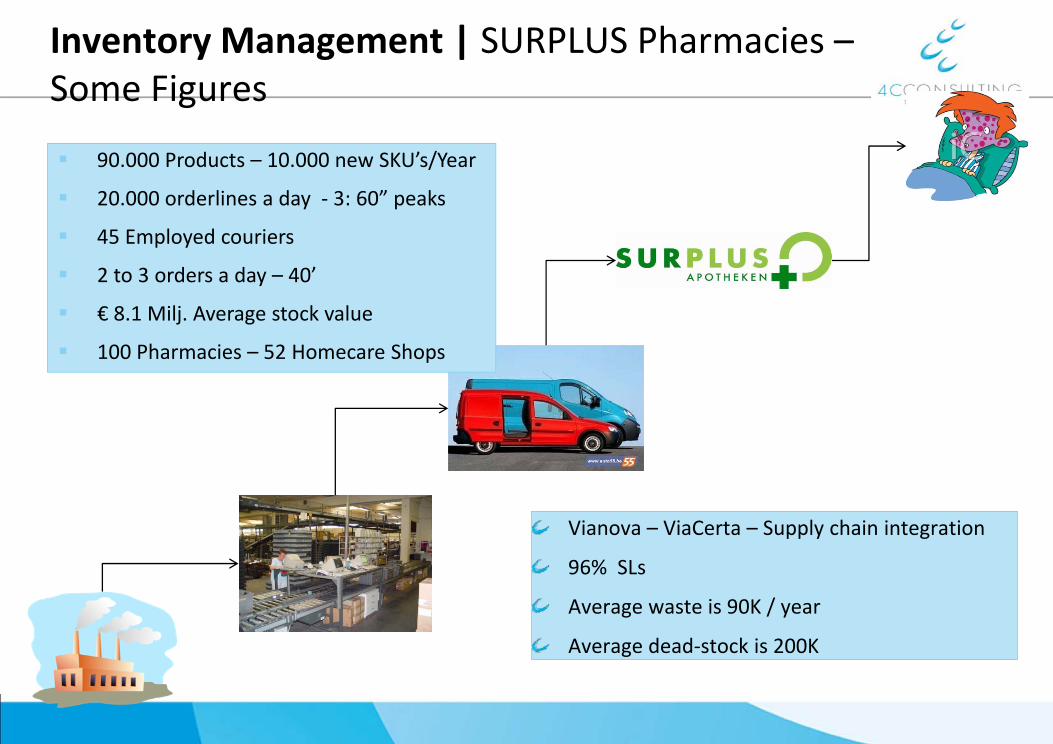
Inventory Management | SURPLUS Pharmacies –Some Figures
90.000 Products – 10.000 new SKU’s/Year
20.000 orderlines a day ‐ 3: 60” peaks
45 Employed couriers
2 to 3 orders a day – 40’
€ 8.1 Milj. Average stock value
100 Pharmacies – 52 Homecare Shops
Vianova – ViaCerta – Supply chain integration
96% SLs
Average waste is 90K / year
Average dead‐stock is 200K

Inventory Management |Optimization ‐ Solution Characteristics & Impact
Better product availability & customer satisfaction (improve SLs by 3..5%)
Lower Inventory Holding & Handling Cost (10% gain)
Reduce Dead Capital (25 %)
Better Negotiated Manufacturer Pricing
Less Obsolete Products & Dead Stock
More accurate demand forecasting
More pro‐active decision making
Dynamic multi‐echelon inventory management / optimization
Share knowledge / Awareness

2 Project Scope
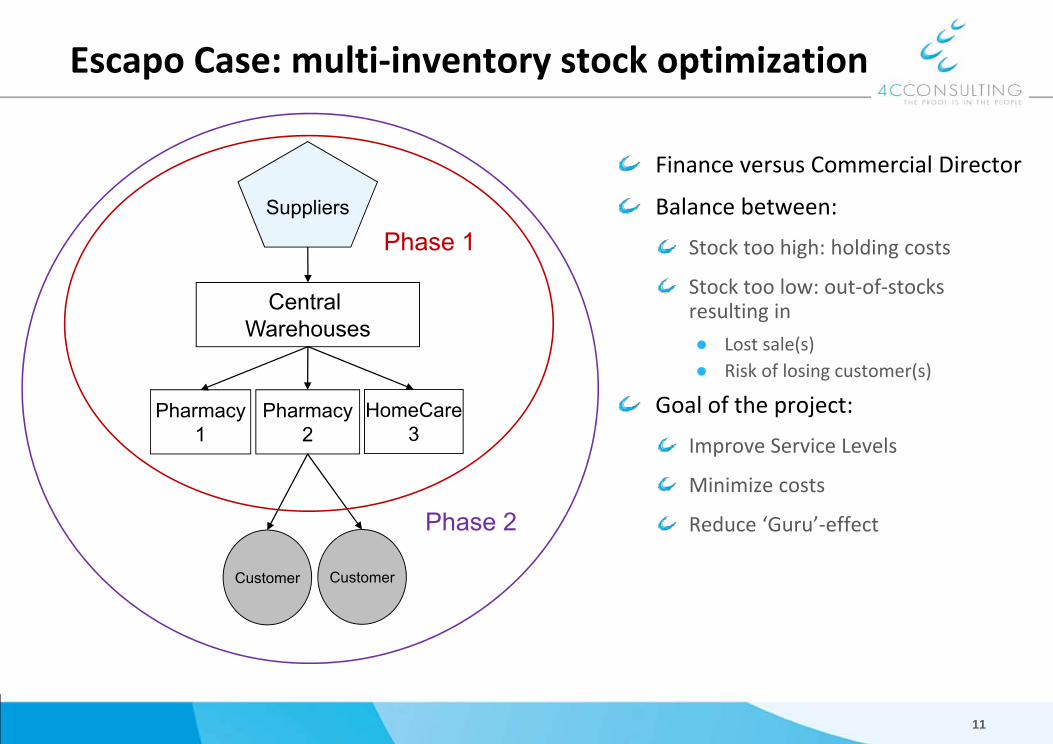
Escapo Case: multi‐inventory stock optimization
11
Suppliers
Central Warehouses
Pharmacy1
Pharmacy2
HomeCare3
CustomerCustomer
Phase 1
Phase 2
Finance versus Commercial Director
Balance between:
Stock too high: holding costs
Stock too low: out‐of‐stocks resulting in
● Lost sale(s)● Risk of losing customer(s)
Goal of the project:
Improve Service Levels
Minimize costs
Reduce ‘Guru’‐effect
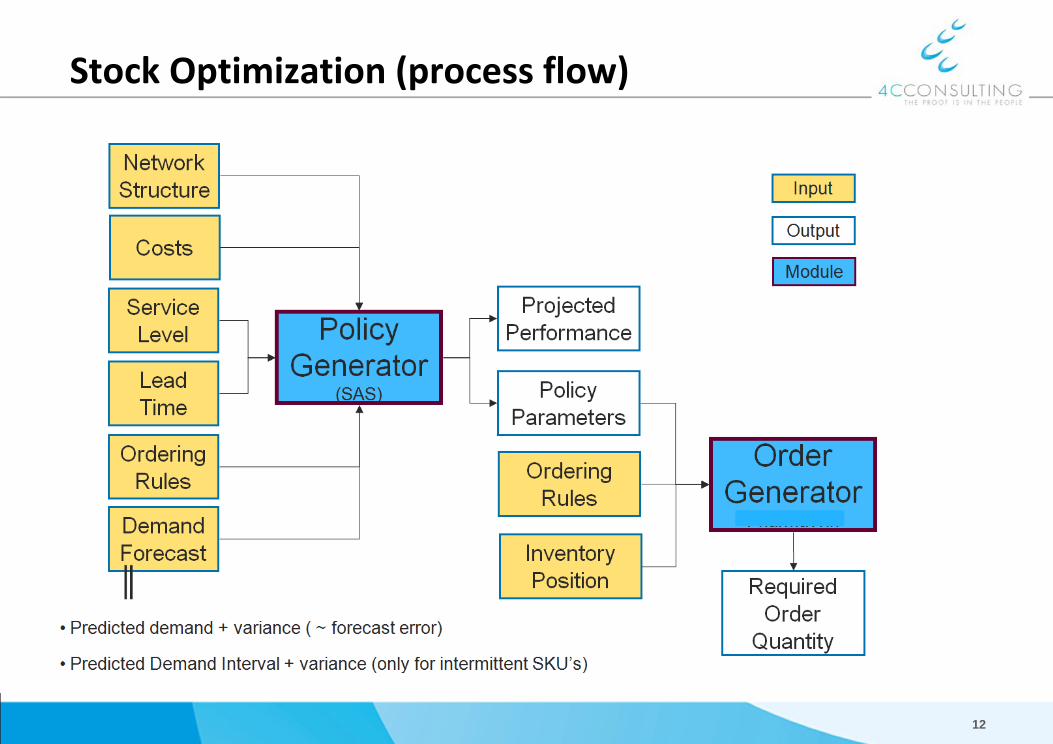
Stock Optimization (process flow)
12

3 Introduction 4C Consulting
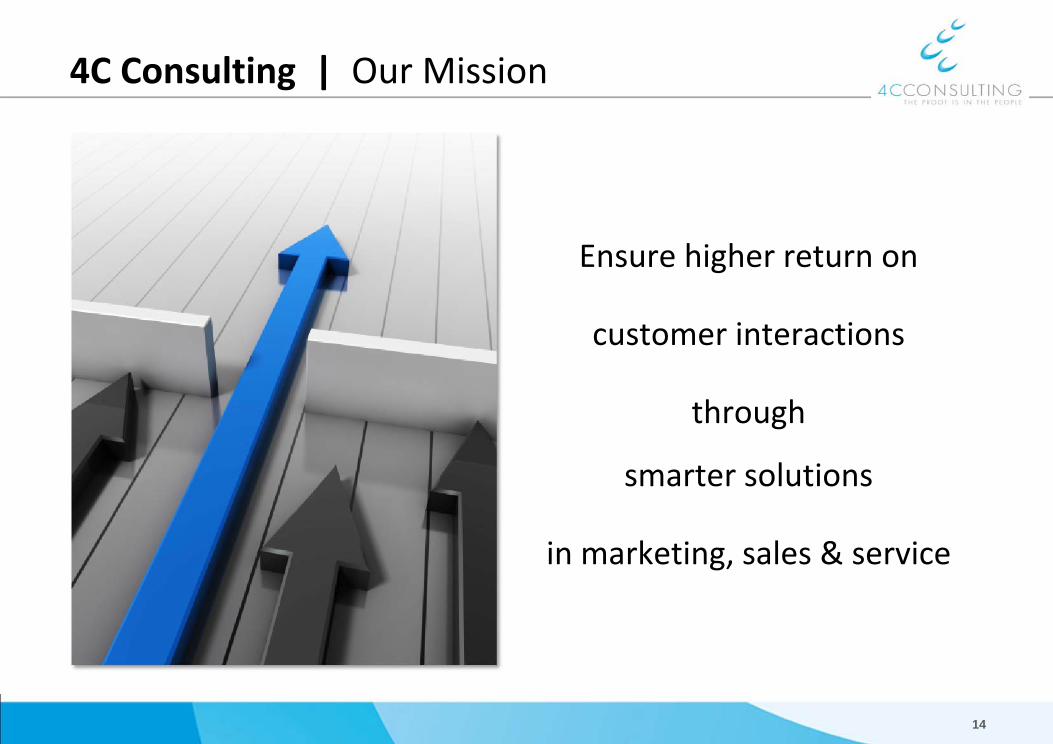
4C Consulting | Our Mission
Ensure higher return on
customer interactions
through
smarter solutions
in marketing, sales & service
14
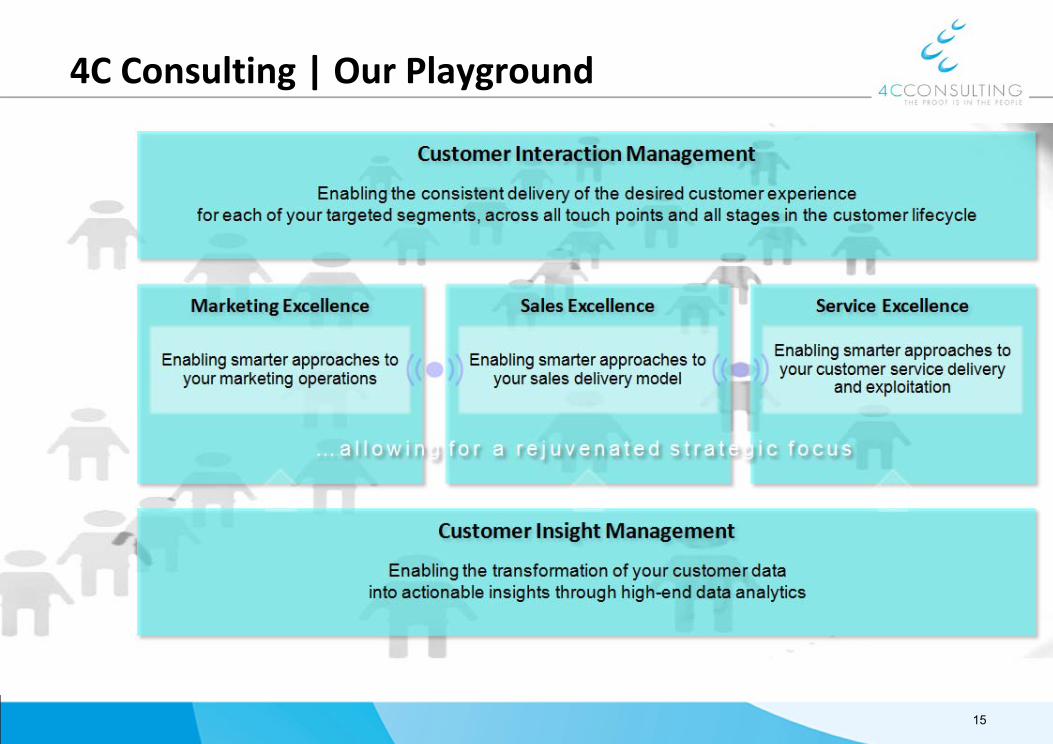
4C Consulting | Our Playground
15

4C Consulting | How do we do it ?
16
Customer Interaction Management
Customer Insight Management
Marketing Excellence Sales Excellence Service Excellence
Consulting Outsourcing Interim Mgmt Staffing
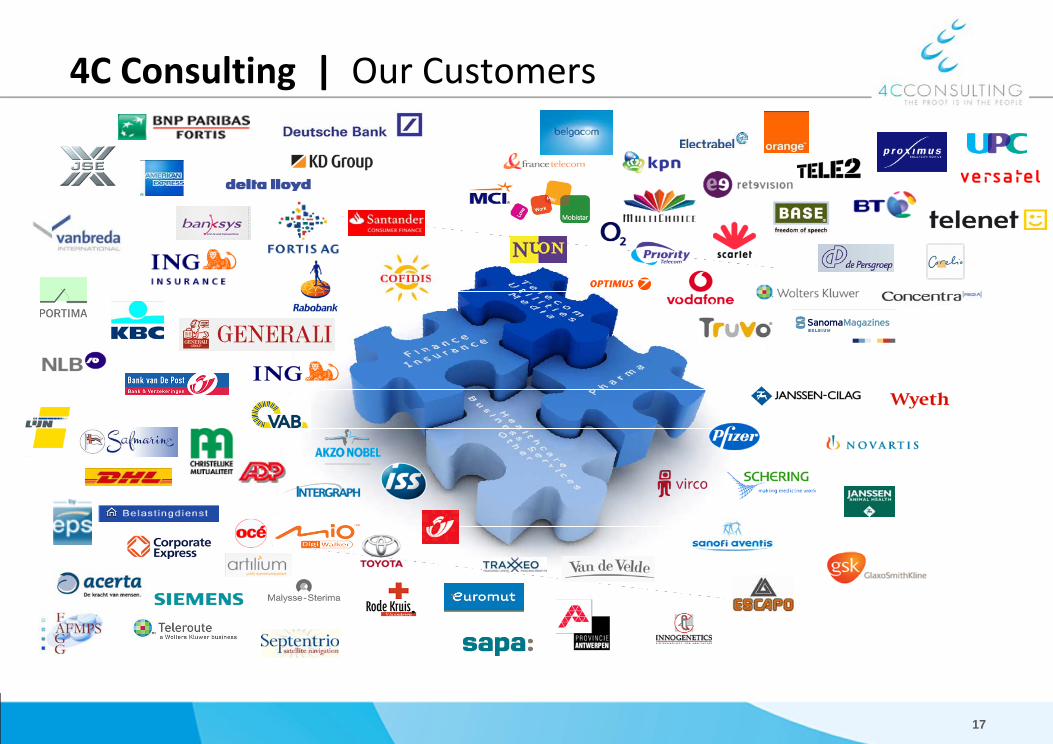
4C Consulting | Our Customers
17
4 Stock Optimization

Using demand forecasting...
Blue = real values; green = model
• Slow movers versus fast movers
• Based on historical data
• Model evaluation through statistics

20
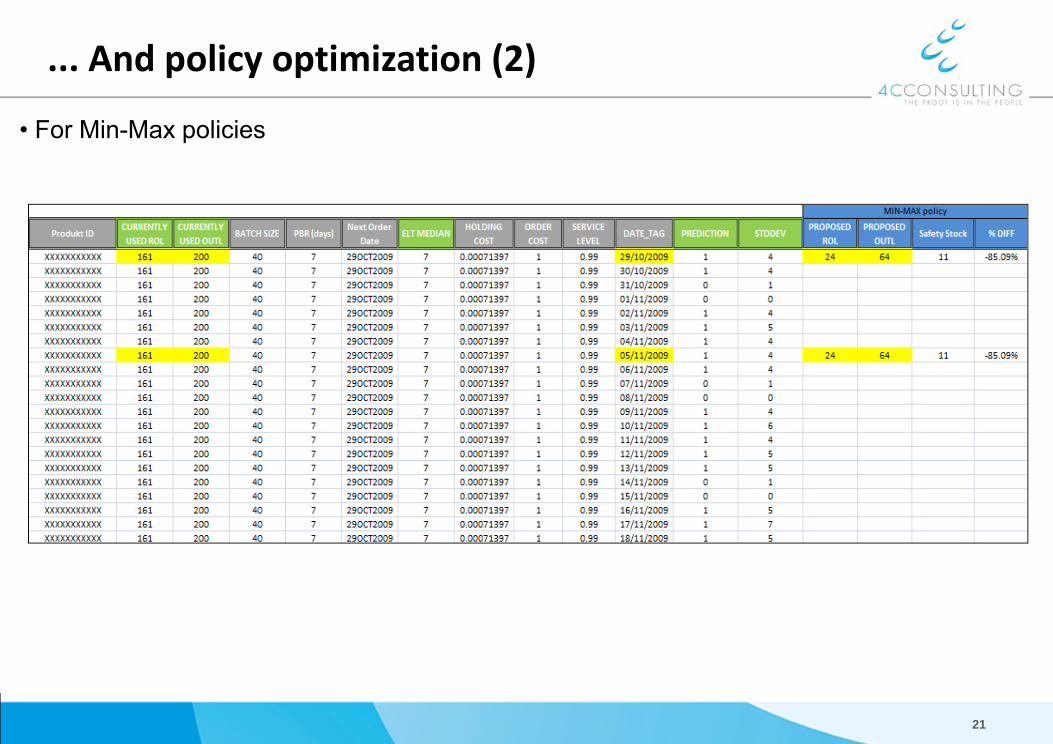
... And policy optimization
0
100
200
300
400
500
600
700Inventory Level
• For Base-Stock policies
21
• For Min-Max policies
... And policy optimization (2)

Stock Management Application
22
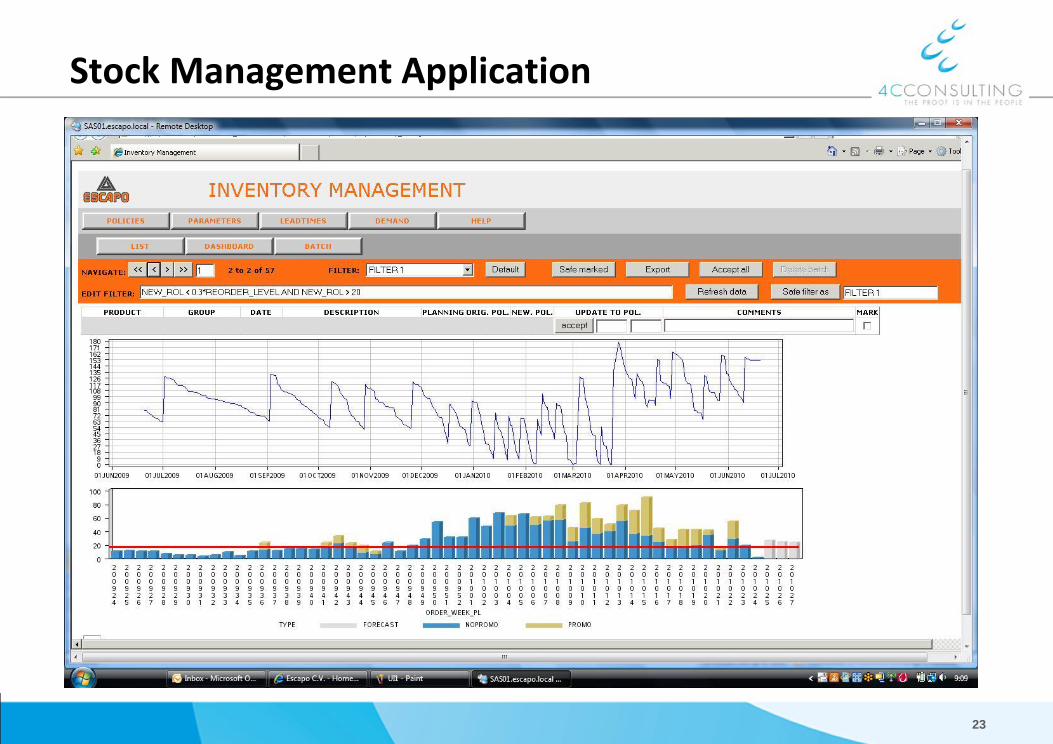
Stock Management Application
23

5 Results

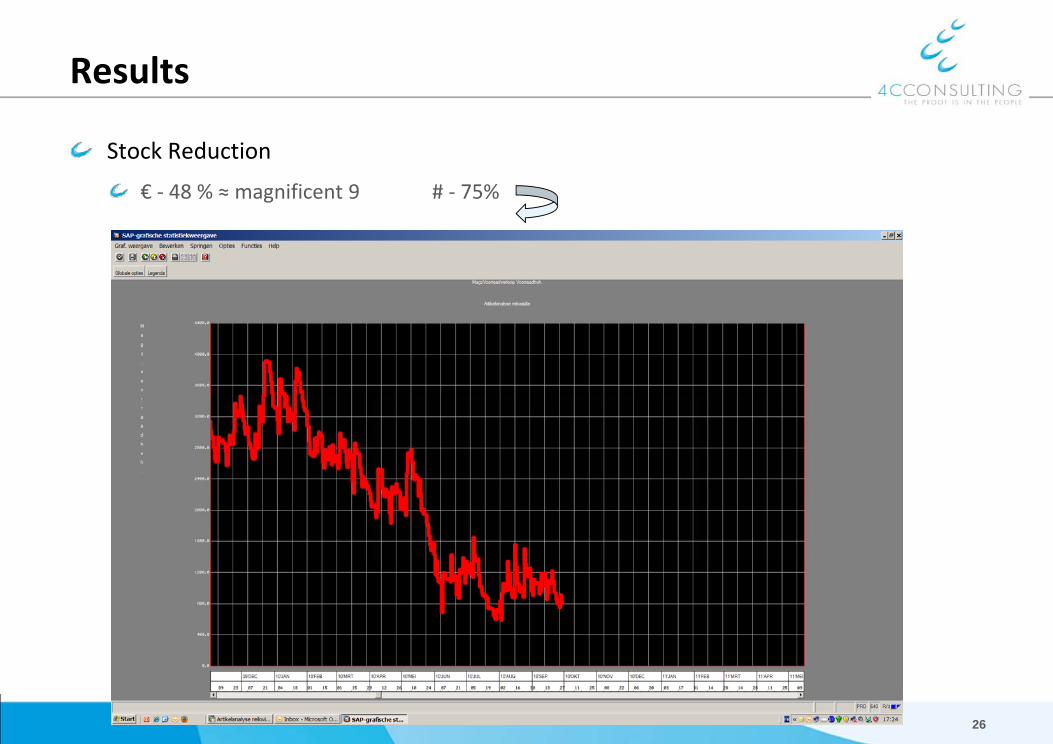
Results
Stock Reduction
€‐ 15 % ≈ 1.200.000 € all SKU’s$
€ ‐ 27 % ≈ Top 100 in # ‐ 40 %
25
Results
Stock Reduction
€ ‐ 48 % ≈ magnificent 9 # ‐ 75%
26

Results
Stock Rotation
26 days 18 days coverage
0,5 % SKU’S 25% Turnover 9 days coverage
85 % SKU’s Intermittencie
27
0
0,5
1
1,5
2
2,5
3
jan/10 feb/10 mrt/10 apr/10 mei/10 jun/10 jul/10 aug/10 sep/10 okt/10 nov/10 dec/10

Results
Service Level
From 96 % 97,4 %
Despite of higher supplier unreliability
28
858687888990919293949596979899100
do 0
1 ja
n 20
09
zo 0
1 fe
b 20
09
zo 0
1 m
rt 20
09
wo
01 a
pr 2
009
vr 0
1 m
ei 2
009
ma
01 ju
n 20
09
wo
01 ju
l 200
9
za 0
1 au
g 20
09
di 0
1 se
p 20
09
do 0
1 ok
t 200
9
zo 0
1 no
v 20
09
di 0
1 de
c 20
09
vr 0
1 ja
n 20
10
ma
01 fe
b 20
10
ma
01 m
rt 20
10
do 0
1 ap
r 201
0
za 0
1 m
ei 2
010
di 0
1 ju
n 20
10
do 0
1 ju
l 201
0
zo 0
1 au
g 20
10
wo
01 s
ep 2
010
vr 0
1 ok
t 201
0
%
Servicelevel Met en zonder Supplier Rating
Poly. (% excl OL) Poly. (% incl OL)

Results
29

6 Next Steps
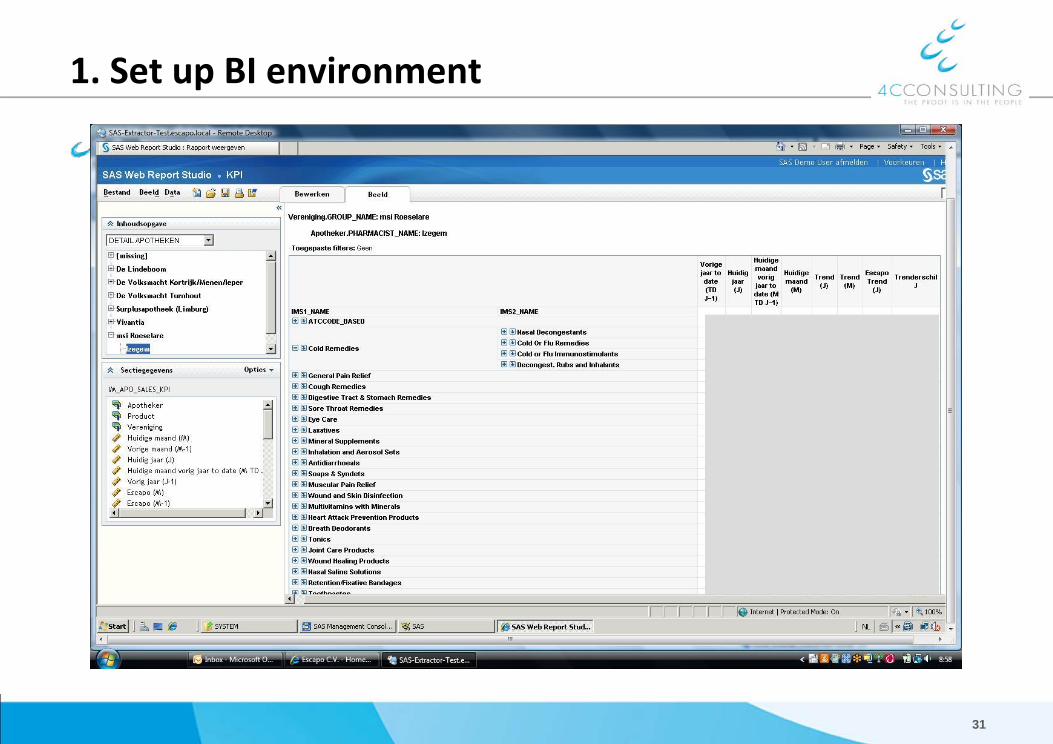
1. Set up BI environment
Screenshot oefening reporting voor TZW
31

2. Stock optimization Pharmacies and TZW
32
Suppliers
Central Warehouse
Pharmacy1
Pharmacy2
Pharmacy3
CustomerCustomer
Phase 1
Phase 2