eruption of a deep-sea mud volcano triggers rapid sediment...
TRANSCRIPT

ARTICLE
Received 4 Apr 2014 | Accepted 25 Sep 2014 | Published 11 Nov 2014
Eruption of a deep-sea mud volcano triggersrapid sediment movementTomas Feseker1,2, Antje Boetius1,3,4, Frank Wenzhofer3,4, Jerome Blandin5, Karine Olu6,
Dana R. Yoerger7, Richard Camilli7, Christopher R. German7 & Dirk de Beer4
Submarine mud volcanoes are important sources of methane to the water column. However,
the temporal variability of their mud and methane emissions is unknown. Methane emissions
were previously proposed to result from a dynamic equilibrium between upward migration
and consumption at the seabed by methane-consuming microbes. Here we show non-steady-
state situations of vigorous mud movement that are revealed through variations in fluid flow,
seabed temperature and seafloor bathymetry. Time series data for pressure, temperature, pH
and seafloor photography were collected over 431 days using a benthic observatory at the
active Håkon Mosby Mud Volcano. We documented 25 pulses of hot subsurface fluids,
accompanied by eruptions that changed the landscape of the mud volcano. Four major events
triggered rapid sediment uplift of more than a metre in height, substantial lateral flow of muds
at average velocities of 0.4 m per day, and significant emissions of methane and CO2 from the
seafloor.
DOI: 10.1038/ncomms6385 OPEN
1 MARUM—Center for Marine Environmental Sciences and Faculty of Geosciences, University of Bremen, Bremen 28359, Germany. 2 GEOMAR, HelmholtzCentre for Ocean Research Kiel, Kiel 24148, Germany. 3 HGF-MPG Group for Deep Sea Ecology and Technology, Alfred Wegener Institute, Bremerhaven27515, Germany. 4 Max Planck Institute for Marine Microbiology, Bremen 28359, Germany. 5 Ifremer, Institut Carnot EDROME, RDT/SI2M, PlouzaneF-29280, France. 6 Ifremer, Institut Carnot EDROME, REM/EEP, Laboratoire Environnement Profond, Plouzane F-29280, France. 7 Woods HoleOceanographic Institution (WHOI), Woods Hole, Massachusetts 02543, USA. Correspondence and requests for materials should be addressed to D.d.B.(email: [email protected]).
NATURE COMMUNICATIONS | 5:5385 | DOI: 10.1038/ncomms6385 | www.nature.com/naturecommunications 1
& 2014 Macmillan Publishers Limited. All rights reserved.

Submarine mud volcanoes are geologic structures deeplyrooted into the subsurface seafloor, formed by mudexpulsions and associated transport of warm, deep-sourced
fluids and gas, predominantly methane1,2. At high pressures andlow temperatures, methane oversaturation can result in gashydrate formation in sediment pore spaces, which may seal theseafloor against upwardly migrating fluids3. Gas hydrates, hence,may act as a buffer, providing a persistent source of dissolvedmethane to near-surface sediments and fuelling rich and diverseecosystems4,5. Anaerobic and aerobic microbial oxidationconsume the majority of the methane advected to near-surfacesediments, where sulphate and oxygen are available as electronacceptors6,7. However, this microbial filter is less efficient whenthe ascent rates of subsurface fluids are high, as the flux ofelectron acceptors (for example, sulphate) into the sedimentsdecreases1,8. At very high fluid-flow velocities, bubble-forminggaseous methane can bypass the microbial filter within thesediments completely and escape into the overlying watercolumn9,10. Dissolved methane discharge from the seafloor canalso occur when rapid seepage hinders the penetration ofseawater-derived electron acceptors into the sediment11 orwhen methane-oxidizing microorganisms are absent fromfreshly erupted mud1. Consequently, when seepage is vigorousand/or when mud is remobilized, the proportion of the totalmethane flux being oxidized by the microbial filter may be o40%(refs 7,12), depending on upflow rates and frequencies ofdisturbance. The total methane emission from offshore mudvolcanoes into the atmosphere has been estimated at 27 Tg peryear13, but this value has large associated uncertainties, becausethe total number of mud volcanoes worldwide and their temporalvariability with respect to methane emissions are both unknown.Various historical records suggest that eruptions of onshore mudvolcanoes occur with intervals of years to decades14,15. Marinemud volcanism can also be episodic16, but the characteristics andfrequency of eruptions of deep-sea mud volcanoes are not yetdocumented. To investigate the temporal variability of deep-seamud-volcanic activity, we deployed a seafloor observatory for aperiod of 431 days in 2009–2010 at the active Håkon Mosbymud volcano (HMMV), located at 1,250 m water depth on theBarents Sea slope17.
The HMMV is a circular feature of around 1 km in diameterwith a shallow relief of o10 m above the surrounding seafloor.Extremely high geothermal gradients of 425 �C m� 1 in theupper metre of the seafloor of the northern part of the mudvolcano’s centre indicate high upward fluid flow rates18 of 44 mper year above the deeply rooted mud volcano chimney17. There,a central, flat area of soft, rippled muds is surrounded by moreconsolidated muds covered by bacterial mats, and a hummockyring of hydrate-bearing mounds covered by siboglinidtubeworms19. The concentric structure of these habitats hasbeen attributed to a gradient in seepage rates8, from the centralupflow pipe to the outer rim, of 5–o0.1 m per year. Across themud volcano and particularly in the hummocky periphery, gashydrates are abundant, and gas ebullition from the seabed hasbeen observed frequently, resulting in large gas flares that can bedetected readily in the overlying water column17.
In a large interdisciplinary effort we designed, built anddeployed a device for long-term observations on mud-volcanoeruptions (LOOME). The objective of the LOOME observatorywas to derive a timeline of temperature gradients and mudtransport, combined with seafloor observations that would allowus to test the hypotheses that temperature dynamics, morpho-logical and bathymetrical changes could be related to eruptions ofgas and mud20.
Comparisons of maps made during this project and previousresearch cruises showed drastic topological changes developing
over years. Our LOOME observatory recorded even moresubstantial sediment and fluid dynamics, occurring over days toweeks. Our data provided a basis for a mechanistic understandingof the geological and geochemical activity of this large mudvolcano. We conclude that the amount of escaping methane ismuch larger than previously thought.
ResultsDeployment and site. The LOOME observatory frame with dataloggers was deployed in July 2009 within the peripheral hum-mocky area. Using a remotely operated vehicle, the observatorywas positioned precisely on top of a stable slab, to avoid data lossin the event of any destructive eruptions that might damage theattached instrumentation deployed across the interior of theHMMV ‘caldera’. The location of the frame (Fig. 1;Supplementary Table 1) was B50 m north of the active centre, ofthe HMMV that is characterized by high temperature gradients(Supplementary Fig. 1). The remotely operated vehicle (ROV)QUEST deployed three cables from the LOOME observatoryframe that extended out into the active centre, each with distinctscientific instrumentation connected back to the central dataloggers on the LOOME frame: (1) an 80-cm-long sedimenttemperature lance; (2) a pH sensor and (3) a temperature sensorchain with 24 sensors distributed over 100 m (Fig. 1). A CTDsystem (recording conductivity, temperature and density; Seabird,SBE 911plus) equipped with an additional pressure sensor, as wellas a recording current meter with a turbidity sensor weremounted on the LOOME frame. Two further independentinstrument deployments were implemented as part of ourLOOME observatory efforts: (4) the AIM autonomous under-water video camera21 was installed at the transition facingtowards the active centre in an area of the seafloor covered byabundant microbial mats; (5) a 12-m-long sediment temperaturelance was deployed at the southern transition between the activecentre and the surrounding muds. Surveys by an autonomousunderwater vehicle (AUV), provided continuous spatialobservations complementing shipboard observations in 2010.
Vertical movements. Bottom-water pressure data recorded at theobservatory frame, converted into a time series of water depth atthe seafloor, indicated four major events during 2009 and 2010, asdefined here by a sudden uplift of the seabed at rates between 0.2and 0.7 m h� 1 (Fig. 2c; Supplementary Table 2). The most pro-nounced uplift event, P1 (ca. 0.6 m over 3.5 h), started at12:40 UTC on 27 September 2009. A comparison of imagesrecorded by the underwater video camera pointing towards thecentral mud area at 08:58 UTC and at 20:58 UTC (27 September2009) clearly shows that the seafloor ruptured, indicative ofdeformation associated with the uplift event P1 (Fig. 2a,b).During the following 9 months, three further but smaller upliftevents were recorded. The images did not show resuspension ofsediments in the form of particle clouds. Likewise, the turbiditysensor did not record immediate disturbances at the time of uplift(Supplementary Table 3). Cumulatively, the four major eventsresulted in a total uplift of 1.3 m, but the seafloor also deflatedgradually in between each of those events such that, by August2010, the seafloor had gained only 0.2 m in increased heightcompared with the September 2009 start of our time series.
Horizontal movements. These events, all recorded at the rela-tively stable hummocky area to the north of the active centre,were accompanied by drastic evidence of seafloor dynamics in thecentre of the HMMV. A short temperature lance had beeninserted vertically into the sediment at a location 60 m south ofthe frame, where we expected the highest level of volcanic activity.
ARTICLE NATURE COMMUNICATIONS | DOI: 10.1038/ncomms6385
2 NATURE COMMUNICATIONS | 5:5385 | DOI: 10.1038/ncomms6385 | www.nature.com/naturecommunications
& 2014 Macmillan Publishers Limited. All rights reserved.

When we inspected the instrument on 27 September 2010 prior toits recovery, the lance had been pulled out of the sediment and waslying horizontally on the seafloor (Supplementary Note 1). On 26October 2009, two days after the sudden uplifting event P2, thetemperature signals for all of the sensors along the length of thatlance had decreased to bottom-water temperature levels over aperiod of o3 h (Supplementary Fig. 1). We interpret these resultsto indicate the time and date for the onset of lateral sedimentdisplacement at the centre of the HMMV which, because the lancewas tethered to the fixed LOOME observatory frame, had beenpulled out of the laterally displaced mud until it came to rest onthe HMMV surface. Further support for this inference comes fromour separate visual observation that the similarly cable-tetheredbuckets housing the pH logger and temperature sensors attachedto the LOOME observatory frame had left similar parallel trails inthe surface of the sediment, as if they had been pulled across theseafloor. The cables connecting the various sensors to the loggeron the LOOME observatory frame were all fully stretched(Supplementary Fig. 2). Perhaps most surprising of all, however,was the observation that our 12-m-long temperature lance hadbeen relocated to B165 m south of its deployment position by thetime it was recovered (Fig. 1; Supplementary Fig. 3). This lancewas deployed in 2009 at the southern transition of the activecentre of the HMMV, where it had sunk deep into the soft mudsto about 17 m below the seafloor. Thus it was transported laterallywith a mean velocity of B0.4 m per day over the course of the431-day deployment. The displaced lance remained upright(vertical) relative to the seafloor and operated thoroughlythroughout its transit, successfully recording substantial cooling ofinitially hot surface sediments above a warm (maximum tem-perature 23 �C) layer of mud (Supplementary Fig. 4).
Episodic horizontal movements. The seabed thermistor chainthat covered a 100-m-long N–S transect from the LOOME
observatory frame across the hot central area recorded multipletransient local temperature anomalies (Fig. 3). The three sensorslocated outside the active central area near the observatory frame(T22–T24) recorded background seafloor temperatures between� 0.886 and � 0.657 �C, close to those of local bottom water,throughout the entire time series. In contrast, at the positions ofthe other sensors (T1–T21), temperatures ranged between� 0.057 and 10.931 �C. Distributions of temperature anomaliesobserved along this temperature chain are consistent with aprogressive migration away from the LOOME observatory frame,that is, southwards away from the active centre over the course ofour time series records. Plots of these temporal dynamics insurface seabed temperature along the thermistor chain (distanceof 100 m) reveal a diagonal trend for these anomalies thatwe interpret as lateral transport of warm mud (Fig. 3c;Supplementary Fig. 5). Some of the pronounced anomalies weresustained along the whole length of the string, and indicate adisplacement of 160–200 m over the observation period, provid-ing close independent agreement with the B165-m displacementobserved for the 12-m T-lance (see previous section). Closeinspection of Fig. 3 reveals that this B165 m of movement wasnot continuous and gradual but, rather, occurred as distinctepisodes, separated by longer, static periods (Fig. 3b,c). In total,we have identified evidence for 25 flow events, grouped into 13distinct episodes of sediment movement that each lasted forperiods from 4 h up to B8 days (see Supplementary Table 4).Some of these episodes coincided with phases of elevated tur-bidity signals (Supplementary Table 3; Supplementary Note 2).The sum of the average displacements achieved over these 13episodes, cumulatively, was 280–350 m (sum of the largestdistances of each period from Supplementary Table 4;Supplementary Fig. 5), that is, even further than the observeddisplacement of the 12-m T-lance. Thus, the lateral sedimentvelocity during the entire observation averaged about 0.5–1 m perday across the active centre.
N72°00.3′
N72°00.1′
1,262.5
1,259.7
1,256.8
1,254.0
1,251.2
Depth (m)
F
C
D
T
R
E014°
43.4
′
E014°
43.6
′
E014°
43.8
′
E014°
44.0
′
N
N72°00.2′
Figure 1 | Overview of the deployment area and instruments. (a) Shaded relief map of the central area of the Håkon Mosby mud volcano. The
LOOME observatory frame (F) was positioned north of the centre, where the hummocky seafloor provided a solid base for our long-term instrument
deployment. The seabed thermistor chain (dashed line) with 24 sensor nodes was laid out across the northern part of the active centre. The short
temperature lance and the chemistry logger (T) were placed at the position of the highest geothermal gradient. The camera (C) was placed on the edge of
the central area in a field of abundant microbial mats. The long temperature lance was deployed south of the centre in July 2009 (D) but had moved
165 m further to the south by the time it was recovered in September 2010 (R). Scale bar, 100 m. (b) The LOOME observatory frame before deployment.
The black buckets contained the cables by which the sensors were connected to data loggers mounted on the frame.
NATURE COMMUNICATIONS | DOI: 10.1038/ncomms6385 ARTICLE
NATURE COMMUNICATIONS | 5:5385 | DOI: 10.1038/ncomms6385 | www.nature.com/naturecommunications 3
& 2014 Macmillan Publishers Limited. All rights reserved.

During several displacement events the pH at the surfacedecreased, indicating that mud movement was accompaniedby release of warm CO2-rich subsurface fluids (Fig. 2d,e).Indeed, both methane and CO2 flares were observed in themost active area by the AUV Sentry equipped with thein situ mass spectrometer TETHYS (Supplementary Fig. 6).Unsurprisingly, the spatial distributions of gas flares resultingfrom ebullition of gas bubbles from the seafloor had changedbetween 2009 and 2010. Between 2009 and 2010 the position ofthese flares showed an overall shift in southeasterly directions(Supplementary Fig. 7). Seafloor photography of the active,warm centre showed conspicuous cracks and troughs aswell as distinct mud flows (Supplementary Fig. 3) while similarsurveys of the southward region revealed that the seafloorwas littered with small holes, consistent with the hollowdepressions left behind after gas bubbles had been extrudedthrough and released from these soft, warm sediments(Supplementary Fig. 8).
High-resolution bathymetric maps made in 2003 (Ifremer),2006 (Ifremer) and 2010 (WHOI) indicate that the mud volcanocentre, and especially its warm, elevated northern part, has beendynamic over the past decade20 (Fig. 4a–c). Comparison ofextracted morphologies from north to south across the mudvolcano reveals an irregular increase in height of 0–0.6 m with, inthe most active area (50–150 m along profile), an increase ofB0.25 m (Fig. 4d).
DiscussionOur 1-year deployment of independent sensors recorded episodesof massive lateral mud transport related to the upward flow of hotfluids. The very rapid uplift and slower deflation of the seafloorbelow the observatory can only be explained by rapid expansionof trapped gasses followed by their gradual release, causing theobserved disturbances of seafloor morphology. This is furthercorroborated by the constant temperature in the area close to the
–0.8
–0.6
–0.4
–0.2
0.0
10.09 11.09 07.10 08.10 09.10
Date
50
40
30
20
10
0M
ovem
ent (
m)
Date
pH
8.4
7.6
7.2
6.8
6.4
8.0
P1
Rel
ativ
e w
ater
dep
th (
m)
P2 P3 P4
Aug Oct Dec Feb Apr Jun Aug
Month in 2009/2010
Figure 2 | Observations of seafloor disturbances. Still images taken from video footage collected by the AIM seabed camera system recorded on 27
September 2009 at (a) 08:58 and (b) 20:58 UTC (copyright Ifremer-AIM). Field of view in parts (a) and (b) is approximately 1 m. (c) Time series of water
depth at the location of the LOOME observatory frame (Fig. 1). Variations in bottom-water pressure revealed four rapid uplifting events (P1–P4), which were
each followed by slower subsidence. The solid black line presents the running mean for a time-window of 1 week. (d,e) Drift-calibrated in situ pH dynamics
(see Methods section), the red symbols indicate timing and distance of sediment movements (Supplementary Table 4).
ARTICLE NATURE COMMUNICATIONS | DOI: 10.1038/ncomms6385
4 NATURE COMMUNICATIONS | 5:5385 | DOI: 10.1038/ncomms6385 | www.nature.com/naturecommunications
& 2014 Macmillan Publishers Limited. All rights reserved.
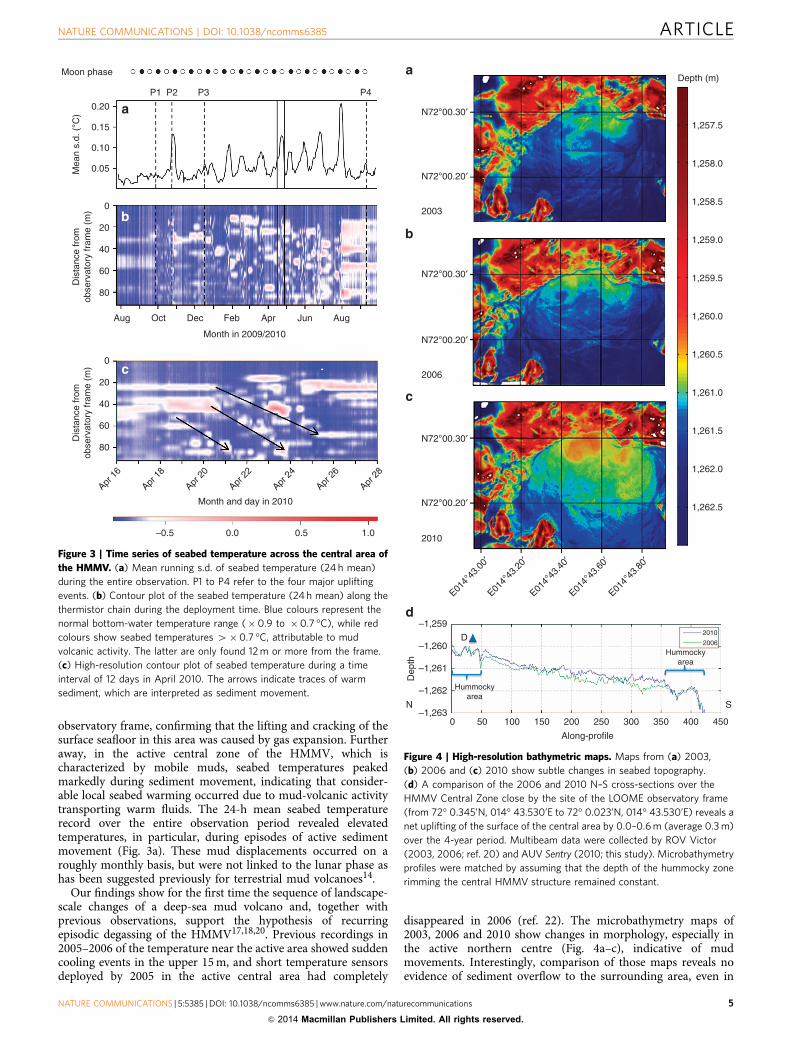
observatory frame, confirming that the lifting and cracking of thesurface seafloor in this area was caused by gas expansion. Furtheraway, in the active central zone of the HMMV, which ischaracterized by mobile muds, seabed temperatures peakedmarkedly during sediment movement, indicating that consider-able local seabed warming occurred due to mud-volcanic activitytransporting warm fluids. The 24-h mean seabed temperaturerecord over the entire observation period revealed elevatedtemperatures, in particular, during episodes of active sedimentmovement (Fig. 3a). These mud displacements occurred on aroughly monthly basis, but were not linked to the lunar phase ashas been suggested previously for terrestrial mud volcanoes14.
Our findings show for the first time the sequence of landscape-scale changes of a deep-sea mud volcano and, together withprevious observations, support the hypothesis of recurringepisodic degassing of the HMMV17,18,20. Previous recordings in2005–2006 of the temperature near the active area showed suddencooling events in the upper 15 m, and short temperature sensorsdeployed by 2005 in the active central area had completely
disappeared in 2006 (ref. 22). The microbathymetry maps of2003, 2006 and 2010 show changes in morphology, especially inthe active northern centre (Fig. 4a–c), indicative of mudmovements. Interestingly, comparison of those maps reveals noevidence of sediment overflow to the surrounding area, even in
Moon phaseM
ean
s.d.
(°C
)D
ista
nce
from
obse
rvat
ory
fram
e (m
)D
ista
nce
from
obse
rvat
ory
fram
e (m
)P1 P2 P3 P4
0.20
0.15
0.10
0.05
0
20
40
60
80
0
20
40
60
80
Month in 2009/2010
Oct Dec Feb Apr Jun AugAug
0.0–0.5 0.5 1.0
Apr 1
6
Apr 1
8
Apr 2
0
Apr 2
2
Apr 2
4
Apr 2
6
Apr 2
8
Month and day in 2010
Figure 3 | Time series of seabed temperature across the central area of
the HMMV. (a) Mean running s.d. of seabed temperature (24 h mean)
during the entire observation. P1 to P4 refer to the four major uplifting
events. (b) Contour plot of the seabed temperature (24 h mean) along the
thermistor chain during the deployment time. Blue colours represent the
normal bottom-water temperature range (�0.9 to �0.7 �C), while red
colours show seabed temperatures 4�0.7 �C, attributable to mud
volcanic activity. The latter are only found 12 m or more from the frame.
(c) High-resolution contour plot of seabed temperature during a time
interval of 12 days in April 2010. The arrows indicate traces of warm
sediment, which are interpreted as sediment movement.
N72°00.30′
N72°00.20′
N72°00.30′
N72°00.20′
N72°00.30′
N72°00.20′
2003
Depth (m)
1,257.5
1,258.0
1,258.5
1,259.0
1,259.5
1,260.0
1,260.5
1,261.0
1,261.5
1,262.0
1,262.5
D
S
–1,259
–1,260
–1,261
–1,262
–1,263N
0 50 100 150 200 250 300 350 450400
Along-profile
Hummockyarea
Hummockyarea
2010
2006
Dep
th
2006
2010
E014°
43.0
0′
E014°
43.2
0′
E014°
43.4
0′
E014°
43.6
0′
E014°
43.8
0′
Figure 4 | High-resolution bathymetric maps. Maps from (a) 2003,
(b) 2006 and (c) 2010 show subtle changes in seabed topography.
(d) A comparison of the 2006 and 2010 N–S cross-sections over the
HMMV Central Zone close by the site of the LOOME observatory frame
(from 72� 0.345’N, 014� 43.530’E to 72� 0.023’N, 014� 43.530’E) reveals a
net uplifting of the surface of the central area by 0.0–0.6 m (average 0.3 m)
over the 4-year period. Multibeam data were collected by ROV Victor
(2003, 2006; ref. 20) and AUV Sentry (2010; this study). Microbathymetry
profiles were matched by assuming that the depth of the hummocky zone
rimming the central HMMV structure remained constant.
NATURE COMMUNICATIONS | DOI: 10.1038/ncomms6385 ARTICLE
NATURE COMMUNICATIONS | 5:5385 | DOI: 10.1038/ncomms6385 | www.nature.com/naturecommunications 5
& 2014 Macmillan Publishers Limited. All rights reserved.

the flat south-eastern edge of the HMMV (Fig. 1; see also maps inFoucher et al.20). In summary, such mud movements must beepisodically recurring events, yet there are no signs of massiveaccumulations of mud in the HMMV, and there is no evidence ofmud flow to the outside of the volcano. Instead, volume isapparently conserved which, consequently, requires that themassive upward and lateral mud movements that we haverecorded must be accompanied by an equal and oppositerecycling of mud volume within the HMMV mud chamber17,for example, through the sinking of degassed and cooled sedimentlayers (Supplementary Fig. 4)—which, therefore, would berelatively dense—at the outer periphery of the HMMV.
Seismic signatures recorded in 2005 and 2006 suggest thattransport and expansion of methane can cause a significantlylower density in the deep subsurface mud chamber fuelling thecentral chimney of the mud volcano when compared with theoverlying and surrounding sediments17. A temporary increase ingas supply from the root of the HMMV could lead to unstabledensity gradients, and a rapid upward transport of warm, gassymuds. Such events could dissociate the gas hydrates that areusually present at the surface of the HMMV as it is cooled by theoverlying cold bottom water. The slope of the HMMV surface hasan overall gradient of 0.3 m per 100 m. While hydrates shouldstabilize the surface muds during quiescent periods23,24, anyhydrate destabilization and expansion of gas by warming wouldbe expected to lead to a substantial bulging of the seafloor, whichcould then, in turn, result in the lateral sliding of mud down-slopefrom north to south. Such a mechanism would explain both thesouthward movements of warm muds as recorded by thethermistor chain and the displacement of the thermal lance.The lance was positioned vertically into the sediment over a depthhorizon of 8–20 m below the seafloor during the wholedeployment period which, therefore, requires that aconsolidated slab of mud of at least 20 m in thickness wasdisplaced southward, intact, over a distance of at least 165 m.This, in turn, must have been resupplied by fresh, gassy mudexpelled at the centre of the active zone. Comparing mapsgenerated in 2006 with those acquired during the recovery cruisein 2010, we estimate the width of the mobile area to be B200 m(Fig. 4d), equivalent to a mobile volume of the order of660,000 m3 of gassy mud (calculated as 20� 165� 200 m).Extrapolating the overall uplift of the seafloor bathymetry(Fig. 3) by an average of 0.3 m between 2006 and 2010 to theentire centre area of the mud volcano (200,000 m2) results in avolume increase in 4 years of only 60,000 m3, that is, o10% of theestimated volume that moved in 2009–2010. We do not excludethe possibility that processes active in the volcano could also expelsubsurface porewaters, which would reduce the estimated amountof gas required to elevate the sediments. Indeed, the pHanomalies recorded in the HMMV sediments argue for anenhanced expulsion of rather acidic porewater7,8 during sedimentmovement. While porewater flow in the central area can reachupward flow velocities of several metres per year2,8,18, the upliftwe have recorded here was much faster, up to 60 cm in a fewhours—that is, three orders of magnitude faster than porewatermovements could achieve. Consequently, we conclude that mostof the uplift we report here must have been gas driven.
Over the entire period four very rapid uplift events wererecorded, totalling 1.3 m, accompanied by release of gas from thesediment and each followed by seafloor subsidence. It should benoted that the active central HMMV area may have experiencedeven more uplift than recorded at the location of the LOOMEobservatory frame situated on the hummocky terrain at theNorthern edge of the HMMV. For example, Fig. 4 shows thatareas 175–350 m south of the frame became more elevated thanthe hummocky area, where the frame was positioned and where
the vertical dynamics were registered. With the assumption thatthese events were mostly gas driven, we can estimate a gasexpansion of 1.3 m3 m� 2 of seafloor. Most of this gas was likelysupplied through upward fluid advection from the deep subsur-face, but in part it may also have originated from destabilizationof gas hydrates located within the upper sediment layers.Applying this unit volume of gas expansion and extrapolating itto cover the whole of the displaced/elevated mud area(165� 200 m), would imply a release of 43,000 m3 of methaneat 120 atm (the in situ pressure at the seafloor at the HMMV),which is equivalent to 2� 108 mol of methane gas. In earlier workit was estimated that 8–35� 106 mol of methane escape fromHMMV per year in the form of gas bubbles released from singlestreams25, an estimate that does not include recurrent eruptionsof the kind documented here. For example, if eruptions were tooccur at a frequency of one eruptive event per year with the samemagnitude that we describe here, the total annual methane releasefrom the HMMV mud volcano would be an order of magnitudehigher than all previous estimates. In comparison, the sum of thebiological removal rates for methane released at HMMV, byaerobic and anaerobic oxidation, is only 5–15� 106 mol peryear7. Thus, from our new calculations, we would predict thato3% of the total methane released from the HMMV might beoxidized at or beneath the seafloor. Thus the vast majority of themethane released escapes into the overlying water column and,potentially, the atmosphere20,24,25.
Of course, we cannot be completely certain of the total area ofseafloor uplifted, whether the average elevation of 1.3 m reportedhere is typical of such an event, and what the frequency ofrecurrence might be for the events observed here. Consequently,our calculations on the amounts of released gas must be consideredas an indicative/illustrative first approximation. However, our coreconclusions—that much more methane gas is released from theHMMV than had previously been appreciated and that only a verysmall fraction of the total methane flux might be microbiallymediated and mitigated in the upper sediments—agree closely withthe identical isotope compositions observed for methane bothwithin HMMV hydrates and in dissolved methane sampled in theoverlying watercolumn24. Moreover, the sporadic extrusion ofsubsurface muds onto the mud volcano centre is likely to createmajor disturbances to the benthic communities present, asevidenced from the seabed photography surveys completedduring our mission (Supplementary Fig. 3). Such perturbations tothese ecosystems will inhibit the development of efficientlymethane-consuming microbial communities in the area of highestmethane fluxes. Because anaerobic methane-oxidizing consortiaonly grow very slowly, re-establishing such a microbial filter onfreshly expelled mud may require months to years—that is, overtimescales that may be comparable to or even longer than theintervals anticipated between successive eruption events26.Therefore, we hypothesize that recurrent eruption events at deep-water mud volcanoes such as HMMV may represent significantpreviously overlooked sources for dissolved methane release to thehydrosphere; these require further evaluation through continuouslong-term observations.
MethodsObservatory design. The LOOME observatory comprised sensors for the sub-surface, the seabed and the water column. The frame was a platform measuring2� 2 m, which carried two CTDs, a horizontal-looking sonar and a recordingcurrent meter with a turbidity sensor (Aanderaa, Norway). The current meter datashowed that the LOOME frame was positioned upstream of the active centre(Supplementary Table 3). Data loggers for the short temperature lance, the seabedthermistor chain and six chemical sensors including pH were mounted on theframe. After the deployment by winch on 24 July 2009 during the R/V Polarsternmission ARKXXIV-2, the observatory was positioned precisely using the ROVQUEST (MARUM), and the cabled sensors were installed at selected locations in
ARTICLE NATURE COMMUNICATIONS | DOI: 10.1038/ncomms6385
6 NATURE COMMUNICATIONS | 5:5385 | DOI: 10.1038/ncomms6385 | www.nature.com/naturecommunications
& 2014 Macmillan Publishers Limited. All rights reserved.

the central area of the HMMV (Fig. 1). The AIM underwater camera (Ifremer) andthe long temperature lance (Ifremer) were autonomous instruments, and deployedseparately, the camera by ROV and the temperature lance by the ship winch. Theobservatory frame and the camera were recovered on 28 September 2010 duringthe R/V Maria S. Merian expedition MSM16/1 by connecting the ship’s wire to theinstruments using the ROV Genesis (Ghent University). The long temperaturelance was recovered in the same way on 30 September 2010. Upon recovery of theLOOME observatory frame it was discovered that one of the two CTDs, thehorizontal-looking sonar and five of the six chemical sensors had suffered fromtechnical failures and had not recorded any data. All positions of the instrumentsand their metadata are deposited at the international Earth system data basePANGAEA27. Supplementary Table 1 shows the deployment and recoverypositions of the LOOME observatory instruments discussed here.
Pressure and seafloor elevation. Pressure time series at the position of theLOOME frame were obtained independently from pressure sensors integrated intothe CTD and into the data logger connected to the short temperature lance,respectively. The sampling interval was 20 min for both instruments. The twosensors showed a mean offset of 16.2 dbar, which was attributed to a calibrationoffset of the CTD. The deviations of the offset-corrected data ranged between� 0.12 and 0.13 dbar. The analyses shown here were based on the data obtained bythe Keller PA 8 200 pressure sensor integrated into the data logger, which wascalibrated to a precision of ±0.05 dbar prior to deployment.
After subtracting the standard atmospheric pressure of 1,013.25 mbar, thepressure time series was converted to depth17 for the latitude of 72�N and detidedby subtracting tide heights modelled for the position of the HMMV using theTPXO7.1 global inverse tide model18. The resulting depth time series rangesbetween 1,256.7 and 1,257.6 m with a mean depth of 1,257.2 m, which is inreasonable agreement with the water depth at the position of the LOOME frame of1,256.3 m, according to the micro-bathymetric map from 2006 (ref. 19).
Underwater video camera. The deep-sea video camera AIM (Ifremer)21 wasprogrammed to record two video clips of 2 min each per day. The battery wasdepleted in December 2009. For Fig. 2, two stills were extracted from the videos08:58 and 20:58, 27 September 2009.
Long sediment temperature lance. On 26 July 2009, we deployed a 12-m-longgravity corer equipped with autonomous temperature loggers mounted on out-riggers to obtain in situ sediment temperature measurements from deeper layers ofthe mud volcano. The total weight of the instrument including the weight on thecorer head is B1,000 kg. A 20-m-long rope with a buoy was attached to the corerhead to facilitate the recovery of the instrument. Connected to the ship’s wire via anacoustic release, the instrument was lowered until a decrease of the load indicatedthat it had penetrated the seafloor, then it was released. The positioning wascontrolled via an Ultra Short Baseline system (USBL) and verified by ROV. Theentire lance sank into the muds to a depth of 20 m, so that only the rope withfloatation was visible at the seafloor. The instrument was recovered on 30 Sep-tember 2010 by connecting it to the ship’s wire using the ROV Genesis (U Ghent).
Short sediment temperature lance. In situ temperature data from shallowsediment depths at the active centre of the HMMV were obtained using a shorttemperature lance. The instrument consisted of eight temperature sensors placed10 cm apart at one end of a 60-m-long thermistor chain. The other end of the cablewas connected to a data logger mounted on the observatory frame. The data loggercontained an additional pressure sensor (see above). Attached to a metal rod with afew centimetres distance to the rod, the end of the thermistor chain was insertedvertically into the sediment by an ROV. Both the thermistor chain and the datalogger were manufactured by RBR Ltd., Canada and calibrated to a precision of±1 mK prior to the deployment cruise. Temperature readings were recorded at asampling interval of 20 min.
Seabed thermistor chain. Seabed temperature across the central area was mon-itored using a 100-m-long thermistor chain. Equipped with 24 sensor nodes spaced4 m apart, the thermistor chain covered a 92-m-long transect line from theobservatory frame across the centre. It was deployed as a spool attached to theobservatory frame and laid out on the seabed by ROV QUEST (MARUM). Thedata logger remained on the observatory frame. Both the thermistor chain and thedata logger were manufactured by RBR Ltd. and calibrated to a precision of±1 mK prior to the deployment cruise. Temperature readings were recorded at asampling interval of 20 min. All channels functioned without failure throughoutthe observation.
Chemistry loggers. The six chemistry loggers, manufactured by RBR Ltd., wereeach equipped with a pH, an O2 and an oxygen reduction potential (ORP) sensor.The sensors were calibrated 1 day before deployment. The loggers were connected bya cable to a central logger on the frame to which the data were mirrored. A man-ufacturing mistake caused flooding of five of these loggers. From the surviving
instrument positioned 50 m south of the frame in the active centre, only the pH datacould be extracted. The signals were disturbed by drift and occasional burying intothe sediments. Raw pH data, as deposited in the Pangaea database, were for periodsof interest corrected by second-order polynomials to approximate bottom-watervalues of pH 7.8 as reference8,28.
AUV surveys. The AUV Sentry was operated by the National Deep SubmergenceFacility team from Woods Hole Oceanographic Institution, USA (http://www.whoi.edu/main/sentry). Its navigation system uses a doppler velocity log andinertial navigation system, aided by acoustic navigation systems (USBL or LongBaseline system (LBL)). A Reson 7125 400 khz multibeam sonar was used to obtaina micro-bathymetric map, by surveying in bottom-following mode at a fixedtarget altitude of 20 m along survey lines spaced at 50 m offset intervals. Photo-graphs of the seafloor were collected routinely at altitudes of 3.5–5 m off bottomusing a 1,000� 1,000-pixel down-looking digital still camera.
In situ mapping of water-column methane and carbon dioxide. Besides gas flaremapping with the ship’s echosounder (Supplementary Fig. 7), the TETHYSunderwater mass spectrometer was operated as payload aboard the Sentry AUV.This membrane inlet mass spectrometer has a response time of B10 s27 andminimum limits of detection to o1 part-per-billion on a mole fraction basis28. Forsurvey operations of the HMMV, the mass spectrometer was configured to recordion peak measurements in a selected ion-monitoring mode, continuously cyclingthrough ion peak measurements with an acquisition cycle time of B30 s. Samplewater was introduced to the mass spectrometer by means of a 10-cm length of 6-mm diameter stainless steel tubing with an upturned sample inlet to avoid trappinggas bubbles that conducted sample water from B2 cm away from the AUV’sportside exterior into the mass spectrometer’s sample port inlet. An integratedconductivity temperature and depth sensor (SeaBird FastCat49 CTD) connected inseries to the mass spectrometer’s sample port exhaust provided continuous sampleflow into the inlet at a rate of B2 cm s� 1. Sample water temperature, salinity,water-column pressure and UTC time were recorded by the mass spectrometer atthe start and end of each acquisition cycle. Ion peak and physical water parameterswere then merged with concurrent AUV navigation position estimates (latitude,longitude and altitude) to generate geo-referenced dissolved methane (m/z 15) andaqueous carbon dioxide (m/z 44) measurements (Supplementary Fig. 6). Methaneand carbon dioxide concentrations were recorded while the AUV maintained analtitude of 5 m or less above the seafloor during three grid surveys that were used togenerate spatial maps of benthic water-column methane and carbon dioxideanomalies.
References1. Wallmann, K., Drews, M., Aloisi, G. & Bohrmann, G. Methane discharge into
the Black Sea and the global ocean via fluid flow through submarine mudvolcanoes. Earth Planet. Sci. Lett. 248, 544–559 (2006).
2. Kaul, N., Foucher, J.-P. & Heesemann, M. Estimating mud expulsion rates fromtemperature measurements on Håkon Mosby Mud Volcano, SW Barents Sea.Mar. Geol. 229, 1–14 (2006).
3. Berndt, C. Focused fluid flow in passive continental margins. Phil. Trans. R.Soc. A 363, 2855–2871 (2005).
4. Olu-Le-Roy, K. et al. Cold seep communities in the deep eastern MediterraneanSea: composition, symbiosis and spatial distribution on mud volcanoes. DeepSea Res. Part 1 51, 1915–1936 (2004).
5. Felden, J., Wenzhoefer, F., Feseker, T. & Boetius, A. Transport andconsumption of oxygen and methane in different habitats of the Hakon MosbyMud Volcano (HMMV). Limnol. Oceanogr. 55, 2366–2380 (2010).
6. Boetius, A. et al. A marine microbial consortium apparently mediatinganaerobic oxidation of methane. Nature 407, 623–626 (2000).
7. Niemann, H. et al. Novel methanotrophic communities of the Haakon Mosbymud volcano and their role as methane sink. Nature 443, 854–858 (2006).
8. de Beer, D. et al. In situ fluxes and zonation of microbial activity in surfacesediments of the Håkon Mosby Mud Volcano. Limnol. Oceanogr. 51,1315–1331 (2006).
9. Milkov, A. V., Sassen, R., Apanasovich, T. V. & Dadashev, F. G. Global gas fluxfrom mud volcanoes: a significant source of fossil methane in the atmosphereand the ocean. Geophys. Res. Lett. 30, 1037–1043 (2003).
10. Leifer, I., Luyendyk, B. P., Boles, J. & Clark, J. F. Natural marine seepageblowout: contribution to atmospheric methane. Glob. Biogeochem. Cycles 20,GB3008 (2006).
11. Luff, R. & Wallmann, K. Fluid flow, methane fluxes, carbonate precipitationand biogeochemical turnover in gas hydrate-bearing sediments at HydrateRidge, Cascadia Margin: Numerical modeling and mass balances. Geochim.Cosmochim Acta 67, 3403–3421 (2003).
12. Boetius, A. & Wenzhofer, F. Seafloor oxygen consumption fuelled by methanefrom cold seeps. Nat. Geosci. 6, 725–734 (2013).
13. Etiope, G. & Milkov, A. V. A new estimate of global methane flux from onshoreand shallow submarine mud volcanoes to the atmosphere. Environ. Geol. 46,997–1002 (2004).
NATURE COMMUNICATIONS | DOI: 10.1038/ncomms6385 ARTICLE
NATURE COMMUNICATIONS | 5:5385 | DOI: 10.1038/ncomms6385 | www.nature.com/naturecommunications 7
& 2014 Macmillan Publishers Limited. All rights reserved.

14. Aliyev, A. A., Guliyev, I. S. & Boelov, I. S. Catalogue of Recorded Eruptions ofMud Volcanoes in Azerbaijan (for Period of Years 810–2001) (Nafta Press,2002).
15. Deville, E. & Geurlais, S. H. Cyclic activity of mud volcanoes: evidences fromTrinidad (SE Caribbean). Mar. Petrol. Geol. 26, 1681–1691 (2009).
16. Kopf, A. J. Significance of mud volcanism. Rev. Geophys. 40, 1005–1057 (2002).17. Perez-Garcia, C., Feseker, T., Mienert, J. & Berndt, C. The Håkon Mosby mud
volcano: 330 000 years of focused fluid flow activity at the SW Barents Seaslope. Mar. Geol 262, 105–115 (2009).
18. Feseker, T., Foucher, J.-P. & Harmegnies, F. Fluid flow or mud eruptions?Sediment temperature distributions on the Hakon Mosby mud volcano, SWBarents Sea slope. Mar. Geol 247, 194–207 (2008).
19. Jerosch, K. et al. Spatial distribution of mud flows, chemoautotrophiccommunities, and biogeochemical habitats at Haakon Mosby Mud Volcano.Mar. Geol. 243, 1–17 (2007).
20. Foucher, J.-P. et al. Changes in seabed morphology, mud temperature and freegas venting at the Hakon Mosby mud volcano, offshore northern Norway, overthe time period 2003-2006. Geo-Mar. Lett. 30, 157–167 (2010).
21. Sarrazin, J. et al. in OCEANS ’07 IEEE, Aberdeen, UK. TEMPO: a new ecologicalmodule for studying deep-sea community dynamics at hydrothermal vents.Proceedings No. 061215-061042.
22. Nouze, H. Vicking cruise report: Cold Seeps on the Norwegian Margin, http://www.fiskeridir.no/english/fisheries/marine-scientific-research/soekere-2006/0106/cruise-information-pourquoi-pas-060123 (Ifremer, Brest, 2006).
23. Pape, T., Feseker, T., Kasten, S., Fischer, D. & Bohrmann, G. Distribution andabundance of gas hydrates in near-surface deposits of the Hakon Mosby MudVolcano, SW Barents Sea. Geochem. Geophys. Geosyst. 12, Q09009 (2011).
24. Damm, E. & Budeus, G. Fate of vent-derived methane in seawater above theHåkon Mosby Mud Volcano (Norwegian Sea). Mar. Chem. 82, 1–11 (2003).
25. Sauter, E. J. et al. Methane discharge from a deep-sea submarine mud volcanointo the upper water column by gas hydrate-coated methane bubbles. EarthPlanet. Sci. Lett. 243, 354–365 (2006).
26. Nauhaus, K., Albrecht, M., Elvert, M., Boetius, A. & Widdel, F. In vitro cellgrowth of marine archaeal-bacterial consortia during anaerobic oxidation ofmethane with sulfate. Env. Microbiol. 9, 187–196 (2007).
27. Feseker, T. et al. Eruption of the Håkon Mosby mud volcano recorded by thelong-term observatory on mud-volcano eruptions (LOOME) between 2009 and2010. Pangaea doi:10.1594/PANGAEA.830324 (2014).
28. Lichtschlag, A., Felden, J., Bruchert, V. & Boetius, A. & de Beer, D. Geochemicalprocesses and chemosynthetic primary production in different thiotrophicmats of the Håkon Mosby Mud Volcano (Barents Sea). Limnol. Oceanogr. 55,931–949 (2010).
AcknowledgementsWe thank the chief scientists, captains and crews of the R/V Polarstern expeditionARKXXIV-2 and R/V Maria S. Merian expedition MSM16/2 for their support with workat sea. We also acknowledge the excellent work of the ROV teams QUEST (MARUMUniversity Bremen) and GENESIS (University Gent), as well as of the AUV team Sentry(WHOI), and FIELAX data services. This study has been supported by the LOOMEdemonstration project of the EU 6th FP programme ESONET (EC No. 036851) and theEU 7th FP programme HERMIONE (EC No. 226354). We thank the LOOME projectteam including Volker Asendorf, Janine Felden, Benedicte Ferre, Francois Hermignies,Jean-Paul Foucher, Julien Legrand, Jurgen Mienert, Volker Rathmeyer, Michael Schluter,Marc Viehweger, Christoph Waldmann and Stephane Dentrecolas. We also thankThomas Pape and Christian Winter of MARUM for discussions. Participation of theSentry AUV and TETHYS team from WHOI was funded by the Arctic ResearchInitiative of WHOI’s Ocean and Climate Change Institute and the NASA ASTEP grantNNX09AB76G. Additional funds were made available by the AWI, the Max PlanckSociety and the DFG METEOR/MERIAN programme, as well as the Leibniz programmeto A.B.
Author contributionsD.d.B. with the LOOME team conceived and designed the experiments. All co-authorsperformed the experiments. T.F., A.B., D.R.Y. and D.d.B. analysed the data. J.B., K.O.,F.W. and R.C. contributed observations. T.F., A.B., C.G. and D.d.B. co-wrote the paperwith input from all co-authors.
Additional informationSupplementary Information accompanies this paper at http://www.nature.com/naturecommunications
Competing financial interests: The authors declare no competing financial interests.
Reprints and permission information is available online at http://npg.nature.com/reprintsandpermissions/
How to cite this article: Feseker, T. et al. Eruption of a deep-sea mud volcano triggersrapid sediment movement. Nat. Commun. 5:5385 doi: 10.1038/ncomms6385 (2014).
This work is licensed under a Creative Commons Attribution 4.0International License. The images or other third party material in this
article are included in the article’s Creative Commons license, unless indicated otherwisein the credit line; if the material is not included under the Creative Commons license,users will need to obtain permission from the license holder to reproduce the material.To view a copy of this license, visit http://creativecommons.org/licenses/by/4.0/
ARTICLE NATURE COMMUNICATIONS | DOI: 10.1038/ncomms6385
8 NATURE COMMUNICATIONS | 5:5385 | DOI: 10.1038/ncomms6385 | www.nature.com/naturecommunications
& 2014 Macmillan Publishers Limited. All rights reserved.