erosion control and removal of suspended soil particles in ponds
TRANSCRIPT

EROSION CONTROL AND REMOVAL OF SUSPENDED SOIL PARTICLES IN
PONDS: EVALUATION OF GEOFABRIC LINERS AND CHEMICAL COAGULANTS
by
Puttitorn Saengrungruang
A dissertation submitted to the Graduate Faculty of
Auburn University
in partial fulfillment of the
requirements for the Degree of
Doctor of Philosophy
Auburn, Alabama
August 4, 2012
Keywords: erosion control, suspended soil particles removal, catfish pond, lined pond, geofabric,
chemical coagulants
Copyright 2012 by Puttitorn Saengrungruang
Approved by
Claude E. Boyd, Chair, Professor of Fisheries and Allied Aquacultures
John W. Odom, Associate Professor of Agronomy and Soils
Yolanda J. Brady, Professor of Fisheries and Allied Aquacultures
Philip L. Chaney, Associate Professor of Geology and Geography

ii
Abstract
In an experiment conducted at the E. W. Shell Fisheries Center, Auburn, Alabama, three
ponds each were lined with a permeable geotextile with 0.090-mm opening sizes, a permeable
geotextile with 0.355-mm opening sizes, or served as unlined, controls. During the 2-yr study,
geotextile liners did not tear or decay. This prevented erosion of the bottom of the ponds stocked
with a high density of channel catfish and aerated nightly. The liners tended to float up in the
water column; the liner with smaller opening sizes floated in all three ponds, while the other liner
floated in only one pond. Fish production, survival, and feed conversion ratio did not differ (P >
0.05) among the control and lined ponds or between liner types. Water quality variables often
differed between lined ponds and control ponds. The greatest difference was higher
phytoplankton abundance in the lined ponds―especially in ponds lined with the less permeable
geotextile – than in the control. This difference was attributed to differences in phosphorus
uptake by bottom soils related to the liners and their permeability. However, in spite of more
phytoplankton growth in lined ponds, the control ponds tended to have higher turbidity because
of erosion of bottoms by aeration.
To investigate phosphorus uptake rate by soil through the geotextiles, six kinds of
geotextile liners with apparent opening sizes ranging from 0.090 mm to 0.84 mm were installed
in separate soil from water in aquaria. Water was treated with 0.75 mg/L of phosphorus from
monopotassium phosphate. Phosphorus concentration did not decline in aquaria without soil,
and all liners reduced the amount of phosphorus removed by the soil. Phosphorus removal by
iii
soil did not differ among liners with opening size < 0.200, but these liners interfered less with
soil phosphorus uptake than did the liner with 0.090-mm opening size. Final phosphorus
concentrations were 0.089 mg/L in the unlined aquaria with soil, 0.397 mg/L for the liner with
0.090-mm openings, and 0.157 to 0.202 mg/L for the liners with larger openings.
Geotextiles can reduce erosion resulting in less turbidity in water. However, fine particles
settle very slowly and may remain suspended almost indefinitely restricting light penetration in
the water column and reducing primary productivity. Particles of three soils – each containing a
different type of clay – settled at different rates. Nevertheless, particles tended to settle faster as
concentration of total dissolved solids (TDS) increased in diluted seawater. In freshwater, total
hardness concentration increased as TDS concentration rose.
Several chemical coagulants were tested for their ability to remove suspended soil
particles. Potassium and sodium chloride were comparatively ineffective for turbidity removal.
Calcium sulfate was more effective than magnesium sulfate in removing turbidity. Aluminum
chloride and sulfate tended to perform better than ferrous sulfate and ferric chloride.
Although there were some differences in effectiveness of coagulants among the types of
soils, calcium sulfate (gypsum), aluminum sulfate (alum), and aluminum chloride appear to have
the greatest potential for use in ponds. Aluminum compounds neutralize alkalinity and cause a
decrease in pH. Treatment rates (mg/L) for aluminum sulfate and aluminum chloride should not
exceed the total alkalinity (mg/L as CaCO3) to avoid low pH. Knowledge of conductivity, total
alkalinity, total hardness, and type of clay mineral suspended in water can be useful in selecting a
suitable coagulant.

iv
Acknowledgements
I would like to thank Dr. Claude E. Boyd for his support, advice and the opportunity to
let me have the great experience to study at Auburn University as his student. I would like to
thank all of my committee members and the outside reader for their time and comment.
Appreciation is extended to June Burns, Mrs. Pornpimon Boyd, William Trimble, and the
Segrest family for their encouragement and support. I would like to thank the faculty and staff of
the Department of Fisheries and Allied Aquacultures and all teachers who have taught me from
the beginning of my education until now. I would also like to give special thanks to my
supervisors and colleagues at my work place in Rajabhat Suan Dusit University. I want to thank
my old friends and new friends during the time spent in Auburn for their help and friendship. I
also extend my gratitude to my gorgeous parents, brothers, husband, and family.

v
Table of Contents
Abstract ........................................................................................................................................ ii
Acknowledgments ....................................................................................................................... iv
List of Tables ............................................................................................................................. vii
List of Illustrations .................................................................................................................... viii
I. INTRODUCTION . ............................................................................................................. 1
II. REVIEW OF LITERATURE ............................................................................................. 4
III. EVALUATION OF TWO, POROUS, GEOTEXTILE LINERS FOR EROSION
CONTROL IN SMALL AQUACULTURE PONDS ....................................................... 24
Abstract ............................................................................................................................ 24
Introduction ...................................................................................................................... 25
Materials and Method ...................................................................................................... 26
Results and Discussion .................................................................................................... 29
Literature Cited ................................................................................................................ 38
IV. PHOSPHORUS REMOVAL BY SOIL SEPARATED FROM WATER BY
PERMEABLE, GEOTEXTILES ...................................................................................... 58
Abstract ............................................................................................................................ 58
Introduction ...................................................................................................................... 59
Materials and Method ...................................................................................................... 59
Results and Discussion .................................................................................................... 60
Literature Cited ................................................................................................................ 62

vi
V. EFFECTS OF WATER QUALITY AND CHEMICAL COAGULANTS ON
SEDIMENTATION OF SUSPENDED SOIL PARTICLES FROM WATER ................ 66
Abstract ............................................................................................................................ 66
Introduction ...................................................................................................................... 67
Materials and Method ...................................................................................................... 68
Results and Discussion .................................................................................................... 71
Literature Cited ................................................................................................................ 80
VI. Conclusions ....................................................................................................................... 92
Literature Cited ................................................................................................................ 96

vii
List of Tables
III. 1. Characteristics of the two, geotextile liner materials as reported by manufacturers ... 41
III. 2. Correlation coefficients for relationships of turbidity, total suspended solids, and
chlorophyll a for pooled data from geotextile-lined and control ponds...................................... 42
III. 3. Grand means for 2008 and 2009 in control ponds and ponds lined with one of two
permeable, geotextiles................................................................................................................. 43
III. 4. Fish production data for 2008 and 2009 in control ponds and ponds lined with one of
two permeable, geotextiles .......................................................................................................... 45
IV. 1. Characteristics of six, geotextile materials .................................................................. 63
IV. 2. Mean concentrations and standard deviations (SD) for soluble reactive phosphorus
concentrations (mg/L) after 18 days in aquaria (n = 3) with soil separated from water by different
types of geotextiles as compared to controls .............................................................................. 64
V. 1. Total alkalinity (TA), total hardness (TH), and total dissolved solids (TDS)
concentrations and pH in freshwater samples used in sedimentation rate trials ......................... 82
V. 2. Properties of soils used as sources of suspended solids in sedimentation trials .......... 83
V. 3. Effectiveness of low concentrations of aluminum sulfate and aluminum chloride for
turbidity removal ......................................................................................................................... 84

viii
List of Illustrations
III. 1. Concrete retaining wall in earthen ponds at the Auburn University E.W. Shell Fisheries
Center, Auburn, Alabama .......................................................................................................... 46
III. 2. Geotextile material used to line ponds at the Auburn University E. W. Shell Fisheries
Center, Auburn, Alabama ........................................................................................................... 47
III. 3. Sketch (not to scale) of attachment of geotextile liners to bottoms of earthen ponds 48
III. 4. Sketch (not to scale) showing the method of securing geotextile liners to concrete
retaining walls in ponds ............................................................................................................. 49
III. 5. Photographs showing ponds lined with the black, style 307 geotextile (upper) and the
gray, Style 3801 G geotextile (lower) ........................................................................................ 50
III. 6. Photographs of a pond in which the gray liner floated ................................................ 51
III. 7. Photographs of an unlined pond bottom following fish harvest (upper) and of a lined
pond following fish harvest and removal of the liner ................................................................. 52
III. 8. Mean values for pH, water temperature, and concentrations of total alkalinity and total
hardness in ponds lined with two types of geotextile liners and in unlined, control ponds........ 53
III. 9. Mean values for concentrations of dissolved oxygen (DO) and 5-d biochemical oxygen
demand (BOD5) in pond lined with two types of geotextile liners and in unlined, control ponds
………………………………………………………………………………………….…54
III. 10. Mean values for concentrations of total ammonia nitrogen (TAN), Nitrate (NO3-N),
Nitrite (NO2-N), and total nitrogen in pond lined with two types of geotextile liners and in
unlined, control ponds ................................................................................................................. 55
III. 11. Mean values for concentrations of soluble reactive phosphorus and total phosphorus in
pond lined with two types of geotextile liners and in unlined, control ponds ............................ 56
III. 12. Mean values for concentrations of turbidity, total suspended solids, and chlorophyll a in
pond lined with two types of geotextile liners and in unlined, control ponds ............................ 57

ix
IV. 1. Mean concentration of soluble reactive phosphorus over and 18-d period in aquaria (n =
3) with soil separated from water by difference type of geotextiles as compared to controls .... 65
V. 1. Changes in turbidity over time in cylinders containing water and suspended particles of
three, different soils: CP soil, West Gulf Coastal Plain; BP Soil, Blackland Prarie; PP soil,
Piedmont Plateau ........................................................................................................................ 85
V. 2. Changes in turbidity in cylinders containing waters of different salinity (diluted
seawater) and suspended particles of three, different soils: CP soil, West Gulf Coastal Plain; BP
soil, Blackland Prarie; PP soil, Piedmont Plateau....................................................................... 86
V. 3. Change in turbidity in cylinders containing freshwater of three compositions and
suspended particles of three, different soils: CP soil, West Gulf Coastal Plain; BP soil, Blackland
Prarie; PP soil, Piedmont Plateau................................................................................................ 87
V. 4. Results of preliminary tests of nine, potential, chemical coagulants for moving turbidity
from water. Each test was conducted in water containing particles of three, different soils: CP
soil, West Gulf Coastal Plain; BP soil ― Blackland Prarie; PP soil ― Piedmont Plateau. ....... 88
V. 5. Effectiveness of different coagulants in removing turbidity from water. Each test was
conducted in water containing particles of three, different soils: CP soil ― West Gulf Coastal
Plain; BP soil, Blackland Prarie; PP soil, Piedmont Plateau. ..................................................... 89
V. 6. Effectiveness of different concentration of six, chemical, coagulants on pH. Each test
was conducted in water containing particles of three, different soils: CP soil, West Gulf Coastal
Plain; BP soil, Blackland Prarie; PP soil, Piedmont Plateau. ..................................................... 90
V. 7. Effectiveness of different concentration of six, chemical, coagulants on conductivity.
Each test was conducted in water containing particles of three, different soils: CP soil, West Gulf
Coastal Plain; BP soil, Blackland Prarie; PP soil, Piedmont Plateau. ........................................ 91

1
I. Introduction
Erosion of pond embankments is a ubiquitous and troublesome occurrence in aquaculture
(Boyd 1995). Erosion degrades pond embankments, but soil particles suspended in water create
turbidity that can limit phytoplankton productivity and availability of natural food organisms for
aquacultural species. Moreover, suspended soil particles often settle in deeper areas of ponds to
make ponds shallower and to create soft sediment that can interfere with various management
procedures (Steeby et al. 2001). There have been some estimates of rates of sediment
accumulation in ponds. Munsiri et al. (1995) found that in small, aquaculture research ponds
(0.04 to 0.1 ha) ranging from 2 to 52 yr in age, the average rate of sediment accumulation was
about 1 cm/yr. Sedimentation rates in 233 aquaculture ponds from nine countries ranged from
0.5 to 3.7 cm/yr and averaged 1.44 cm/yr (Boyd et al. 2010). Steeby et al. (2004) found that
sedimentation rate in ponds in Mississippi ranged from 12.5 cm during the first year to 1.3 cm/yr
in 16 to 21 yr-old ponds. Thus, sedimentation decreased as ponds aged.
Erosion of pond embankments can be minimized by designing side slopes of
embankments in accordance with soil properties and establishing grass cover. Also, aerators
should be installed in deeper water in a manner that avoids impingement of aerator-induced
currents on embankments (Boyd et al. 2003). Erosion-prone areas of embankments should be
lined with stone (rip-rap) or other material capable of lessening erosion. Nevertheless,
traditional erosion control measures do not stop erosion of pond earthwork; they just lessen the
rate of soil loss.

2
Several common aquaculture species also cause considerable disturbance of pond
bottoms by stirring sediment in search of benthic food organisms and by making depressions or
burrows during spawning activities. Occasionally, wild aquatic animal species may enter ponds
and create burrows in pond bottoms.
One way to completely stop erosion of pond earthwork would be to cover pond bottoms
and embankments with a plastic liner. Liners are frequently used in certain types of highly-
intensive aquaculture – especially in heterotrophic, floc systems for pond culture of marine
shrimp (Avnimelech 2012). Several research stations also have used liners to reduce seepage in
ponds. However, liners that have previously been used in aquaculture were not porous and
prevented contact of water with bottom soils. Phosphorus is strongly adsorbed from water by
bottom soil (Masuda and Boyd 1994), and it will accumulate in ponds with impermeable liners
causing dense unstable phytoplankton blooms (Leonard 1995). Where liners have been used to
prevent seepage, a layer of soil usually is placed over pond bottoms increasing the already high
price of lining ponds (Daniels and Boyd 1989; Leonard 1995).
Geotextile technology is expanding rapidly as new applications are found for these
products. Some geotextiles are porous and less expensive than the thick, non-porous, plastic
liners occasionally used in aquaculture. Permeable liners might allow exchange of dissolved
substances – particularly phosphorus – between bottom soil and water, and because of their
lower cost, porous geotextiles might have application for erosion control in ponds and especially
in small ponds on research stations and hatcheries.
Turbidity in pond water also can originate from suspended solids in source water, and in
some cases, ponds remain turbid even after all sources of turbidity have been eliminated. This
results because clay particles settle slowly from water – some may remain in suspension
3
permanently. Therefore, methods for clearing turbid water in ponds are needed. Chemical
coagulations are probably the best choice for lined ponds, but relatively little research has been
conducted on the relative effectiveness of different coagulants and of the influence of basic water
quality on turbidity removal by coagulants.
The purpose of the present study was to evaluate porous, geotextile liners as potential
pond lining material and to determine the relative effectiveness of common chemical coagulants
in clearing turbidity from water.

4
II. Literature Review
Erosion in aquaculture ponds
Erosion is a natural process by which earthen material is removed from a land or
earthwork surface and transported, usually by water, to another area away from the original
location. Erosion is caused by strong wind, heavy rains, snow or ice, wave action, and activities
of animals such as livestock, burrowing animals, and humans (Brady 1990). In aquaculture
ponds, erosion occurs mainly on the side slopes of embankments. Soil material is eroded from
embankments by strong waves, rainfall, and aerator-generated water currents. Embankments
should be constructed with proper side slopes and thoroughly compacted at optimum moisture
content for compaction (McCarthy 1998; Yoo and Boyd 1994). The above water portions of
embankments should be lined with vegetation, rocks, or synthetic liners to minimize erosion.
Erosion control will avoid high concentration of suspended solids and turbidity and reduces the
cost of maintaining pond earthwork (Egna and Boyd 1997). It also reduces the rate of sediment
accumulation in ponds.
In Alabama, erosion is an important issue at catfish farms. Hence, when the Alabama
Catfish Producers, Auburn University, Alabama Department of Environmental Management
(ADEM), and the United States Department of Agriculture Natural Resources Conservation
Service (USDA NRCS) collaborated to develop Best Management Practices for channel catfish

5
farming in Alabama, techniques for erosion control were included in the BMPs (Boyd et al.
2003).
Water quality in fish ponds
Water quality in fish ponds includes physical, chemical, and biological factors that affect
the suitability of the water for fish production (Hepher and Pruginin 1981). Wherever
aquaculture takes place, water quality should be measured. If water quality is not optimum for
survival, reproduction, and growth of fish or other aquaculture species, water quality
management should be applied. Although there are many water quality variables, only a few of
them play an important role in aquaculture. Nevertheless, these variables need to be measured,
because a pond that has “good” water quality has more production and a greater survival rate
than a pond that has “poor” water quality (Boyd and Tucker 1998).
Temperature
Temperature affects chemical and biological processes. The rate of chemical reactions
and biological processes roughly doubles for every 10oC increase in temperature (Williams and
Williams 1964). Thus, aquatic organisms will use two times as much oxygen at 30oC as they
will use at 20oC. Moreover, chemical reactions in pond waters and sediment will occur twice as
fast at 30oC as at 20
oC. Thus, the dissolved oxygen requirement for aquatic organisms is more
critical in warm water than in cooler water (Boyd and Tucker 1998). Water temperature also

6
influences management procedures. For example, in cooler water fertilizer dissolves slower and
herbicides act slower.
In ponds and other water bodies, heat enters at the surfaces, and the surface water heats
faster than deeper water. This can lead to thermal stratification of water bodies with warmer
water at the surface and cooler water at the bottom (Wetzel 2001). Thermal stratification usually
can be prevented in aquaculture ponds by avoiding water more than 2 m deep and by using
mechanical aeration (Boyd and Tucker 1998).
In intensive aquaculture systems, deterioration of water quality can stress fish or other
culture species making them more susceptible to diseases and parasites (Boyd and Tucker 1998).
Disease outbreaks are especially likely if fish are stressed at a time when the environment is
optimal for pathogens to reproduce. Temperature can play an important role in aquatic
organisms, because temperatures may be either below or above the thermal limit affecting to the
fish’s immunity (Watt 2001). Channel catfish Ictalurus punctatus held at temperatures of 15, 20,
25, 30oC had different immune and hematological responses after being vaccinated with live
theronts of Ichthyophtihrius multifillis (ich). Vaccinated catfish held at 20oC temperatures before
being challenged with ich responded by having more red blood cells, white blood cells,
thrombocytes, and monocytes. Tilapia held at a temperature of 15oC gave bad results for
survival and no sign of anti-ich antibodies following vaccination (Martins et al. 2008).
pH
The pH expresses the degree of acidic or basic conditions in water. The pH in freshwater
ponds usually will be between 6 and 9, and in a given pond, pH can fluctuate daily by one or two

7
units because of differences in the photosynthesis rate relative to the respiration rate (Boyd and
Tucker 1998). Carbon dioxide reacts in water to produce acidity (Wetzel 2001) as shown in the
equation below:
CO2 + H2O = HCO3- + H
+
From the equation, it can be seen that if CO2 in water increases, H+ will increase, and pH will
decrease. On the other hand, if CO2 in water decreases, H+ will decrease, and pH will increase.
Hence, in daytime, phytoplankton in the water column will lose CO2 as plants use it in
photosynthesis, and pH will increase. At night, phytoplankton no longer use CO2, and organisms
release CO2 by respiration decreasing pH in the water column (Wetzel 2001).
The fingerlings of channel catfish and hybrid catfish (female channel catfish male blue
catfish I. furcatus) are sensitive to sudden changes in pH, but they become more tolerant to pH as
they age and grow larger. A recent study of pH tolerance in channel catfish versus hybrid catfish
at three states of growth: sac fry, swim-up fry, and fingerlings found that channel catfish sac fry
were less tolerant than hybrid catfish to low rate changes of pH: 24-h LC10 (0.13 and 0.38 pH
unit increase, respectively), and 24-h LC50 (0.36 and 0.48 pH unit increase, respectively).
Conversely at a higher rate change of pH increase (0.62 pH unit), channel catfish were more
tolerant than hybrid catfish.
For swim-up fry, the hybrid catfish were less tolerant of pH increase (24-h LC50 = 0.83
pH unit) than channel catfish (24-h LC50 = 1.28 pH unit.). However, fingerling channel catfish
were less tolerant of pH increase (24-h LC50 = 1.33 pH unit) than were hybrid catfish (24-h

8
LC50 = 1.54 pH unit. However, the relationship between fish survival and pH levels reveals that
catfish are less sensitive to consistently high pH than to abrupt pH change (Mischke 2012).
Suspended solids and turbidity
Turbidity in a water column results from suspended solids that block the light from
penetrating into the water. There are three kinds of suspended solids (Wetzel 2001; Boyd and
Tucker 1998) that can affect the level of turbidity in the water body.
Phytoplankton, zooplankton, and bacterial blooms: algal blooms or eutrophication occur
from additions of nutrients to water in fertilizer, organism waste, and pollution. This
phenomenon can raise the pH up to 10 or more. Dense phytoplankton blooms also can
lead to fish kills from oxygen depletion. Some algal species produce toxins which can
harm aquatic animals.
Suspended organic and humic acids: These substances reduce light penetration and some
may even inhibit phytoplankton growth through toxic effects. Although organic
substances stain water (tea or coffee color), they seldom cause dissolved oxygen
depletion.
Suspension of silt and clay particles: Colloidal clay particles resulting from erosion on
watersheds or within ponds may remain suspended in water for a long time. They reduce
photosynthesis, but clay turbidity usually is not toxic.

9
All sources of turbidity scatter and block sunlight, preventing its penetration into the
water column. Thus, it has a negative effect on growth of phytoplankton and aquatic weeds
which are the primary producers in water bodies. Freshwater organisms can tolerate more
turbidity than brackishwater organisms, and seawater organisms are the least tolerant to turbidity.
Most channel catfish Ictalurus punctatus are produced mainly in the southeastern United
States. They are raised in earthen ponds. In catfish ponds, phytoplankton will absorb and reduce
NH3-N concentrations from the water column (Hargreaves 1998). Blue-green algae or
cyanobacteria commonly dominate the phytoplankton communities in eutrophic water bodies.
They are able to control cell buoyancy by collapsing and reforming intracellular gas vesicles
making them float to the water surface. This gives blue-green algae a competitive advantage
over other kinds of phytoplankton for light (Paerl and Tucker 1995). Some species of
cyanobacteria are unwanted because of odorous compounds that can affect the quality of fish
flesh (Rimando and Schraeder 2003).
Total alkalinity and total hardness
Total alkalinity is the total concentration of titratable bases in water expressed as the
concentration of equivalent calcium carbonate (CaCO3) in milligrams per liter (Boyd and Tucker
1998). The bases in water include hydroxide, ammonia, borate, phosphate, silicate, bicarbonate,
and carbonate, but bicarbonate and carbonate contribute most of the alkalinity to natural water
(Wetzel 2001). Water with a pH above 4.5 contains alkalinity, and water contains carbon
dioxide up to pH 8.3. Because carbon dioxide causes acidity, a water has acidity up to pH 8.3.
Waters between pH 4.5 and 8.3 – because they contain both bicarbonate and carbon dioxide –

10
contain both acidity and alkalinity. Waters below pH 4.5 are said to contain mineral acidity,
because carbon dioxide usually cannot depress pH below 4.5. Water above pH 8.3 does not
contain acidity. There the concept of alkalinity and acidity in water is a little different from the
traditional manner of calling water of pH 7 neutral, water below pH 7 acidic, and water above
pH 7 alkaline (Boyd et al. 2011).
Total hardness is expressed as the concentration of all divalent cations expressed in
milligrams per liter of calcium carbonate. Calcium and magnesium dominate the divalent
cations in almost all pond waters. Copatti et al. (2011) found that raising water hardness can
improve the growth rate of silver catfish Rhamdia quelen juveniles in acidic or alkaline water.
Conversely, hardness did not affect growth of silver catfish at neutral pH. Investigation found
that the highest concentrations of water hardness reduced silver catfish growth in acidic water as
well as in water of pH 9.0. Silver catfish juveniles held under acidic conditions (pH 5.5) in soft
water (30-60 mg/L CaCO3) water for 30 days had significantly reduced growth rate when
compared with those kept at pH 7.0 and the same level of hardness.
Phosphorus
Phosphorus is a key nutrient stimulating phytoplankton production in ponds. Thus, as
feeding rates increase, phytoplankton abundance increases. Phytoplankton blooms in fish pond
often contain a high frequency of blue-green algae that can cause off-flavor in fish flesh (Paerl
and Tucker 1995), and species of algae that can be toxic to fish may sometimes occur (English
et. al. 1993; Snyder et. al. 2002; Zimba et. al. 2001). In addition, low dissolved oxygen
concentration – especially at night – may be a problem in ponds with dense plankton blooms

11
(Boyd and Tucker 1998). The main natural control of phosphorus concentrations in ponds is
uptake by the bottom soil (Boyd 1995). Bottom soil adsorbs phosphorus, and once bound in the
soil, it is sparingly soluble. Thus, ponds with impermeable liners that are not covered with soil
can accumulate large amounts of phosphorus in their waters. The blooms become very dense in
such ponds, and die-offs often occur. When the dead cells decompose, the phosphorus contained
in them is released back into the water triggering another phytoplankton bloom, and the cycle
repeats itself (Hopkins et al. 1993; Krom et al. 1989; Neori et al. 1989).
Nitrogen
Nitrogen can enter ponds from the air in N2 form and some of this form can be fixed in
organic compounds by certain species of blue-green algae and bacteria (Wetzel 2001). Some
nitrogen can enter ponds in rain in the form of nitrate, and many forms of nitrogen may enter
ponds via the water supply. Inorganic nitrogen may enter ponds in fertilizers and organic
nitrogen or enter in manure or feed. A high rate of nitrogen recycling occurs in pond ecosystems
when organic matter from dead blue-green algae and bacteria and other sources decompose. In
aquaculture ponds, feeds can result in a high level of nitrogen in water. Ammonia enters the
pond from metabolic wastes of the culture species and from decomposition of uneaten feed and
feces. Hence, an important concern in intensive aquaculture is excessive concentration of
ammonia (Boyd and Tucker 1998).
Nitrogen is recycled from dead plankton cells in ponds with impermeable liners as
described for phosphorus above. However, soil is not a major control on nitrogen concentrations
in ponds. Ammonia is lost from ponds by diffusion, and nitrate is denitrified to nitrogen gas by

12
certain bacteria (Boyd and Tucker 1998). These processes can occur in a pond lined with an
impermeable liner not covered with soil. However, in such ponds, there may not be an anaerobic
zone that occurs in bottom soil. Denitrification possibly does not progress as rapidly in a pond
with an impermeable liner as in an earthen-bottomed pond.
Liners in aquaculture ponds
There are two major kinds of materials that can be used to line ponds – a permeable
geotextile liner that can let water and nutrients in the water body flow to them and impermeable
plastic sheets that allow neither water nor nutrients to pass through. Impermeable liners have
been used exclusively in aquaculture ponds. Unless soil is placed over impermeable liners,
phosphorus concentration will increase in the water. This can lead to phytoplankton blooms that
tend to increase to high density, crash, increase to high density again, etc. (Krom et. al. 1989;
Barkoh 1996; Neori et. al. 1989) Thus, water quality is not stable in ponds that have
impermeable liners without soil on top of them.
The possibility of using permeable liners in ponds should be investigated, because they
might not interfere with phosphorus removal from water by bottom soil, lessening the problem
with unstable phytoplankton blooms that occur in ponds with permeable liners. Impermeable
pond liners are excellent for preventing erosion – especially if soil is not placed on top of them
(Funge-Smith and Briggs 1998). Permeable liners likely could also be effective in avoiding
erosion.
A basic problem for pond management is excessive macrophyte growth in ponds and
embankments. Too much macrophytic biomass in a pond is undesirable; excessive vegetation

13
can interfere with the use of ponds for recreation. In aquaculture ponds, macrophytes interfere
with feeding and other management activities. After macrophytes die, they decompose,
releasing nutrients back into the water. This cycle of growth, death, and decaying of aquatic
plants results in overabundant pond vegetation which affects oxygen levels causing stress and
mortality of fish. Bottom liners can be used to control rooted macrophytes in the pond, because
they cover the soil and do not allow rooted plants access to the bottom. Of course, macrophytic
algae that do not have roots, and floating, higher plants such as water hyacinths Eicchornia
crassipes that do not root in the soil can grow in lined ponds. Permeable liners also would likely
prevent the growth of rooted aquatic vegetation.
A polypropylene liner (DuPont Typar 3201 and 3301) was used to control macrophytes
over the bottom of a lake. In summer time, the regrowth was counted in order to compare to a
control area. Regrowth of macrophytes was slight in lined ponds – macrophyte biomass was at
least 100 times greater in the controls. Even though the liner material was permeable to gases, it
did not float or form a “balloon” problem (Cooke and Gorman 1980).
Geotextile fabric, a porous woven polyethylene material, is used for construction site
erosion control (Rickson 2006). It is also used for improving drainage and enhancing
reinforcement of marginally stable slopes (Vishnudas et al. 2003), and it can be used as covers
for anaerobic odor control (Miner et al 2003). Double layers of geotextile bags filled with a
variety of materials have been used to decrease bridge abutment scouring (Korkut et al. 2007)
and for beach erosion reduction (Elko and Mann 2007; Oh and Shin, 2006; Allan and Komar
2004). Moreover, hydraulically loaded geotextile bags are used to dewater dredge slurry (Shin et
al. 2002) dairy and swine lagoon waste (Worley et al. 2008; Baker et al. 2002), and sewage
sludge in decentralize sites (Wett et al. 2005).

14
The major use of geotextiles in aquaculture has been to dewater (remove solids) effluent
from intensive production facilities such as backwash water from indoor facilities (Sharrer et al.
2009) and intensive biofloc systems (Danaher et al. 2011). I did not find references to use of
porous geotextiles for avoiding erosion in production ponds.
Catfish pond management
Feed is applied to catfish ponds in order to increase fish production beyond that possible
in fertilized ponds. Almost all feed applied will be consumed by fish, and feed conversion ratios
of 1.5 to 2.0 are possible (Bosworth et al. 2004; Dunham et al. 2008; Jiang et al. 2008; Green and
Rawles 2010; Kumar and Engle 2010; Li et al. 2012). Growth rates of hybrid catfish were found
to be 29.3% more than those of channel catfish (Green and Rawles 2010).
Aerators are used in catfish ponds to oxidize organic wastes from feeding and provide
dissolved oxygen for the respiration of fish and other organisms (Boyd and Tucker 1998).
Aeration allows production to be increased two to four times above that possible in un-aerated
ponds. However, aerators generate strong water currents that contribute to erosion of pond
embankments and bottoms.
Aquaculture facilities discharge nutrients, organic matter, and suspended solids when
they overflow or are drained. Thus, the U.S. Environmental Protection Agency has made an
effluent rule for US aquaculture (USOFF 2004). However, this rule does not apply to catfish
ponds unless they discharge more than 30 days per year.
Pond draining effluents have high concentrations of total suspended solids. Songsawang
and Boyd (2012) reported that settling basins can remove coarse, suspended soil particles from

15
aquaculture pond effluents, but settling basins are not able to settle particles smaller than 10-5
m
(Ozbay and Boyd 2003, 2004).

16
Literature Cited
Allan, J.C., P.D. Komar. 2004. Environmentally compatible cobble berm and artificial dune for
shore protection. Shore Beach 72(1), 9-18.
Avnimelech, Y. 2012. Biofloc Technology – a Practical Handbook, 2nd edition. The World
Aquaculture Society, Baton Rouge, Louisiana, USA.
Baker, K.B., J. P. Chastian, R.B. Dodd. 2002. Treatment of lagoon sludge and liquid animal
manure utilizing geotextile filtration. In: ASAE Annual International Meeting, Chicago,
IL.
Barkoh, A. 1996. Effects of Three Fertilization Treatments on Water Quality, Zooplankton, and
Striped Bass Fingerling Production in Plastic-Lined Ponds. Aerican Fisheries Society. 58:
237-247.
Bosworth, B. G., W. R. Wolters, J. L. Silva, R. S. Chamul, and S. Park. 2004. Comparison of
production, meat yield, and meat quality traits of NWAC103 Line Channel catfish, Norris
Line Channel Catfish, and female Channel catfish × male Blue catfish F1 hybrids. North
American Journal of Aquaculture 66:177–183.
Boyd, C. E. 1995. Bottom Soils, Sediment, and Pond Aquaculture. Chapman and Hall, New
York, New York, USA.
Boyd, C.E. and C.S. Tucker. 1998. Pond Aquaculture Water Quality Management. Kluwer
Academic Publishers, Boston, Massachusetts. 700 p.

17
Boyd, C.E., C.S. Tucker, and R. Viriyatum. 2011. Interpretation of pH, acidity and alkalinity in
aquaculture and fisheries. North American Journal of Aquaculture 73(4):403-408.
Boyd, C. E., C. W. Wood, P. Chaney, and J. F. Queiroz. 2010. Role of aquaculture pond
sediments in sequestration of annual global carbon emissions. Environmental Pollution
158:2,537-2,540.
Boyd, C. E., J. F. Queiroz, G. N. Whitis, R. Hulcher, P. Oakes, J. Carlisle, D. Odom, Jr., M.
Nelson, and W. G. Hemstreet. 2003. Best management practices for channel catfish for
Alabama. Special Report 1, Alabama Catfish Producers, Montgomery, Alabama, USA.
Brady, N.C., 1990. The Nature and Properties of Soils. 10th edition. Macmillan, New York, 621 p.
Cooke, G.D. and M.E. Gorman. 1980. Effectiveness of Dupont TYPAR sheeting in controlling
macrophyte regrowth after overwinter drawdown. Water Resources Bulletin. American
Water Resources Association. 2: 353-355.
Copatti, CE, De Oliveira Garcia L, Da Cunha MA, Baldisserotto B, Kochhann D. 2011.
Interaction of water hardness and pH on growth of silver catfish, Rhamdia quelen,
juveniles. Journal of the World Aquaculture Society 42: 580-585.
Danaher J.J., C.S. Richard, and E.R. Rakocy. 2011. Evaluation of two textiles with or without
polymer addition for dewatering effluent from an intensive biofloc production system.
Journal of the World Aquaculture Society 42 (1): 66-72
Daniels, H. V. and C. E. Boyd. 1989. Chemical budgets for polyethylene-lined brackishwater
ponds. Journal of the World Aquaculture Society 20:53-60.

18
Dunham, R. A., G. M. Umali, R. Beam, A. H. Kristanto, and M. Trask. 2008. Comparison of
production traits of NWAC103 channel catfish, NWAC103 channel catfish × blue catfish
hybrids, Kansas Select 21 channel catfish, and blue catfish grown at commercial densities
and exposed to natural bacterial epizootics. North American Journal of Aquaculture
70:98–106.
Egna, H.S. and C.E. Boyd (editors). 1997. Dynamics of Pond Aquaculture. CRC Press, Boca
Raton, Florida. 437 p.
Elko, N.A., D.W. Mann. 2007. Implementation of geotextile T-groins in Pinellas County,
Florida. Shore Beach 75(2), 2-10
English, W.R., T.E. Schwedler, and L. A. Dyck. 1993. Aphanizomenon flos-aquae, a toxic Blue-
Green Alga in Commercial Channel Catfish, Ictalurus punctatus, ponds: A Case History.
Journal of Applied Aquaculture 3:195-209.
Funge-Smith, SJ and M.R.P. Briggs. 1998. Nutrient budgets in intensive shrimp ponds:
Implications for sustainability. Aquaculture 164:117-133.
Green, B.W., and S. D. Rawles. 2010. Comparative growth and yield of Channel Catfish and
Channel × Blue Hybrid catfish fed a full or restricted ration. Aquaculture Research
41:e109–e119.
Hargreaves, J.A. 1998. Nitrogen Biochemistry of Aquaculture Ponds. Aquaculture. 166: 181-212
Hepher, B and Y. Pruginin. 1981. Commercial fish farming: with special reference to fish culture
in Israel: Wiley. New York. USA. 262p.

19
Hopkins, J.S., R.D. Hamilton II, P.A. Sandifer, C.L. Browdy, and A.D. Stokes. 1993. Effect of
water exchange rate on production, water quality, effluent characteristics and Nitrogen
budgets of intensive shrimp ponds. Journal of The World Aquaculture Society.
24(3):304-312.
Jiang, M., W. H. Daniels, H. J. Pine, and J. A. Chappell. 2008. Production and processing trait
comparisons of Channel catfish, Blue catfish, and their hybrids grown in earthen ponds.
Journal of the World Aquaculture Society 39:736–745.
Korkut, R., E.J. Martinez, R. Morales, R. Ettema, B. Barkdoll. 2007. Geobag performance as
scour countermeasure for bridge abutments. J. Hydrual. Eng. 133 (4), 431-439
Krom M, J. Erez, C. Porter, and S.Ellner. 1989. Phytoplankton nutrient uptake dynamics in
earthen marine fishponds under winter and summer conditions. Aquaculture 76: 237-253.
Kumar, G., and C. Engle. 2010. Relative production performance and cost of food fish
production from fingerlings of channel-blue F1 hybrids, Ictalurus punctatus–Ictalurus
furcatus, and NWAC-103 channel catfish, I. punctatus. Journal of the World Aquaculture
Society 41:545–554.
Leonard, S. E. 1995. Water quality factors influencing striped bass (Morone saxatilis)
production in lined ponds. Ph.D. dissertation, Auburn University, Auburn, Alabama,
USA.
Li, M.H., E.H. Robinson, D.F. Oberle, and P.M. Lucas. 2012. Effects of Feeding Rate and
Frequency on Production Characteristics of Pond-Raised Hybrid Catfish. North American
Journal of Aquaculture 74: 142-147.

20
Martins, M.L., JLP. Mouriño, GV. Amaral, FN. Vieira, G. Dotta, Jatoba AMB, et al. 2008.
Haematological changes in Nile tilapia experimentally infected with Enterococcus
sp. Braz J Biol. 68(3):657-661.
Masuda, K. and C. E. Boyd. 1994. Phosphorus fractions in soil and water of aquaculture ponds
built on clayey, Ultisols at Auburn, Alabama. Journal of the World Aquaculture Society
25:379-395.
McCarthy, D. 1998. Essentials of Soil Mechanics and Foundations - Basic Geotechnics. 5th
Edition. Prentice-Hall. Upper Saddle River, New Jersey. USA. 730 p.
Miner, J.R., F.J. Humenik, J.M. Rice, D.M.C. Rashash, C.M. Williams, W. Robarge, D.B.
Harris, R. Sheffield. 2003. Evaluation of a permeable, 5 cm thick polyethylene foam
lagoon cover. Trans. ASAE 46 (5), 1421-1426.
Mischke, C.C. and N. Chatakondi 2012. Effects of abrupt pH increases on survival of different
ages of young catfish. North American Journal of Aquaculture. 74:160-163.
Munsiri, P., C. E. Boyd, and B. F. Hajek. 1995. Physical and chemical characteristics of bottom
soil profiles in ponds at Auburn, Alabama, USA, and a proposed method for describing
pond soil horizons. Journal of the World Aquaculture Society 26:346-377.
Neori, A., M. Krom, I. Cohen, and H. Gordin, 1989. Water quality conditions and particulate
chlorophyll a of new intensive seawater fishponds in Eilat, Israel: daily and diel
variations. Aquaculture 80: 63-78.

21
Oh, Y.I., and E.C. Shin. 2006. Using submerged geotextile tubes in the protection of the E.
Korean shore. Coast Eng. 53(11), 879-895
Ozbay, G. and C.E. Boyd. 2003. Particle size fractions in pond effluents. World Aquaculture
34(4): 56-59.
Ozbay, G. and C.E. Boyd. 2004. Treatment of Channel catfish pond effluents in sedimentation
basins. World Aquaculture 35(3): 10-13.
Paerl, H.W. and C. S. Tucker. 1995. Ecology of blue-Green algae in aquaculture ponds. Journal
of the World Aquaculture Society 26: 109-131.
Rickson, R.J., 2006. Controlling sediment at source: an evaluation of erosion control geotextiles.
Earth Surf. Proc. Land. 31(5), 550-560
Rimando, A.M. and K.K. Schrader. 2003. Off-Flavors in Aquaculture. American Chemical
Society. Washington, DC. USA. 268 p.
Sharrer, M.J., R. Kata, and S. Steven. 2009. Evaluation of geotextile filtration appling coagulant
and flocculant amendments for apuaculture biosolids dewatering and phosphorus
removal. Aquacultural Enginerring. 40(2009) 1-10.
Shin, E.C., K.S. Ahn, Y.I. Oh, and B.M. Das. 2002. Construction and monitoring of geotubes. In:
Proceedings of the International Offshore and Polar Engineering Conference, vol. 12. pp.
469-473
Snyder, G., A. Goodwin, and D. Freeman. 2002. Evidence that channel catfish, Ictalurus
punctatus (Rafinesque), mortality is not linked to ingestion of the hepatotoxin
microcystin‐LR. Journal of Fish Diseases 25: 275-285.

22
Soongsawang S. and Boyd CE. 2012. Effects of effluents from a fisheries research station on
stream water quality. North American Journal of Aquaculture 74: 73-79.
Steeby, J. A., J. A. Hargreaves, C. S. Tucker, and S. Kingsbury. 2004. Accumulation, organic
carbon and dry matter concentration of sediment in commercial channel catfish ponds.
Aquacultural Engineering 30:115-126.
Steeby, J. A., S. Kingsbury, and J. Hargreaves. 2001. Sediment accumulation in channel catfish
production ponds. Global Aquaculture Advocate 4(3):54-56.
USOFR (U.S. Office of the Federal Register). 2004. Effluent limitations guidelines and new
source performance standards for the concentrated aquatic animal production point
source category: final rule. Federal Register 69:162(23 August 2004):51892–51930.
Vishnudas, S., H.H.G. Savenije, P. Van der Zaag, K.R. Anil, and K. Balan, 2006. The protective
and attractive covering of a vegetated embankment using coir geotextiles. Hydrol. Earth
Syst. Sci. 10(4), 565-574
Watts M., BL. Munday, and CM. Burke. 2001. Immune responses of teleost fish. Australian
Veterinary Journal 79(8):570-574.
Wett, B., M. Demattio, and W. Becker, 2005. Parameter investigation for decentralized
dewatering and solar thermic drying of sludge. Water Sci. Technol. 41(10), 65-73.
Wetzel R.G. 2001. Limnology Lake and River Ecosystems. 3rd
Edition. Academic Press. New
York, New York. USA. 1006 p.
Williams, V.R. and H.B. Williams 1964. Basic Physical Chemistry for The Life Sciences. 2nd
Edition. W.H. Freeman and Company, San Francisco, California. USA. 524 p.

23
Worley, J.W., T.M. Bass, and P.F. Vendrell. 2008. Use of geotextile tubes with chemical
amendments to dewater dairy lagoon solids. Bioresour. Technol. 91, 4451-4459.
Yoo, K.H. and C.E. Boyd. 1994. Hydrology and Water Supply for Aquaculture. Chapman and
Hall, New York, New York. 483 p.
Zimba, P., L. Khoo, P. Gaunt, S. Brittain, and W. Carmichael. 2001. Confirmation of catfish,
Ictalurus punctatus (Rafinesque), mortality from Microcystis toxins. Journal of Fish
Diseases 24: 41-47.

24
III. Evaluation of Two, Porous, Geotextile Liners for Erosion Control
in Small Aquaculture Ponds
Abstract
In an experiment conducted at the E. W. Shell Fisheries Center, Auburn, Alabama, three
ponds each were lined with a permeable geotextile with 0.090-mm opening sizes, a permeable
geotextile with 0.355-mm opening sizes, or served as unlined, controls. During the 2-yr study,
geotextile liners did not tear or decay, they prevented erosion of the bottom of the ponds stocked
with a high density of channel catfish and aerated nightly. The liners did tend to float up in the
water column; the liner with smaller opening sizes floated in all three ponds, while the other liner
floated in only one pond. Fish production, survival, and feed conversion ratio did not differ (P >
0.05) among the control and lined ponds or between liner types. Water quality variables often
differed between lined ponds and control ponds. The greatest difference was greater
phytoplankton growth in the lined ponds especially in ponds lined with the less permeable
geotextile – than in the control. This difference was attributed to differences in phosphorus
uptake by bottom soils related to the liners and their permeability. However, in spite of more
phytoplankton growth in lined ponds, the control ponds tended to have higher turbidity because
of erosion of bottoms by aeration.

25
Introduction
Erosion of pond embankments is a ubiquitous and troublesome occurrence in aquaculture
(Boyd 1995). Erosion degrades pond embankments, but soil particles suspended in water create
turbidity that can limit phytoplankton productivity and availability of natural food organisms for
aquacultural species. Moreover, suspended soil particles often settle in deeper areas of ponds to
make ponds shallower and to create soft sediment that can interfere with various management
procedures (Steeby et al. 2001, 2004). There have been some estimates of rates of sedimentation
in ponds. Munsiri et al. (1995) found that in small, aquaculture research ponds (0.04 to 0.1 ha)
ranging from 2 to 52 yr in age sediment accumulation averaged about 1 cm/yr. Sedimentation
rates in 233 aquaculture ponds from nine countries ranged from 0.5 to 3.7 cm/yr and averaged
1.44 cm/yr (Boyd et al. 2010). Steeby et al. (2004) found that sedimentation decreased as large,
commercial catfish ponds ( 8 ha) aged: annual sediment accumulation was 12.5 cm in 1-yr-old
ponds, but only 1.3 cm in 16 to 21 yr-old ponds.
Erosion of pond embankments can be minimized by designing side slopes of
embankments in accordance with soil properties and establishing grass cover. Aerators should
be installed in deeper water in a manner that avoids impingement of aerator-induced currents on
embankments (Boyd et al. 2003). Erosion prone areas of embankments should be lined with
stone (rip-rap) or other material capable of lessening erosion. Nevertheless, traditional control
measures do not stop erosion of pond earthwork; they just lessen the rate of soil loss.
Several common aquaculture species also cause considerable disturbance of pond
bottoms by stirring sediment in search of benthic food organisms and by making depressions or

26
burrows during spawning activities (Boyd 1995). Occasionally, wild aquatic animal species may
enter ponds and create burrows in pond bottoms.
Erosion of pond bottoms can be stopped by lining bottoms and side-slopes of
embankments with a plastic liner. Liners are frequently used in certain types of highly-intensive
aquaculture – especially in heterotrophic, floc systems for pond culture of marine shrimp
(Avnimelech 2009). Several research stations also have used liners to reduce seepage in ponds
(Daniels and Boyd 1989). Liners that have previously been used in aquaculture were not porous
and prevented contact between pond water and bottom soils. Phosphorus is strongly adsorbed
from water by bottom soil (Masuda and Boyd 1994), and it will accumulate in waters of ponds
with impermeable liners causing dense unstable phytoplankton blooms (Krom et al. 1989;
Leonard 1995; Neori et al. 1989). Where liners have been used to prevent seepage, a layer of
soil usually is placed over pond bottoms. This increases the already high price of lining ponds
(Daniels and Boyd 1989; Hopkins et al. 1993; Leonard 1995).
Geotextile technology is expanding rapidly as new applications are found for these
products. Some geotextiles are porous and less expensive than the thick, non-porous, plastic
liners occasionally used in aquaculture. Permeable liners might allow exchange of dissolved
substances – particularly phosphorus – between bottom soil and water, and because of their
lower cost, porous geotextiles might have wide application for erosion control in ponds.
Materials and Methods
Ponds used in this study are located on the E. W. Shell Fisheries Center, 2101 North
College Street, Auburn, Alabama. Ponds are embankment-type water bodies built on the

27
Piedmont Plateau; soils in the area are Typic, Kandiudults (clayey, kaolinitic, and thermic)
(McNutt 1981). When filled to tops of standing overflow pipes, ponds are 28.3 m long × 14.1 m
wide ( 400 m2 surface area). Maximum depth was about 1.5 m with an average around 1.0 m
following initial construction (1969 to 1971). A concrete retaining wall (15 cm wide) was
installed to a depth of about 1 m around the inside of each pond (Fig. 1) to prevent bank erosion
and to assure that water depth was not less than 50 cm when ponds were full in normal use.
Ponds gradually filled over the years, and in 2004, a renovation project was initiated to remove
sediment from the central areas, and the entire bottoms were graded (Yuvanatemiya and Boyd
2006).
In March 2008, nine ponds for which renovation had been completed in fall 2007 were
selected for this study. Three ponds were lined with a black, porous, polypropylene geotextile
(Style 307) manufactured by Belton Industries, Belton, SC, USA (Fig. 2). Three ponds were
lined with a gray, porous, polypropylene geotextile (Style 3801 G) produced by Typar
Geotextiles, Old Hickory, TN, USA (Fig. 2). Physical characteristics of the two geotextile
materials are provided (Table 1). For brevity, liners will be referred to as black and gray liners.
Three ponds were not fitted with liners and served as controls.
Bottoms of the ponds were further smoothed by hand raking. The 3-m-wide sheets of
geotextile were sewed together with nylon thread at pond sites using a hand-held sewing device.
A 25-cm deep by 25-cm wide ditch was excavated at a distance of 50 cm behind the concrete
retaining wall. Liners were installed over pond bottoms and sides, and the geotextile fabric liner
was made wide enough to line the ditch and extend 1 m beyond. The ditch was backfilled with
soil to secure edges of the liner (Fig. 3). Steel pins (61 cm long × 1.27 cm diameter) that had one
end sharpened to a point and a 5-cm diameter washer were welded on the other end. Each pin

28
was forced through a 15 cm × 0.5 cm thick plastic tile. The washer kept the tile in place, and the
tile prevented the washer from tearing through the liner. Ninety-eight pins were inserted through
the liner on a 2 m × 2 m grid over the pond bottom. A 4-cm wide × 1-mm thick aluminum strip
was attached over the liner around the inside top of the entire concrete wall. The attachment was
made by inserting 5-cm long × 0.63-cm diameter screws through the metal and liner into the
concrete wall. In addition, a 1.2-m long × 0.63-cm diameter steel pin was shaped to provide a
rectangular bracket; the long side of the pin was inserted through the liner and into the
embankment on the outside of the concrete wall, the rectangular part of the pin fitted over the top
of the retaining wall and extended downward 50 cm over the liner (Fig. 4). Brackets were
installed at 2-m intervals around the pond. Photographs (Fig. 5) show bottoms of lined ponds
before filling with water.
Each pond was stocked on 5 June 2008 with 400 fingerling hybrid catfish (♀ Ictalurus
punctatus ♂ I. furcatus) weighing an average of 52.1 g/fish. Fish were fed a floating, pelleted,
commercial feed (32% crude protein) at an estimated 3% of body weight per day. A 0.5-hp
vertical pump aerator was placed in each pond and operated when low nighttime dissolved
oxygen concentration was anticipated. Ponds were completely drained on 11 November 2008,
and fish were counted and weighed.
Fish smaller than marketable size were placed in a holding tank and returned to ponds on
14 November. On 3 December, additional fish similar in size to fish returned to ponds on 14
November were stocked to provide a total of 400 fish/pond. Fish added to ponds had an average
individual weight of 302 g. Ponds were managed in 2009 according to procedures used in 2008.
Ponds were completely drained on 14 October 2009, and all fish harvested and weighed.

29
Between 15 June to 1 December 2008 and 6 February to 14 October 2009, dissolved
oxygen concentrations and water temperatures were measured weekly between 0600 and 0700 h
at a depth of 10 cm using a polarographic dissolved oxygen meter with thermistor. Water
samples were dipped from the pond surface following dissolved oxygen measurement. These
samples were transported to the laboratory and water quality analyses immediately initiated
using standard protocol (Eaton et al. 2005) for the following variables: pH (glass electrode);
turbidity (laboratory turbidimeter); total suspended solids (glass fiber filtration and gravimetry);
total alkalinity (titration with 0.02 N H2SO4 to pH 5.1); total hardness (titration with 0.01 M
ethylenediaminetetraacetic acid to erichrome black-T endpoint); BOD (standard, 5-d test); total
ammonia nitrogen (phenate method); nitrite-nitrogen (diazotization procedure); soluble reactive
phosphorus (ascorbic acid method). Nitrate-nitrogen was determined by the szechrome reagent
(4-phenylamino-benzenesulfonic acid) method (van Rijn 1993). Unfiltered water samples were
digested in an alkaline persulfate solution to convert all phosphorus and nitrogen to phosphate
and nitrate, respectively. Phosphate and nitrate concentrations were determined by ascorbic acid
procedure and ultraviolet spectrophotometric screening technique, respectively (Eaton et al.
2005; Gross et al. 1999).
Results and Discussion
The gray liner pulled free from the bottom and floated upward in the water column in all
ponds, and the black liner floated up in one pond (Fig. 6). Fifty concrete blocks (40 cm 20 cm
20 cm) were placed over the liner, and this alleviated, but did not prevent completely, the
floating liner problem. Concrete blocks were left in ponds during the second year of the study.

30
Because liners tended to float, it was decided by the manager of the E. W. Shell Fisheries
Center that they were unacceptable, and they were removed after fish harvest in 2009.
Nevertheless, liners were quite effective in maintaining the original shape of pond bottoms (Fig.
7). Unlined ponds exhibited considerable bottom erosion and sediment accumulation in deeper
portions. Bottom of the lined ponds showed no alteration of bottom shape. Moreover, liners did
not tear or develop holes because of fabric decay; they were completely intact after 2 yr. Of
course, the liners were not left in ponds long enough to allow comment on manufacturers’
estimates of service life (Table 1).
Results of weekly water analyses are given (Figs. 8-12). Values for water quality
variables differed considerably among replicate ponds, but averages of variables for individual
dates often were similar. Thus, standard error bars were not plotted with means because the
many overlaps would have made them impossible to distinguish. Some trends in concentrations
of water variables among treatments and control were noted.
Water temperature ranged from 20.7 to 30.9 C in 2008 and from 10.0 to 33.9
C in 2009.
The greater water temperature range in 2009 resulted because measurements were initiated in
February rather than in June as in 2008. However, there were no differences in water
temperature among control and treatments (Fig 8). Thus, the dark color of liners did not increase
heat absorption in lined ponds.
Average pH of pond waters usually was above 7.5, and, values higher than 9.0 were
observed (Fig. 8). Higher pH values corresponded to periods with clear weather and abundant
phytoplankton, while dips in pH – most notable in mid May 2008 and early September 2009 –
were related to extended periods of cloudy weather. Differences in pH did not result from the
presence of liners.

31
Total alkalinity and total hardness concentrations tended to be greater in lined ponds than
in control ponds in 2008 (Fig. 8). In 2009, lined ponds had slightly greater total alkalinity, but
hardness was about the same as in control ponds. Greater total hardness and total alkalinity in
ponds in 2008 as compared to 2009 deserves comment. In 2008, ponds that were used as
controls – but not the ponds that were lined – were treated with agricultural limestone before the
decision was made to conduct this study. Agricultural limestone treatment increased total
hardness and total alkalinity concentrations in control ponds. Because lined ponds were not
treated with agricultural limestone, concrete blocks placed in lined ponds likely caused increased
total alkalinity and total hardness.
Concrete blocks consist of about 2 parts aggregate (sand, gravel, crushed stone, etc.) and
1 part concrete. Concrete contains Portland cement that consists of tricalcium silicate, dicalcium
silicate, tricalcium aluminate, tetracalcium aluminoferrite, and gypsum. When mixed with water,
the tricalcium silicate in Portland cement reacts to form a solid mass with the other ingredients
(Taylor 1997). The basic reaction is:
2Ca3SiO5 + 7H2O 3(CaO) Z(SiO2) 4(H2O)(gel) + 3Ca(OH)2
Components of concrete are slightly soluble and can increase calcium (total hardness) in
water, and calcium hydroxide can react with carbon dioxide to produce bicarbonate (total
alkalinity).
Ponds were drained in December 2008, and refilled with water of relatively-low total
alkalinity and total hardness. Agricultural limestone was not applied after refilling. Draining of
control ponds and refilling caused lower total alkalinity and total hardness relative to 2008 in

32
control ponds. Solubility of calcium-containing, alkaline substances in concrete blocks probably
occurred most rapidly in 2008, and the already weathered blocks contributed less to total
alkalinity and total hardness in 2009.
During 2008, there was little difference in dissolved oxygen concentration among control
and treatment ponds (Fig. 9). Only once did average dissolved oxygen concentration fall below
6 mg/L. Dissolved oxygen concentrations also were typically above 6 mg/L in 2009, but in late
winter and early spring, dissolved oxygen concentration tended to be greater in lined ponds than
in control ponds. Dissolved oxygen concentrations never fell to concentrations considered
dangerous to fish (Boyd and Tucker 1998; Torrans 2008), because aerators were operated often
at night during periods when water temperature was above 25 C.
All three combined nitrogen fractions (total ammonia nitrogen, nitrite-nitrogen, and
nitrate-nitrogen) were unexpectedly low in concentration during 2008 (Fig. 10). Analytical
procedures were checked for accuracy and found to be reliable. The likely reason for low total
ammonia nitrogen concentration was relatively-low fish standing crops. Daily feed input was
rather low in response to small fish biomass, and phytoplankton were able to absorb most of the
ammonia nitrogen resulting from decomposition of uneaten feed, fish feces, and metabolic waste
of fish (Tucker et al. 1994). Without appreciable total ammonia nitrogen in water, nitrification
occurred at low rates and nitrate-nitrogen concentrations also remained low. There also was less
opportunity for nitrite-nitrogen being produced as an intermediate in nitrification or from
reduction of nitrate in anaerobic zones (Boyd and Tucker 1998; Hargreaves 1998).
Total nitrogen increased during the 2008 growing season. Most of the total nitrogen
probably was contained in phytoplankton cells. Although average total nitrogen concentration

33
did not exceed 3 mg/L (Fig. 10), it tended to be slightly greater – especially in September and
October – in lined ponds than in control ponds.
In 2009, total ammonia- and nitrate-nitrogen concentrations were fairly low until late
spring, but they increased greatly during late summer and fall in response to large daily feed
inputs when fish biomass was high. There were no clear differences among control and lined
ponds for total ammonia nitrogen concentration (Fig. 10). However, other than for two spikes of
nitrate-nitrogen in ponds with gray liners, control ponds had the highest nitrate-nitrogen
concentrations from June onward. Nitrite concentration tended to be much greater in control
ponds than in lined ponds in 2009. Less nitrite-nitrogen in lined ponds may have resulted
because organic matter was captured on liners and was prevented from entering anaerobic zones
of sediment as it did in unlined ponds. Nitrate is reduced to nitrite in anaerobic sediment by
denitrifying bacteria and stirred into the water column by aerators as described by Hollerman and
Boyd (1980). Aerator-generated water currents likely provided plenty of dissolved oxygen in
water at the liner surface preventing anaerobic conditions. Nevertheless, nitrite concentrations in
unlined, control ponds did not reach levels reported to be harmful to channel catfish (Boyd and
Tucker 1998).
In 2009, total nitrogen concentrations increased to much higher levels than in 2008 in
response to greater feed input (Fig. 10). Lined ponds tended to have higher total nitrogen
concentrations than found in control ponds, but there was no difference between gray and black
liners with respect to this variable.
Soluble reactive phosphorus concentrations fluctuated considerably among sampling
dates during both years (Fig. 11). There were a few periods during both years when soluble
reactive phosphorus concentration in lined ponds were elevated above those in control ponds.
34
Total phosphorus concentrations were low and similar among control and treated ponds in 2008
(Fig. 11). Concentrations of total phosphorus were greater in 2009 in all ponds, and in late
summer and fall, total phosphorus concentrations were markedly greater in lined ponds. Most of
the total phosphorus in water was probably contained in living phytoplankton cells or in their
particulate remains (Masuda and Boyd 1994).
Turbidity tended to be higher during August and September 2008 in ponds with the gray
liner, and ponds with the black liner and control ponds were similar in turbidity (Fig. 12).
Throughout most of the growing season in 2009, control ponds had much greater turbidity than
ponds with either liner. Total dissolved solids concentrations varied more among ponds of the
same treatment and among treatments than did turbidity (Fig. 12). But, on many sampling dates
in 2008, total dissolved solids concentrations were as high or higher in ponds with the gray liner
than in other ponds – the same can be said for control ponds in 2009.
Chlorophyll a concentrations (Fig. 12) also varied greatly among treatments and among
ponds within treatments, but in general, chlorophyll a concentration was consistently higher in
lined ponds – especially in 2009.
Higher turbidity and total dissolved solids concentrations in control ponds in 2009 as
compared to 2008 are likely related to several factors. Ponds were newly renovated; sediment
was removed and bottoms reshaped and compacted. Fish were not stocked until 5 June in 2008,
and the fingerlings were small. Aeration was not necessary for several weeks, and bottoms were
not disturbed greatly by fish activity and aerator-generated water currents. It is likely that
turbidity in both lined ponds and control ponds resulted primarily from plankton rather than
suspended soil particles. After harvest in 2008, ponds were restocked with relatively large fish
in November and December. Thus, in 2009, fish standing crop was much higher than in 2008 at

35
the beginning of the grow-out period, and aeration was needed more frequently. Fish activity
and aerator-generated water currents likely caused much erosion of bottoms of unlined ponds
resulting in suspension of soil particles. Low chlorophyll a concentrations in unlined ponds
supports this hypothesis; low chlorophyll a concentration would be expected because of light
limitation imposed by turbidity from suspended soil particles. However, when all data were
considered, there was a high correlation between turbidity and total suspended solids both years
(Table 2), but chlorophyll a concentration was not correlated with either of these two variables.
The 5-d biochemical oxygen demand (BOD) tended to be elevated in lined ponds as
compared to control ponds during both years (Fig. 9). High BOD concentration in lined ponds in
early 2009 cannot be explained, because chlorophyll a, turbidity, and total suspended solids were
not elevated at this time. There is no reason to believe that there was a high concentration of
dissolved organic matter in ponds at this time, and we assume there was an analytical error.
However, BOD concentrations in lined ponds were within the range typically found in
commercial channel catfish ponds (Boyd and Gross 1999).
Grand means for water quality data from 2008 and 2009 were computed (Table 3). A
few differences were found among grand means. The pH averaged higher in ponds with the gray
liner than in controls or ponds with black liners in 2009. Dissolved oxygen concentration was
greater in lined ponds than in control ponds both years. In 2008, total nitrogen concentration did
not differ among lined ponds and control ponds. In 2009, ponds with both liners had a higher
mean concentration (P < 0.05) of total nitrogen than did unlined ponds. Total phosphorus did
not differ among control and treatments in 2008 (P > 0.05), but in 2009 when fish biomass was
greater, the two lined-pond treatments had higher concentrations of this variable than control
ponds (P < 0.05). Ponds with the gray liner also had greater phosphorus concentration than
36
ponds with the black liner (P < 0.05). This most likely is the result of the gray liner being more
porous than the black liner. However, in spite of total phosphorus being elevated in the lined
ponds, there were no differences among control and treatments with respect to soluble reactive
phosphorus (P > 0.05). This probably was caused by rapid uptake of soluble phosphorus by
phytoplankton
Turbidity was greater in ponds with the gray liner in 2008 than it was in the other ponds.
However, in 2009, turbidity was highest in the lined ponds. This probably resulted from
suspension of soil particles by the aerators. Chlorophyll a concentration was greater in ponds
with the gray liner than in control ponds in 2008 (P < 0.05), but there was no difference in
chlorophyll a concentration between ponds with the two types of liners. In 2009, unlined,
control ponds were very low in chlorophyll a concentration as compared to 2008 (Table 3), and
ponds with both types of liners had more chlorophyll a than was found in control ponds.
Nevertheless, there was no difference in chlorophyll a concentrations between ponds with the
two types of liners in 2009.
The BOD was greater in lined ponds than in control ponds both years, but the gray liner
and black liner ponds did not differ in BOD. The greater BOD in lined ponds likely was related
to higher phytoplankton abundance in these ponds, because much of the BOD in channel catfish
ponds results from plankton respiration (Boyd and Gross 1999).
Fish production data (Table 4) show that good survival of fish was achieved in all ponds,
and net production was equivalent to 2,492 to 2,555 kg/ha in the abbreviated 2008 grow-out
period. In 2009, production ranged from 3,108 to 3,605 kg/ha – levels commiserate with the
stocking density (Boyd and Tucker 1998). There were no differences in survival and production
among controls and lined ponds (P > 0.05).

37
In conclusion, permeable geotextile liners prevented erosion in ponds, and fish survival
and production were typical of that realized in unlined ponds. However, permeable liners did not
seem to allow normal uptake of phosphorus by bottom soil, because total phosphorus and
chlorophyll a concentrations tended to be elevated in lined ponds as compared to control ponds.
Unfortunately, it was not economically possible to have three ponds with impermeable liners for
comparison with permeable liners. Geotextiles of larger apparent opening size than present in
the liners of this study are available. Future research probably should focus on more permeable
geotextiles.

38
Literature Cited
Avnimelech, Y. 2012. Biofloc Technology – A Handbook, 2nd
edition. The World Aquaculture
Society, Baton Rouge, Louisiana, USA.
Boyd, C. E. 1995. Bottom Soils, Sediment, and Pond Aquaculture. Chapman and Hall, New
York, New York, USA.
Boyd, C. E. and A. Gross. 1999. Biochemical oxygen demand in channel catfish Ictalurus
punctatus pond waters. Journal of the World Aquaculture Society 30:349-356.
Boyd, C. E. and C. S. Tucker. 1998. Pond Aquaculture Water Quality Management. Kluwer
Academic Publishers, Boston, Massachusetts, USA.
Boyd, C. E., C. W. Wood, P. Chaney, and J. F. Queiroz. 2010. Role of aquaculture pond
sediments in sequestration of annual global carbon emissions. Environmental Pollution
158:2,537-2,540.
Boyd, C. E., J. F. Queiroz, G. N. Whitis, R. Hulcher, P. Oakes, J. Carlisle, D. Odom, Jr., M.
Nelson, and W. G. Hemstreet. 2003. Best management practices for channel catfish for
Alabama. Special Report 1, Alabama Catfish Producers, Montgomery, Alabama, USA.
Daniels, H. V. and C. E. Boyd. 1989. Chemical budgets for polyethylene-lined brackishwater
ponds. Journal of the World Aquaculture Society 20:53-60.
Eaton, A. D., L. S. Clesceri, E. W. Rice, and A. E. Greenberg. 2005. Standard Methods for the
Examination of Water and Wastewater, 21st edition. American Public Health
Association, Washington, DC, USA.
Gross, A. and C. E. Boyd. 1998. A digestion procedure for the simultaneous determination of
total nitrogen and total phosphorus in pond water. Journal of the World Aquaculture
Society 29:300-303.

39
Hargreaves, J. A. 1998. Nitrogen biogeochemistry of aquaculture ponds. Aquaculture 166:181-
212.
Hollerman, W. D. and C. E. Boyd. 1980. Nightly aeration to increase production of channel
catfish. Transactions of the American Fisheries Society 109:446-452.
Hopkins, J. S., R. O. Hamilton II, P. A. Sandifer, C. L. Browdy, and A. D. Stokes. 1993. Effects
of water exchange rate on production, water quality, effluent characteristics, and nutrient
budgets of intensive shrimp ponds. Journal of the World Aquaculture Society 24:304-
320.
Krom, M. D., J. Erez, C. B. Porter, and S. Ellner. 1989. Phytoplankton nutrient uptake
dynamics in earthen marine fishponds under winter and summer conditions. Aquaculture
76:237-253.
Leonard, S. E. 1995. Water quality factors influencing striped bass (Morone saxatilis)
production in lined ponds. Ph.D. dissertation, Auburn University, Auburn, Alabama,
USA.
Masuda, K. and C. E. Boyd. 1994. Phosphorus fractions in soil and water of aquaculture ponds
built on clayey, Ultisols at Auburn, Alabama. Journal of the World Aquaculture Society
25:379-395.
Neori, A., M. D. Krom, I. Cohen, and H. Gordin. 1989. Water quality conditions and particulate
chlorophyll a of new intensive seawater fishponds in Eilat, Israel: daily and diel
variations. Aquaculture 80:63-78.
Steeby, J. A., S. Kingsbury, and J. Hargreaves. 2001. Sediment accumulation in channel catfish
production ponds. Global Aquaculture Advocate 4(3):54-56.
40
Steeby, J. A., J. A. Hargreaves, C. S. Tucker, and S. Kingsbury. 2004. Accumulation, organic
carbon and dry matter concentration of sediment in commercial channel catfish ponds.
Aquacultural Engineering 30:115-126.
Taylor, H. F. W. 1997. Cement Chemistry, 2nd
edition. Academic Press, London, UK.
Torrans, E. L. 2008. Production responses of channel catfish to minimum daily dissolved
oxygen concentrations in earthen ponds. North American Journal of Aquaculture 50:371-
381.
Tucker, C. S., S. W. Lloyd, and R. L. Busch. 1984. Relationships between phytoplankton
periodicity and the concentrations of total and un-ionized ammonia in channel catfish
ponds. Hydrobiologia 111:75-79.
van Rijin, J. 1993. Methods to evaluate water quality in aquaculture. Faculty of Aquaculture,
The Hebrew University of Jerusalem, Rehovot, Israel.

41
Table 1. Characteristics of the two, geotextile liner materials as reported by manufacturers.
Variable
Belton Industries
Style 307
Typar Geotextile
Style 3801 G
Composition of fabric Polypropylene Polypropylene
Type Woven fiber Woven fiber
Color Black Gray
Weight (g/m2) 105.2 272
Specific gravity 0.93 0.91
Apparent opening size (mm) 0.355 0.090
Water flow rate (L/min/m2) 509 328

42
Table 2. Correlation coefficients for relationships of turbidity, total suspended solids, and
chlorophyll a for pooled data from geotextile-lined and control ponds.
Variables Pearsons Correlation Coefficient
Turbidity versus total suspended solids
2008 0.600**
2009 0.482**
Turbidity versus chlorophyll a
2008 0.008
2009 0.001
Total suspended solids versus chlorophyll a
2008 0.013
2009 0.005
**Significant at P < 0.01.

43
Table 3. Grand means for 2008 and 2009 in control ponds and ponds lined with one of two
permeable, geotextiles.
Year Year Year
Liner 2008 2009 2008 2009 2008 2009
pH
Water temperature
(oC)
Total alkalinity
(mg/L)
None (control) 8.24 a 8.24 a 27.08 a 26.45 a 64.16 a 42.46 a
Black 8.26 a 8.26 a 26.93 a 26.67 a 76.03 a 38.05 a
Gray 8.67 a 8.67 b 26.77 a 26.57 a 71.85 a 42.68 a
Total hardness
(mg/L)
Dissolved oxygen
(mg/L)
Total ammonia
nitrogen (mg/L)
None (control) 51.8 a 31.9 a 7.75 a 8.18 a 0.12 a 0.30 a
Black 63.7 ab 29.5 a 8.15 b 9.82 b 0.14 a 0.24 a
Gray 71.9 b 37.6 a 8.36 b 9.34 b 0.14 a 0.18 a
Nitrate-nitrogen
(mg/L)
Nitrite-nitrogen
(mg/L)
Total nitrogen
(mg/L)
None (control) 0.0 a 0.4 a 0.01 a 0.11 a 0.44 a 1.40 a
Black 0.0 a 0.09 a 0.0 a 0.01 b 0.58 ab 2.11 b
Gray 0.0 a 0.16 a 0.0 a 0.01 b 0.73 b 2.17 b

44
Soluble reactive
phosphorus
(mg/L)
Total phosphorus
(mg/L)
Turbidity
(NTU)
None (control) 0.03 a 0.06 a 0.15 a 0.46 a 26.72 a 109.28 a
Black 0.04 a 0.07 a 0.10 a 0.61 b 19.72 a 47.64 b
Gray 0.04 a 0.06 a 0.13 a 1.00 c 41.56 b 52.88 b
Chlorophyll a
(g/L)
5-d biochemical
oxygen demand (mg/L)
None (control) 225 a 54 a 3.06 a 4.48 a
Black 387 ab 391 b 5.68 b 7.03 b
Gray 510 b 453 b 6.08 b 7.00 b
*Means indicated by the same letter did not differ at P < 0.05 as determined by Duncan’s
multiple range test – vertical comparisons only.

45
Table 4. Fish production data for 2008 and 2009 in control ponds and ponds lined with one of
two permeable, geotextiles.
2008 2009
Variable
Control
Black
liner
Gray
liner
Control
Black
liner
Gray
liner
Number stocked 400 400 400 400 400 400
Stocking weight (kg/fish) 0.052 0.052 0.052 0.302 0.287 0.306
Stocking weight (kg/pond) 20.8 20.8 20.8 120.8 114.8 122.4
Harvest weight (kg/pond) 120.5 123.0 122.7 245.1 259.0 266.0
Net production (kg/pond) 99.7 102.2 101.9 124.3 144.2 143.6
Survival (%) 93.6 90.8 90.2 79.8 88.2 76.3
Feed applied (kg/pond) 151.36 151.36 151.36 198.88 198.88 198.88
Feed conversion ratio 1.52 1.48 1.48 1.60 1.38 1.38

46
Figure 1. Concrete retaining wall in earthen ponds at the Auburn University E. W. Shell
Fisheries Center, Auburn, Alabama.

47
Figure 2. Geotextile material used to line ponds at the Auburn University E.W. Shell Fisheries
Center, Auburn, Alabama: Left – Style 307, (Bolton Industries); Right – Style 3801G (Typar
Geotextiles).

48
Figure 3. Sketch (not to scale) of attachment of geotextile liners to bottoms of earthen ponds.

49
Figure 4. Sketch (not to scale) showing the method of securing geotextile liners to concrete
retaining walls in ponds.

50
Figure 5. Photographs showing ponds lined with the black, Style 307 geotextile (upper) and the
gray, style 3801G geotextile (lower).

51
Figure 6. Photograph of a pond in which the gray liner floated

52
Figure 7. Photographs of an unlined pond bottom following fish harvest (upper) and of a lined
pond following fish harvest and removal of the liner.

53
Figure 8. Mean values for pH, water temperature, and concentrations of total alkalinity and
total hardness in ponds lined with two types of geotextile liners and in unlined, control ponds.

54
Figure 9. Mean values for concentrations of dissolved oxygen (DO) and 5-d biochemical
oxygen demand (BOD5) in pond lined with two types of geotextile liners and in unlined, control
ponds.

55
Figure 10. Mean values for concentrations of total ammonia nitrogen (TAN), Nitrate (NO3-N),
Nitrite (NO2-N), and total nitrogen in pond lined with two types of geotextile liners and in
unlined, control ponds.

56
Figure 11. Mean values for concentrations of soluble reactive phosphorus and total phosphorus
in pond lined with two types of geotextile liners and in unlined, control ponds.
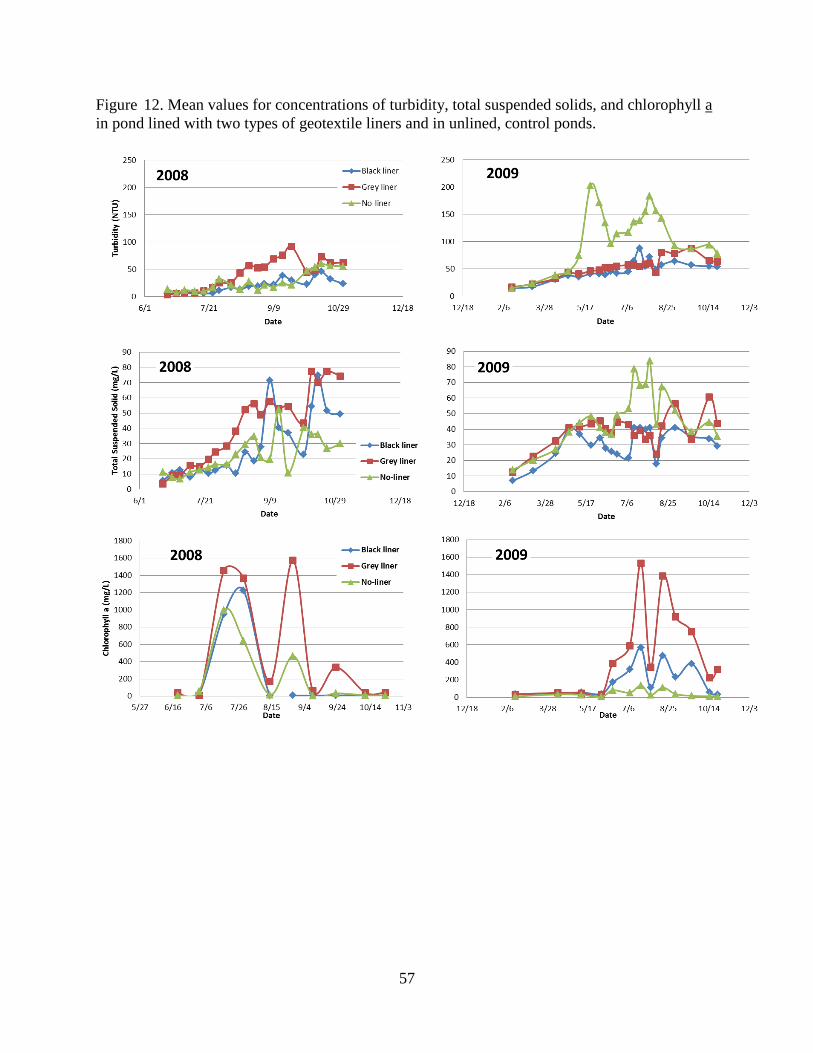
57
Figure 12. Mean values for concentrations of turbidity, total suspended solids, and chlorophyll a
in pond lined with two types of geotextile liners and in unlined, control ponds.

58
IV. Phosphorus Removal by Soil Separated from Water
by Permeable, Geotextiles
Abstract
Six, geotextile liners with apparent opening sizes ranging from 0.090 mm to 0.84 mm
were used to separate soil from water in aquaria. Water was treated with 0.75 mg/L of
phosphorus from monopotassium phosphate. Phosphorus concentration did not decline in aquaria
without soil, and all liners reduced the amount of phosphorus removed by the soil. Phosphorus
removal by soil did not differ among liners with opening size < 0.200, but these liners interfered
less with soil phosphorus uptake than did the liner with 0.090 mm opening size. Final
phosphorus concentrations were 0.089 mg/L in the unlined aquaria with soil, 0.397 mg/L for the
liner with 0.090-mm opening, and 0.157 to 0.202 mg/L for the liners with larger openings.

59
Introduction
The study of water quality and fish production in ponds lined with permeable, geotextiles
revealed that these liners prevent erosion of pond earthwork by waves, aerator-generated water
currents, and bioturbation (Boyd 1995). Although fish survival and production were as good in
the ponds lined with geotextiles as in the control ponds, the liners had a tendency to float, and
they interfered with the uptake of phosphorus by bottom soil. Phosphorus concentration and the
abundance of phytoplankton were greater in the lined ponds than in the control ponds.
The two geotextiles used in the previous experiment had a relatively small apparent pore
sizes – 0.090 and 0.355 mm. Therefore, a laboratory study was conducted to determine if
geotextiles with larger, apparent pore sizes would allow greater uptake of phosphorus by bottom
soil.
Materials and Methods
Samples of six, geofabrics were obtained from Fiberweb, Old Hickory, Tennessee (Table
1). A sample of soil was obtained from the B horizon of the soil profile exposed by a road cut on
the E. W. Shell Fisheries Center at Auburn, Alabama. This area is in the Alabama Piedmont
Plateau and the soil material was a Typic, Kandiudult (clayey, kalonitic, and thermic) (McNutt
1981).
A 5-cm layer of the soil was placed in the bottom of each of 21 aquaria (20-L). Three
liners were made from each geofabric. The material was cut and sewed to make liners of the
same dimensions as the insides of the aquaria. The liners were placed in aquaria – their bottoms
on top of the soil – preventing direct contact of water with soil. Three aquaria with soil did not

60
receive liners, and three more aquaria were not supplied with either soil or liners. Aquaria were
filled with 18-L of tap water and monopotassium phosphorus (KH2PO4) applied to provide 0.75
mg/L of soluble orthophosphate. An air stone was placed 10 cm above the bottom in each
aquarium, and air from an air pump was gently introduced to effect continuous water circulation.
The aquaria were held in a dark room at 23 to 26oC. A 50-mL water sample was collected from
each aquarium after 1, 2, 3, 4, 6, 8, 10, 14, and 18 days. These samples were analyzed for
soluble reactive phosphorus by the ascorbic acid method (Eaton et al. 2005).
Results and Discussion
The phosphorus concentration remained fairly constant in aquaria without soil, but it
declined rapidly in aquaria with soil, reaching a concentration of about 0.1 mg/L after 18 days
(Fig. 1). The phosphorus concentration in aquaria that contained the Typar 3801 geotextile liner
– the one used to line ponds for the experiment described in earlier – declined to an average
concentration of 0.397 mg/L after 18 days (Fig. 1). In aquaria lined with the other Typar
geotextiles, phosphorus concentration declined much faster than in those lined with Typar 3801
geotextile. After 18 d, phosphorus concentrations averaged 0.157 to 0.202 mg/L – lower than for
the Typar 3801 geotextile, but higher than the control (Table 2).
The Typar 3801 geotextile has the smallest apparent opening size and water flow rate
(Table 1) – 0.090 mm and 328 L/min/m2, respectively. Thus, the low permeability of this fabric
likely was the reason that phosphorus concentration was greater in aquaria lined with it than in
aquaria lined with more permeable fabrics. Nevertheless, in spite of the wide range in apparent

61
opening sizes (0.200 to 0.840 mm) and water flow rates (2,050 to 9,635 L/min/m2) in the other
geotextile materials, there were no differences in phosphorus concentration after 18 d (Table 2).
The trapezoidal tear strength and puncture strength of the geotextiles decrease rapidly
with increasing permeability (Table 1). Thus, for use in ponds, it would be desirable to select
one of the materials with apparent opening sizes of 0.2 to 0.3 mm. These three geotextiles would
be stronger than the two geotextiles with larger apparent opening sizes (Table 1). In the
phosphorus uptake study, phosphorus loss from the water was as great for these three geotextiles
as for the two with larger apparent opening sizes.
The results of this small effort suggest that it might be fruitful to repeat the pond lining
study presented earlier using a geotextile of greater apparent opening size. Such a fabric should
interfere less than a finer fabric with normal uptake of phosphorus by bottom soils. The coarse-
weave geotextile might also have less tendency to float.

62
Literature Cited
Boyd, C. E. 1995. Bottom Soils, Sediment, and Pond Aquaculture. Chapman and Hall, New
York, New York, USA.
Eaton, A. D., L. S. Clesceri, E. W. Rice, and A. E. Greenberg. 2005. Standard Methods for the
Examination of Water and Wastewater, 21st edition. American Public Health
Association, Washington, DC, USA.
McNutt, R. B. 1981. Soil Survey of Lee County, Alabama. USDA Soil Conservation Service,
U.S. Government Printing Office, Washington, DC, USA.

63
Table 1. Characteristics of six, geotextile materials.
Apparent opening
size (mm)
Water flow rate
(L/min/m2)
Trapezoidal tear
strength (N)
Puncture
strength (N)
Typar 3801 0.090 328 425 415
Typar 3501 0.200 2,050 270 250
Typar 3401 0.212 2,460 270 180
Typar 3301 0.300 3,895 155 110
Typar 3201 0.590 7,790 110 80
Typar 3151 0.840 9,635 70 45
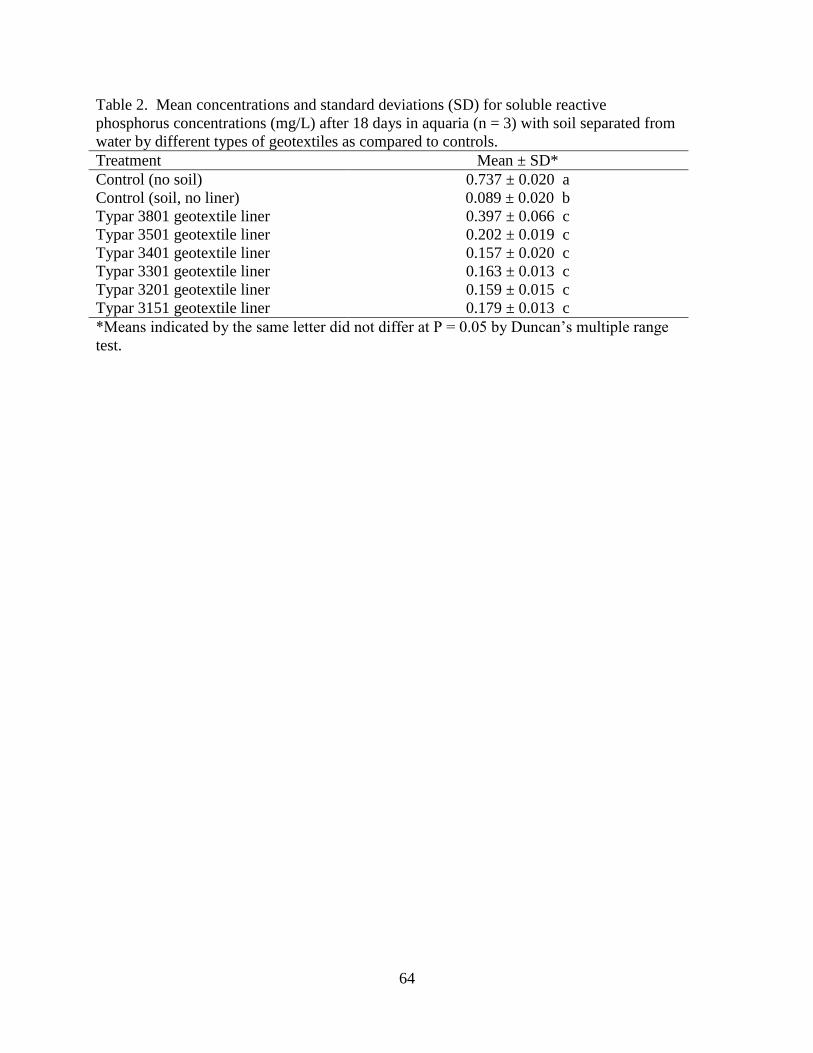
64
Table 2. Mean concentrations and standard deviations (SD) for soluble reactive
phosphorus concentrations (mg/L) after 18 days in aquaria (n = 3) with soil separated from
water by different types of geotextiles as compared to controls.
Treatment Mean ± SD*
Control (no soil) 0.737 ± 0.020 a
Control (soil, no liner) 0.089 ± 0.020 b
Typar 3801 geotextile liner 0.397 ± 0.066 c
Typar 3501 geotextile liner 0.202 ± 0.019 c
Typar 3401 geotextile liner 0.157 ± 0.020 c
Typar 3301 geotextile liner 0.163 ± 0.013 c
Typar 3201 geotextile liner 0.159 ± 0.015 c
Typar 3151 geotextile liner 0.179 ± 0.013 c
*Means indicated by the same letter did not differ at P = 0.05 by Duncan’s multiple range
test.

65
Figure. 1. Mean concentration of soluble reactive phosphorus over a period of 18 days in
aquaria (n = 3) with soil separated from water by differenct type of geotextiles as compared to
controls.

66
V. Effects of Water Quality and Chemical Coagulants on Sedimentation of
Suspended Soil Particles from Water
Abstract
Particles of three soils – each containing a different type of clay – settled at different
rates. Nevertheless, particles tended to settle faster as concentration of total dissolved solids
(TDS) increased in diluted seawater and in freshwater in which total hardness concentration
increased as TDS concentration rose. Several chemical coagulants were tested for their ability to
remove suspended soil particles. Potassium and sodium chloride were comparatively ineffective
for turbidity removal. Calcium sulfate was more effective than magnesium sulfate. Aluminum
chloride and sulfate tended to perform better than ferrous sulfate and ferric chloride. Although
there were some differences in effectiveness of coagulants among the types of soils, calcium
sulfate (gypsum), aluminum sulfate (alum), and aluminum chloride appear to have the greatest
potential for use in ponds. Aluminum compounds neutralize alkalinity and cause a decrease in
pH. Treatment rates (mg/L) for aluminum sulfate and aluminum chloride should not exceed the
total alkalinity (mg/L as CaCO3) to avoid low pH. Knowledge of conductivity, total alkalinity,
total hardness, and type of clay mineral suspended in water can be useful in selecting a suitable
coagulant.

67
Introduction
Turbidity from suspended soil particles resulting from external erosion on watersheds or
internal erosion of earthwork by wave action, bioturbation, and aerator-generated water currents
is a common problem in ponds used for sportfishing or commercial production of aquaculture
species (Boyd 1995). Reduction in erosion will lessen the concentration of suspended particles
to the water column of ponds, but fine soil particles – especially colloidal ones – may remain
suspended indefinitely. The two most common recommendations for clearing turbidity from
ponds are to apply organic matter such as barnyard manure and cut grass or to treat ponds with
calcium sulfate. However, neither of these procedures has been highly successful, because
application rates usually are not great enough (Boyd 1995). Aluminum sulfate – the coagulant
frequently used to remove turbidity from drinking water – was shown to be highly effective in
clearing pond water of turbidity (Boyd 1979; Boyd and Tucker 1998).
The mechanism responsible for mutual repulsion of colloidal clay particles and the
process that causes these particles to coagulate are complex (Stumm and Morgan 1996). A
highly-simplified explanation is that a negatively-charged layer around particles causes them to
repel each other, but introduction of positively-charged cations in surrounding water will
neutralize the negatively-charged layer allowing the particles to coagulate and the resulting floc
will be massive enough to settle (Boyd 1995). It is well known that the greater the charge on
cations, the better they function in removing colloidal clay particles from water (Sawyer et al.
2003) – the reason that aluminum sulfate is widely used for removing turbidity from potable
water.
More information is needed on the effectiveness of various salts that could be used in
aquaculture to remove turbidity from water. It would be particularly useful if a substitute for

68
alum could be found. Because alum has a highly acidic reaction in water, the doses necessary to
remove turbidity from some low-alkalinity waters can cause an excessive reduction in pH (Boyd
and Tucker 1998). Therefore, a laboratory study was conducted to determine the effect of basic
water quality characteristics on the sedimentation rate of soil particles, to evaluate several
possible chemicals as coagulants, and to consider effects of coagulants on water quality.
Materials and Methods
Clayey soil from each of three locations for use in this study were obtained from the B-
horizon of soil profiles. A sample of West Gulf Coastal Plain soil was taken from the catchment
of Lake Rodemacher, the cooling water reservoir for the Cleco Corporation electricity generating
plant near Boyce, Louisiana. This soil was selected because it was responsible for a persistent
turbidity problem that developed in the reservoir following a logging operation and associated
erosion on the catchment (C. E. Boyd, Auburn University, unpublished data).
A sample of soil from the Piedmont Plateau was collected from a road cut at the Alabama
Agricultural Experiment Station near Auburn, Alabama. Ponds built in this physiographic area
typically have persistent turbidity problems following erosion on watersheds (Boyd 1979).
hA sample of Blackland Prairie soil was excavated from a field beside an inland shrimp
farm located near Forkland, Alabama. Ponds in this area may become turbid following erosion
on watersheds, but turbidity usually subsides after a few days. Soils will be referred to as BP
(Blackland Prairie), CP (West Gulf Coastal Plain), and PP (Piedmont Plateau) soils.
The pH of soil samples was measured in a 1:1 mixture of pulverized soil and distilled
water by aid of a glass electrode (Thunjai et al. 2001). Particle-size analysis was done by a

69
simplified, hydrometric method (Weber 1977; Boyd and Tucker 1992). Organic carbon was
determined by the Walkley-Black, sulfuric acid-potassium dichromate oxidation procedure
(Nelson and Sommers 1982). Cation exchange capacity was measured by the ammonium acetate
method (Jackson 1958; Rhoades 1982).
Waters of several compositions were used in sedimentation trials. These included
Auburn, Alabama, municipal tap water diluted 1:1 with distilled water. The diluted tap water
contained 38 to 40 mg/L total alkalinity, 32 to 36 mg/L total hardness, and 70 to 80 mg/L total
dissolved solids (TDS). Waters containing different concentrations of total alkalinity, total
hardness, and TDS (Table 1) were prepared by adding different amounts of sodium bicarbonate
(NaHCO3), calcium sulfate (CaSO42H2O), magnesium chloride (MgCl26H2O), sodium chloride
(NaCl), and potassium sulfate (K2SO4) to diluted tap water. Sodium bicarbonate provided
alkalinity and calcium sulfate and magnesium chloride were sources of hardness. The other
compounds were added to adjust TDS concentration. These solutions included alkalinity
hardness, alkalinity > hardness, and alkalinity < hardness – the usual situations encountered in
natural waters (Boyd 2000).
Waters of widely different salinities were obtained by diluting seawater (28.9 ppt
salinity) obtained from the Gulf of Mexico at the Auburn University Shellfish Laboratory,
Dauphin Island, Alabama with tap water. Aliquots containing 0.5, 1.0, 2.5, 10, 15, 20, and 25
ppt salinity – as measured with a refractometer – were prepared.
Sedimentation trials were conducted in soil test cylinders (35 cm tall 6 cm diameter)
placed on a laboratory bench at temperature of 23 to 26 C. Cylinders were filled with 990 mL of
test water. Soil (20 g) to be used in a sedimentation trial was placed in 300 mL of tap water in a
500-mL beaker. The mixture was vigorously stirred with a wide-bladed spatula to separate and

70
suspend soil particles, and the beaker was held on a magnetic stirrer to assure uniform dispersion
of suspended particles. A 10-mL portion of turbid water from the beaker was removed (without
stopping the stirrer) using a pipet with a wide-bore tip and transferred to each soil test cylinder.
If chemical coagulants were used in a trial, appropriate quantities of each chemical were
weighed, transferred to soil test cylinders, and the chemical thoroughly mixed with the water
using a 60-cm long 1.25-cm diameter dowel pin.
At the beginning of each trial, the content of each cylinder was stirred thoroughly with
the dowel pin, and a 20-mL sample was removed from a depth of 10 cm using a pipet with a
wide-bore tip. Turbidity of the sample was measured with a Orbeco-Hellige Model 965-10 A
Direct Reading Turbidimeter (Orbeco Analytical Systems, Inc, New Jersey, USA), and the
sample was returned to the cylinder. Additional samples were taken from 10-cm depth using a
pipet with a wide-bore tip for turbidity measurement after 1, 2, 3, 4, 5, 8, 12, and 24 h, but the
content of the test cylinder was not stirred before samples were removed. At the end of a trial,
pH and specific conductance were measured using an Orion 3 Star pH Meter (Thermo Scientific,
Singapore) and an Orion 3 Star Conductivity Meter (Thermo Scientific, Singapore), respectively.
The following concentrations of several chemical coagulants were tested initially:
sodium chloride, 271 mg/L; potassium chloride (KCl), 346 mg/L; calcium chloride
(CaCl22H2O), 339 mg/L; calcium sulfate, 400 mg/L; magnesium sulfate (MgSO47H2O), 559
mg/L; ferrous sulfate (FeSO47H2O), 100 mg/L; ferric chloride (FeCl36H2O), 64.9 mg/L;
aluminum chloride (AlCl36H2O), 57.9 mg/L; aluminum sulfate [Al2(SO4)318H2O], 80 mg/L.
These concentrations equated to 4.62 meq/L of sodium, potassium, calcium, and magnesium and
to 0.72 meq/L of iron and aluminum. Based on results of preliminary trials, chemicals were

71
selected for further investigation of the relationship between concentration and degree of
turbidity removal.
Results and Discussion
Water Quality and Sedimentation Rate
The CP and PP soils were acidic, but the BP soil was basic (Table 2). All soils were low
in organic matter concentration. The PP and BP soils each contained more than 50% clay, and
CECs were 4.6 and 50.2 meq/100 g, respectively. The difference in CEC resulted from the type
of clay mineral in soils. Soils in Lee County Alabama typically contain kaolinite (McNutt 1981),
and those in the Blackland Prairie region of Alabama usually contain smectite (Dixon and Nash
1968). Typical CECs for pure kaolinite and smectite are 1 to 10 meq/100 g and 80 to 120
meq/100 g, respectively (Goldberg et al. 2000). The size of the soil sample from the West Gulf
Coastal Plain in Louisiana proved inadequate to allow analyses of particle-size distribution and
CEC, and it was not possible to obtain an additional quantity of this soil. However, the sample
had a very high clay content as obvious from feel and from the amount of the material that
remained suspended in water when a small amount mixed with water was allowed to stand
overnight. Dr. Joey Shaw of the Department of Agronomy and Soils at Auburn University
thought that the clay in the CP soil likely consisted mainly of vermiculite. This clay mineral has
a very high CEC – typically 120 to 150 meq/100 g (Goldberg et al. 2000). Thus, the CP soil
likely had a CEC value greater than that of the BP soil.

72
Soils each resulted in a different turbidity when introduced into diluted tap water in soil
test cylinders (Fig. 1). In the trial depicted in Fig. 1, initial turbidity ranged from 156
nephelometer turbidity units (NTU) for the CP soil to 405 NTU for the BP soil. In addition to
variation in initial turbidity among test cylinders with different soils, there also were variations in
initial turbidity within test cylinders receiving the same soil. The average initial turbidities were
as follows: BP soil – mean = 286 ± 100 NTU, range = 182 to 540 NTU; CP soil – mean = 177±
43 NTU, range = 109 to 252 NTU; PP soil – mean = 381 ± 86 NTU, range = 216 to 547 NTU.
This variation was between trials; all cylinders for a given trial were filled from the same soil-
water mixture and had equal turbidities. In order to facilitate evaluation and presentation of data,
the percentage of initial turbidity remaining at each sampling time was estimated as follows:
Turbidity remaining at a given time (%) = (100) Turbidity at that time (NTU)
Initial turbidity (NTU)
It also can be seen from Fig. 1 that sedimentation of particles of the three soils in diluted
tap water occurred at different rates. Turbidity quickly declined by about 50% with the BP soil
in about 8 h, and an even greater decline was observed after 8 h with the PP soil. However,
turbidity declined little in diluted tap water containing the CP soil. After 8 h, sedimentation rate
became quite slow for all soils. Soils differed in particle-size distribution (Table 2), and in
sedimentation trials (Fig. 1), most particles that settled quickly were likely sand or silt size. The
rather stable turbidity during trials in cylinders containing the CP soil probably resulted from the
soil being mostly clay. Residual turbidity after 24 h was much greater for the CP and BP soils
than for the PP soil. This probably is the result of clay fractions of these two soils having a high
CEC and a great degree of mutual repulsion among particles.

73
Increasing salinity in test water had a marked influence on sedimentation of particles –
especially for the CP soil (Fig. 2). Turbidity remaining after 4 h decreased from about 80% at
0.075 ppt salinity to about 35% at 0.5 ppt salinity and about 15% at 2.5 ppt salinity for the CP
soil. Although the trial included salinities up to 25 ppt, data presentation was limited to 10 ppt,
because there was no difference in sedimentation rate at greater salinities. Because
sedimentation continued slowly after 8 h, it was decided to present only 24-h data in describing
most trials.
Freshwater is considered to contain no more than 1,000 mg/L TDS (Boyd 2000), and
salinity and TDS usually have almost equal concentrations. Thus, increasing the degree of
mineralization of freshwater should favor sedimentation. However, the salinity trial (Fig. 2) was
conducted in diluted seawater. Such water is high in concentration of all major ions (Brown et
al. 1989), and it has a much greater total hardness than total alkalinity – the undiluted sample
used in this study contained 6,495 mg/L total hardness but only 121.3 mg/L total alkalinity.
For the CP soil in water of similar alkalinity and hardness (TA = TH), the percentage of
turbidity remaining after 12 h (Fig. 3) was greater for water with low TDS concentration (75
mg/L) than at greater TDS (369 and 663 mg/L). Turbidity remaining tended to be greater in the
water with moderate TDS concentration for several hours; but, after 24 h, there was much less
difference between the two waters. Moreover, at this time, loss of turbidity was much greater for
both 369 and 663 mg/L TDS than for 75 mg/L TDS. When trials with the CP soil were
conducted in water of low total alkalinity but high total hardness (TA < TH), but at the same
TDS concentrations used for the trial with (TA = TH), turbidity removal in the two higher
salinity water was much greater than in diluted tap water (75 mg/L TDS). There was, however,
no appreciable difference in turbidity removal related to time between sedimentation trials

74
conducted in waters of 369 and 663 mg/L TDS. When total hardness concentration was 38 mg/L
(75 mg/L TDS) and alkalinity increased to 138 mg/L (369 mg/L TDS) and 238 mg/L (663 mg/L
TDS), there was no apparent increase in turbidity decline in the more highly-mineralized waters
(Fig. 3).
A similar pattern with respect to relationships of alkalinity, hardness, and TDS
concentrations to sedimentation rate was observed for the BP soils, but particles of the BP soil
settled faster than those of the CP soil (Fig. 3). Turbidity loss was fairly great for the BP soil
even in diluted tap water. The PP soil particles settled fairly well in all three types of water (Fig.
3). It should be noted that salinity concentrations in waters used in trials depicted in Fig. 3 were
the same as TDS concentration. In natural waters, salinity also is usually about the same
concentration as TDS (Boyd 2000).
Results of sedimentation trials depicted in Figs. 2 and 3 reveal interesting information
about sedimentation of soil particles. They settle very quickly in highly-diluted seawater – even
at 0.5 ppt salinity; particles of all three soils had almost completely settled within 24 h. This
does not necessarily imply, however, that as total dissolved solids concentration increases, soil
particles will settle more quickly from freshwater. Freshwater can vary considerably in
composition; waters of the same salinity may differ in concentrations of ions responsible for
alkalinity and hardness: (1) a large part of TDS concentration in many waters results from the
anion bicarbonate and the divalent cations calcium and magnesium – sources of alkalinity and
hardness, respectively; (2) a large part of the TDS in a second type of water is contributed by
bicarbonate and monovalent cations sodium and potassium (this water has distinctly greater
alkalinity than hardness); (3) in a third type of water, much of the TDS is from calcium and

75
magnesium ions that are associated with the anions chloride and sulfate (hardness is considerably
greater than alkalinity).
Sedimentation rate results for the CP soil revealed that water must increase in calcium
and magnesium concentration as TDS concentration increases if a positive relationship between
TDS concentration and settling rate is to occur. The results for the BP soil tend to show the same
trend as the CP soil, but the PP soil particles settled rather quickly in all three types of water.
Thus, all soil particles cannot be expected to settle at the same rate at a particular TDS
concentration or in a specific type of freshwater.
Coagulants for Turbidity Removal
Results of preliminary trials of chemical coagulants (Fig. 4) revealed that calcium
chloride, calcium sulfate, magnesium sulfate, ferrous sulfate, aluminum sulfate, and aluminum
chloride provided the best overall removal of soil particles. Although sodium chloride,
potassium chloride, and ferric chloride were removed from further consideration because of
lower, overall efficiency in particle removal, in some cases these compounds actually did as well
or better than one or more of the compounds selected for further investigation – especially for the
PP soil.
Calcium sulfate – often called gypsum – was quite effective in precipitating suspended
particles of the CP and BP soils – 40 mg/L of this compound removed over 90% of turbidity
(Fig. 5). It was less effective for removing turbidity caused by the PP soil; a concentration of
120 mg/L removed only about 50% of turbidity. Gypsum has been widely recommended for
removing turbidity from farm ponds (Boyd and Tucker 1998). It is a safe compound to handle,

76
and it does not cause a change in pH (Fig. 6). The increase in specific conductance resulting
from gypsum (Fig. 7) is from calcium and sulfate ions. These ions will not be removed from
water bodies quickly by chemical reactions, and calcium will remain to provide protection
against turbidity until flushed from ponds in overflow after rainfall events.
Calcium chloride was quite similar to calcium sulfate in removing soil particles (Fig. 5) –
an observation that is not surprising as results in Fig. 3 show that divalent cations rather than
associated anions are responsible for accelerating sedimentation of soil particles. However,
calcium chloride is less commonly available and more expensive than calcium sulfate –
especially agricultural gypsum.
Magnesium sulfate was of similar effectiveness as calcium sulfate for removing BP and
PP soil particles. However, it is surprising and not clear why magnesium sulfate was less
effective than calcium sulfate in removing turbidity when the source of particles was the CP soil
(Fig. 5). Magnesium sulfate and calcium sulfate had similar effects on pH and conductivity
(Figs. 6 and 7).
Ferrous sulfate caused a marked reduction in turbidity at 20 mg/l for all soils, but at
higher concentrations turbidity removal was less (Fig. 5). There was a decrease in pH – although
not particularly large in comparison to that observed for aluminum compounds – with increasing
concentrations of ferrous sulfate (Fig. 6). This probably was the result of hydrolysis of ferrous
iron (Boyd 2000):
Fe2+
+ H2O = Fe(OH)+ + H
+.

77
Sawyer et al. (2003) warned that turbidity removal by aluminum sulfate commonly used
for clearing turbidity from water for municipal water supply will be ineffective in low alkalinity
waters, and they recommended liming before application of aluminum sulfate in such waters.
The increase in conductivity per concentration unit was greater for ferrous sulfate than for
calcium and magnesium compounds (Fig. 7). This observation also is not surprising, because of
the decline in pH – increase in hydrogen ion. The equivalent conductance of hydrogen ion is
349.8 mhocm2/eq while those of calcium, magnesium, and other cations are less than 75
mhocm2/eq (Laxen 1977). However, hydrogen ion is not very effective as a coagulant for
colloidal soil particles.
Aluminum sulfate and aluminum chloride were highly effective in removing turbidity
when used at 10 mg/L. There was a tendency of less turbidity removal when these compounds
were used at greater concentrations. This resulted because both compounds caused a marked
decline in pH when used at concentrations above 10 mg/L (Fig. 6). The source of acidity from
aluminum sulfate and aluminum chloride is hydrolysis of aluminum ion (Boyd 2000) as follows:
Al3+
+ H2O = Al(OH)3 + 3H+
Hydrogen ion neutralizes alkalinity causing a decline in pH:
HCO3- + H
+ = H2O + CO2.
Alkalinity concentration is expressed in milligrams per liter of equivalent calcium carbonate – at
least in the United States. The following stoichiometric relationship exists for alum:

78
Al2(SO4)318H2O = 2Al3+
= 6H+ = 3CaCO3.
Thus, 1 mg/L of alum (m.w. = 666.42) would theoretically neutralize 0.45 mg/l CaCO3 (m.w. =
100) or total alkalinity. Using this approach, the neutralization of total alkalinity (CaCO3) by
aluminum chloride (m.w. = 241.43) and ferrous chloride (m.w. = 270.32) would be 0.62 mg/L
and 0.55 mg/L, respectively. Thus, an alkalinity reduction of 0.45 to 0.62 mg/L per each 1 mg/L
of the coagulating agents would occur. Excessively low pH could be avoided by never applying
a concentration of one of these three coagulating agents that exceeds the total alkalinity. Liming
before using these three coagulating agents also could avoid a low pH.
Further testing of lower concentrations of aluminum sulfate revealed that concentrations
of 5 mg/L or less of this chemical would not reduce turbidity below 60% of the initial
concentration after 24 h when the sources of turbidity were PP or BP soils (Table 3). However, 2
mg/L of aluminum sulfate removed nearly 95% of turbidity when CP soil was the source of
turbidity.
Aluminum chloride at 5 mg/L reduced turbidity to 50% of initial concentration for the PP
soil in 24 h (Table 3). However, 5 mg/L of this chemical reduced turbidity by BP soil to 14.7%
of the initial value, and 4 mg/L reduced turbidity caused by CP soil to 1.2% of the starting
concentration.
Conclusions

79
This study suggests that particles of some soils – possibly those with high cation
exchange capacities – may be expected to cause more persistent turbidity than others.
Nevertheless, the findings clearly reveal that the tendency of fine particles of the three soils to
remain suspended in marine or estuarine water decreases with greater TDS concentration
(salinity). The same also may be said for freshwater provided total hardness concentration
increases as TDS concentration rises. Freshwaters most likely to develop persistent turbidity
following input of suspended clay particles are those with low total hardness concentration.
The findings also revealed that calcium sulfate is effective at 20 to 40 mg/L in removing
suspended clay particles of soil with a high CEC – soils CP and BP, but it was not effective for
removing particles of the low CEC, PP soil. Aluminum sulfate and aluminum chloride
concentrations 5 mg/L or less lead to effective removal of suspended particles of CP soil, but
about 10 mg/L was necessary for similar removal of particles of the other two soils.
Considering the variability in turbidity resulting from different clay minerals and water
chemistries, and the differences in response to coagulating suspended clay particles by the
chemical coagulants, water should be analyzed for conductivity, total hardness, and total
alkalinity before deciding upon a coagulant. The type of clay causing the turbidity also could
help choose the coagulant. Finally, it would be desirable to conduct a trial with the selected
coagulant to determine the optimum treatment concentration.

80
Literature Cited
Boyd, C. E. 1979. Aluminum sulfate (alum) for precipitating clay turbidity from fish ponds.
Transactions of the American Fisheries Society 108:307-313.
Boyd, C. E. 1995. Bottom Soils, Sediment, and Pond Aquaculture. Chapman and Hall, New
York, New York, USA.
Boyd, C. E. 2000. Water Quality, an Introduction. Kluwer Academic Publishers, Boston,
Massachusetts, USA.
Boyd, C. E. and C. S. Tucker. 1992. Water Quality and Pond Soil Analyses for Aquacutlure.
Alabama Agricultural Experiment Station, Auburn University, Auburn, Alabama, USA.
Boyd, C. E. and C. S. Tucker. 1998. Pond Aquaculture Water Quality Management. Kluwer
Academic Publishers, Boston, Massachusetts, USA.
Brown, J., A. Collins, D. Park, J. Phillips, D. Rothery, and J. Wright. 1989. Seawater: Its
Composition, Properties, and Behaviour. Pergamon Press, New York, New York, USA.
Dixon, J. B. and V. E. Nash. 1968. Chemical, mineralogical and engineering properties of
Alabama and Mississippi Blackbelt soils. Alabama and Mississippi Agricultural
Experiment Stations and United States Department of Agriculture Soil Conservation
Service, Southern Cooperative Series Number 130, Auburn University, Auburn,
Alabama, USA.
Goldberg, S., I. Lebron, and D. L. Squarez. 2000. Soil colloidal behavior. Pages B195-B240 in
M. E. Summer, editor. Handbook of Soil Science. CRC Press, Boca Raton, Florida,
USA.
Jackson, M. L. 1958. Soil Chemical Analysis. Prentice-Hall Inc., Englewood Cliffs, New
Jersey, USA.

81
Laxen, D. P. H. 1977. A specific conductance method for quality control in water analysis.
Water Research 11:91-94.
McNutt, R. B. 1981. Soil Survey of Lee County, Alabama. USDA Soil Conservation Service,
U. S. Government Printing Office, Washington, DC, USA.
Nelson, D. W. and L. E. Sommers. 1982. Total carbon, organic carbon, and organic matter.
Pages 539-579 in A. L. Page, R. H. Miller, and D. R. Keeney (editors). Methods of Soil
Analysis, Part 2. Chemical and Microbiological Properties. American Society of
Agronomy, Madison, Wisconsin, USA.
Rhoades, J. D. 1982. Cation exchange capacity. Pages 149-158 in A. L. Page, R. H. Miller, and
D. R. Keeney (editors). Methods of Soil Analysis, Part 2. Chemical and Microbiological
Properties. American Society of Agronomy, Madison, Wisconsin, USA.
Sawyer, C. N., P. L. McCarty, and G. F. Parkin. 2003. Chemistry for Environmental
Engineering and Science, 3rd
edition. McGraw Hill, New York, New York, USA.
Stumm, W. and J. J. Morgan. 1996. Aquatic Chemistry, 3rd
edition. John Wiley & Sons, Inc.,
New York, New York, USA.
Thunjai, T., C. E. Boyd, and K. Dube. 2001. Pond soil pH measurement. Journal of the World
Aquaculture Society 32:141-152.
Weber, J. B. 1977. Soil properties, herbicide sorption and model soil systems. Pages 59-62 in
B. Truelove (editor). Research Methods in Weed Science, 2nd
edition. Southern Weed
Science Society, Auburn, Alabama, USA.

82
Table 1. Total alkalinity (TA), total hardness (TH), and total dissolved solids (TDS)
concentrations and pH in freshwater samples used in sedimentation rate trials.
Alkalinity to TDS Concentration (mg/L)
hardness level TA TH TDS pH
TA TH Low 38 36 75 7.25
Medium 138 136 369 8.05
High 238 236 663 8.40
TA > TH Medium 138 36 369 8.01
High 238 36 663 8.45
TA < TH Medium 38 136 369 7.09
High 38 236 663 7.27

83
Table 2. Properties of soils used as sources of suspended solids in sedimentation trials.
Soila
Property PP BP CP
pH 5.00 7.44 4.16
Organic carbon (%) 0.63 1.92 0.20
Sand (%) 23.3 5.0 --
Silt (%) 24.3 26.0 --
Clay (%) 52.4 69.0 --
Cation exchange capacity
(meq/100 g)
4.6
50.2
--
aPP = Piedmont Plateau; BP = Blackland Prairie; CP = West Gulf Coastal Plain.

84
Table 3. Effectiveness of low concentrations of aluminum sulfate and aluminum chloride
for turbidity removal.
Concentration Soil used to create turbidity
(mg/L) PP BP CP
Aluminum sulfate
0 100.0 100.0 100.0
1 100.0 90.9 14.9
2 77.8 81.8 5.4
3 77.8 81.8 3.6
4 66.7 81.8 3.0
5 66.7 63.6 3.0
Aluminum chloride
0 100.0 100.0 100.0
1 61.1 73.5 23.6
2 61.1 52.9 5.9
3 61.1 47.0 2.4
4 50.0 26.4 1.2
5 50.0 14.7 1.2 aPP = Piedmont Plateau; BP = Blackland Prairie; CP = West Gulf Coastal Plain.

85
Figure 1. Changes in turbidity over time in cylinders containing water and suspended particles
of three, different soils: CP soil, West Gulf Coastal Plain; BP Soil, Blackland Prarie; PP soil,
Piedmont Plateau.
0
100
200
300
400
500
0 4 8 12 16 20 24
Tu
rbid
ity
(N
TU
)
Time (hr)
BP soil
CP soil
PP soil

86
Figure 2. Changes in turbidity in cylinders containing waters of different salinity (diluted
seawater) and suspended particles of three, different soils: CP soil, West Gulf Coastal Plain; BP
soil, Blackland Prarie; PP soil, Piedmont Plateau.
0
50
100
0 4 8 12 16 20 24Tu
rbid
ity
rem
ain
ing
(%
)
Hour
0 ppt of Salinity
0
50
100
0 4 8 12 16 20 24Hour
0.5 ppt of Salinity
LA
BB
ST
0
50
100
0 4 8 12 16 20 24
Tu
rbid
ity r
emain
ing (
%)
Hour
1 ppt of Salinity
0
50
100
0 4 8 12 16 20 24
Hour
2.5 ppt of Salinity
LA
BB
ST
0
50
100
0 4 8 12 16 20 24
Tu
rbid
ity r
emain
ing (
%)
Hour
5 ppt of Salinity
0
50
100
0 4 8 12 16 20 24
Hour
10 ppt of Salinity
LA
BB
ST
CP
BP
PP
CP
BP
PP
CP
BP
PP

87
Figure 3. Change in turbidity in cylinders containing freshwater of three compositions and
suspended particles of three, different soils: CP soil, West Gulf Coastal Plain; BP soil, Blackland
Prarie; PP soil, Piedmont Plateau.
CP
BP
PP
0
50
100
0 4 8 12 16 20 24
0
50
100
0 4 8 12 16 20 240
50
100
0 4 8 12 16 20 24
0
50
100
0 4 8 12 16 20 24
0
50
100
0 4 8 12 16 20 24
0
50
100
0 4 8 12 16 20 24
0
50
100
0 4 8 12 16 20 24
0
50
100
0 4 8 12 16 20 24
0
50
100
0 4 8 12 16 20 24
TA<TH
TA=TH TA<TH TA>TH
TA=TH TA<TH TA>TH
TA=TH TA>TH
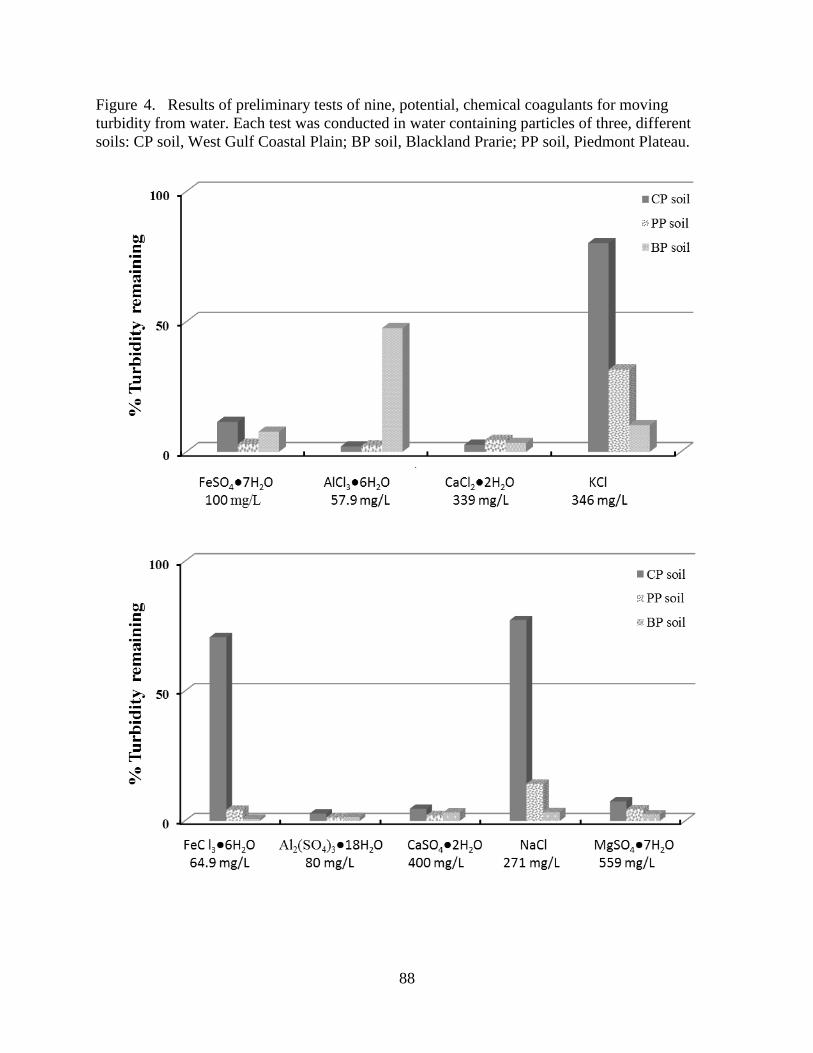
88
Figure 4. Results of preliminary tests of nine, potential, chemical coagulants for moving
turbidity from water. Each test was conducted in water containing particles of three, different
soils: CP soil, West Gulf Coastal Plain; BP soil, Blackland Prarie; PP soil, Piedmont Plateau.

89
Figure 5. Effectiveness of different coagulants in removing turbidity from water. Each test was
conducted in water containing particles of three, different soils: CP soil, West Gulf Coastal Plain;
BP soil, Blackland Prarie; PP soil, Piedmont Plateau.

90
Figure 6. Effectiveness of different concentration of six, chemical, coagulants on pH. Each test
was conducted in water containing particles of three, different soils: CP soil, West Gulf Coastal
Plain; BP soil, Blackland Prarie; PP soil, Piedmont Plateau.

91
Figure 7. Effectiveness of different concentration of six, chemical, coagulants on conductivity.
Each test was conducted in water containing particles of three, different soils: CP soil, West Gulf
Coastal Plain; BP soil, Blackland Prarie; PP soil, Piedmont Plateau.

92
VI. Conclusions
Erosion control in production ponds is important to maintain the integrity of the
earthwork and avoid excessive sediment accumulation in the bottom of ponds. Control of erosion
on watersheds and embankments can decrease the input of solids to ponds, reduce turbidity, and
reduce concentrations of suspended solids in effluents (Boyd 2003). The three experiments in
this study were designed to identify solutions to erosion and associated problems in aquaculture
ponds.
Evaluation of two, porous, geofabric liners for erosion control in small aquaculture ponds
Three ponds each were lined with a permeable geotextile with 0.090-mm opening sizes, a
permeable geotextile with 0.355-mm opening sizes, or served as unlined, controls. During the 2-
yr study, geotextile liners did not tear or decay. This prevented erosion of the bottom of the
ponds stocked with a high density of channel catfish and aerated nightly. The liners tended to
float up in the water column; the liner with smaller opening sizes floated in all three ponds, while
the other liner floated in only one pond. Fish production, survival, and feed conversion ratio did
not differ (P > 0.05) among the control and lined ponds or between liner types.
Water quality variables often differed between lined ponds and control ponds. The
greatest difference was higher phytoplankton abundance in the lined ponds―especially in ponds
lined with the less permeable geotextile – than in the control. This difference was attributed to
93
differences in phosphorus uptake by bottom soils related to the liners and their permeability.
However, in spite of more phytoplankton growth in lined ponds, the control ponds tended to
have higher turbidity because of erosion of bottoms by aeration.
Phosphorus removal by soil separated from water by permeable, geotextiles
Six kinds of geotextile liners with apparent opening sizes ranging from 0.090 mm to 0.84
mm were installed in separate soil from water in aquaria. Water was treated with 0.75 mg/L of
phosphorus from monopotassium phosphate. Phosphorus concentration did not decline in
aquaria without soil, and all liners reduced the amount of phosphorus removed by the soil.
Phosphorus removal from soil did not differ among liners with opening size < 0.200, but these
liners interfered less with soil phosphorus uptake than did the liner with 0.090-mm opening size.
Final phosphorus concentrations were 0.089 mg/L in the unlined aquaria with soil, 0.397 mg/L
for the liner with 0.090-mm openings, and 0.157 to 0.202 mg/L for the liners with larger
openings.
Effects of water quality and chemical coagulants on sedimentation of suspended soil
particles from water
Particles of three soils – each containing a different type of clay – settled at different
rates. Nevertheless, particles tended to settle faster as concentration of total dissolved solids

94
(TDS) increased in diluted seawater and in freshwater in which total hardness concentration
increased as TDS concentration rose. Several chemical coagulants were tested for their ability to
remove suspended soil particles. Potassium and sodium chloride were comparatively ineffective
for turbidity removal. Calcium sulfate was more effective than magnesium sulfate. Aluminum
chloride and sulfate tended to perform better than ferrous sulfate and ferric chloride. Although
there were some differences in effectiveness of coagulants among the types of soils, calcium
sulfate (gypsum), aluminum sulfate (alum), and aluminum chloride appear to have the greatest
potential for use in ponds. Aluminum compounds neutralize alkalinity and cause a decrease in
pH. Treatment rates (mg/L) for aluminum sulfate and aluminum chloride should not exceed the
total alkalinity (mg/L as CaCO3) to avoid low pH. Knowledge of conductivity, total alkalinity,
total hardness, and type of clay mineral suspended in water can be useful in selecting a suitable
coagulant.
Future studies
For the future, studies of geotextile should investigate the exchange rate of nutrients
between the soil and water with more porous geotextiles, because the lined-pond study involved
geotextiles with relatively fine mesh size, but larger size may have different effects. Moreover,
the durability of the fabric should be carefully studied, and ways of preventing the fabric from
floating most be devised.
The economics of the use of geotextiles also must be considered. In research ponds,
economics may not be the major concern, provided the techniques stabilize earthwork. Erosion
control in ponds could save on maintenance and also provide a more controlled environment in

95
which to investigate aquaculture issues. However, in commercial production the geofabric liners
would have to be cost effective.

96
Literature Cited
Boy, C.E. 2003. Guidelines for aquaculture effluent management at the farm-level. Aquaculture.
226: 101– 112.