equivalent oxidation exposure - time for low …cdn.intechweb.org/pdfs/20007.pdf · equivalent...
TRANSCRIPT

11
Equivalent Oxidation Exposure - Time for Low Temperature Spontaneous Combustion of Coal
Kyuro Sasaki and Yuichi Sugai Department of Earth Resources Engineering, Kyushu University
Japan
1. Introduction
Coal is a combustible material applicable to a variety of oxidation scenarios with conditions ranging from atmospheric temperature to ignition temperature. One of the most frequent and serious causes of coal fires is self-heating or spontaneous combustion. Opening an underground coal seam to mine ventilation air, such as long-wall gob and goaf areas and coal stockpiles, creates a risk of spontaneous combustion or self-heating. Careful management and handling of coal stocks are required to prevent fires. Furthermore, the spontaneous combustion of coal also creates a problem for transportations on sea or land. Generally, the self-heating of coal has been explained using the imbalance between the heat transfer rate from a boundary surface to the atmosphere and heat generation via oxidation reaction in the stock. The oxidation reaction depends on temperature and the concentrations of unreacted and reacted oxygen. When carbon monoxide exceeds a range of 100 to 200 ppm in the air around the coal and its temperature exceeds 50 to 55°C, the coal is in a pre-stage of spontaneous combustion. Thus, comprehensive studies of the mechanisms and processes of oxidation and temperature increase at low temperature (less than 50 to 55°C) have been investigated for long years. Measurement of the heat generation rate using crushed coal samples versus constant temperature have been reported to evaluate its potential for spontaneous combustion. Miyakoshi et al.(1984) proposed an equation guiding heat generation in crushed coal via oxygen adsorption based on a micro calorimeter. Kaji et al. (1987) measured heat generation rate and oxygen consumption rate of three types of crushed coal at constant temperatures. They presented an equation to estimate heat generation rate against elapsed time. However, their time was defined under a constant temperature of coal, thus it is not able to be applied for the process with changing temperature of coal. According to our observations of surface coal mines, the spontaneous combustion of coal initiates at coal seam surfaces as "hot spots," which have temperatures ranging from around 400 to 600 °C. Generally, the hot spot has a root located at a deeper zone from the outside surface of the coal seam or stock that is exposed to air. When the hot spot is observed on the surface, it is smoldering because of the low oxygen concentration. The heat generation rate from coal in the high temperature range (over 60°C) follows the Arrhenius equation, which is based on a chemical reaction rate that accelerates self-heating. Brooks and Glasser (1986) presented a simplified model of the spontaneous combustion of coal stock using the Arrhenius equation to estimate heat generation rate. They used a natural convection model
www.intechopen.com
Heat Analysis and Thermodynamic Effects
236
to serve as a reactant transport mechanism. Carresl & Saghafil (1998) have presented a numerical model to predict spoil pile self heating that is due mainly to the interaction of coal and carbonaceous spoil materials with oxygen and water. The effects of the moisture content in the coal on the heat generation rate and temperature are not considered in this chapter. However, Sasaki et al. (1992) presented some physical modeling of these effects on coal temperature. Yuan and Smith (2007) presented CFD modeling of spontaneous heating in long-wall gob areas and reported that the heat has a corresponding critical velocity. However, when the Arrhenius equation is used for a small coal lump, the calculation does not show a return to atmospheric temperatures. This can be seen from the data shown in Fig. 1. The reason, that the results cannot be applied to small amounts of coal stock, may be a type of ageing effect. Nordon (1979) proposed this as a possible explanation using the Elovich equation that has been used in adsorption kinetics based on the adsorption capacity. He also presented a model for the self-heating reaction of coal and identified two steady-state temperature conditions one less than and one over 17°C. He also commented that the transport processes of diffusion and convection take the mobile reactant, oxygen, from the boundary to the distributed reaction where heat energy is released, and then convey the latter back to the boundary. However, his concept is difficult to apply to numerical models. In this chapter, a model is presented for spontaneous combustions of coal seam and coal
stock. It is based on time difference between thermal diffusion and oxygen diffusion.
Furthermore, the concept of “Equivalent Oxidation Exposure Time (EOE time)” is
presented. Also, we compared the aging time to the oxidation quantity to verify the
mechanism presented. Numerical simulations matching both the thermal behaviors of large
stocks and small lumps of coal were performed.
Large Size
Small size
0
Tem
per
atu
re, θ
Elapsed time from start of oxidation, t
Numerical Results with Arrhenius Equation
Actual Temperature Curve
Lump Coal
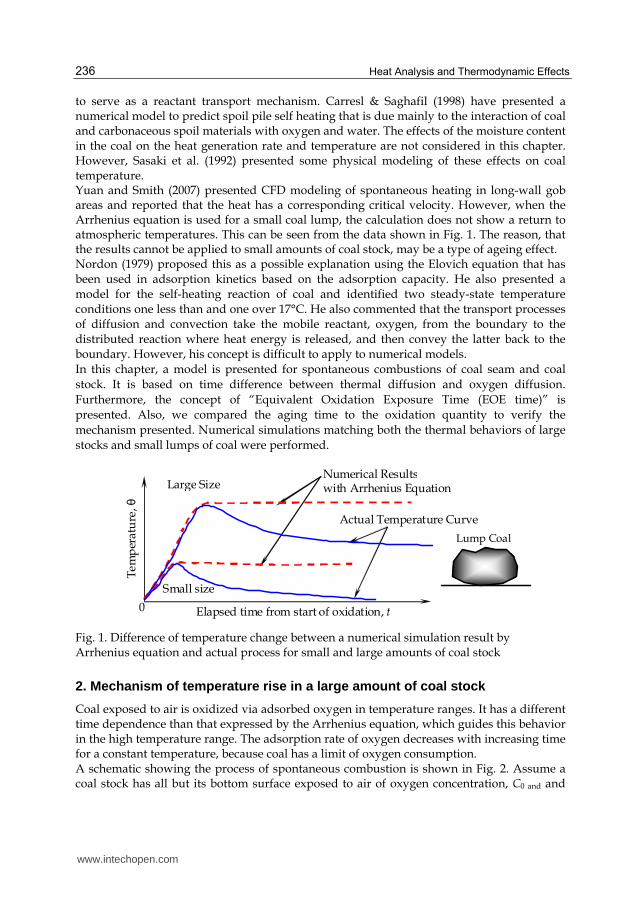
Fig. 1. Difference of temperature change between a numerical simulation result by Arrhenius equation and actual process for small and large amounts of coal stock
2. Mechanism of temperature rise in a large amount of coal stock
Coal exposed to air is oxidized via adsorbed oxygen in temperature ranges. It has a different time dependence than that expressed by the Arrhenius equation, which guides this behavior in the high temperature range. The adsorption rate of oxygen decreases with increasing time for a constant temperature, because coal has a limit of oxygen consumption. A schematic showing the process of spontaneous combustion is shown in Fig. 2. Assume a coal stock has all but its bottom surface exposed to air of oxygen concentration, C0 and and
www.intechopen.com

Equivalent Oxidation Exposure-Time for Low Temperature Spontaneous Combustion of Coal
237
temperature, θ0. Oxidation heat is generated in the coal is started from outside surface of the stock, because oxygen is supplied from the atmosphere. Some heat is lost to the atmosphere, but some also diffuse to inward to the center of the stock. The outer part of the stock returns to the atmospheric temperature, θ0, after enough time. However, the oxygen concentration of the inside stock is kept at a relatively low concentration, because oxygen does diffuse to the inner zone via the oxidation zone. When coal at the center of the stock is preheated slowly without oxygen, a high temperature spot at the center is generated. The oxidation and heat generation zone gradually moves from the stock surface to the center while shrinking and rising in temperature. Finally a hot spot is formed at the center (see Fig. 2 (a) to (c)). Oxygen diffuses to center region after formation of the hot spot. This time delay of oxygen diffusion allows the coal temperature to rise exponentially in the center by long preheating and inducing smaller EOE time (see 3.3). Thus, of the greater the volume in the coal stock, the more delay between preheating and oxygen diffusion. After formation of the hot spot in the center, the coal begins to burn slowly without flames and projects toward the outer surface through paths with relatively high effective diffusivity, which has greater oxygen concentration than the surrounding coal. Finally, the hot spot appears on the outside surface of the stock, which marks the start of spontaneous.
Projection of Hot Spot to Surface
(d)
Oxidation and Heat Generating Zone
Low Oxygen Concentration Zone
Low Temperature Zone returned to θ0
(a)
(b)
(c)
Heat Transfer & Radiation
Heat Transfer & Radiation
Preheated & Low CO
Z
θ0, C0
θ0, C0 θ0, C0
θ0, C0
Hot Spot Formation
Preheated Zone
Heat Transfer & Radiation
Fig. 2. Schematic process showing spontaneous combustion of large amount of coal stock, (a), (b) and (c): Hot spot forming process with accumulating heat and shrinking zone of oxidation and preheating zone, (d): Projection growth of hot spot toward to stock surface through high permeable path
www.intechopen.com

Heat Analysis and Thermodynamic Effects
238
3. EOE time and heat generation rate of coal
3.1 Heat generation rate from coal In the present model, coal oxidation reaction includes physical adsorption and chemical adsorption via oxygen reaction at low temperatures. Measurements of the heat generation rate at the early stages of the process that show an exponential decrease have been reported by many experiments, such Kaji et al. (1987), shown in Fig. 3, and Miyakoshi et al.(1984). Based on their measurement results, the heat generation rate per unit mass of coal at temperature θ (°C), q (W/g or kW/kg), can be expressed with a function of elapsed time after being first exposed to air, τ (s):
┛┬ACq exp (1)
where, A (kW/kg) is heat generating constant, C is molar fraction of oxygen, and ┛ (s-1) is the decay power constant. The initial order of heat generating rate of coal for exposing air is q(0) ≈ 0.01 to 0.001 kW/kg.
10-5
10-4
10-3
10-2
0 5000 10000 15000 20000 25000
Exposure time, ┬(s)
Hea
t g
ener
atin
g r
ate
, q(
kW
/k
g·c
oal
)
60 °C
40 °C
20 °C
Kaji et al. (1987)
Australian bituminous coal
Measurements; 23.8 to 53.3 °C
Models for Japanese bituminous coals by Miyakoshi et al. (1984) (cf. Tables 1 and 2)
C = 0.21
Fig. 3. Models of heat generating rate of coal vs. exposure time for constant temperatures
3.2 Arrhenius equation for coal oxidation Kaji et al. (1987) measured rates of oxygen consumption due to coal oxidation in the temperature range 20 to 170 °C using coals ranging from sub-bituminous to anthracite coal. They reported that heat generated per unit mole of oxygen at steady state is h = 314 to 377 (kJ/mole), and their results of the Arrhenius plots, the oxygen consumption rate versus inverse of absolute temperature T-1 (K-1), shows the Arrhenius equation. Thus, the higher the coal temperature; the faster the oxidation or adsorption rate is given. When the heat generation rate is proportional to oxygen consumption rate, the heat generated, A, can be estimated using the following equation,
RT
EAA exp0 (2)
www.intechopen.com

Equivalent Oxidation Exposure-Time for Low Temperature Spontaneous Combustion of Coal
239
where, A0 (kW/kg) is pre-exponential factor for A, E (J/mole) is the activation energy, R is
gas constant (J/mol/K), and T (=273+θ) (K) is absolute temperature. Kaji et al.(1987) has
reported that the coals have almost the same activation energy of around E=50 kJ/mole for
temperature range of 20 to 170 °C. On the other hand, Miyakoshi et al. (1984) reported as E ≈
20 kJ/mole for Japanese coals in temperature range lower than 50 °C based on
measurements of oxygen adsorption heat using with a micro-calorimeter.
The activation energy of fresh coal is expected as much lower than that of exposed coal in
the air, because fresh coal adsorbs oxygen physically at an initial stage of self-heating.
Average activation energy and decay power constant, presented by Miyakoshi et al. for
Japanese bituminous coals (see Tables 1 and 2), were used for present numerical
simulations.
3.3 Equivalent oxidation exposure time The heat generating rate, q, is expressed as a function of θ, C, and ┬. Equations (1) and (2) can
be used to calculate q for a constant temperature. However, they are not applicable for the
calculation of the normal coal temperature change versus elapsed time. Its concept is partly
similar to Elovich equation, but it provide a scheme to estimate q follows change of
temperature of coal and EOE time.
For an example, assume a coal lump is placed in an environment in which C = 0.1 and
θ=45°C, for elapsed time; ┬=1 h, and then is stored in other one of C =0.2 and θ= 70°C for
another 1 h period. It is not possible to reconstruct this situation by adding the former and
later times with different oxidation rates. A new model of the elapsed time that considers
the aging degree of the coal is required to overcome this difficulty. The cumulative
generated heat of the coal, Qm' (J/g) from elapsed time 0 to t, is defined as,
t
m dttCθqQ0
')',','('' (3)
where, the actual heat generation rate, q'(θ',C', t'), θ’ and C' are changing with the elapsed
time, t'. However, the cumulative heat, Qm, for constant θ and C, can be derived using
Equations (1) and (2) from time 0 to ┬*:
m
┬m Q┛┬
┛CA
dttCθqQ )exp(1')',,(' **
0 (4)
If the amounts of accumulated heat, Q'm and Qm, defined in Equations (3) and (4), are equal,
┬* in Eq. (4) expresses the aging time of the coal for constant temperature; θ = θ'(t) and
constant concentration; C=C'(t), for the actual elapsed time (t'=t). In this paper, τ* is defined
as the EOE time (see Fig. 4). It is calculated based on a summation of generated heat q'(θ',C',
t')·Δt' over a numerical calculation interval time, Δt'. It is expressed by the following single-
calculation equation:
i
ii tqCA
┛┛
┬ 'Δ'1ln1*
(5)
www.intechopen.com
Heat Analysis and Thermodynamic Effects
240
t
m dttCθqQ0
')',','(''
t 0 ┬*
Hea
t G
ener
atin
g R
ate,
q’(
W/
g)
Elapsed time/ EOE time
t’
q’(θ’, C’,t’) (actual)
q(θ’, C’, t’) θ, C
*
0')',,(
┬m dttCθqQ
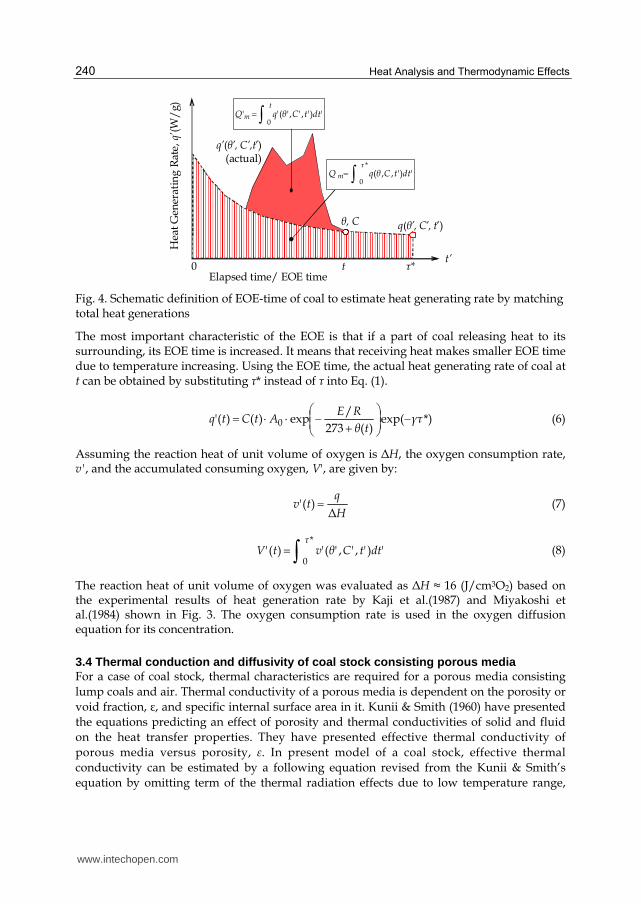
Fig. 4. Schematic definition of EOE-time of coal to estimate heat generating rate by matching total heat generations
The most important characteristic of the EOE is that if a part of coal releasing heat to its surrounding, its EOE time is increased. It means that receiving heat makes smaller EOE time due to temperature increasing. Using the EOE time, the actual heat generating rate of coal at t can be obtained by substituting ┬* instead of ┬ into Eq. (1).
*)exp()(273
/exp)()(' 0 ┛┬
tθRE
AtCtq
(6)
Assuming the reaction heat of unit volume of oxygen is ΔH, the oxygen consumption rate, v', and the accumulated consuming oxygen, V', are given by:
H
qtv
Δ)(' (7)
*
0')',','(')('
┬dttCθvtV (8)
The reaction heat of unit volume of oxygen was evaluated as ΔH ≈ 16 (J/cm3O2) based on the experimental results of heat generation rate by Kaji et al.(1987) and Miyakoshi et al.(1984) shown in Fig. 3. The oxygen consumption rate is used in the oxygen diffusion equation for its concentration.
3.4 Thermal conduction and diffusivity of coal stock consisting porous media For a case of coal stock, thermal characteristics are required for a porous media consisting
lump coals and air. Thermal conductivity of a porous media is dependent on the porosity or
void fraction, ε, and specific internal surface area in it. Kunii & Smith (1960) have presented
the equations predicting an effect of porosity and thermal conductivities of solid and fluid
on the heat transfer properties. They have presented effective thermal conductivity of
porous media versus porosity, ┝. In present model of a coal stock, effective thermal
conductivity can be estimated by a following equation revised from the Kunii & Smith’s
equation by omitting term of the thermal radiation effects due to low temperature range,
www.intechopen.com

Equivalent Oxidation Exposure-Time for Low Temperature Spontaneous Combustion of Coal
241
0.
0.2
0.4
0.6
0.8
1.0
0. 0.2 0.4 0.6 0.8 1.0
┝
┣/┣c
oal
Unconsolidate
Loose Packing Close Packing
Fluid: Air ┣coal/┣air = 13.3
Kunii & Smith (1960)
Linear parallel Model ┣ = ┣coal(1- ┝)+ ┝┣air
Consolidated
Fig. 5. Effective thermal conductivity vs. porosity of coal stock in the air evaluated by Kunii & Smith’s equation(1960) (a case for ┣coal/┣air = 13.3)
3
2Φ
1
air
coalcoal
air
coal
┣┣
┝┣┣┝
┣┣
(9)
where ┣ is effective thermal conductivity of coal stock, ┣coal is thermal conductivity of lump
coal, ┣air is thermal conductivity of air, and Φ is a ratio of effective thickness of air film over
coal lump diameter given against ┝ that is classified into three regime of ┝≥0.476 (loose
packing/unconsolidated), 0.476>┝≥0.260 and ┝<0.260 (close packing/consolidated) adapted
by Kunii & Smith (1960). Volumetric heat capacity, ρCp (J/kg), and thermal diffusivity of the
coal stock, α (m2/s) are derived from following equations,
coalPcoalairPairP Cρ┝C┝ρCρ )1( (10)
pC
(11)
Suppose ┣coal/┣air = 13.3 or , ┣coal = 0.36 W/m/°C for a typical thermal conductivity of coal, the
effective thermal conductivity, ┣, calculated by Eq. (9) is shown in Fig. 5 with thermal
conductivity of linear parallel model; ┣ = ┣coal(1- ┝)+ ┝┣air. The effective thermal conductivity
is lower than that of the linear parallel model, because air in coal stock gives a thermal
resistance around coal lumps because of low thermal conductivity of air.
Coal Density Specific Heat of
Coal Thermal
diffusivity of Coal Diffusion
Coefficient
ρcoal Cp ┙ D
1291 kg/m3 1210 J/kg/°C 6.8×10⁻⁸ m2/s 7.1×10⁻⁶ m2/s
Table 1. Thermal properties of coal for present numerical simulations
www.intechopen.com
Heat Analysis and Thermodynamic Effects
242
Decay power constant Pre-exponential factor Activation energy
┛ A0 E
3.0×10⁻⁴ s-1 2.9×10⁴ W/kg/kg 2.0×10⁴ J/mol
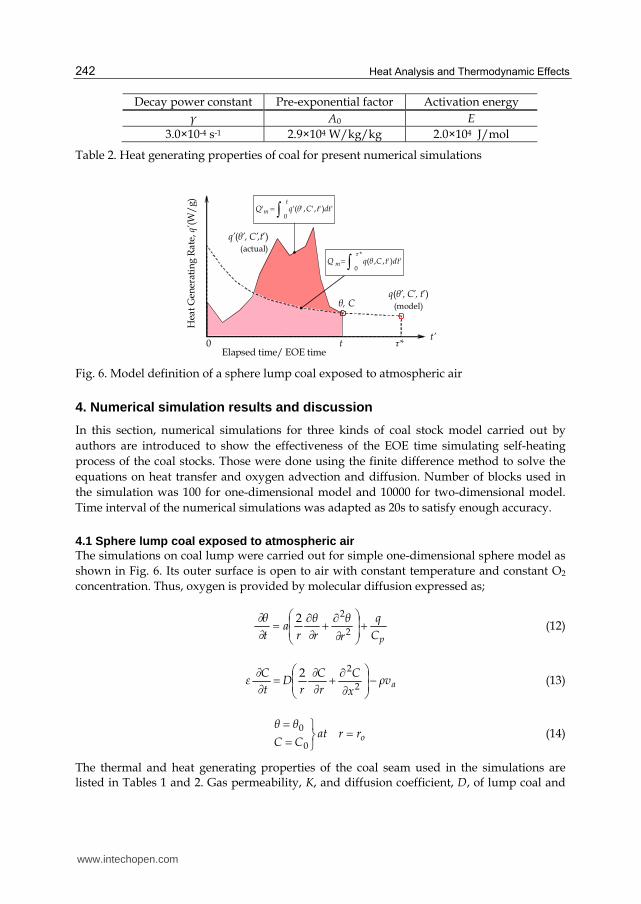
Table 2. Heat generating properties of coal for present numerical simulations
t
m dttCθqQ0
')',','(''
t 0 ┬*
Hea
t G
ener
atin
g R
ate
, q’(
W/
g)
Elapsed time/ EOE time
t’
q’(θ’, C’,t’) (actual)
q(θ’, C’, t’) (model) θ, C
*
0')',,(
┬m dttCθqQ
Fig. 6. Model definition of a sphere lump coal exposed to atmospheric air
4. Numerical simulation results and discussion
In this section, numerical simulations for three kinds of coal stock model carried out by
authors are introduced to show the effectiveness of the EOE time simulating self-heating
process of the coal stocks. Those were done using the finite difference method to solve the
equations on heat transfer and oxygen advection and diffusion. Number of blocks used in
the simulation was 100 for one-dimensional model and 10000 for two-dimensional model.
Time interval of the numerical simulations was adapted as 20s to satisfy enough accuracy.
4.1 Sphere lump coal exposed to atmospheric air The simulations on coal lump were carried out for simple one-dimensional sphere model as
shown in Fig. 6. Its outer surface is open to air with constant temperature and constant O2
concentration. Thus, oxygen is provided by molecular diffusion expressed as;
pC
q
r
θr
θr
at
θ
2
22
∂∂∂
∂
(12)
avρx
C
r
C
rD
t
C┝
2
22
∂ ∂
∂
∂
∂ (13)
orratCC
θθ
0
0 (14)
The thermal and heat generating properties of the coal seam used in the simulations are listed in Tables 1 and 2. Gas permeability, K, and diffusion coefficient, D, of lump coal and
www.intechopen.com

Equivalent Oxidation Exposure-Time for Low Temperature Spontaneous Combustion of Coal
243
close packing of crushed coal were measured, and the correlated equations have been presented by Sasaki et al.(1987). The boundary conditions of temperature and oxygen concentration at the outer surface were fixed with constants expressed by Eq.(14).
Coal Lump Sphere Model
20
30
40
50
60
70
80
90
100
0.001 0.01 0.1 1 10 100 1000
Elapsed Time, t (day)
Tem
per
atu
re a
t C
ente
r, θ
(°C
)
Initial
do=4m do=10m
do=2m
do=1m
do=0.3m do=0.5m
do
Fig. 7. Temperature at sphere center vs. elapsed time for different diameter
Coal Lump Sphere Model
0
4
8
12
16
20
0.001 0.01 0.1 1 10 100 1000
Elapsed Time, t (day)
O2
Con
cen
trat
ion
at
Cen
ter,
C(0
), %
do=4m
do=10m
do=2m
do=1m
do=0.5m
do=0.3m
do
Fig. 8. Oxygen concentration at sphere center vs. elapsed time for different diameter
www.intechopen.com

Heat Analysis and Thermodynamic Effects
244
Coal Lump Sphere Model
0.0
0.2
0.4
0.6
0.8
1.0
1.2
1.4
1.6
1.8
2.0
0.001 0.01 0.1 1 10 100 1000Elapsed Time, t (day)
EO
E-T
ime
/ E
lap
sed
Tim
e, τ* /
t
1
do=10m
do=4m do=2m
do=1m
do=0.5m
do=0.3m
do
Fig. 9. Ratio of EOE time over elapsed time at sphere center of coal lump vs. elapsed time for different diameter
Figures 7 to 9 show the numerical simulation results on temperature, oxygen concentration
and ratio of EOE time over elapsed time at the sphere center versus elapsed time for
different diameter d0= 0.3 to 10m . The temperature at center of the stock is increased with
elapsed time, but the cases of d0 ≤ 2 m show the temperature return to atmospheric and
initial temperature 0 =25 ºC. This is because that the EOE time increased by heat transfer to
surrounding air makes reducing heat generation rate of coal lump even if its location is at
the center. However, the case of d0 ≥ 4 m, coal at the sphere center receiving enough heat in
low oxygen concentration before oxygen diffuses into the center, and lower EOE time
induces higher heat generation than that of d0 ≤ 2m before ignition and combustion of coal.
The critical diameter is evaluated roughly as d0= 3m for present model, it depends on the
activation energy, E and the decay power constant, ┛, of the coal.
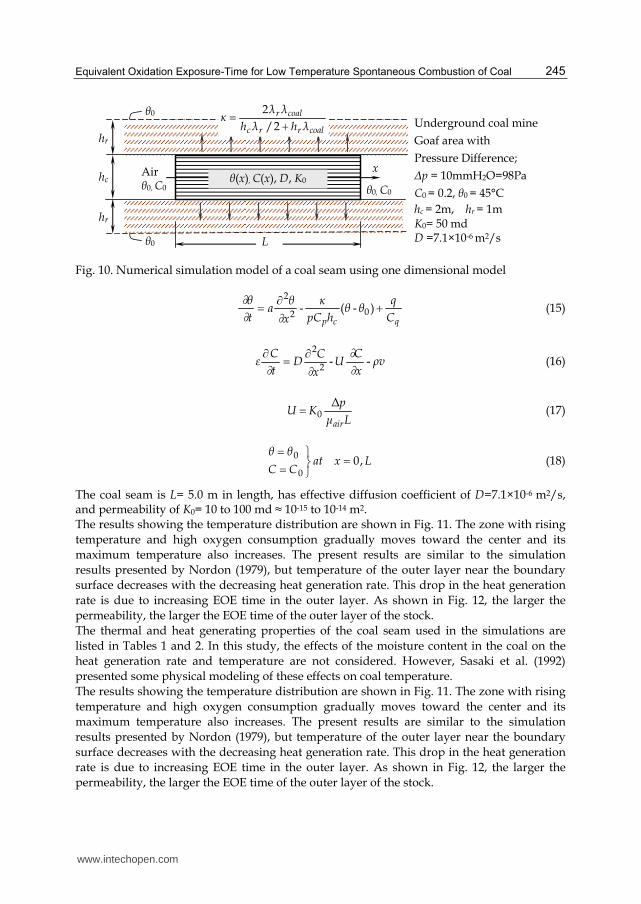
4.2 A model of coal seam remained at goaf area in underground mines In Fig. 10, a simple one-dimensional numerical model for a coal seam remained at goaf area
that is cavity area behind a longwall working in underground coal mines. It is expected to
expose to relatively high temperature air of 45 °C. Its faces are open to air with ventilation
pressure difference in the goaf area, Δp = 10 mmH2O= 98Pa. Thus, oxygen is provided by
not only molecular diffusion, but also permeable airflow between two faces. Therefore,
oxygen in the air diffuses from both ends and adsorbs in micro pores of the coal seam as it
diffuses toward the center of the seam.
The thermal and heat generating properties of the coal seam used in the simulations are listed in Tables 1 and 2. In this study, the effects of the moisture content in the coal on the heat generation rate and temperature are not considered. However, Sasaki et al. (1992) presented some physical modeling of these effects on coal temperature.
www.intechopen.com
Equivalent Oxidation Exposure-Time for Low Temperature Spontaneous Combustion of Coal
245
x Air θ0, C0 θ0, C0
θ(x), C(x), D, K0
L
Underground coal mine
Goaf area with
Pressure Difference;
Δp = 10mmH2O=98Pa
C0 = 0.2, θ0 = 45°C
hc = 2m, hr = 1m K0= 50 md D =7.1×10⁻⁶ m2/s
coalrrc
coalr
┣h┣h
┣┣┢ 2/
2
hr
hc
hr
θ0
θ0
Fig. 10. Numerical simulation model of a coal seam using one dimensional model
qcp C
qθθhpC
┢x
θa
t
θ )( 02
2
--∂∂
∂
(15)
vρx
CU
x
CD
t
C┝ -∂
∂
-∂∂
2
2 (16)
L┤
pKU
air
Δ0 (17)
LxatCC
θθ,0
0
0
(18)
The coal seam is L= 5.0 m in length, has effective diffusion coefficient of D=7.1×10⁻⁶ m2/s, and permeability of K0= 10 to 100 md ≈ 10-15 to 10-14 m2. The results showing the temperature distribution are shown in Fig. 11. The zone with rising
temperature and high oxygen consumption gradually moves toward the center and its
maximum temperature also increases. The present results are similar to the simulation
results presented by Nordon (1979), but temperature of the outer layer near the boundary
surface decreases with the decreasing heat generation rate. This drop in the heat generation
rate is due to increasing EOE time in the outer layer. As shown in Fig. 12, the larger the
permeability, the larger the EOE time of the outer layer of the stock.
The thermal and heat generating properties of the coal seam used in the simulations are
listed in Tables 1 and 2. In this study, the effects of the moisture content in the coal on the
heat generation rate and temperature are not considered. However, Sasaki et al. (1992)
presented some physical modeling of these effects on coal temperature.
The results showing the temperature distribution are shown in Fig. 11. The zone with rising
temperature and high oxygen consumption gradually moves toward the center and its
maximum temperature also increases. The present results are similar to the simulation
results presented by Nordon (1979), but temperature of the outer layer near the boundary
surface decreases with the decreasing heat generation rate. This drop in the heat generation
rate is due to increasing EOE time in the outer layer. As shown in Fig. 12, the larger the
permeability, the larger the EOE time of the outer layer of the stock.
www.intechopen.com
Heat Analysis and Thermodynamic Effects
246
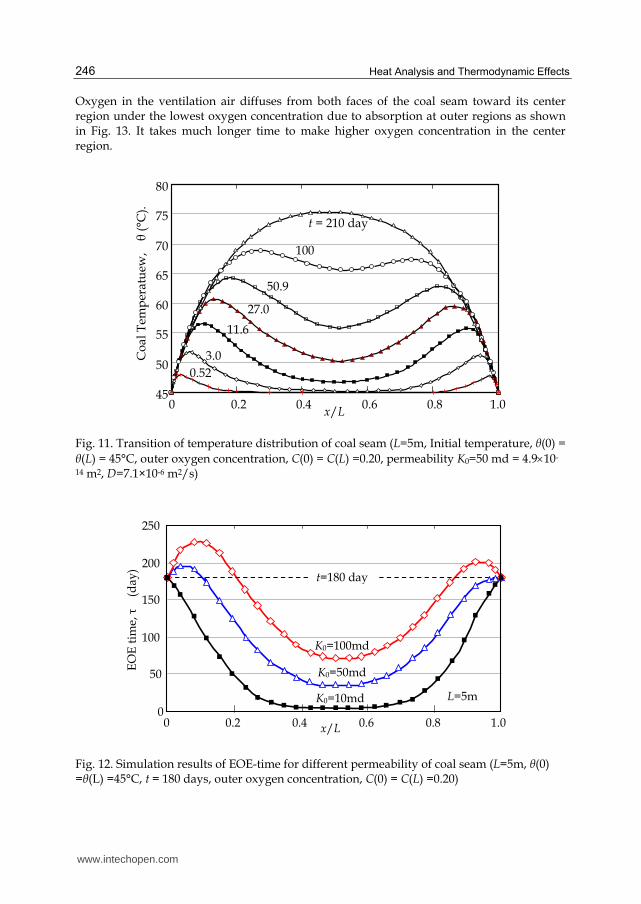
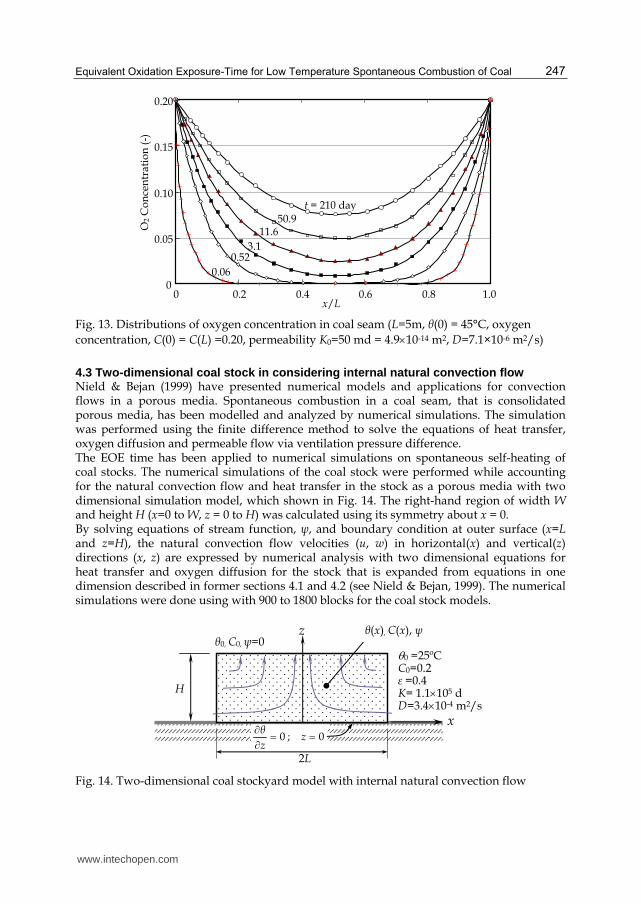
Oxygen in the ventilation air diffuses from both faces of the coal seam toward its center region under the lowest oxygen concentration due to absorption at outer regions as shown in Fig. 13. It takes much longer time to make higher oxygen concentration in the center region.
45
50
55
60
65
70
75
80
0 0.2 0.4 0.6 0.8 1.0 x/L
Co
al
Tem
per
atu
ew,
θ (
°C).
3.0
11.6
27.0
50.9
100
t = 210 day
0.52
Fig. 11. Transition of temperature distribution of coal seam (L=5m, Initial temperature, θ(0) =
θ(L) = 45°C, outer oxygen concentration, C(0) = C(L) =0.20, permeability K0=50 md = 4.910-
14 m2, D=7.1×10⁻⁶ m2/s)
0
50
100
150
200
250
0 0.2 0.4 0.6 0.8 1.0 x/L
K0=100md
K0=50md
K0=10md
t=180 day
L=5m
EO
E t
ime,
τ
(day
)
Fig. 12. Simulation results of EOE-time for different permeability of coal seam (L=5m, θ(0) =θ(L) =45°C, t = 180 days, outer oxygen concentration, C(0) = C(L) =0.20)
www.intechopen.com
Equivalent Oxidation Exposure-Time for Low Temperature Spontaneous Combustion of Coal
247
0
0.05
0.10
0.15
0.20
0 0.2 0.4 0.6 0.8 1.0 x/L
O2 C
on
cen
trat
ion
(-)
0.523.1
11.650.9
t = 210 day
0.06
Fig. 13. Distributions of oxygen concentration in coal seam (L=5m, θ(0) = 45°C, oxygen
concentration, C(0) = C(L) =0.20, permeability K0=50 md = 4.910-14 m2, D=7.1×10⁻⁶ m2/s)
4.3 Two-dimensional coal stock in considering internal natural convection flow Nield & Bejan (1999) have presented numerical models and applications for convection flows in a porous media. Spontaneous combustion in a coal seam, that is consolidated porous media, has been modelled and analyzed by numerical simulations. The simulation was performed using the finite difference method to solve the equations of heat transfer, oxygen diffusion and permeable flow via ventilation pressure difference. The EOE time has been applied to numerical simulations on spontaneous self-heating of coal stocks. The numerical simulations of the coal stock were performed while accounting for the natural convection flow and heat transfer in the stock as a porous media with two dimensional simulation model, which shown in Fig. 14. The right-hand region of width W and height H (x=0 to W, z = 0 to H) was calculated using its symmetry about x = 0. By solving equations of stream function, ψ, and boundary condition at outer surface (x=L and z=H), the natural convection flow velocities (u, w) in horizontal(x) and vertical(z) directions (x, z) are expressed by numerical analysis with two dimensional equations for heat transfer and oxygen diffusion for the stock that is expanded from equations in one dimension described in former sections 4.1 and 4.2 (see Nield & Bejan, 1999). The numerical simulations were done using with 900 to 1800 blocks for the coal stock models.
0;0
zz
θx
θ0, C0, ψ=0 θ(x), C(x), ψ z
H
2L
0 =25ºC C0=0.2 ┝ =0.4 K= 1.1105 d D=3.410-4 m2/s
Fig. 14. Two-dimensional coal stockyard model with internal natural convection flow
www.intechopen.com

Heat Analysis and Thermodynamic Effects
248
0.1
1
10
100
1 10 102 103 104 Re
Nu=
a├/┣
Kunii & Smith(1960)
Nu=1.6Re 1/2Wakao & Kaguei (1984)
Kunii & Suzuki(1967))├
┣air,┤air,┭air v
θ
Δq
q
θair
Fig. 15. Nusselt number, Nu vs. Reynolds number, Re=v├/┭air, in porous media consisting lump coals and air
x
θ┚g
┤ρK
zx air
air
∂
∂
∂
∂
∂
∂
=Ψ
+Ψ
2
2
2
2
(19)
z
wx
u∂
∂
∂
∂ Ψ;
Ψ (20)
where K is permeability of coal stock, ┚ is thermal expansion coefficient of air, ┤air is air
viscosity and g is acceleration of gravity. The boundary conditions at x=0, W and z=0, H are,
Hzz
z
Wzx
x
= at 0=Ψ
;0= at 0=Ψ
= at 0=Ψ
;0= at 0=Ψ
∂
∂
∂
∂
(21)
A model on heat transfer rate between lump coals or coal matrix and airflow is needed to
simulate internal temperature distribution in the stock. Wakao & Kaguei(1982) reviewed the
effective heat transfer coefficient, a, for unconsolidated porous media. Expressions of
Nusselt number, Nu(=a├/λ), have been presented by for the interstitial heat transfer
coefficients in porous media as shown in Fig. 15. From the figure, Nu is roughly proportional
to square root of the Reynolds number, Re1/2, and it matches fairly well with equations
presented by Kunii & Smith(1960), Kunii & Suzuki and Wakao & Kaguei(1982). In present
numerical simulations, an approximated equation on heat transfer per unit volume, Δq ;
airair
eair ┣├
ξθθRξθθaq
)(6.1)(Δ 2/1 (22)
where θair is air flow temperature, θ is lump coal temperature and ξ is internal surface area in the unit volume of the coal stock. Δq is used to calculate natural convection air flow temperature θair and lump coal temperature θ with heat generation rate of coal lump as q+Δq.
www.intechopen.com

Equivalent Oxidation Exposure-Time for Low Temperature Spontaneous Combustion of Coal
249
The coal stock W in width and H in height was simulated with the stock conditions; C0=0.2,
θ0=30°C, K= 1.1105 d and D=3.410-4 m2/s. The stock bottom at z = 0 is set as adiabatic and impermeable boundary. Natural convection airflow in the stock is observed in Fig. 16 as that flow comes from side walls toward the center of the stock. It controls temperature rise, cooling, and oxygen supply. High temperature region that was generated at center and upper in the stock after t≈100 h. But the natural convection flow and distribution of oxygen concentration are complicated with rapid changing in early stage; t≈ 0 to 100 h of self-heating of coal stock (see Fig. 17). The region is also downstream of the convective airflow with low oxygen concentration but high temperature. The convection flow becomes faster with rising internal temperature. The mechanisms controlling the temperature rise are complex and affected by the EOE time. The temperature and convective flow velocity are affected each other, and coal temperature determines not only the heat generation rate by supplying oxygen, but also the cooling or heating rate proportional to temperature difference between air and coal lumps. A comparison of simulation results for different aspect ratios; W/H = 1 and 2 is shown in Fig. 18. It is interesting that center region of longer ratio W/H= 2 shows relatively lower temperature compared with outer region. The reason is the internal natural convection flow from side walls is coming up to upper surface before closing to center region. Thus, the temperature distribution of right region is similar even if the aspect ratio is different. Figure 19 shows the maximum temperature in the stock, θmax, versus the elapsed time, t, for different aspect ratios W/H = 1 and 2. It rises to a temperature between 47 and 52°C in less than t=100 h, then holds this temperature during t=30 to 300 hours. Finally, the temperature decreases with time, because of the increasing the EOE time by releasing heat to the atmosphere. The natural convection airflow provides oxygen, but suppresses the maximum temperature in the stock by cooling effect and makes heat transfer increasing with the temperature difference to air temperature in atmosphere.
W W 0 0
H H
z z
x x
Temp.
34
30
32
33
31
a) Flow stream line in right half b) Temperature distribution in right half,
Fig. 16. Streamlines of internal natural convection flow and temperature distribution at t =
500h in coal stock (2W=10m, H=5m, C0=0.2, θ0=30°C, K= 1.1105 d, D=3.410-4 m2/s)
Finally the simulation was done to get matching with a monitored temperature at a coal stockyard carried out by Coal Mining Research Center, Japan (CMRCJ, 1983). As shown in Fig. 20, a model of a coal stockyard is 30m in width and 5m in height with trapezoid shape. On the other hand, the simulation model is just rectangle shape consists same thermal and flow characteristics of the coal stock defined in Fig. 14. The temperature at the point in coal
www.intechopen.com

Heat Analysis and Thermodynamic Effects
250
stockyard was compared. It shows fairly well matching with the monitored temperature data to corresponding position.
z z z z
x x x x 1h 5h 15h 24h
0.20
0.19
0.18
0.17
0.16
0.15
O2
Fig. 17. Change of oxygen concentration distribution of two-dimensional coal stock (right
half, 2W=10m, H=5m, K= 1.1105 d, D=3.410-4 m2/s) with internal natural convection flow
x 75h x 120h
z z
H = 5m , W = 5m H = 5m , W = 10m
48
44
36
32
28
Temp.
Fig. 18. Effect of aspect ratio, H/W, on temperature distribution in two-dimensional coal
stock with internal natural convection flow (2W=10m, H=5m, K= 1.1105 d, D=3.410-4 m2/s)
An important result of the numerical simulations is that the oxidation of coal in the low temperature range reduces heat generating rate, because it provides cooling air accelerates increasing the EOE time. This could be used to ensure that coal stocks are kept within a safety level that prevents spontaneous combustion. Turnover of coal stocks at regular intervals works by increasing EOE time and releasing heat from center region of the stock.
0 100 200 300 400 500 600
35
40
45
50
55
θ max
(°C
)
Elapsed time, t (h)
W=15m H=5m
W=10m H=5m
W=5m H=5m
30
C0=0.2, θ0=30°C
Fig. 19. Numerical simulation results of the maximum temperature transition in coal stock with three different aspect ratios
www.intechopen.com

Equivalent Oxidation Exposure-Time for Low Temperature Spontaneous Combustion of Coal
251
6m
30 m
6m
30 m
by CMRCJ (1993)
Numerical Model
6m
Monitored Temperature
Target Temperature
5m
5m
12m
12m
20
30
40
50
60
70
80
0 20 40 60 80
Elapsed Time, t (day)
Co
al T
emp
erat
ure
, θ (
°C)
Numerical simulation results (EOE time)
Measured by CMRCJ (1993)
C0=0.2, θ0=20 °C
Fig. 20. Comparison of Numerical simulation results on coal temperature in a stockpile with monitored values by the Coal Mining Research Center, Japan (CMRCJ)
5. Summary
In this chapter, a thermal mechanism of spontaneous combustion of coal seams and stocks
in low temperature has been described. It has been discussed that the reason to enhance self-
heating of coal stocks is the time delay between preheating from thermal diffusion and
oxygen provided via diffusion. Especially, preheating without supplying oxygen makes a
situation with high risk of spontaneous combustion. Another important mechanism
discussed is the formation of a hot spot through the shrinking of the heated oxidation zone
from the outer layer toward into the center region of the coal stock.
Heat generating of coal via the oxidation at low temperature includes complex functions of
temperature and elapsed time. Thus, numerical models using only the Arrhenius equation
to express heat generating of coal bases on its temperature are not able to simulate actual
heat and mass transfer phenomena.
The concept of equivalent oxidation exposure time (EOE time) has been introduced to
express time decay of coal oxidation. We have used this concept to simulate the heat
generation while considering coal aging; that is, the ratio of the cumulative amount of
oxidation to its oxidation capacity. This concept allowed us to consider these factors using
simple calculation procedures following temperature changing of the coal. The physical
model agrees with some experimental measurements with decay rate of heat generating
from coal during exposure to oxygen. It has been successfully applied to simulate the
temperature of rump coal, coal seam and coal stock, which are exposed to ventilated or
atmospheric air. We used the finite difference method to solve the equations of thermal
diffusion, heat transfer, and oxygen diffusion in these models. For the case of the coal stock,
natural convection flow was also considered. The results showed that natural convection
flow provides oxygen, but suppresses the maximum temperature of the stock by convective
heat flow moving to the atmosphere.
Low temperature oxidation of coal with cooling accelerates the increase of the EOE time and
reduces heat generation rate to an inherently safe level. Turnovers of lump coals in the stock
at regular intervals are expected to prevent spontaneous combustion effectively by
increasing the EOE time; not only by releasing heat in the center of the stock.
www.intechopen.com

Heat Analysis and Thermodynamic Effects
252
6. Acknowledgment
The authors would like to thank Prof. Emeritus Dr. Miyakoshi and Mr. K. Sakamoto (Tone
Co., LTD.) for their efforts on present study. We are also grateful to Prof. Ivana Lorkovic for
encouraging me to write this chapter.
7. Nomenclature
a = effective heat transfer coefficient [W/m2/°C] A = heat generating constant [kW/kg] or [W/g] A0 = pre-exponential factor for A [kW/kg] or [W/g] C = oxygen concentration or molar fraction [-] C0 = oxygen concentration in atmosphere [-] Cp = average specific heat of coal stock [J/kg/°C] Cp air = specific heat of air [J/kg/°C] Cp coal = specific heat of lump coal/coal seam [J/kg/°C] do = outer diameter of coal lump/stock [m]
D = effective diffusion coefficient [m2/s] E = activation energy [J/mole]
g = acceleration of gravity [m/s2] H = height of two-dimensional coal stock [m]
hc = height of coal seam [m] hr = height of upper and lower rock sediment layers [m]
K = permeability of coal stock [d] or [m2] (1 d= 9.8-13m2/s)
K0 = permeability of coal seam [md] or [m2] (1md= 9.810-16m2/s) L = width of coal seam [m]
Nu = Nusselt number [-] q = heat generation rate of coal [W/g] or [kW/kg]
Qm = cumulative generated heat of coal [J/g] or [kJ/kg]
Qm' = cumulative generated heat of coal [J/g] or [kJ/kg] R = gas constant [J/K/mol]
Re = Reynolds number [-] r = radius from center in coal lump/stock [m]
ro = outer radius of coal lump/stock [m] t = elapsed time [s]
T = absolute temperature of coal [K] U = permeable flow velocity in a coal seam due to pressure difference [m/s]
u = natural convection flow velocity in x direction [m/s] V' = accumulated consuming volume of oxygen [cm3·O2/g] or [m3O2/s·kg] v' = oxygen volume consumption rate [cm3O2/s·g] or [m3O2/s·kg] W = half width of two-dimensional coal stock [m] w = natural convection flow velocity in z direction [m/s] x = horizontal axis [m] z = vertical axis [m] ┙ = effective thermal diffusivity of coal seam or coal stock [m2/s] ┚ = thermal expansion coefficient of air [-] ┛ = decay power constant [1/s]
www.intechopen.com
Equivalent Oxidation Exposure-Time for Low Temperature Spontaneous Combustion of Coal
253
ΔH = reaction heat of unit volume of oxygen [J/cm3O2] ∆q = heat transfer per unit volume of coal stock [kW/m3] or [W/cm3] ├ = average diameter of lump coals in coal stock [m] ε = porosity or void fraction [-] Φ = ratio of effective thickness over coal lump diameter [-] ┢ = coefficient of heat transmission from coal seam [m2/s] ┣ = effective thermal conductivity of porous media [W/(m°C)] ┣air = thermal conductivity of air [W/(m°C)] ┣coal = thermal conductivity of lump coal [W/(m°C)] ┣r = thermal conductivity of rock [W/(m°C)] ┤ = air viscosity [Pas] ξ = internal surface area in unit volume of coal stock [m3/m3] or [cm3/cm3] ┬ = exposure time [s] ┬* = equivalent oxidation exposure (EOE) time [s] ┭air = dynamic viscosity coefficient of air [m2/s] ρair = air density [kg/m3] ρcoal = density of lump coal or coal seam [kg/m3] θ = temperature of coal lump or coal stock [°C]
θ0 = air or atmospheric temperature and initial coal temperature [°C] θair = temperature of internal natural convection air flow in coal stock [°C]
ψ = stream function of two dimensional natural convection flow [m2/s]
8. References
Brooks, K. & Glasser, D. (1986). A Simplified Model of Spontaneous Combustion in Coal Stockpiles, Fuel, Vol. 65 Issue 8, pp. 1035-1041, August 1986, Pages 1035-1041, DOI 10.1016/0016-2361(86)90164-X
Carresl, J.N. & Saghafil, A. (1998). Predicting Spontaneous Combustion in Spoil Piles from Open Cut Coal Mines, Proceedings of Underground Coal Operators' Conference, Paper 234, February 18- 20 1998, WoUongong, http://ro.uow.edu.au/coal/234
Ho, Y. S. (2006). Review of Second-order Models for Adsorption Systems, Journal of Hazardous Materials, B136 (2006), pp. 681–689, ISSN 0304-3894
Koyata, K., Ono, T., Miyagawa, M., Orimoto, M., Koike, Y. & Ota, S. (1983). Development of the Coal Spontaneous Combustion Predicting System-Structure and Performance of Predicting System-, CRIEPI Report 283088, Central Research Institute of Electric Power Industry, Aug. 1983(in Japanese), ISSN 1340-6078
Kevin Brooks, Steven Bradshaw, David Glasser (1988) Experiment study of model compound oxidation on spontaneous combustion of coal, Chemical Engineering Science, Vol. 43, Issue 8, pp. 2139-2145, DOI 10.1016/0009-2509(88)87095-7
Kaji, R., Hishinuma, Y. & Nakamura, Y. (1987). Low Temperature Oxidation of Coals-A Calorimetric Study, Fuel, Vol. 66, Issue 2, February 1987, pp. 154-157, DOI 10.1016/0016-2361(87)90233-X
Kunii, D. & Smith, J.M. (1960). Heat Transfer Characteristics of Porous Rocks, A.1.Ch.E. Journal, Vol. 6-1 (March 1960), pp.71-78, DOI 10.1002/aic.690060115
Kunii, D. & Suzuki, M. (1967). Particle-to-Fluid Heat and Mass Transfer in Packed beds of Fine Particles, International Journal of Heat Mass Transfer, Vol. 10, pp.845-852, 1967, ISSN 0017-9310
www.intechopen.com

Heat Analysis and Thermodynamic Effects
254
Li Zeng-hua, Wang Ya-li, Song Na, Yang Yong-liang, Yang Yu-jing (2009). Experiment study of model compound oxidation on spontaneous combustion of coal, Procedia Earth and Planetary Science 1, pp.123–129, 2009, ISSN 1878-5220
Miyakoshi, H., Isobe, T. & Otsuka, K. (1984). Relationship between Oxygen Adsorption and Physico-chemical Properties of Coal, Journal of MMIJ, Vol. 100-1161, pp.1057-1062, 1984 (in Japanese), ISSN 0369−4194
Nield, D.A. & Bejan, A. (1999). Convection in Porous Media, Springer-Verlag, New, York, 1999. ISBN10 0-387-29096-6
Nordon, P. A. (1979). A Model for the Self-Heating Reaction of Coal and Char, Fuel, Vol. 58, pp.456-464, 1979, DOI 10.1016/0016-2361(79)90088-7
Sasaki, K., Miyakoshi, H. & Otsuka, K. (1987). Correlation between Gas Permeability and Macropore Structure of Coal, Journal of MMIJ, Vol.103-1198, pp.847-852, December 1987 (in Japanese), ISSN 03694194
Sasaki, K., Miyakoshi, H., Saitoh, A. & Chiba, T. (1992). Water Vapour Adsorption of Coal and Numerical Simulation Related Its Effects on Spontaneous Combustion in a Low Temperature Range, Journal of MMIJ, Vol.108-6, pp.479-486, June 1992 (in Japanese), ISSN 03694194
Wakao, N. and Kaguei, S. (1982). Heat and mass Transfer in Packed Beds, Gordon and Breach Science Publisher, New York and London, 1982. ISBN10 0677058608
Yuan, L. and Smith, A. (2007). Computational Fluid Dynamics Modeling of Spontaneous Heating in Longwall Gob Areas, Proceedings of 2007 SME Annual Meeting and Exhibit(Denver), SMM, pp.1-7(NIOSHTIC-2 No. 20031657), February 25-28, 2007, Salt Lake City, Utah
www.intechopen.com

Heat Analysis and Thermodynamic EffectsEdited by Dr. Amimul Ahsan
ISBN 978-953-307-585-3Hard cover, 394 pagesPublisher InTechPublished online 22, September, 2011Published in print edition September, 2011
InTech EuropeUniversity Campus STeP Ri Slavka Krautzeka 83/A 51000 Rijeka, Croatia Phone: +385 (51) 770 447 Fax: +385 (51) 686 166
InTech ChinaUnit 405, Office Block, Hotel Equatorial Shanghai No.65, Yan An Road (West), Shanghai, 200040, China
Phone: +86-21-62489820 Fax: +86-21-62489821
The heat transfer and analysis on heat pipe and exchanger, and thermal stress are significant issues in adesign of wide range of industrial processes and devices. This book includes 17 advanced and revisedcontributions, and it covers mainly (1) thermodynamic effects and thermal stress, (2) heat pipe and exchanger,(3) gas flow and oxidation, and (4) heat analysis. The first section introduces spontaneous heat flow,thermodynamic effect of groundwater, stress on vertical cylindrical vessel, transient temperature fields,principles of thermoelectric conversion, and transformer performances. The second section coversthermosyphon heat pipe, shell and tube heat exchangers, heat transfer in bundles of transversely-finnedtubes, fired heaters for petroleum refineries, and heat exchangers of irreversible power cycles. The thirdsection includes gas flow over a cylinder, gas-solid flow applications, oxidation exposure, effects of buoyancy,and application of energy and thermal performance index on energy efficiency. The forth section presentsintegral transform and green function methods, micro capillary pumped loop, influence of polyisobutyleneadditions, synthesis of novel materials, and materials for electromagnetic launchers. The advanced ideas andinformation described here will be fruitful for the readers to find a sustainable solution in an industrializedsociety.
How to referenceIn order to correctly reference this scholarly work, feel free to copy and paste the following:
Kyuro Sasaki and Yuichi Sugai (2011). Equivalent Oxidation Exposure - Time for Low TemperatureSpontaneous Combustion of Coal, Heat Analysis and Thermodynamic Effects, Dr. Amimul Ahsan (Ed.), ISBN:978-953-307-585-3, InTech, Available from: http://www.intechopen.com/books/heat-analysis-and-thermodynamic-effects/equivalent-oxidation-exposure-time-for-low-temperature-spontaneous-combustion-of-coal
www.intechopen.com

www.intechopen.com