equity story of fortum for a cleaner world · fortum in brief 4 –8 energy market transition 9...
TRANSCRIPT

FORTUM – For a cleaner worldEquity story of
Investor / Analyst material
April 2019

Disclaimer
2
This presentation does not constitute an invitation to underwrite,
subscribe for, or otherwise acquire or dispose of any Fortum shares.
Past performance is no guide to future performance,
and persons needing advice should consult an independent financial adviser.
Any references to the future represent the management’s current best understanding.
However the final outcome may differ from them.

Fortum in brief 4 – 8
Energy market transition 9 – 14
Fortum’s strategic route 15 – 21
First quarter 2019 22 – 36
Appendices
European and Nordic power markets 38 – 48
Fortum’s power generation 49 – 57
Thermal capacity in Russia 58
Historical achieved prices 59
IR contacts 60
3
Content

Fortum at a glance
• A leading clean-energy company across the Nordic region, the Baltic
countries, Poland, and Russia
• A circular economy champion, providing solutions for sustainable cities,
including waste, recycling, and biomass
• Rated BBB (negative outlook) and BBB (stable outlook) by S&P and
Fitch respectively
• In 2018, Fortum closed its tender offer to shareholders in Uniper
(holding of 49.99% of the outstanding shares and voting rights as of
31.12.2018)
Description of Fortum
Operations by business segment
Foreign
investors
29.5%
Finnish
State
50.8%
Other Finnish
investors
8.2%
Finnish households
9.7%Financial and
insurance institutions
1.9%
Key shareholders
Power
74.6 TWh
Nuclear
power
30%
Natural gas 38%
Coal 3%
Biomass 1%
Hydropower 26%
Wind 1%
Solar 0.5%
Waste 0.5%Heat
29.8 TWh Waste 7%
Heat pumps,
electricity 3%
Biomass 8%
Natural gas 64%Coal 16%
Peat 1%Others 1%
Production by source
• Listed on the Helsinki
Stock Exchange since
1998
• Market capitalisation
of ~EUR 16bn
• Finnish State is a
majority owner
Note: All data as of FYE 2018 unless otherwise stated
(1) Comparable EBITDA defined as operating profit plus depreciation and amortisation less items affecting comparability
Generation
48%
Russia 27%
City
Solutions
18%
Consumer Solutions 7%
EBITDA(1)
EUR 1.5 bn
4
31.3.2019

Fortum’s geographical footprint
Nordic countries
Power generation
43.5 TWh
Heat sales
5.9 TWh
Electricity customers
2.4 million
Russia
PAO Fortum
Power generation
29.5 TWh
Heat sales
20.7 TWh
Key figures 2018
Sales EUR 5.2 bn
Comparable
EBITDA EUR 1.5 bn
Total assets EUR 22 bn
Personnel 8,300
Poland
Power generation
0.6 TWh
Heat sales
3.5 TWh
Baltic countries
Power generation
0.7 TWh
Heat sales
1.4 TWh
#3
#1
#5 #10
#8
Nordics
69%
Sales by market area 2018
Russia
20%
Poland
6%
Other 4%
EUR
5.2 bn
Note: Ranking based on year 2017 pro forma figures
Source: Fortum, company data, shares of the largest actors5
x = Fortum market share ranking

Three main drivers are shaping the future electricity markets
9
Technology
Development
Politics and
Regulation
• Solar and wind
• Digitalisation and
artificial intelligence
• Short-term and seasonal
storage
• E-mobility ecosystem
• Demand response
• Decarbonisation to
reach Paris agreement
targets
• Electrification in
heating, transportation
and key industrial
processes
• Resource efficiency
• National and
international interests
• Market models
• Emission trading
• Geopolitical uncertainty
Climate and
Environment
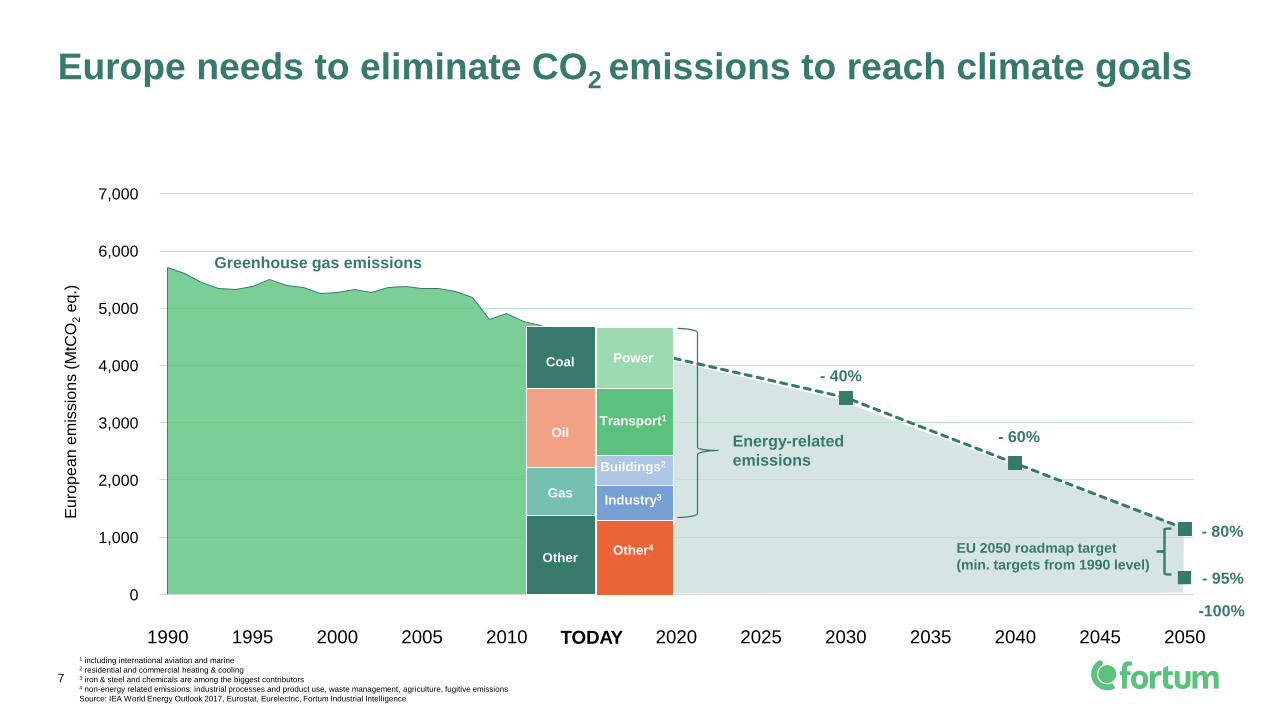
Europe needs to eliminate CO2 emissions to reach climate goals
7
1 including international aviation and marine2 residential and commercial heating & cooling3 iron & steel and chemicals are among the biggest contributors4 non-energy related emissions: industrial processes and product use, waste management, agriculture, fugitive emissions
Source: IEA World Energy Outlook 2017, Eurostat, Eurelectric, Fortum Industrial Intelligence
0
1 000
2 000
3 000
4 000
5 000
6 000
7 000
1990 1995 2000 2005 2010 2015 2020 2025 2030 2035 2040 2045 2050
Eu
rop
ea
n e
mis
sio
ns
(MtC
O2
eq.)
Greenhouse gas emissions
- 40%
- 60%
- 80%
Other
Gas
Oil
Coal
- 95%
TODAY
Power
Transport1
Buildings2
Other4
Industry3
Energy-related
emissions
EU 2050 roadmap target
(min. targets from 1990 level)
-100%
7,000
6,000
5,000
4,000
3,000
2,000
1,000
0

The decades of electricity will affect several sectors– and Fortum is well positioned for decarbonisation
8
4°C
1.5°C
Global climate
challenge (indicative)
Electricity demand (2018-2050)
+
+++
DH/CHP = District heating/combined heat and power
CCS = Carbon capture and storage
Sector
CO2-free generation, hydrogen,
batteries, demand response
Electric vehicles,
hydrogen/biofuels for heavy transport
Low-CO2 DH/CHP,
heat pumps, hydrogen
Recycling,
biomaterials (e.g. fractioning)
Electrified processes, hydrogen,
resource efficiency, CCS
Other
Industry
Heating & cooling
Transport
Power
Fortum’s current offering, examplesFuture solutions, examples
Nuclear, hydro, solar, wind
E-mobility,
pyrolysis
Biofuel,
waste-to-energy DH/CHP
B2B solutions
Plastic recycling

Volatility and uncertainty in the European power market increases the value of flexible assets
11
Increasing role of gas
Increased interconnection between
Nordics and Continent
Supply-demand balance
Commodity and CO2 prices
Intermittent renewables
Nuclear and coal closures
Weather conditions
Volatility and
uncertainty

The MSR introduces tightness to carbon market– in 2018 coal-to-gas switching was modest due to high gas price
10
• Linear reduction factor (LRF) is the percentage of
baseline supply1 by which the annual supply of
allowances (cap) is reduced every year. LRF is
set at
• 1.74% for 2013-2020 (equals to a
reduction of 38 MtCO2/year)
• 2.2% for 2021-2030 (equals to a
reduction of 48 MtCO2/year)
• In total, emissions are set to decrease by 43% by
2030 vs. 2005
• Next LRF review is scheduled for 2024
• 3.03% LRF from 2030 onwards would
deliver net zero emissions by 2050
Linear reduction factor (LRF) tightens the market Abatement from coal to gas switching
depends on coal and gas prices, together
represented by a switching range
Market stability reserve restores scarcity
by reducing future auction volumes
• CO2 price has more than tripled since November
2016, when the final decision was reached on the
future EU ETS rules, including the intake rate of
the Market Stability Reserve, which became
operational in January 2019
• The EUA market is in a process of finding the
appropriate price at which enough fuel-switching
occurs in order to balance supply and demand
• The gas/coal price relationship has become a
major price anchor for the EUA
• Political risks also continue to play a role in EUA
prices, with developments around Brexit in
particular being closely watched
• When TNAC2 > 833 Mt, MSR deducts 24% of the
TNAC from the auction volume each year placing
them into the reserve during 2019-2023
• MSR rate is 12% during 2024-2030
• When TNAC < 400 Mt, MSR releases 100 million
EUAs annually from the reserve adding them to
future auctions
• 900 million back loaded allowances from 2014-
2016 will be transferred into the MSR in 2019-2020
• As from 2023, allowances in MSR above the total
number of allowances auctioned during the
previous year will be cancelled
• Next MSR review is scheduled in 2021
1 Average annual total quantity of allowances released in 2008-2012.2 TNAC = total number of allowances in circulation =
supply – (demand + allowances in the MSR). According to the latest
publication May 15, 2018 the TNAC corresponds to 1655 million
allowances.
Free
allocation
Illu
str
ative
vo
lum
es (
Mto
no
f C
O2
eq
.)
Auction
pre-
MSR
57
% o
f ca
p
EmissionsAuction
post-
MSR
24% of cumulative surplus
MSR
effect
Need for abatement
or inventory reduction
Deficit
43
% o
f ca
p
Efficiency assumptions in switching range;
at low-end: gas 52% and coal 34%;
at high-end: gas 49% and coal 36%. O&M
cost assumptions apply.
0
5
10
15
20
25
30
35
40
2017 2018 2019
Eur/t
0
500
1000
1500
2000
2500
201
0
201
2
201
4
201
6
201
8
202
0
202
2
202
4
202
6
202
8
203
0
203
2
203
4
203
6
203
8
204
0
204
2
204
4
204
6
204
8
205
0
MtCO2
Cap (excl. aviation)
EU ETS emissions (incl call
on EUAs from aviation)
Switch range
CO2 price

• France to phase out coal from power sector at
latest in 2022
• United Kingdom to exclude coal condense from
capacity market by capping allowed emissions
from 2025
• Netherlands’ new government aims at exit by
2030, regulation not yet in place
• Germany to set a binding coal exit date by end of
2019
– Closure of 12.5 GW by 2022 (compared to 42.5 GW in 2017),
additional 13 GW by 2030, latest 2038 all remaining capacity
– Compensation to power plant operators remains open, coal
regions to receive EUR 40 billion over next 20 years
– EUR 2 billion annual compensation to customers in lower grid
fees and/or taxes proposed
– Respective amount of CO2 allowances to be cancelled in the
EU Emission Trading Scheme (ETS)
Several Western European countries exiting coal over the next decade
FR: Phase-out by
2022
IT: Phase-out by 2025
AT: Phase-out by 2025
FI: Phase-out
by 2029
UK: Phase-out by
2025
NL: Phase-out by
2030
PT: Phase-out by 2030
Phase-out from
power sector
latest by 2025
Phase-out from
power sector
latest by 2030
Phase-out commitment
mainly via “Powering
past coal Alliance”
SE: Last coal
plant to close
2022
Germany: Phase-
out by 2038
Phase-out from
power sector
latest by 2040
11

Positioning Fortum for the decade of electricity– For a cleaner world

Fortum’s strategic priorities in a changing energy market
3. Drive focused growth in the power
value chain
• Grow in CO2-free power generation
• Develop value-adding offerings and
solutions for customers
4. Build options for significant
new businesses
• Create new sizeable profit contributor
independent of power prices
• Build on industrial logic and synergies with
current businesses and competences
1. Pursue operational excellence and
increased flexibility
• Ensure benchmark performance
• Focus on cash flow and efficient use of
balance sheet
2. Ensure value creation from investments
and portfolio optimisation
• Increase shareholder value from Uniper
• Optimise portfolio to fit the changing business
environment
13

Strategic priorities…
Delivering on financial targets through operational excellence and portfolio optimisation in the short to mid term
28
Operational excellence• Continue productivity improvement
• Prioritise capital expenditure
Value creation and portfolio optimisation• Ensure competitive asset fit for changing business environment
• Focus on core businesses
• Selective investments
… creating value
• Benchmark performance
• Optimise cash flow
• Strengthen balance sheet
• Create financial flexibility
• Solid investment grade rating
Increased flexibility• Maximise flexibility in current businesses and assets
• Develop new sources of flexibility
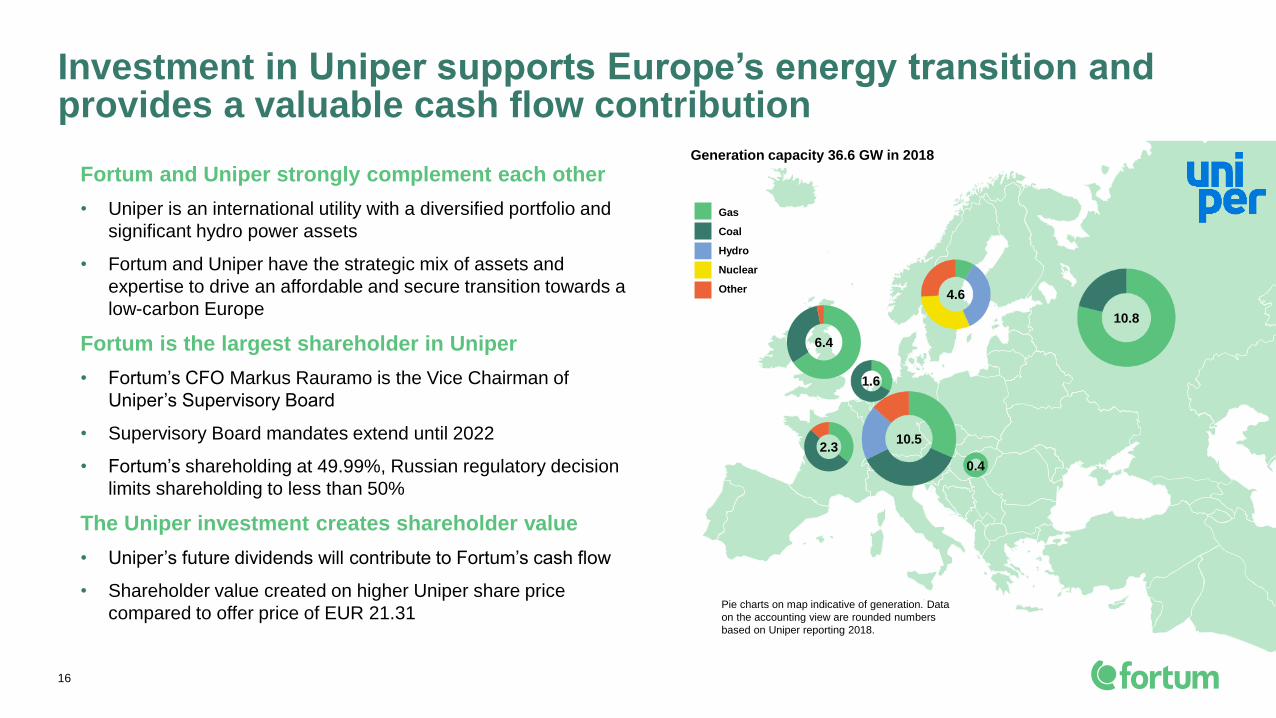
Investment in Uniper supports Europe’s energy transition and provides a valuable cash flow contribution
Fortum and Uniper strongly complement each other
• Uniper is an international utility with a diversified portfolio and
significant hydro power assets
• Fortum and Uniper have the strategic mix of assets and
expertise to drive an affordable and secure transition towards a
low-carbon Europe
Fortum is the largest shareholder in Uniper
• Fortum’s CFO Markus Rauramo is the Vice Chairman of
Uniper’s Supervisory Board
• Supervisory Board mandates extend until 2022
• Fortum’s shareholding at 49.99%, Russian regulatory decision
limits shareholding to less than 50%
The Uniper investment creates shareholder value
• Uniper’s future dividends will contribute to Fortum’s cash flow
• Shareholder value created on higher Uniper share price
compared to offer price of EUR 21.31
16
0.4
Pie charts on map indicative of generation. Data
on the accounting view are rounded numbers
based on Uniper reporting 2018.
Generation capacity 36.6 GW in 2018
Gas
Coal
Hydro
Nuclear
Other
6.4
10.8
10.5
4.6
2.3
1.6

We engage our customers and society to drive the change towards a cleaner
world. Our role is to accelerate this change by reshaping the energy system,
improving resource efficiency, and providing smart solutions. This way we
deliver excellent shareholder value
Fortum is a forerunner in sustainability
7
Fortum listed in several sustainability
indexes and ratings:
Among the lowest specific emissions96% of its power generation in the EU and 57% of its total power generation was
CO2-free in 2018. Fortum’s specific emissions from power generation in the EU
were 28 gCO2/kWh in 2018, total 174 gCO2/kWh.
Growing in solar and windTargeting a multi-gigawatt portfolio in solar and wind
Increasing CO2-free power generationAnnual CO2-free power generation has almost tripled from 15 TWh
in 1990 to 43 TWh in 2018
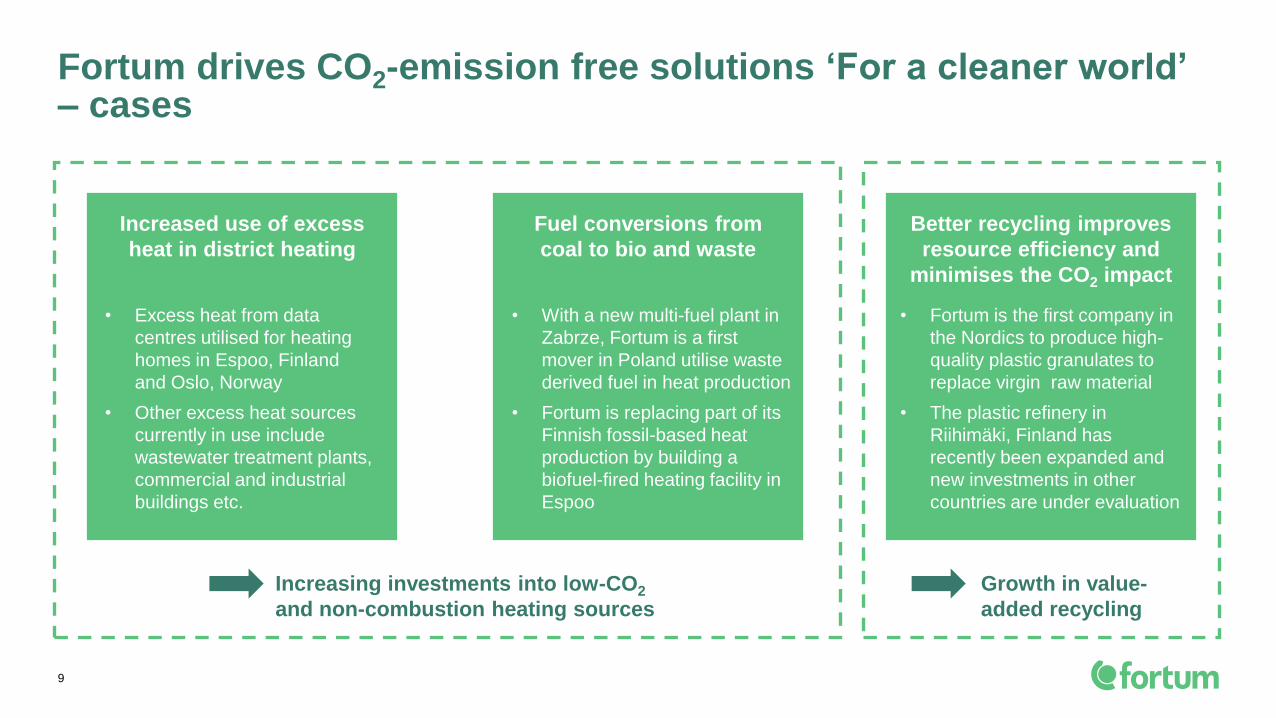
Fortum drives CO2-emission free solutions ‘For a cleaner world’– cases
9
Increased use of excess
heat in district heating
Fuel conversions from
coal to bio and waste
Better recycling improves
resource efficiency and
minimises the CO2 impact
• Excess heat from data
centres utilised for heating
homes in Espoo, Finland
and Oslo, Norway
• Other excess heat sources
currently in use include
wastewater treatment plants,
commercial and industrial
buildings etc.
• With a new multi-fuel plant in
Zabrze, Fortum is a first
mover in Poland utilise waste
derived fuel in heat production
• Fortum is replacing part of its
Finnish fossil-based heat
production by building a
biofuel-fired heating facility in
Espoo
Increasing investments into low-CO2
and non-combustion heating sources
• Fortum is the first company in
the Nordics to produce high-
quality plastic granulates to
replace virgin raw material
• The plastic refinery in
Riihimäki, Finland has
recently been expanded and
new investments in other
countries are under evaluation
Growth in value-
added recycling

Building the utility of the future
Decarbonising power and heat generation
UTILITY TODAY
Customer solutions
• Sustainable hydrogen
production
• Synthetic “clean” gas
production
Power-to-Gas
Electricity
• Carbon capture and
storage
• Carbon capture and
utilisation
CO2-sink
CO2
• Recycling
• Energy recovery
Sustainable materials
• Traffic fuels
• Bio-based material
production
Bio economy
Electricity
Heat
Electricity
Electricity
Hydrogen, methane
and excess heat
Heat
Raw
material
FUTURE UTILITY
Hydrogen and methane for
traffic and industrial use
15

Fortum’s long-term financial targets and dividend policy
18
Return on capital employed
(ROCE) of at least
10%
Comparable
Net debt/EBITDA ratio
at around
2.5x
Fortum’s dividend policy is
to pay a stable,
sustainable, and over
time increasing dividend
of 50-80% of earnings per share,
excluding one-time items
Having a solid investment
grade rating is a key
priority for Fortum

Key investment highlights
29
A forerunner in sustainability with growth ambitions in
solar and wind
#5 in Nordic heat, electricity sales and
#3 electricity generator in the Nordics(1)
Uniper investment supports energy transition and adds
to Fortum’s cash flow contribution
Optimised and flexible generation mix
96% CO2-free EU generation portfolio
Leverage towards 2.5x net debt/EBITDA target over 2-3
years
Robust liquidity position with diversified access across
markets
Solid investment grade rating is a key priority for Fortum
Finnish State is a majority owner
Commitment to financial discipline underpins balance
sheet strength
1) Market share ranking, based on year 2017 pro forma figures. Source: Company data, shares of the largest actors

Interim ReportJanuary-March 2019
Fortum Corporation
26 April 2019
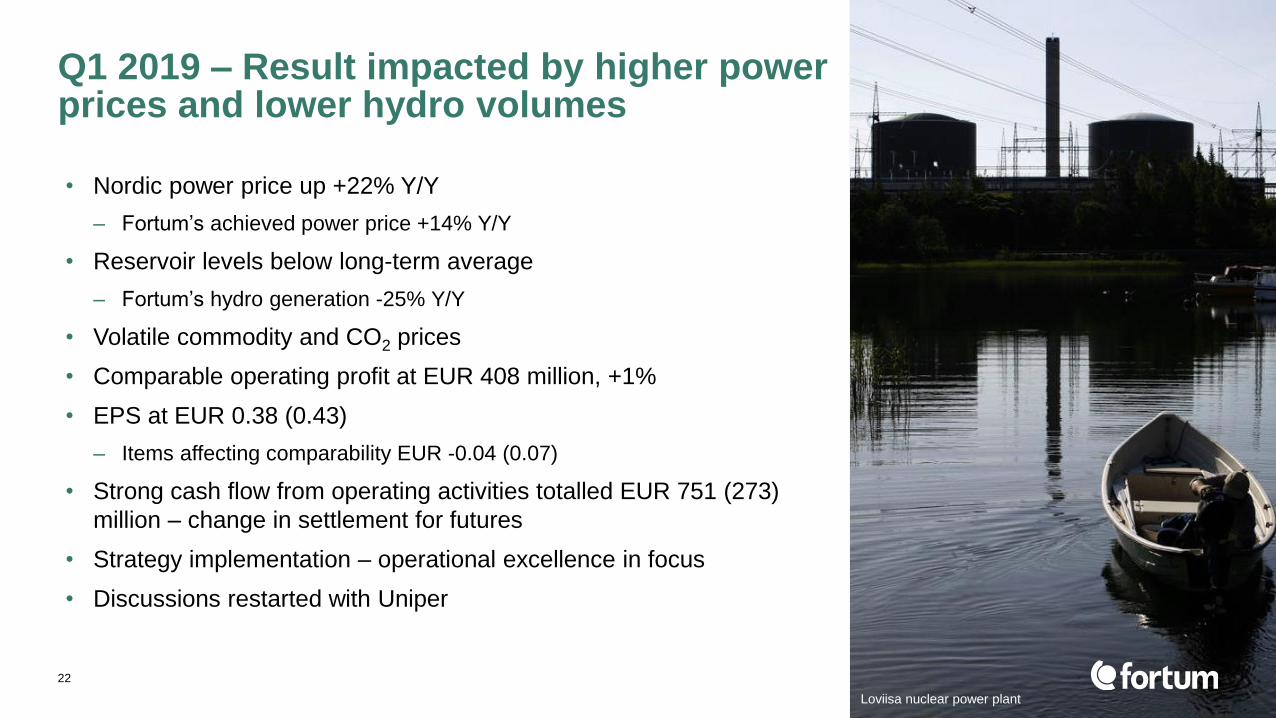
• Nordic power price up +22% Y/Y
– Fortum’s achieved power price +14% Y/Y
• Reservoir levels below long-term average
– Fortum’s hydro generation -25% Y/Y
• Volatile commodity and CO2 prices
• Comparable operating profit at EUR 408 million, +1%
• EPS at EUR 0.38 (0.43)
– Items affecting comparability EUR -0.04 (0.07)
• Strong cash flow from operating activities totalled EUR 751 (273)
million – change in settlement for futures
• Strategy implementation – operational excellence in focus
• Discussions restarted with Uniper
22
Q1 2019 – Result impacted by higher power prices and lower hydro volumes
Loviisa nuclear power plant

Commercial
operation of
50 MW wind at
Ulyanovsk in
Russia started
Bonds issued
EUR 2.5 billion
New technology
to boost EV
battery
recycling
Fortum wins
right to build
250 MW solar
power plant in
Rajasthan, India
Launch of
world’s first
market place
‘Puro’
for CO2
removals
OL3 received
its operating
license
Kalax wind
project
approved
within Finnish
national
scheme
Russian Fortum-
Vostok JV as
guaranteeing
electricity
supplier to 1.5m
retail customers
Q1 2019 highlights

Nordic hydro reservoir levels improved during Q1
Source: Nord Pool, 2019 by country
• Q1 started out cold and
dry but turned wetter and
mild from February
• Mild and windy weather
resulted in clearly lower
than normal hydropower
generation during Q1,
especially in Norway
• Hydro reservoirs moved
closer to normal during the
quarter
24
Nord Pool median 2000 2003 2017 2018 2019Q1 Q2 Q3 Q4
20
40
60
80
100
120
0
Reservoir content (TWh)
Finland
Sweden
Norway
2000 2003 20182017 Reference
level2019

Nordic Q1 2019 power price clearly higher compared to Q1 2018
25
• During Q1, the average Nord Pool system spot
price was 46.9 EUR/MWh (38.6)
• The average area price was:
– 47.5 EUR/MWh (42.0) in Finland
– 46.5 EUR/MWh (39.0) in Sweden (SE3, Stockholm)
• The higher spot market is clearly attributed to
the increased marginal cost for coal-fired
generation, mainly driven by clearly higher CO2
price compared to Q1 2018
• Mild, wet and windy weather in combination with
a decreasing trend for coal and gas prices
lowered the spot price towards the end of the
quarter
23 April 2019
Source: Nord Pool, Nasdaq Commodities
0
10
20
30
40
50
60
70
80
90
2010 2011 2012 2013 2014 2015 2016 2017 2018 2019 2020 2021 2022 2023 2024 2025
Nord Pool System Price
Futures
EUR/MWh Nordic spot and forward prices
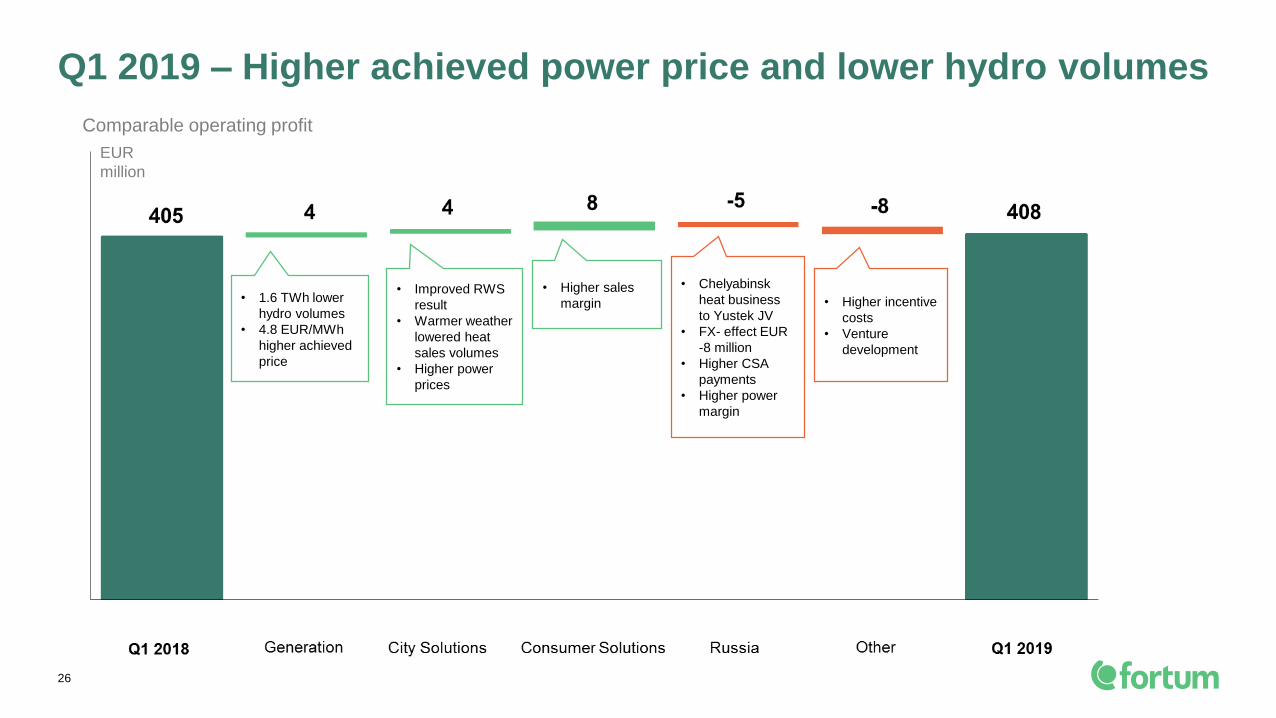
Q1 2019 – Higher achieved power price and lower hydro volumes
26
EUR
million
• 1.6 TWh lower
hydro volumes
• 4.8 EUR/MWh
higher achieved
price
• Improved RWS
result
• Warmer weather
lowered heat
sales volumes
• Higher power
prices
• Chelyabinsk
heat business
to Yustek JV
• FX- effect EUR
-8 million
• Higher CSA
payments
• Higher power
margin
Comparable operating profit
• Higher sales
margin • Higher incentive
costs
• Venture
development

27
Key financials
MEUR Q1 2019 Q1 2018 2018 LTM
Sales 1,690 1,585 5,242 5,347
Comparable EBITDA 545 538 1,523 1,530
Comparable operating profit 408 405 987 990
Operating profit 358 482 1,138 1,014
Share of profits of associates and joint ventures 111 47 38 102
Profit before income taxes 424 493 1,040 971
Earnings per share, EUR 0.38 0.43 0.95 0.90
Net cash from operating activities 751 273 804 1,282
• Sales and comparable operating
profit driven by higher power prices
• Share of profits from associates
increased mainly due to Uniper,
EUR 49 million
• EPS excluding items affecting
comparability of EUR 0.42 (0.36)
• Strong cash flow due to change in
settlements for futures and working
capital

Income statement
28
MEUR Q1 2019 Q1 2018 2018 LTM
Sales 1,690 1,585 5,242 5,347
Other income 21 24 130 127
Materials and services -917 -825 -2,795 -2,887
Employee benefits -122 -113 -459 -468
Depreciations and amortisation -137 -133 -536 -540
Other expenses -127 -133 -594 -588
Comparable operating profit 408 405 987 990
Items affecting comparability -50 77 151 24
Operating profit 358 482 1,138 1,014
Share of profits/loss of associates and
joint ventures111 47 38 102
Finance costs - net -46 -36 -136 -146
Profit before income tax 424 493 1,040 971
Income tax expense -65 -94 -181 -152
Profit for the period 359 400 858 817
• Sales and comparable operating profit
improved mainly due to higher power
prices
• Share of profits from associates
increased mainly due to share of profits
from Uniper, EUR 49 million
• Finance costs slightly higher due to
repayment of bridge loan of EUR 1.75
billion

Cash flow statement
29
MEUR Q1 2019 Q1 2018 2018 LTM
Comparable EBITDA 545 538 1,523 1,530
Realised FX gains/losses -5 42 231 184
Paid net financial costs, income taxes and
other-59 -107 -280 -232
Change settlements for futures 292 -91 -524 -141
Change in working capital -22 -109 -146 -59
Net cash from operating activities 751 273 804 1,282
Capital expenditures -150 -133 -579 -596
Acquisitions of shares -12 -18 -4,088 -4,082
Divestments of shares 8 0 259 267
Change in cash collaterals and restricted
cash310 -63 -36 337
Other investing activities 11 1 46 56
Cash flow from investing activities 167 -213 -4,398 -4,018
Cash flow before financing activities 918 60 -3,594 -2,736
Paid dividends -977 -977
• Strong net cash from operating
activities mainly due to EUR 292
million from change in settlement for
futures on Nasdaq Commodities
• Net cash from investing activities
positively impacted by EUR 310
million due to new non-cash collateral
agreement to release pledged cash
from the Nordic power exchange
• Dividend of EUR 977 million paid on
4 April, not impacting Q1 2019
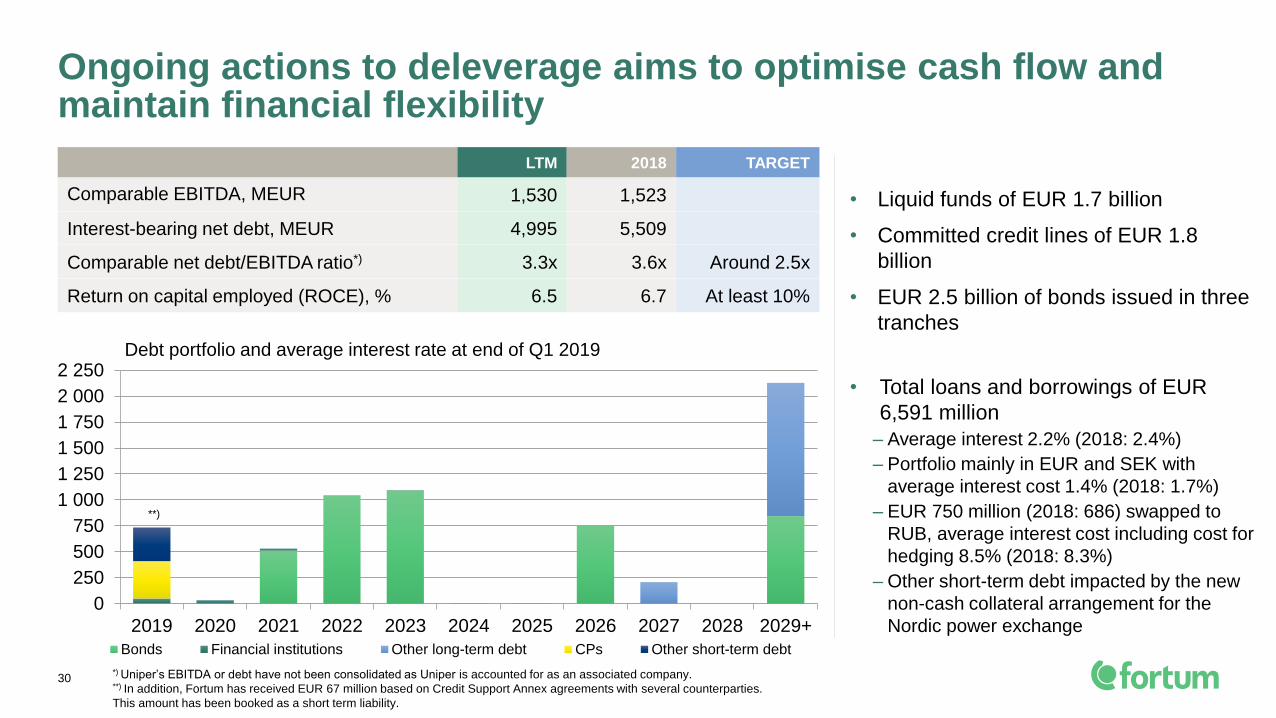
• Liquid funds of EUR 1.7 billion
• Committed credit lines of EUR 1.8
billion
• EUR 2.5 billion of bonds issued in three
tranches
• Total loans and borrowings of EUR
6,591 million
– Average interest 2.2% (2018: 2.4%)
– Portfolio mainly in EUR and SEK with
average interest cost 1.4% (2018: 1.7%)
– EUR 750 million (2018: 686) swapped to
RUB, average interest cost including cost for
hedging 8.5% (2018: 8.3%)
– Other short-term debt impacted by the new
non-cash collateral arrangement for the
Nordic power exchange
Ongoing actions to deleverage aims to optimise cash flow and maintain financial flexibility
30
LTM 2018 TARGET
Comparable EBITDA, MEUR 1,530 1,523
Interest-bearing net debt, MEUR 4,995 5,509
Comparable net debt/EBITDA ratio*) 3.3x 3.6x Around 2.5x
Return on capital employed (ROCE), % 6.5 6.7 At least 10%
0
250
500
750
1 000
1 250
1 500
1 750
2 000
2 250
2019 2020 2021 2022 2023 2024 2025 2026 2027 2028 2029+
Bonds Financial institutions Other long-term debt CPs Other short-term debt
*) Uniper’s EBITDA or debt have not been consolidated as Uniper is accounted for as an associated company.**) In addition, Fortum has received EUR 67 million based on Credit Support Annex agreements with several counterparties.
This amount has been booked as a short term liability.
**)
Debt portfolio and average interest rate at end of Q1 2019

Outlook
31
Hedging*)
For the remainder of
2019: ~75% hedged at
EUR 32 per MWh
For 2020: ~55% hedged
at EUR 31 per MWh
(Q4: 45% at EUR 29)
2019 Estimated
annual capital
expenditure, including maintenance
and excluding
acquisitions
EUR 600-650 million
Demand growth
Electricity demand in
the Nordics is
expected to grow by
~0.5% on average
Targeted cost
synergies of Hafslund
transaction
EUR 15-20 million gradually
materialising 2019-2020:
City Solutions:
EUR 5-10 million
Consumer Solutions:
~EUR 10 million
*) from the beginning of 2019 the reported hedge prices also include the effect of proxy hedging.
This change had a minor effect on the prices. There is no change to the calculation method of the hedge ratio.
Outlook
Hedging*)
For the remainder of
2019: ~75% hedged at
EUR 32 per MWh
For 2020: ~55% hedged
at EUR 31 per MWh
(Q4: 45% at EUR 29)
2019 Estimated
annual capital
expenditure, including
maintenance and
excluding acquisitions
EUR 600-650 million
Demand growth
Electricity demand in
the Nordics is
expected to grow by
~0.5% on average
Targeted cost
synergies of Hafslund
transaction
EUR 15-20 million
gradually materialising
2019-2020:
City Solutions:
EUR 5-10 million
Consumer Solutions:
~EUR 10 million
Taxation
Effective tax rate for
2019 for the Group
19-21%
In Sweden nuclear
capacity tax abolished
from 2018 and hydro
assets’ real estate tax
rate to decrease over
a four-year period
(2017-2020)
*) from the beginning of 2019 the reported hedge prices also include the effect of proxy hedging.
This change had a minor effect on the prices. There was no change to the calculation method of the hedge ratio.

Appendices

Others
Vattenfall
Fortum
Ørsted
Jämtkraft
E.ON
Din El, Göteborg
HelenSEAS-NVE
Fjordkraft
SE-Syd Energi
52%
Vattenfall
Statkraft
Norsk Hydro
Others
Fortum
Uniper
Ørsted
Agder Energi
BKK
PVO E-CO Energi
37%
Power generation in 2017402 TWh
>350 companies
Electricity retail15 million customers
~350 companies
33
Still a highly fragmented Nordic power marketFortum has the largest electricity customer base in the Nordics
Source: Fortum, company data, shares of the largest actors, pro forma 2017 figures

Power generationLargest producers in Europe and Russia, 2017
TWh
CustomersElectricity customers in Europe, 2017
Millions
Heat productionLargest global producers, 2017
TWh
Fortum mid-sized European power generation player– major producer in global heat
34
ENGIE
Naturgy
PGE
E.ON
DEI
CEZ
Enel
Centrica
EDP
Iberdrola
SSE
EnBW
Fortum
EDF
RWE
Tauron
Ørsted
0 20 4010 30
Vattenfall
EuroSibEnergo
RusHydro
Rosenergoatom
T Plus
Uniper
DEI
FortumEPH
Statkraft
Enel
CEZ
E.ON
EnBW
Gazprom
NNEGC Energoat.
RWE
EDF
0 100 200 300 400 500 600
Inter RAO UES
EDP
ENGIE
Vattenfall
SibgengoDTEK
EPS
PGE
Iberdrola
Verbund
SSE
EuroSibEnergo
TGC-2
Minskenergo
Quadra
Tatenergo
Lukoil
DTEK
SibgencoFortum
Ørsted
TGC-14
KDHC
0 20 40 60 80 100 120140
T Plus
Vattenfall
PGNiG
Inter RAO UES
EDFRusHydro
Veolia
Gazprom
Stockholm Exergi
Beijing DH
SIBECO
CEZ
PGE
Helen
E.ONEPH
Source: Company information, Fortum analyses, 2017 figures pro forma.
EPH incl. LEAG. Chinese data incomplete.

Biggest nuclear and hydro generators in Europe and Russia
35
1) Formerly Natural Gas Fenosa
Source: Company information, Fortum analyses, 2016 figures pro forma

Nordic year forwards
36 Source: Nasdaq Commodities, Bloomberg
Year 21 Year 20 Year 19 Year 10 Year 11 Year 12 Year 13 Year 14 Year 15 Year 16 Year 17 Year 18
0
10
20
30
40
50
60
70
€/MWh 23 April 2019
20142008 2009 2010 2011 2012 2013 2015 2016 2017 2018 2019
Year15 Year17 Year19Year10 Year11 Year12 Year13 Year14 Year16 Year18 Year20 Year21
Year21
Year20
Mar
2019
Apr
2019
Feb
2019
Jan
2019
30
32
34
36
38
40
42
1.1.2019 1.2.2019 1.3.2019 1.4.2019
Year 20 Year 21

0
10
20
30
40
50
60
70
80
90
100
* Including weighted average capacity price
German
Nordic
Russian*
Spot prices Forward pricesEUR/MWh
10
20
30
40
50
60
70
80
90
100
023 April 2019
2010 2011 2012 2013 2014 2015 2016 2017 2018 2019 2020
Wholesale power prices
37 Source: Nord Pool, Bloomberg Finance LP, ATS, NP “Market Council”, Fortum

38
Fuel prices in Q1 on a downward trend as LNG flows into Europe
The global coal market during Q1 turned bearish due to changed Chinese
import policy and international coal prices declined while China's domestic prices
remained buoyant
• The lack of support from China exposed European coal to rapidly weakening
European gas prices, with major European coal-for-power markets clearly
declining in Q1 Y/Y
• Further, higher coal taxes and nuclear power output in South Korea and
Japan also contributed to the negative development
• In April, coal prices In Europe bottomed out followed by a limited rebound as
coal flows begun diverting from Europe to other markets
In the European gas market LNG import volumes into Europe doubled resulting
in significant decline of gas prices in Q1
• The EU import surge resulted from stalled demand growth in the East Asian
LNG markets
• As a result of strong LNG inflows, European gas storages ended Q1 with high
stocks and European gas became very competitive against coal in power
generation, a situation further supported by the resilient CO2 price
• In April, the gas market has seen a limited rebound, but fundamentals
continue to be weak
Source: ICE, Thomson Reuters
Market prices 23 April 2019; 2019-2020 future quotations
0
20
40
60
80
100GBp / therm Gas price (ICE NBP)
2008 20122010 2014 2016 2018 2020
0
50
100
150
200
250USD / t Coal price (ICE Rotterdam)
2008 20122010 2014 2016 2018 2020

39
Volatile CO2 prices in Q1 mainly due to Brexit uncertainty – rebound in April
Crude oil markets saw a strong recovery in Q1 compared to the rest of the
generally weak fuel prices
• Oil prices strengthened in Q1 as OPEC (mainly Saudi Arabia) over-delivered
on the 2018 supply cut agreement
• The US imposed sanctions on Iran during 2018, and more recently on
Venezuela in Q1, led to a big involuntary drop of crude output, tightening the
global oil market
• In April, oil continued to increase supported by Chinese macroeconomic data
indicating continued demand strength
The carbon market traded lower during Q1 on modest EUA demand and falling
gas prices
• The EUA market was impacted by policy uncertainties in Q1, mainly the threat
of a sudden UK exit from the EU carbon market
• The market was very volatile, with coal-to-gas switch fundamentals providing
one relevant price anchor
• In April, the CO2 price hit an 11 year-high at EUR 27.46 due to long extension
to UK’s exit from the EU
Source: ICE, Thomson Reuters
Market prices 23 April 2019; 2019-2020 future quotations
0
30
60
90
120
150USD / bbl Crude oil price (ICE Brent)
2008 20122010 2014 2016 2018 2020
0
7
14
21
28
35EUR / tCO2 CO2 price (ICE EUA)
2008 20122010 2014 2016 2018 2020

German – Nordic price spread
• During Q1 2019, the average spread was -6.0 EUR/MWh with the
Nordic system average price at 46.9 EUR/MWh and German price at
40.9 EUR/MWh
• Weak demand and very high wind power output in Germany lowered
the German spot price, especially during the first half of March
• During 2012-2018, the average realised German-Nordic spot spread
was 4.6 EUR/MWh, fluctuating on an annual level in the range of -1-
15 EUR/MWh
• The realised German-Nordic spread is impacted by realised supply
and demand fundamentals in Continental Europe and the Nordics
• During Q1 2019, the spread for 2020 delivery traded in the range
9.9-12.9 EUR/MWh, average at 11.6 EUR/MWh
• Expected supply/demand balance in the Nordics and in Continental
Europe has an effect on the spread: investments in new
interconnector capacity, growth of demand and new renewable
capacity as well as amount of exiting nuclear and coal capacity all
play a role
SPOT PRICE
FORWARD PRICE
40
Including 23 April 2019
Source: Nord Pool, Bloomberg
-20
0
20
40
60
80
100
Nordic and German daily spot prices in Jan 2018 – April 2019EUR/MWh
-20
20
40
60
100
80
GermanyNordic
Q1 Q2 Q3 Q4 Q1
0
0
10
20
30
40
50
60
Nordic and German year 2020 forwards in Jan 2018 – April 2019EUR/MWh
GermanyNordic
0
20
40
60
10
30
50
Q1 Q2 Q3 Q4 Q1
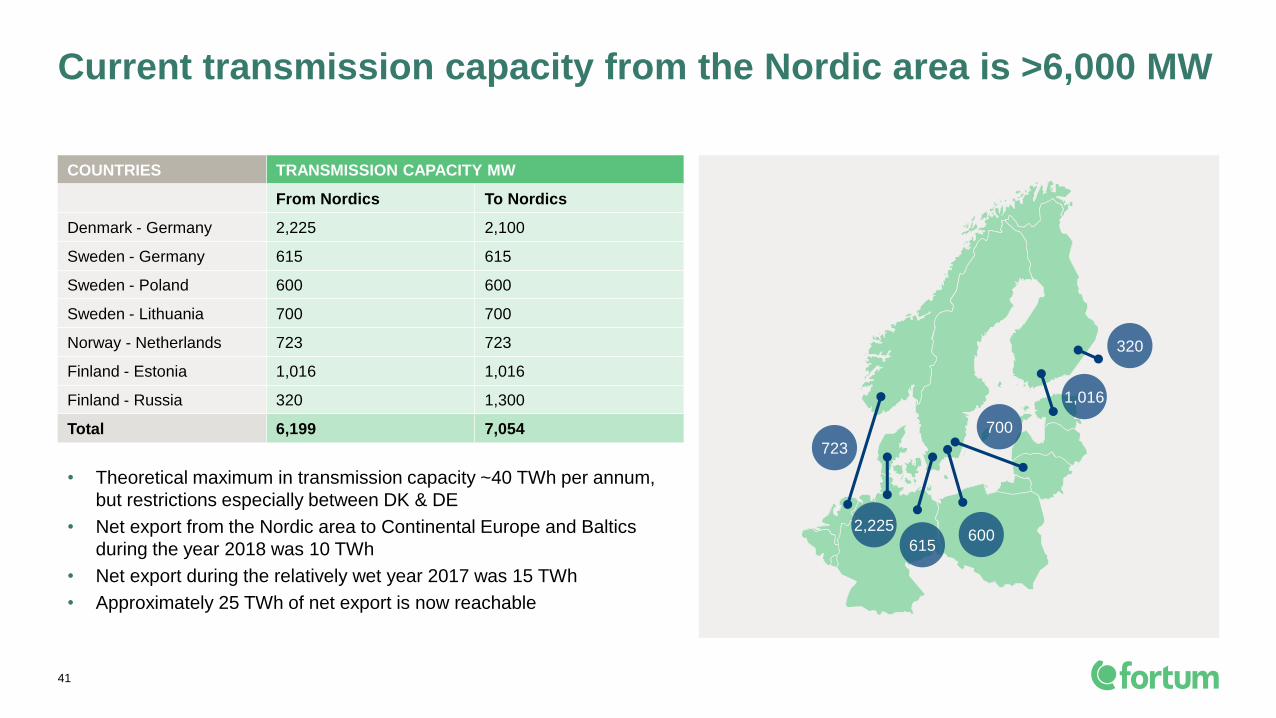
41
Current transmission capacity from the Nordic area is >6,000 MW
• Theoretical maximum in transmission capacity ~40 TWh per annum,
but restrictions especially between DK & DE
• Net export from the Nordic area to Continental Europe and Baltics
during the year 2018 was 10 TWh
• Net export during the relatively wet year 2017 was 15 TWh
• Approximately 25 TWh of net export is now reachable
723
2,225
615600
1,016
320
700
COUNTRIES TRANSMISSION CAPACITY MW
From Nordics To Nordics
Denmark - Germany 2,225 2,100
Sweden - Germany 615 615
Sweden - Poland 600 600
Sweden - Lithuania 700 700
Norway - Netherlands 723 723
Finland - Estonia 1,016 1,016
Finland - Russia 320 1,300
Total 6,199 7,054

42
Nordics, Baltics, the Continental and the UK markets are integrating – interconnection capacity to double by end-2023
Two 1,400 MW NO-UK links as EU Projects of
Common Interest: NSL to England due to be
ready in 2021, NorthConnect to Scotland under
debate in Norway and not yet permitted
1,400 MW NordLink as first direct NO-DE link is
due to start commercial operation in March 2021
700 MW COBRAcable from DK to NL is due to
be ready during Q3/2019
Jutland – DE capacity will grow by 860 MW by end-
2020, with further 1,000 MW increase by end-2023
New 400 MW Zealand – DE connection via
Kriegers Flak offshore wind area ready in Q3/2019
The Northern Seas Offshore Grid and the Baltic
Energy Market Integration Plan are included as
priority electricity corridors in EU’s Infrastructure
Guidelines, approved in April 2013
New interconnections will double the
Nordic export capacity to over 12,000 MW
by end-2023
New internal Nordic grid investments provide
for increased available capacity for export to
the Continent and Baltics
EU’s Connecting Europe Facility co-financing 3rd
EE-LV transmission line, due to be ready in 2020
1,400 MW DK-UK Viking Link has got its final
permits and is to be built by end-2023 Svenska Kraftnät and 50Hertz signed 1/2017
a cooperation agreement on building the 700 MW
Hansa PowerBridge DC link between Sweden
and Germany by 2025/26
1
2
3
4
5
6
8
9
New interconnectors New Nordic lines Existing interconnectors
1
3
45
6
9
8
2
Baltic synchronisation roadmap in June 2018
prioritised a DC sea cable as the required
additional PL-LT interconnection by 2025
7
7

43
Power Generation in the Baltic Rim in 2017 (2016)
Source: ENTSO-E Statistical Factsheet
Graph sizes are illustrative.
NORDICS BALTICS
2017 TWh % TWh %
Hydro *221 55 6 25
Nuclear 85 21 - -
Fossil fuel 26 7 12 55
Biomass 24 6 2 9
Waste 4 1 0 1
Wind 40 10 2 10
Solar 1 0 0 0
Others 1 0 0 0
Total generation 402 100 22 100
Net export
9 TWh
Net import
6 TWh
*) Normal annual Nordic hydro generation 200 TWh, variation +/- 40 TWh.
Finland
65 TWh
(66)
Latvia
7 TWh (6)
Lithuania
4 TWh (4)
Estonia
11 TWh (10)
Denmark
29 TWh (29)
Hydro
Nuclear
Fossil fuel
Wind
Solar
Others
Biomass
Waste
Germany
602 TWh
(610)
Sweden
159 TWh
(152)
Poland
158 TWh
(154)
Norway
149 TWh
(149)

Estimated annual net changes in nuclear
and thermal capacity
44
Northern European conventional capacity decreasing
Estimated capacity changes based on publically announced information from various stakeholders
DATE CAPACITY AREA UNIT/
TRANSMISSION
COMMENT
1.10.2018 - 1100 MW DE Lignite reserve Niederaußem E & F and Jänschwalde F
moved to lignite reserve
31.12.2018 - 473 MW DE Coal Lünen 6&7, decommissioning
31.3.2019 - 937 MW DE Coal Gersteinwerk, Kiel-Ostufer, decommissioning
during 2019 - 619 MW EE Oil shale Closure of four older units in Estonia
1.9.2019 + 700 MW DK1-NL Transmission Cobra cable: trial operation expected to begin
in Q3-19
1.10.2019 - 800 MW DE Lignite reserve Jänschwalde E, Neurath C
1.10.2019 + 0-400 MW DK2-DE Kriegers Flak Offshore connection between DK2 and DE
used for both grid connection of offshore wind
farms and interconnection.
31.12.2019 - 1470 MW DE Phillipsburg 2 Nuclear unit, decommissioning
31.12.2019 - 850 MW SE3 Ringhals 2 Decommissioning
1.1.2020 + 1600 MW FI Olkiluoto 3 Start of regular electricity production expected
in January 2020.
31.3.2020 - 100 MW DK Amagerværket 3 250 MW coal replaced by 150 MW biomass
during 2020 + 1100 MW DE Datteln 4 Uniper’s coal condensing unit; targeted
commissioning mid-2020.
31.12.2020 - 856 MW SE3 Ringhals 1 Decommissioning
31.12.2021 - 4060 MW DE Nuclear Decommissioning Brokdorf, Grohnde,
Gundremmingen C
31.12.2022 - 4040 MW DE Nuclear Decommissioning Isar 2, Emsland,
Neckarwestheim 2
By end of
2022
- 7000 MW DE Coal commission German Coal Commission proposes 7 GW
additional reduction of lignite/hard coal

Fortum’s evolution and historical strategic route
45
Divestment of
heat operations
outside of
Stockholm
Divestment
of Lenenergo
shares
20072006
E.ON
Finland
Oil business
spin-off
TGC-1
established
2005
Birka Energi
50% → 100%
Elnova
50% → 100%
2002
Stora Kraft
Länsivoima
→100%
2000
Divestment of
Fingrid shares
2011 2015
Divestment of
electricity distribution
business
Russian wind power JV
Restructuring of
ownership in Hafslund
Nordkraft wind power
2017
DUON
Ekokem
2016
Turebergs
Recycling
TGC-10
2008
2018
Investment in Uniper
Divestment of
ownership in
Hafslund Produksjon
Divestment of electricity
distribution and heat businesses
Divestment of electricity
distribution business
Divestment of Grangemouth
power plant
2014
Divestment of Gasum shares
Østfold
Shares in
Lenenergo
Shares in
Hafslund
District heating
in Poland →
2003NESTE
IVO
Gullspång
Skandinaviska
Elverk
1996
Länsivoima
45% →
65%
1997
Birka Energi
50% Fortum
50% Stockholm
Gullspång merged
with Stockholm Energi
FORTUM
Lenenergo shares →
1998
Divestment of
non-strategic
heat business
Divestment of
small scale hydro
2012

Fortum's power generation in 2018 Fortum's heat production in 2018
46
Fortum's power and heat production by source
Note: Fortum’s power generation capacity 13,724 MW and heat production capacity 15,009 MW
Total
production
29.8 TWh
Waste 7%
Heat pumps,
electricity 3%
Biomass 8%
Natural gas 64%
Coal 16%
Peat 1%Others 1%
Total
generation
74.6 TWh
Nuclear
power
30%
Natural gas 38%
Coal 3%Biomass 1%
Hydropower 26%
Wind 1%
Solar 0.5%Waste 0.5%

Fortum's European power generation in 2018 Fortum's heat European production in 2018
47
Fortum's European power and heat production by source
Note: Fortum’s European power generation capacity 8,811 MW and heat production capacity 4,780 MW
European
generation
44.7 TWh
Coal 2%
Biomass 2%
Hydropower 43%
Natural gas 1%
Waste 1%
Nuclear power 50%
Wind 1%
European
production
9.4 TWh
Natural gas 10%
Waste 22%
Heat pumps,
electricity 10%
Biomass 24%
Coal 28%
Peat 4%
Others 2%

Fortum’s Nordic, Baltic and Polish generation capacity
48
Associated companies’ plants
(not included in the MWs) Stockholm
Exergi (Former Fortum Värme),
Stockholm; TSE, Naantali
GENERATION CAPACITY MW
Hydro 4,672
Nuclear 2,819
CHP 785
Other thermal 376
Wind 159
Nordic, Baltic and Polish
generation capacity 8,811
Figures 31 December 2018
DENMARK, DK2 MW
Generation capacity, CHP 16
FINLAND MW
Hydro 1,548
Nuclear 1,485
CHP 451
Other thermal 376
Generation capacity 3,860
NORWAY MW
Price areas
NO4, Wind 82
NO1, CHP 20
Generation capacity 102
SWEDEN MW
Price areas
SE2, Hydro 1,550
SE2, Wind 75
SE3, Hydro 1,574
SE3, Nuclear 1,334
SE3, CHP 9
Generation capacity 4,542
BALTICS AND
POLAND MW
Generation capacity, CHP
in Estonia 49
in Latvia 34
in Lithuania 20
in Poland 186
in Latvia, Wind 2
NO2
NO5 NO1
NO3
NO4 SE1
SE2
SE4
EE
LV
LT
PL
FI
SE3
DK1
DK2

Fortum is growing towards gigawatt scale target in solarand wind power production
*) Blaiken last stage IV inaugurated in 2017. NOTE: Table numbers not accounting; tells the size of renewables projects. All not consolidated to Fortum capacities. All figures in MW and rounded to nearest megawatt.
Additionally, target to invest 200 – 400 million euros in India solar and create partnership for operating assets. Under construction includes investment decisions made
First focus markets
Operating wind power plants
Operating solar power plants
Projects under construction
Ulyanovsk
35 MWNygårdsfjellet
32 MW
Solberg 38 MW
(Fortum share)
Blaiken 37 MW (Fortum share)
Sørfjord 97 MW
35 MW solar power plants
Ulyanovsk-2 25 MW
(Fortum share)
Ånstadblåheia 50 MW
Amrit 2 MW (Fortum share)
Kapeli 4 MW (Fortum share)
Bhadla 31 MW (Fortum share)
Pavagada 44 MW
(Fortum share)
49
PORTFOLIO TECHNOLOGY STATUS CAPACITY
MW
FORTUM
SHARE, MW
SUPPLY STARTS/
STARTED
FINLAND 90 90
Kalax Wind Under development 90 90
NORWAY 179 179
Nygårdsfjellet Wind Operational 32 32 2006 and 2011
Ånstadblåheia Wind Operational 50 50 Q4 2018
Sørfjord Wind Under construction 97 97 Q4 2019
SWEDEN 323 75
Blaiken Wind Operational 248 37 (15%) 2017*
Solberg Wind Operational 76 38 (50%) 2018
RUSSIA 2,003 1,092
Bugulchansk Solar Operational 15 15 2016-2017
Pleshanovsk Solar Operational 10 10 2017
Grachevsk Solar Operational 10 10 2017
Solar Under development 110 110 2021-2022
Ulyanovsk Wind Operational 35 35 2018
Ulyanovsk 2 Wind Operational 50 25 (50%) 1.1.2019
Rusnano JV Wind Under construction 200 100 (50%) H1 2020
Rusnano JV Wind Under development 1,573 787 (50%) 2018-2023
INDIA 685 581
Amrit Solar Operational 5 2 (44%) 2012
Kapeli Solar Operational 10 4 (44%) 2014
Bhadla Solar Operational 70 31 (44%) 2017
Pavagada Solar Operational 100 44 (44%) 2017
Pavagada 2 Solar Under construction 250 250 Q3 2019
Rajasthan Solar Under construction 250 250 Q4 2020
TOTAL 3,281 2,017
Under development 2,023 986
Under construction 597 697
Operational 661 334

Fortum’s nuclear fleet
50
RESPONSIBILITIES
Loviisa: Fortum is the owner, licensee and operator with all the responsibilities specified in the Nuclear Energy Act, Nuclear Liability Act, and other relevant nuclear legislation
Other units: Fortum is solely an owner with none of the responsibilities assigned to the licensee in the nuclear legislation. Other responsibilities are specified in the Companies Act and the Articles of Association and are mostly financial.
LOVIISA OLKILUOTO OSKARSHAMN FORSMARK
Commercial
operation started
Unit 1: 1977
Unit 2: 1981
Unit 1: 1978
Unit 2: 1980
Unit 3: (Under construction)
Unit 1: 1972*
Unit 2: 1974*
Unit 3: 1985
Unit 1: 1980
Unit 2: 1981
Unit 3: 1985
Generation Capacity
Fortum’s share
Unit 1: 507 MW
Unit 2: 507 MW
Total: 1,014 MW
100% 1,014 MW
Unit 1: 890 MW
Unit 2: 890 MW
(Unit 3: 1,600 MW)
Total: 1,780 MW (3,380 MW)
27% 473 MW
Unit 1: 473 MW*
Unit 2: 638 MW*
Unit 3: 1,400 MW
Total: 1,400 MW
43% 602 MW
Unit 1: 984 MW
Unit 2: 1,116 MW
Unit 3: 1,159 MW
Total: 3,259 MW
22% 724 MW
Yearly production
Fortum’s share of production
8 TWh
8 TWh
14 TWh
4 TWh
11 TWh
5 TWh
25 TWh
6 TWh
Share of Fortum’s Nordic
production
19% 9% 11% 13%
Majority owner
Fortum’s share
Fortum Pohjolan Voima
26.6%
Uniper
43.4%
Vattenfall
22.2%
Operated by Fortum Teollisuuden Voima (TVO) OKG Aktiebolag Forsmarks Kraftgrupp
*Out of operation; on decommissioning phase

*O1 was shut down for decommissioning earlier as originally announced, starting 17.6.2017.
51
Fortum's nuclear power in the Nordics
Finnish units world class in availability
Overview of production and consumption:
www.fortum.com/investors - energy related links
Source: Fortum
LOAD
FACTOR (%)
2005 2006 2007 2008 2009 2010 2011 2012 2013 2014 2015 2016 2017 2018
Oskarshamn 1* 80 51 63 85 68 77 72 1 12 74 60 81 82 0
Oskarshamn 2* 90 78 76 86 75 90 77 81 33 0 0 0 0 0
Oskarshamn 3 85 95 88 70 17 31 68 69 77 75 79 83 77 87
Forsmark 1 85 76 81 88 88 93 79 88 87 94 79 95 88 94
Forsmark 2 94 72 85 79 64 38 94 82 89 89 91 75 82 87
Forsmark 3 95 92 88 69 86 81 85 93 88 83 58 82 86 81
Loviisa 1 95 93 94 86 96 93 94 84 92 92 93 88 93 91
Loviisa 2 95 88 96 93 95 89 94 91 93 89 92 93 93 85
Olkiluoto 1 98 94 97 94 97 92 95 90 97 94 96 91 93 87
Olkiluoto 2 94 97 94 97 95 95 91 96 93 97 89 94 81 94
Source: Fortum
*) Out of operation; on decommissioning phase
Oskarshamn
Forsmark
Olkiluoto
Loviisa

52
Day ahead wholesale market prices in Russia
I/19 I/18 2018 LTM
Electricity spot price (market price), Urals hub, RUB/MWh 1,128 1,011 1,043 1,072
Average regulated gas price, Urals region, RUB 1000 m3 3,883 3,755 3,801 3,833
Average capacity price for CCS, tRUB/MW/month 162 158 148 149
Average capacity price for CSA, tRUB/MW/month 1,196 1,147 1,075 1,087
Average capacity price, tRUB/MW/month 678 661 609 614
Achieved power price for Fortum in Russia, RUB/MWh 2,002 1,872 1,888 1,924
Achieved power price for Fortum in Russia, EUR/MWh 26.4 26.8 25.6 25.5
Key electricity, capacity and gas prices in the PAO Fortum area
Day ahead
power market prices
for Urals
Source: ATS
In addition to the power price generators
receive a capacity payment.0
5
10
15
20
25
30
35
40
€/
MW
h
2009 2010 2011 2012 2013 2014 2015 2016 2017 2018 20190
200
400
600
800
1 000
1 200
1 400
RU
B /
MW
h
2009 2010 2011 2012 2013 2014 2015 2016 2017 2018 2019

Thermal power generation capacity in Russia on 31 Dec 2018
YEAR SUPPLY
STARTS
POWER
PLANT
FUEL
TYPE
CCS
CAPACITY
CSA
CAPACITY
PRODUCTION
TYPETOTAL
CAPACITY
< 2011 Tyumen CHP-2 Gas 755 CHP/Condensing 755
Chelyabinsk CHP-2 Gas, coal 320 CHP/Condensing 320
Argayash CHP Gas, coal 256 CHP/Condensing 256
Chelyabinsk CHP-1 Gas, coal 134 CHP/Condensing 134
2011 Feb/2011 Tyumen CHP-1 Gas 472 210 CHP/Condensing 682
Jun/2011 Chelyabinsk CHP-3 Gas 360 233 CHP/Condensing 593
2013 Apr/2013 Nyagan 1 GRES Gas 453 Condensing 453
Dec/2013 Nyagan 2 GRES Gas 453 Condensing 453
2015 Jan/2015 Nyagan 3 GRES Gas 455 Condensing 455
Dec/2015 Chelyabinsk GRES Gas 247 CHP/Condensing 247
2016 Mar/2016 Chelyabinsk GRES Gas 248 CHP/Condensing 248
2017 Dec/2017 Chelyabinsk GRES Gas 248 CHP/CCGT 248
2,093 MW 2,086 MW 4,179 MW
53
Tobolsk power plant was sold in Q1/2016
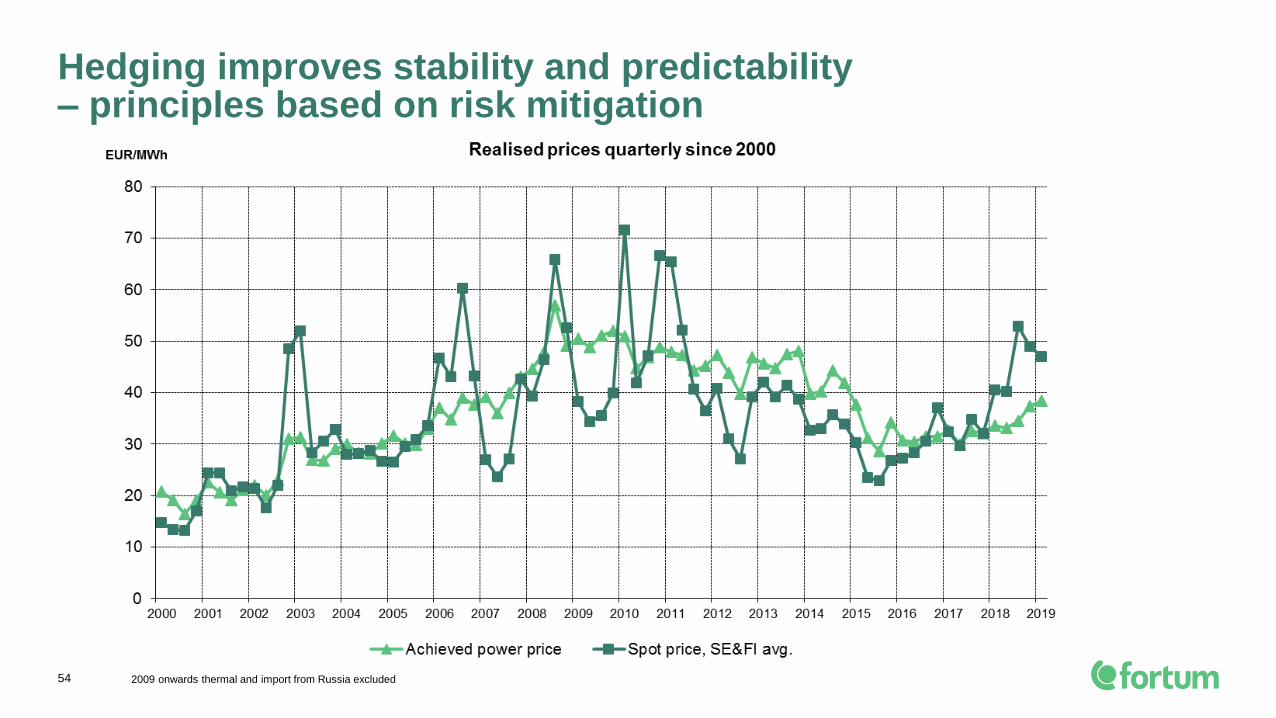
54 2009 onwards thermal and import from Russia excluded
Hedging improves stability and predictability– principles based on risk mitigation

Fortum’s dividend policy is based on the
following preconditions:
• The dividend policy ensures that shareholders receive
a fair remuneration for their entrusted capital, supported
by the company’s long-term strategy that aims at
increasing earnings per share and thereby the dividend.
• When proposing the dividend, the Board of Directors
looks at a range of factors, including the macro
environment, balance sheet strength as well as
future investment plans.
Since 1998 Fortum has paid dividends totaling
EUR 15.6 billion
Five year history of dividend per share
1.1
1.30
1.10 1.10 1.100,2
0,0
0,2
0,4
0,6
0,8
1,0
1,2
1,4
2014 2015 2016 2017 2018
55
Capital returns: 2018 EUR 1.10 per share ~ EUR 1 billion
37% 24% 196% 112% 116%
1.10
Fortum's target is to pay a stable, sustainable,
and over time increasing dividend of 50-80% of
earnings per share excluding one-off items EUR

Fortum Investor Relations andFinancial Communications
For more information,
please visit www.fortum.com/investors
Ingela Ulfves
Vice President,
Investor Relations and
Financial Communication
+358 (0)40 515 1531
Rauno Tiihonen
Manager
+358 (0)10 453 6150
Måns Holmberg
Manager
+358 (0)44 518 1518
Pirjo Lifländer
IR Specialist
+358 (0)40 643 3317
Meeting requests:
Pia Lilja
Executive Assistant
+358 (0)50 553 5529
www.twitter.com/Fortum www.linkedin.com/company/fortum www.youtube.com/user/fortumFortum ForEnergy blog at
fortumforenergyblog.wordpress.com
Follow us on:
Next events:
Q2/2019 results on 19 July 2019
Q3/2019 results on 24 October 2019
To subscribe Fortum's releases, please fill out the subscribtion form on our website
https://www.fortum.com/about-us/media/media-room/subscribe-press-releases