equity research initiation report 29 june 2021
TRANSCRIPT

Karun Intrachai [email protected]
+66 2611 3555
PREPARED BY FSS INTERNATIONAL INVESTMENT ADVISORY SECURITIES CO LTD (FSSIA). ANALYST CERTIFICATION AND IMPORTANT DISCLOSURES CAN BE FOUND AT THE END OF THIS REPORT
EQUITY RESEARCH – INITIATION REPORT
29 JUNE 2021 THAILAND / REAL ESTATE
WHA CORPORATION WHA TB
BUY A promised land for growth
3 ปัจจยับวกท่ีจะผลกัดนัก าไรให้เติบโต WHA เป็นหนึ่งในผูน้ าในธุรกจินิคมอุตสาหกรรมและขนส่งของไทยดว้ยพอรต์ทีม่กีารกระจายความเสีย่งประกอบดว้ยธุรกจิไฟฟ้าและสาธารณูปโภคซึง่สรา้งกระแสรายไดค้งที ่เราเชือ่ว่า WHA จะเป็นหนึ่งในหุน้ทีไ่ดร้บัประโยชน์จากการเปิดประเทศ และเกาะรอบการลงทุนใหมห่ลงั Covid ในประเทศไทยและเวยีดนาม นอกเหนอืจากรายไดส้ม ่าเสมอทีไ่ดจ้ากธุรกจิไฟฟ้า สาธารณูปโภค (น ้า) และกลยุทธใ์นการแปลงสนิทรพัยเ์ป็นเงนิสดของบรษิทัฯ เราคาดว่าก าไรของ WHA จะเกนิระดบัสงูสุดก่อน Covid ที ่3.3พนั ลบ. ภายในปี 2022 โดยไดปั้จจยัผลกัดนัจาก: 1) การกลบัมาเปิดเศรษฐกจิและรอบการลงทุนใหมท่ีจ่ะช่วยเพิม่ยอดขายทีด่นิในนิคมอุตสาหกรรมของบรษิทัฯ; 2) การเกาะกระแสเงนิลงทุนทางตรงจากต่างประเทศ (FDI) ที่เพิม่ขึน้ในเวยีดนาม; และ 3) กระแสรายไดส้ม ่าเสมอทีส่งูขึน้จากธุรกจิไฟฟ้าและสาธารณูปโภค
การกลบัมาเปิดเศรษฐกิจและรอบการลงทุนใหม่จะช่วยเพ่ิมยอดขายท่ีดินในนิคมอตุสาหกรรม
WHA ตัง้เป้ายอดขายทีด่นิในนิคมอุตสาหกรรมไวท้ี ่1,030 ไร่ในปี 2021 ประกอบดว้ย 725 ไร่ในประเทศไทยและ 305 ไร่ในเวยีดนาม ใน 1Q21 ยอดขายทีด่นิอยู่ที ่213 ไร่ (188 ไร่ในประเทศไทยและ 25 ไร่ในเวยีดนาม) คดิเป็น 21% ของประมาณการรวมทัง้ปีของเรา เราคาดว่ายอดขายทีด่นิใน 2Q21 จะลดลงเหลอื 50-70 ไร่ในประเทศไทยจากผลกระทบของการแพร่ระบาด Covid ในรอบทีส่าม อย่างไรกด็ ีWHA คาดว่ายอดขายทีด่นิฯ จะเพิม่ขึน้ใน 2H21 และคงเป้ายอดขายทีด่นิฯ ปี 2021 ของบรษิทัฯ ไวท้ี ่1,030 ไร่ เทยีบกบัสมมตฐิานของเราที ่700 ไร ่
เกาะกระแสการเติบโตของเวียดนาม WHA ไดร้บัเชญิจากรฐับาลเวยีดนามใหพ้ฒันานิคมอุตสาหกรรมบนพืน้ทีร่วม 17,500 ไร่ใน Nghe An ใน Phase 1A ซึง่ประกอบดว้ยทีด่นิ 1,000 ไร่ บรษิทัฯ สรา้งเสรจ็แลว้ 100% และปล่อยเช่าได ้52% ในขณะที ่Phase 1B ซึง่ประกอบดว้ยทีด่นิ 2,100 ไร่ ปัจจุบนับรษิทัฯ ก าลงัอยู่ในระหว่างการขอใบอนุญาตลงทุนและใบอนุญาตประกอบกจิการ ซึง่เราคาดว่าจะเสรจ็พรอ้มเช่าภายในปี 2022 เราคาดว่ายอดขายทีด่นิฯ ในเวยีดนามจะเพิม่ขึน้ตัง้แต่ปี 2022 เป็นตน้ไปสู่ระดบั 300-400 ไรต่่อปีตาม FDI ทีอ่ยูใ่นระดบัสงูในประเทศดงักล่าว
เร่ิมด้วยค าแนะน าซ้ือท่ีราคาเป้าหมาย 4.4 บาท เราเริม่บทวเิคราะห ์WHA ดว้ยค าแนะน าซื้อทีร่าคาเป้าหมาย 4.4 บาท (SoTP) ประกอบดว้ย 1) มลูค่าสนิทรพัยส์ุทธ ิ(NAV) ของทีด่นิทีพ่ฒันาแลว้และทีอ่ยูร่ะหว่างพฒันาในประเทศไทยและเวยีดนาม; 2) NAV ของพืน้ทีใ่หเ้ช่าทีม่ผีูเ้ช่าแลว้และพรอ้มเช่า รวมถงึทีด่นิระหว่างพฒันาส าหรบัธุรกจิขนส่ง; 3) มลูค่าปัจจุบนั (NPV) ของธุรกจิใหเ้ช่าและสาธารณูปโภค (7.2% WACC, 3% terminal growth); 4) มลูค่ายุตธิรรมของหุน้ 70% ทีบ่รษิทัฯ ถอืใน WHAUP; และ 5) มลูค่าตลาดของการลงทุนของบรษิทัฯ
TARGET PRICE THB4.40
CLOSE THB3.22
UP/DOWNSIDE +36.6%
TP vs CONSENSUS +10.7%
KEY STOCK DATA
YE Dec (THB m) 2020 2021E 2022E 2023E
Revenue 6,914 10,377 10,207 11,446
Net profit 2,524 2,763 3,335 3,776
EPS (THB) 0.17 0.18 0.22 0.25
vs Consensus (%) - (10.9) (3.9) (6.7)
EBITDA 3,645 4,093 4,901 5,535
Core net profit 2,524 2,763 3,335 3,776
Core EPS (THB) 0.17 0.18 0.22 0.25
Chg. In EPS est. (%) nm nm nm nm
EPS growth (%) (21.8) 9.5 20.7 13.2
Core P/E (x) 19.1 17.4 14.4 12.7
Dividend yield (%) 4.3 3.4 4.2 4.7
EV/EBITDA (x) 24.4 22.2 18.7 16.7
Price/book (x) 1.7 1.8 1.6 1.5
Net debt/Equity (%) 116.5 123.7 113.6 105.4
ROE (%) 8.7 9.8 11.7 12.3
Share price performance 1 Month 3 Month 12 Month
Absolute (%) 4.5 (7.5) 0.0
Relative to country (%) 4.7 (7.7) (15.8)
Mkt cap (USD m) 1,506
3m avg. daily turnover (USD m) 11.5
Free float (%) 62
Major shareholder Ms Jareeporn Jarukornsakul (22%)
12m high/low (THB) 3.66/2.36
Issued shares (m) 14,946.83
Sources: Bloomberg consensus; FSSIA estimates
(25)
(20)
(15)
(10)
(5)
0
5
10
0.0
0.5
1.0
1.5
2.0
2.5
3.0
3.5
4.0
มิ.ย.-20 ส.ค.-20 ต.ค.-20 ธ.ค.-20 ก.พ.-21 เม.ย.-21
(%) (THB) WHA Relative to SET
Jun-20 Sep-20 Dec-20 Mar-21 Jun-21
บทวิเคราะห์ฉบบัน้ีแปลมาจากบทวิเคราะห์ของ FSSIA ฉบบัวนัท่ี 29 มิถุนายน 2021

WHA Corporation WHA TB Karun Intrachai
2 FINANSIA
Investment thesis
WHA is the leading industrial estate and logistics players
in Thailand a diversified portfolio in the utilities business
which generates a stable revenue stream and could be
cushion for the downside risk during the economic cycle
downturn. We believe WHA will be one of stocks to
capture the benefits from the economic reopening
scheme, riding the new post-Covid CAPEX cycle in
Thailand. Moreover, the stock should be a good
candidate to ride the CAPEX cycle in Vietnam – the
country with one of the highest economic growth rates in
Asia.
We expect WHA‟s earnings could surpass their pre-Covid peak of THB3.3b by 2022, driven by triple engines: 1) the economic reopening and new CAPEX cycle to boost industrial estate (IE) domestic land sales; 2) riding the high attractive foreign direct investment (FDI) in Vietnam; and 3) recurring income streams from its power and utilities business as well as asset monetisation.
Company profile
WHA is a leading industrial estate and logistics players in Thailand. Its diversified portfolio in the utilities business generates a stable revenue stream that can provide a cushion from the economic cycle downturn.
www.wha.co.th
Principal activities (revenue, 2020)
Source: WHA Corp
Major shareholders
Source: WHA Corp
Rental - 26.6 %
Land sales - 51.1 %
Utilities - 22.2 %
Ms Jareeporn Jarukornsakul -21.6 %
Ms Chatchamol Anantaprayoon -8.3 %
Thai NVDR - 5.6 %
Others - 64.5 %
Catalysts
Key potential drivers for WHA are:
1) Positive developments from EEC projects;
2) Trade disputes between China and the US causing a capital investment relocation to ASEAN, especially Thailand and Vietnam;
3) Government stimulus packages to boost private investment.
Risks to our call
Downside risks to our SoTP-derived TP include 1) lower-
than-expected IE land sales and transfers in Thailand and
Vietnam; and 2) a lower-than-expected utilization rate from
the utilities business in Vietnam..
Event calendar
Date Event
August 2021 2Q21 results announcement
Key assumptions
2021E 2022E 2023E
Revenue (THB b) 10.4 10.2 11.4
IE land sales (Thailand) (rai) 386 640 760
IE land sales (Vietnam) (rai) 112 280 340
Asset monetisation (THB b) 5.4 3.8 4.2
Rental revenue (THB b) 1.9 2.0 2.2
Gross margin (%) 48.1 56.2 56.1
Equity income (THB b) 1.2 1.2 1.3
Net profit (THB m) 2,763 3,335 3,776
Source: FSSIA estimates
Earnings sensitivity
For every 100 rai increase in IE land transfers in
Thailand, we estimate 2022 net profit to rise 3.1%, and
vice versa, all else being equal.
For every 100 rai increase in IE land sales in Vietnam,
we estimate 2022 net profit to rise 1.4%, and vice versa,
all else being equal.
Source: FSSIA estimates

WHA Corporation WHA TB Karun Intrachai
3 FINANSIA
WHA Corporation WHA TB Karun Intrachai
4 FINANSIA
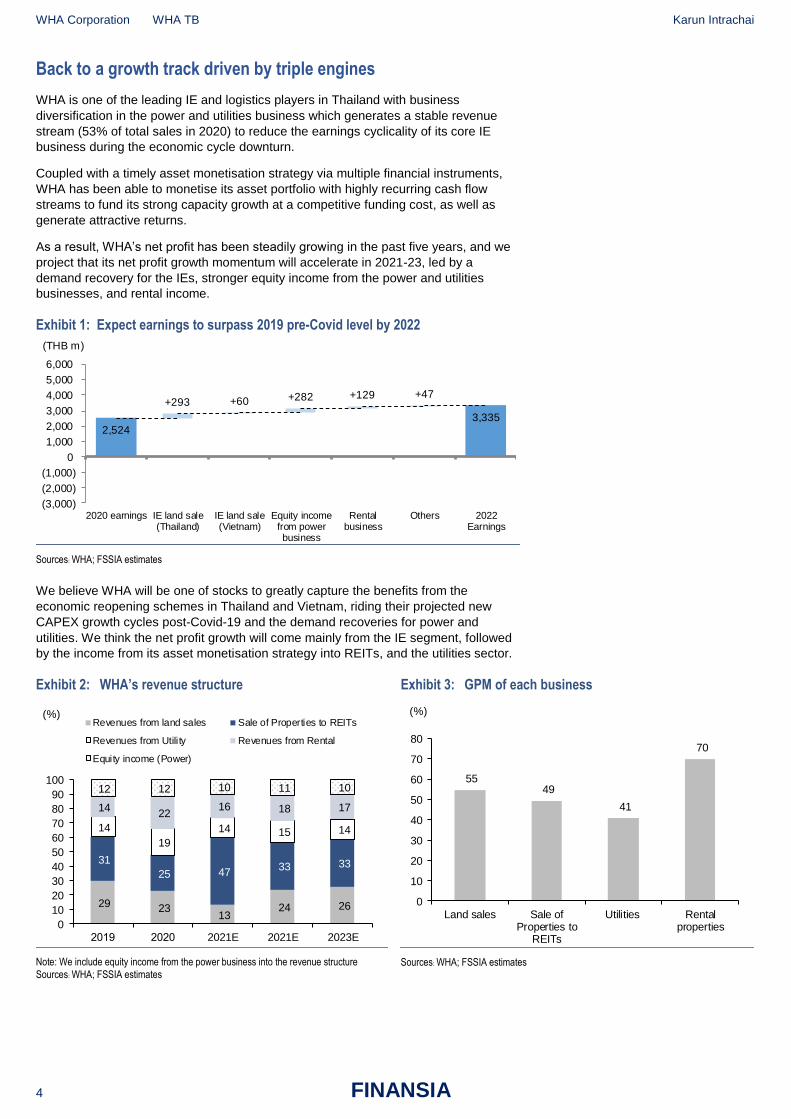
Back to a growth track driven by triple engines
WHA is one of the leading IE and logistics players in Thailand with business
diversification in the power and utilities business which generates a stable revenue
stream (53% of total sales in 2020) to reduce the earnings cyclicality of its core IE
business during the economic cycle downturn.
Coupled with a timely asset monetisation strategy via multiple financial instruments,
WHA has been able to monetise its asset portfolio with highly recurring cash flow
streams to fund its strong capacity growth at a competitive funding cost, as well as
generate attractive returns.
As a result, WHA‟s net profit has been steadily growing in the past five years, and we
project that its net profit growth momentum will accelerate in 2021-23, led by a
demand recovery for the IEs, stronger equity income from the power and utilities
businesses, and rental income.
Exhibit 1: Expect earnings to surpass 2019 pre-Covid level by 2022
Sources: WHA; FSSIA estimates
We believe WHA will be one of stocks to greatly capture the benefits from the
economic reopening schemes in Thailand and Vietnam, riding their projected new
CAPEX growth cycles post-Covid-19 and the demand recoveries for power and
utilities. We think the net profit growth will come mainly from the IE segment, followed
by the income from its asset monetisation strategy into REITs, and the utilities sector.
Exhibit 2: WHA’s revenue structure Exhibit 3: GPM of each business
Note: We include equity income from the power business into the revenue structure
Sources: WHA; FSSIA estimates
Sources: WHA; FSSIA estimates
2,5243,335
+293 +60 +282 +129 +47
(3,000)
(2,000)
(1,000)
0
1,000
2,000
3,000
4,000
5,000
6,000
2020 earnings IE land sale(Thailand)
IE land sale(Vietnam)
Equity incomefrom powerbusiness
Rentalbusiness
Others 2022Earnings
(THB m)
29 23 13
24 26
31
25 47 33 33
14
19
14 15 14
14 22
16 18 17
12 12 10 11 10
0
10
20
30
40
50
60
70
80
90
100
2021E 2021E 2023E
(%)Revenues from land sales Sale of Properties to REITs
Revenues from Utility Revenues from Rental
Equity income (Power)
55 49
41
70
0
10
20
30
40
50
60
70
80
Land sales Sale ofProperties to
REITs
Utilities Rentalproperties
(%)

WHA Corporation WHA TB Karun Intrachai
5 FINANSIA
We expect that WHA‟s earnings could surpass its pre-Covid peak of THB3.3b by 2022
and project net profit growth of 9.5-20.7% in 2021-23, driven by the triple growth
engines of 1) the economic reopening and a new CAPEX cycle to boost IE‟s domestic
land sales; 2) rising foreign direct investment (FDI) in Vietnam; and 3) stronger
recurring income streams from its power and utilities business, as well as asset
monetisation.
Exhibit 4: WHA’s gross profit structure Exhibit 5: Gross profit breakdown by business
Sources: WHA; FSSIA estimates
Sources: WHA; FSSIA estimates
46 43 44 49 51
13 12 12 11 11
16 23 21 18 17
26 22 23 21 21
0
10
20
30
40
50
60
70
80
90
100
2021E 2021E 2023E
(%)Gross profit from land sales Gross profit from Utility
Gross profit from Rental Equity income (power)
2.51.9 2.2
2.83.3
0.7
0.50.6
0.70.70.9
1.01.0
1.11.11.4
1.01.2
1.2
1.3
0
1
2
3
4
5
6
7
2021E 2022E 2023E
(THB b)
Gross profit from land sales Gross profit from Utility
Gross profit from Rental Equity income (power)

WHA Corporation WHA TB Karun Intrachai
6 FINANSIA
Growth engine #1: Reopening and new CAPEX cycle to boost IE land sales
Land sales, presales and transfer outlook. IE land sales, WHA‟s core business,
plunged by 37% y-y to 510 rai in 2020, down from its 5-year average of 929 rai, due to
the travel restrictions caused by the Covid-19 outbreak. However, we think the gradual
success of the vaccine rollouts should prompt countries to reopen and ease their travel
restrictions globally, leading to a rise in IE land sales that we estimate should bounce
back to its average of 900-1,200 rai annually in 2022-23.
WHA is targeting IE presales of 1,030 rai in 2021, comprising 725 rai in Thailand and
305 rai in Vietnam. Land sales in 1Q21 were at 213 rai (188 rai in Thailand and 25 rai
in Vietnam), accounting for 21% of our full-year estimate. We project 2Q21 land sales
of 50-70 rai in Thailand following the impact of the third wave of Covid, and we believe
WHA‟s IE land presales would accelerate in 2H21 to achieve our assumption of 700
rai in 2021, which is lower than WHA‟s target of , 3 rai in 2021.
Exhibit 6: IE land sales Exhibit 7: IE land transfers
Sources: WHA; FSSIA estimates
Sources: WHA; FSSIA estimates
We project land transfers in 2021 to be weak due to the low presales in 2020 following
the travel restrictions. WHA has currently secured a c515 rai backlog as of end-1Q21
after the transfer of 8 rai in Thailand and no land transfers in Vietnam, of which 70 rai
are from Vietnam and the remaining 445 rai are located in the eastern part of Thailand
which has a tax privilege under the Eastern Economic Corridor (EEC). Overall, we
estimate land transfers of 490 rai in 2021, in line with the company‟s target.
Exhibit 8: Improving Thai imports of capital goods in 1Q21 Exhibit 9: Thailand private investment index
Source: Bank of Thailand
Source: Bank of Thailand
1,043 835 974 976 815 218 500 600 800
-
-
- -
-
292
200 300
400
-
200
400
600
800
1,000
1,200
1,400
2015
2016
2017
2018
2019
2020
2021E
2022E
2023E
(rai)Thailand Vietnam
1,238 691 1,035 630 1,050 516 386 640 760
0
0
0
0
0
220
112
280340
0
200
400
600
800
1,000
1,200
1,400
2015
2016
2017
2018
2019
2020
2021E
2022E
2023E
(rai)Thailand Vietnam
(40)
(30)
(20)
(10)
0
10
20
30
40
2014 2015 2016 2017 2018 2019 2020 2021
(y-y %)Thailand imports capital goods
(25)
(20)
(15)
(10)
(5)
0
5
10
15
Jan
-17
Ap
r-1
7
Jul-1
7
Oct-
17
Jan
-18
Ap
r-18
Jul-1
8
Oct-
18
Jan
-19
Ap
r-1
9
Jul-1
9
Oct-
19
Jan
-20
Ap
r-2
0
Jul-2
0
Oct-
20
Jan
-21
Ap
r-2
1
(y-y %)Private investment index

WHA Corporation WHA TB Karun Intrachai
7 FINANSIA
Most of the backlog would likely be transferred in 2H21. The process typically takes six
months to wait for a customer‟s factory permit, land and road improvements, and
infrastructure construction. We think this process would take longer under the current
circumstances.
Exhibit 10: Capacity utilization rate Exhibit 11: Land sales and private investment index
Source: Bank of Thailand
Sources: Bank of Thailand; WHA
According to the Bank of Thailand (BoT)‟s release on the “Economic and Monetary
Conditions for February ”, issued on 3 March , private investment indicators
expanded at a higher rate on the back of higher imports of capital goods. The
improvement was in line with business sentiment and the recovery path of exports.
Hence, we believe an uptick in private investments would be a short-term catalyst for
the IE sector, especially for WHA.
Exhibit 12: Thailand’s FDI under BOI approval has been at a low base for the past five years
Exhibit 13: FDI among Southeast Asian countries
Source: Board of Investment
Source: Bloomberg
45
50
55
60
65
70
75
80
Jan-1
9
Mar-
19
May-
19
Jul-19
Sep-1
9
Nov-
19
Jan-2
0
Mar-
20
May-
20
Jul-20
Sep-2
0
Nov-
20
Jan-2
1
Mar-
21
(%)Capacity utilization rate
(80)
(60)
(40)
(20)
0
20
40
60
80
(6)
(4)
(2)
0
2
4
6
8
2014 2015 2016 2017 2018 2019 2020
(%) (%)PII Land sales WHA (RHS)
17
33
3
8 97
15
7
0
5
10
15
20
25
30
35
3
(USD b) Net applications of FDI under BOI approval
-
5
10
15
20
25
30
2005
2006
2007
2008
2009
2010
2011
2012
2013
2014
2015
2016
2017
2018
2019
(THB b)Thailand Vietnam Philippines
Indonesia Malaysia Myanmar

WHA Corporation WHA TB Karun Intrachai
8 FINANSIA
Growth engine #2: Riding Vietnam’s growth
WHA was invited by the Vietnamese government to develop an industrial estate for a
total of 17,500 rai in Nghe An province. WHA Industrial Zone 1 was granted an
Investment Registration Certificate for phase 1 covering 498 hectares or 3,100 rai.
Phase 1A comprising 1,000 rai is c100% complete and 52% leased, while Phase 1B
comprising 2,100 rai is currently under the process to obtain an investment license and
permit approval, which we expect to be completed for leasing by 2022.
Moreover, WHA signed a memorandum of understanding to develop two industrial
zone projects in Thanh Hua province with a total area of 1,080 hectares or 6,750 rai.
The construction process is expected to start by 2023-24.
Exhibit 14: First IE zone in Vietnam in Nghe An Exhibit 15: Second IE zone in Vietnam in Thanh Hoa
Source: WHA
Source: WHA
Vietnam has one of the fastest growing economies in Asia, even in the 2020 Covid
pandemic year, ranking among the top three performing Asian economies with 2.9%
GDP growth in 2020. According to Asian Development Outlook (ADO) 2021, Vietnam‟s
economic growth is expected to grow at 6.7% p.a. in 2021 and 7.0% p.a. in 2022,
driven by its rising export-oriented manufacturing, increased investment, and
expanding trade. Moreover, FDI in Vietnam rose 6.5% y-y in 1Q21 and is worth
USD7.2b in 5M21, driving its economic growth. Currently, investments from
companies overseas account for % of Vietnam‟s export value.
Exhibit 16: 2020 GDP growth of major Asian economies Exhibit 17: FDI in Vietnam continues to grow in 2021
Source: CNBC
Sources: Foreign Investment Agency, Ministry of Planning and Investment of Vietnam
(10) (5) 0 5 10
Philippines
Thailand
Malaysia
Singapore
Hong Kong
Indonesia
Japan
South Korea
India
Vietnam
Taiwan
China
2020 GDP Growth of major Asian economics
11.5
12.4
14.5
15.8
17.5
19.1
20.4
20.0
7.2
(10)
(5)
0
5
10
15
20
0
5
10
15
20
25
2013
2014
2015
2016
2017
2018
2019
2020
May-
21
(%)(USD b)FDI Growth y-y (RHS)

WHA Corporation WHA TB Karun Intrachai
9 FINANSIA
Exhibit 18: Top foreign investors in Vietnam as of Nov-20 Exhibit 19: Top investment locations in Vietnam as of Nov-20
Source: Vietnam Briefing
Source: Vietnam Briefing
One of the biggest industrial zones in Nghe An
Vietnam‟s Nghe An province has been an attractive investment destination for both
domestic and foreign investors. In 2020, Nghe An exported to 124 countries with a
trade turnover value of USD1.1b, of which processed industrial products accounted for
78% of the total export value. Nghe An set a total export value target to grow at 7.1%
y-y to USD1.2b in 2021. Additionally, the Vietnamese General Statistics Office
reported the total gross regional domestic product (GRDP) of Nghe An at USD3.6b or
4.5% y-y growth in 2020, and is expected to grow at 8.5% y-y in 2021, outpacing the
country‟s GDP growth of 6.5%, making Nghe An among 19 out of 58 provinces with a
positive growth rate and ranking second in the North Central region.
According to the Vietnam Briefing website, Nghe An‟s Dong Nam Economic Zone
plays an important role in the country‟s GDP growth as it is an important gateway for
Central and Upper Laos as well as Northeast Thailand, connecting to Central Vietnam.
Hence, the Dong Nam Economic Zone benefits the economic development of not only
Vinh City in Nghe An, but also the growth of Hoang Mai town and Cua Lo town.
WHA Industrial Zone (WHA IZ) is located within the Dong Nam Economic Zone, and is
set to become the largest well-developed industrial zone in North Central Vietnam,
according to management. The special feature about WHA IZ is its green industrial
development model with 30% of the total land area dedicated to green spaces,
contributing to the country‟s sustainable development.
Exhibit 20: GDP growth – Nghe An province vs Vietnam Exhibit 21: Nghe An’s minimum wage is relatively low compared to other regions
Province Minimum wage
2018 2019 2020
(USD/month) (USD/month) (USD/month)
Nghe An 121 127 145
Ho Chi Minh City 175 181 188
Binh Duong 156 161 167
Dong Nai 136 141 167
Hanoi 175 181 188
Hai Phong 175 181 188
Bac Ninh 151 161 167
Sources: Vietnam Briefing; ADB; Nghe An Provincial Statistical Office
Sources: Vietnam Briefing; Ministry of Labour, Invalids and Social Affairs
0
10
20
30
40
50
60
70
80
South
Kore
a
Japan
Sin
gapore
Tai
wan
Hong K
ong
Britis
h V
irgin
Isla
nds Chin
a
(USD b)Top Investor
3.35
1.34 1.32 1.11 1.07
0.66 0.59
0.20
0.0
0.5
1.0
1.5
2.0
2.5
3.0
3.5
4.0
LongAn
Ho ChiMinhcity
CanTho
BinhDuong
HaiPhong
BacGiang
Ha Noi NgheAn
(USD b)Top attractive city
Rank 13
7.5
8.3 8.8 9.0
4.45
8.5
6.7 6.9 7.1 7.0
2.9
6.5
0
1
2
3
4
5
6
7
8
9
10
2016 2017 2018 2019 2020 2021E
(%)Nghe An province Vietnam

WHA Corporation WHA TB Karun Intrachai
10 FINANSIA
Growth engine #3: Recurring income stream from its power and utilities business as well as asset monetisation
WHA‟s revenue can be divided into four groups: 1) revenue from land sales which
comprises industrial estate land sales and sales of properties to real estate investment
trusts or REITs; 2) rental revenue from its logistics business (built-to-suit warehouses
and factories); 3) revenue from its utilities business; and 4) equity income from its
power business. The latter three sources of revenue can be considered as recurring
income including asset monetisation. Hence, we project that WHA‟s earnings will be
more sustainable and less volatile, as 53% of total revenue and 57% of total gross
profit in 2020 was generated from the rental, power and utilities businesses.
Exhibit 22: WHA’s revenue structure Exhibit 23: WHA’s gross profit structure
Sources: WHA; FSSIA estimates
Sources: WHA; FSSIA estimates
Utilities business (18% of total sales, 12% of total gross profit)
WHA provides the raw water, industrial water, and wastewater treatment at its own
industrial estate. WHA has a total domestic water production capacity of 355k m3 per
day and has a maximum combined 162k m3 per day capacity for managing
wastewater. WHA currently has a raw water sales volume of 178 m3 per day (50%
utilization rate) and an average volume for wastewater management of 85k m3 per
day (52% utilization rate). We expect that revenue could have a low growth rate of 4-
6% over 2021-23 following lower IE land sales. Note that utilities revenue could lag
two years behind land transfers due to the construction period of factories.
WHA expanded its utilities business to Vietnam in 2019. WHA currently has a
maximum tap water production level of 12k m3 per day, and has a total wastewater
management capacity of 3,200 m3 per day. The company also invested in Cua Lo
Water Supply, which is the producer and distributor of tap water in Nghe An, and
Duang River Surface Water Plant (SDWTP), which is one of the leading tap water
providers for Hanoi, with an equity stake of 47% and 34%, respectively. The two
projects have total water production levels of 13k and 300k m3 per day. WHA sold a
total tap water volume of 51k m3 per day in 2020 (50% utilization rate). We expect that
its utilization rate would need to increase to 80% to break even. Hence, we estimate
that the utilities business in Vietnam will continue to contribute losses of around
THB20m-100m in 2021-23.
Revenues from land sales
23%
Sale of Properties to REITs
25%Revenues
from Utilities
18%
Revenues from Rental
22%
Equity income (Pow er)
12%
Gross profit from land sales
43%
Gross profit from Utility
12%
Gross profit from Rental
23%
Equity income (pow er)
22%

WHA Corporation WHA TB Karun Intrachai
11 FINANSIA
Exhibit 24: Utilities business details and growth profile
Source: WHA
Power business (12% of total sales, 22% of total gross profit)
WHA has a total installed equity capacity of 594MW, comprising 547MW from
conventional power plants (independent power producers (IPPs) and small power
producers (SPPs)), 44MW from solar rooftops, and 3MW from an industrial waste-to-
energy power plant. We project that WHA‟s equity MW capacity could grow to 670MW
in 2021 (13% capacity growth in 2021) following the commercial operation dates
(COD) of solar rooftops for warehouse customers.
Exhibit 25: Net profit vs power equity income Exhibit 26: 2021 capacity growth targets for power business
Sources: WHA; FSSIA estimates
Source: WHA
-
500
1,000
1,500
2,000
2,500
3,000
3,500
4,000
2021E 2022E 2023E
(THB m) Net profit Power equity income

WHA Corporation WHA TB Karun Intrachai
12 FINANSIA
Asset monetisation treated as recurring income
WHA‟s business model is to divest its properties to REITs for a quick cash flow due to
its capital-intensive business nature. Hence, as long as WHA can find new customers
for its logistics and industrial business, we believe it will divest its assets to REITs
annually, and this could be treated as recurring income, not a one-off item.
In 2021, WHA aims to divest its 100%-owned asset of approximately 180,000 sqm to
WHA Premium Growth Freehold & Leasehold REIT (WHART TB, not rated) for a total
value of THB5.5b in 4Q21. We estimate a gross profit of c30-35%, less than the asset
monetisation to Hemaraj Leasehold Real Estate Investment Trust (HREIT TB, not
rated) at a c40% GPM.
WHA aims to add new tenants for 175,000 sqm with short-term contracts for 50,000
sqm. WHA achieved 43,000 sqm of new rentals and 26,000 sqm of short-term
contracts. We remain convinced that the target could be achievable following a solid
demand for warehouses due to the e-commerce trend.
Exhibit 27: Logistics warehouse area and occupancy rate Exhibit 28: Industrial warehouse area and occupancy rate
Sources: WHA; FSSIA estimates
Sources: WHA; FSSIA estimates
Exhibit 29: Asset monetisation details
WHA 2016 2017 2018 2019 2020
(THB m) (THB m) (THB m) (THB m) (THB m)
Income from sale of assets to property fund/REIT 4,145 2,875 1,127 1,561 981
Share of profits from sale of JV's IP
464 240 320
Area sold to WHAPF/WHART (sqm) 157,215 84,967 156,535 155,237 128,789
Selling price per sqm (THB) 26,365 33,836 36,703 49,446 25,111
Gross margin from sale of investment properties (%) 25.2 44.7 36.0 39.0 25.3
Income from sale of assets to property fund/REIT 6,280 - 1,259 - 1,091
Area sold to HREIT (sqm) 261,314 - 55,131 - 48,127
Selling price per sqm (THB) 24,030 - 22,837 - 27,795
Gross margin from sale of investment properties (%) 38.8 - 44.1 - 56.8
Sources: WHA; FSSIA estimates
96
92 92
95
93
88 89
87
93
82
84
86
88
90
92
94
96
98
0
100
200
300
400
500
600
1Q19 2Q19 3Q19 4Q19 1Q20 2Q20 3Q20 4Q20 1Q21
(%)('000 sqm)Leasable area Occupancy (RHS)
35
41
52
63 66
62
55 50
53
0
10
20
30
40
50
60
70
0
50
100
150
200
250
300
1Q19 2Q19 3Q19 4Q19 1Q20 2Q20 3Q20 4Q20 1Q21
(%)('000 sqm)Leasable area Occupancy (RHS)
WHA Corporation WHA TB Karun Intrachai
13 FINANSIA
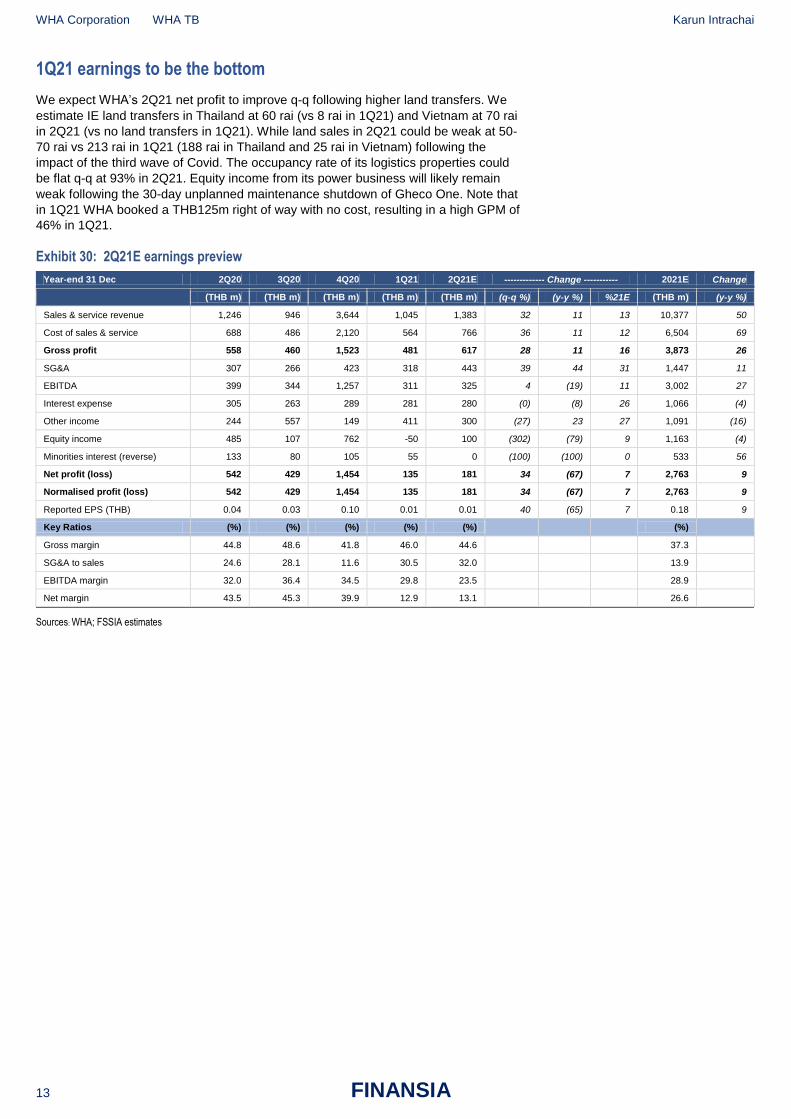
1Q21 earnings to be the bottom
We expect WHA‟s 2Q21 net profit to improve q-q following higher land transfers. We
estimate IE land transfers in Thailand at 60 rai (vs 8 rai in 1Q21) and Vietnam at 70 rai
in 2Q21 (vs no land transfers in 1Q21). While land sales in 2Q21 could be weak at 50-
70 rai vs 213 rai in 1Q21 (188 rai in Thailand and 25 rai in Vietnam) following the
impact of the third wave of Covid. The occupancy rate of its logistics properties could
be flat q-q at 93% in 2Q21. Equity income from its power business will likely remain
weak following the 30-day unplanned maintenance shutdown of Gheco One. Note that
in 1Q21 WHA booked a THB125m right of way with no cost, resulting in a high GPM of
46% in 1Q21.
Exhibit 30: 2Q21E earnings preview
Year-end 31 Dec 2Q20 3Q20 4Q20 1Q21 2Q21E ------------- Change ----------- 2021E Change
(THB m) (THB m) (THB m) (THB m) (THB m) (q-q %) (y-y %) %21E (THB m) (y-y %)
Sales & service revenue 1,246 946 3,644 1,045 1,383 32 11 13 10,377 50
Cost of sales & service 688 486 2,120 564 766 36 11 12 6,504 69
Gross profit 558 460 1,523 481 617 28 11 16 3,873 26
SG&A 307 266 423 318 443 39 44 31 1,447 11
EBITDA 399 344 1,257 311 325 4 (19) 11 3,002 27
Interest expense 305 263 289 281 280 (0) (8) 26 1,066 (4)
Other income 244 557 149 411 300 (27) 23 27 1,091 (16)
Equity income 485 107 762 -50 100 (302) (79) 9 1,163 (4)
Minorities interest (reverse) 133 80 105 55 0 (100) (100) 0 533 56
Net profit (loss) 542 429 1,454 135 181 34 (67) 7 2,763 9
Normalised profit (loss) 542 429 1,454 135 181 34 (67) 7 2,763 9
Reported EPS (THB) 0.04 0.03 0.10 0.01 0.01 40 (65) 7 0.18 9
Key Ratios (%) (%) (%) (%) (%)
(%)
Gross margin 44.8 48.6 41.8 46.0 44.6
37.3
SG&A to sales 24.6 28.1 11.6 30.5 32.0
13.9
EBITDA margin 32.0 36.4 34.5 29.8 23.5
28.9
Net margin 43.5 45.3 39.9 12.9 13.1
26.6
Sources: WHA; FSSIA estimates

WHA Corporation WHA TB Karun Intrachai
14 FINANSIA
Initiate with BUY; TP of THB4.4
We initiate coverage on WHA with a BUY rating and a SoTP-based TP of THB4.4,
comprising 1) the net asset value (NAV) of the currently developed land and raw land
in Thailand and Vietnam; 2) the NAV of occupied and available for lease areas and
raw land for development for the logistics business; 3) the NPV of the rental and
utilities businesses (7.2% WACC and 3% terminal growth); 4) a fair value for its 70%
stake in Wha Utilities and Power PCL (WHAUP, HOLD, TP THB4.5); and 5) the
market value for the equity stakes of its investments. We think WHA is attractive as it
is trading at 14.4x 2022E P/E or at almost -1.0SD of its 5-year average of 17.8x, and
we expect its net profit growth outlook to drive its share price in the next 12 months.
Exhibit 31: SoTP valuation
Net Asset Value (NAV) Area Selling price Total value
(rai) (THB m/unit) (THB m)
IE Land value
Development land (Thailand) 5,800 4.0 20,446
Raw land (Thailand)* 4,183 2.2 9,202
Development land (Vietnam) 2,041 2.0 4,040
Raw land (Vietnam)* 14,400 0.4 5,760
Rental properties Area Selling price Total value
(sqm) (THB m/unit) (THB m)
Pre-leased and occupied area 403,966 31,000 12,523
Available area for lease 116,874 31,000 3,623
Land for development 572,000 18,000 10,296
Management fee and others @ 7.2% WACC and 3% terminal growth 19,366
Investment Equity stake No. of shares Market/TP Total value
(%) (m shares) (THB) (THB m)
WHAUP 70 3,825 4.5 12,049
HPF 23 470 4.6 496
WHART 15 2,777 14.0 5,832
WHABT 15 202 8.9 270
HREIT 15 840 8.7 1,096
Total
19,742
NAV
(THB b)
IE land
39.45
Rental properties
45.81
Investment
19.74
Less: net debt
(39)
Total value
66
No. of shares (m share)
14,947
Value/share (THB)
4.4
* We valued raw land by applying net of cost assuming 1) THB1.0m/rai land cost in Thailand; 2) no land cost in Vietnam and THB0.3m/rai relocation cost assuming it cannot be reclaimed
from the government; 3) THB0.8/rai development cost; and 4) a 50% discount applied to Vietnam raw land.
Source: FSSIA estimates

WHA Corporation WHA TB Karun Intrachai
15 FINANSIA
Exhibit 32: Rolling one-year forward P/E band Exhibit 33: Rolling one-year forward P/BV band
Sources: Bloomberg; FSSIA
Sources: Bloomberg; FSSIA
Exhibit 34: Peers comparison as of 28 June 2021
Company BBG Rec Share Target Up Market 3Y
EPS ----- PE ---- ---- ROE --- ---- PBV --- - EV/EBITDA -
Price price side Cap CAGR 21E 22E 21E 22E 21E 22E 21E 22E
(LCY) (LCY) (%) (USD m) (%) (x) (x) (%) (%) (x) (x) (x) (x)
WHA Corp WHA TB BUY 3.22 4.4 37 1,506 14.4 17.4 14.4 9.8 11.7 1.8 1.6 22.2 18.7
Amata Corp AMATA TB NA 18.6 n/a n/a 665 16.2 16.3 12.5 7.7 9.5 1.2 1.1 19.6 14.6
Rojna Industrial Park ROJNA TB NA 6.85 n/a n/a 435 1.3 17.0 15.1 4.3 5.0 1.0 0.9 9.7 9.5
Frasers Property Thailand FPT TB NA 12.6 n/a n/a 913 16.4 16.6 14.1 5.4 6.1 0.9 0.8 22.5 20.4
Thailand avg
3,519 14.2 16.8 14.0 6.8 8.1 1.2 1.1 18.5 15.8
Sources: Bloomberg; FSSIA estimates
5
10
15
20
25
30
2016
2017
2018
2019
2020
2021
WHA PER (x)
std +2 = 24.8x
std +1 = 21.3x
5Y-avg = 17.8x
std -1 = 14.2x
std -2 = 10.7x
1.0
1.2
1.4
1.6
1.8
2.0
2.2
2.4
2.6
2.8
2016
2017
2018
2019
2020
2021
WHA PBV (x)
std +2 = 2.5x
std +1 = 2.2x
5Y-avg = 1.9x
std -1 = 1.6x
std -2 = 1.4x

WHA Corporation WHA TB Karun Intrachai
16 FINANSIA
Corporate Governance - WHA
Board structure
Number of Independent Directors (ID) 5 of 12 board members in 2020 and 8 of 11 board members in 2021
Percentage of IDs on the board . % in , and . % upon AGM‟s approval on Apr and Board‟s approval on May 2021
ID participation/attendance at board meetings 100%
ID participation in audit/remuneration committees 4/4 in audit committee and 2/3 in remuneration committee
ID terms (years of service, re-election/replacement procedures) No more than 9 consecutive years and at least one independent director shall be a female
Source: WHA
Additional comments: 1) The Board of Directors is authorized to amend the definition of the qualifications of the independent directors
in order to comply with the rules and regulations of the Securities and Exchange Commission, Capital Market Supervisory Board, and/or other
related laws; 2) Chairman of the Board of Directors is also Chairman of the Executive Committee and Group Chief Executive Director.
Audit Practices
Auditor PricewaterhouseCoopers ABAS Ltd.
Length of service More than 10 years
Reporting incidents None
Fee track record THB 18.69m in 2020, THB 15.63m in 2019, and THB15.16m in 2018
Policy on change of audit firm To review every 3 years
Source: WHA
Additional comments: None
Compensation and remuneration
Directors' remuneration vs earnings/ROE/share performance In 2020, THB 24.3m vs net profit of THB 2,524m
Changes/stability in senior management Two new independent directors appointed in 2020; four new independent directors appointed in 2021
Incidents of termination of senior management None
Track record on insider sales None
Source: WHA
Additional comments: None
Shareholders' rights
Communication - shareholder participation in AGMs/EGMs AGM annually / EGM when appropriate
Related party transactions Audit committee will consider related party transactions or transactions with likely conflicts of interest and ensure that they are conducted in accordance with the law and regulations of the SET and ensure that such transactions are reasonable and in the best interest of the Company
Voting issues - policies, incidents of rejected proposals None
Source: WHA
Additional comments: AGM held on 26 Apr 2021, at Grand Ballroom, 3rd Floor, Golden Tulip Sovereign Hotel, No. 92, Rama 9 Road,
Bang Kapi Sub-district, Huay Kwang District, Bangkok, during intensified Covid-19 outbreak fixed seating capacity of the meeting room at 50
to comply with the Regulation issued under Section 9 of the Emergency Decree on Public Administration in Emergency Situation, B.E. 2548
(No. 20) which prohibits the holding of activity with over 50-persons gathering seats only. Shareholders being unable to attend the meeting in
person requested to grant a proxy to the independent directors of the Company.

WHA Corporation WHA TB Karun Intrachai
17 FINANSIA
Financial Statements WHA Corp
Profit and Loss (THB m) Year Ending Dec 2019 2020 2021E 2022E 2023E
Revenue 10,463 6,914 10,377 10,207 11,446
Cost of goods sold (5,941) (3,249) (5,928) (5,021) (5,629)
Gross profit 4,522 3,665 4,449 5,186 5,817
Other operating income 977 1,284 1,091 1,146 1,203
Operating costs (1,731) (1,304) (1,447) (1,431) (1,485)
Operating EBITDA 3,768 3,645 4,093 4,901 5,535
Depreciation (460) (592) (576) (606) (630)
Goodwill amortisation 0 0 0 0 0
Operating EBIT 3,308 3,053 3,518 4,295 4,905
Net financing costs (986) (1,104) (1,066) (1,088) (1,150)
Associates 1,946 1,209 1,163 1,242 1,326
Recurring non-operating income 1,946 1,209 1,163 1,242 1,326
Non-recurring items 0 0 0 0 0
Profit before tax 4,268 3,158 3,615 4,450 5,081
Tax (305) (293) (319) (417) (488)
Profit after tax 3,963 2,865 3,296 4,033 4,593
Minority interests (733) (341) (533) (698) (817)
Preferred dividends 0 0 0 0 0
Other items 0 0 0 0 0
Reported net profit 3,229 2,524 2,763 3,335 3,776
Non-recurring items & goodwill (net) 0 0 0 0 0
Recurring net profit 3,229 2,524 2,763 3,335 3,776
Per share (THB)
Recurring EPS * 0.22 0.17 0.18 0.22 0.25
Reported EPS 0.22 0.17 0.18 0.22 0.25
DPS 0.13 0.14 0.11 0.13 0.15
Diluted shares (used to calculate per share data) 14,947 14,947 14,947 14,947 14,947
Growth
Revenue (%) 24.4 (33.9) 50.1 (1.6) 12.1
Operating EBITDA (%) 12.9 (3.3) 12.3 19.7 12.9
Operating EBIT (%) 16.5 (7.7) 15.2 22.1 14.2
Recurring EPS (%) 6.5 (21.8) 9.5 20.7 13.2
Reported EPS (%) 6.5 (21.8) 9.5 20.7 13.2
Operating performance
Gross margin inc. depreciation (%) 38.8 44.4 37.3 44.9 45.3
Gross margin of key business (%) - - - - -
Operating EBITDA margin (%) 36.0 52.7 39.4 48.0 48.4
Operating EBIT margin (%) 31.6 44.1 33.9 42.1 42.9
Net margin (%) 30.9 36.5 26.6 32.7 33.0
Effective tax rate (%) 3.7 4.6 4.5 4.5 4.5
Dividend payout on recurring profit (%) 61.5 81.1 60.0 60.0 60.0
Interest cover (X) 5.3 3.9 4.4 5.1 5.4
Inventory days 803.4 1,427.6 811.6 996.6 889.6
Debtor days 23.2 36.5 16.6 19.5 21.4
Creditor days 188.6 333.6 162.6 203.6 187.7
Operating ROIC (%) 18.3 15.8 17.5 21.3 24.6
ROIC (%) 6.2 4.8 5.4 6.2 6.7
ROE (%) 11.4 8.7 9.8 11.7 12.3
ROA (%) 6.0 4.6 5.2 6.0 6.4
* Pre-exceptional, pre-goodwill and fully diluted
Revenue by Division (THB m) 2019 2020 2021E 2022E 2023E
Rental 1,658 1,842 1,897 2,030 2,172
Land sales 7,156 3,535 6,881 6,482 7,477
Utilities 1,648 1,537 1,599 1,695 1,796
Sources: WHA Corp; FSSIA estimates

WHA Corporation WHA TB Karun Intrachai
18 FINANSIA
Financial Statements WHA Corp
Cash Flow (THB m) Year Ending Dec 2019 2020 2021E 2022E 2023E
Recurring net profit 3,229 2,524 2,763 3,335 3,776
Depreciation 460 592 576 606 630
Associates & minorities - - - - -
Other non-cash items (1,137) (869) 533 698 817
Change in working capital (505) 379 1,489 91 (292)
Cash flow from operations 2,047 2,626 5,361 4,730 4,931
Capex - maintenance - - - - -
Capex - new investment (3,367) (1,802) (2,332) (3,148) (3,463)
Net acquisitions & disposals (1,035) 273 (177) (201) (446)
Other investments (net) - - - - -
Cash flow from investing (4,401) (1,528) (2,509) (3,350) (3,909)
Dividends paid (2,868) (1,733) (1,216) (1,334) (1,510)
Equity finance 1,898 1 (2,875) 0 0
Debt finance 2,965 2,042 (608) 1,305 1,198
Other financing cash flows 0 (293) (124) 61 62
Cash flow from financing 1,995 17 (4,823) 32 (251)
Non-recurring cash flows - - - - -
Other adjustments 0 0 0 0 0
Net other adjustments (132) (1) 0 0 0
Movement in cash (491) 1,114 (1,971) 1,412 771
Free cash flow to firm (FCFF) (1,367.89) 2,209.90 3,918.24 2,467.32 2,171.93
Free cash flow to equity (FCFE) 478.39 2,846.18 2,120.01 2,745.97 2,280.93
Per share (THB)
FCFF per share (0.09) 0.15 0.26 0.17 0.15
FCFE per share 0.03 0.19 0.14 0.18 0.15 Recurring cash flow per share 0.17 0.15 0.26 0.31 0.35
Balance Sheet (THB m) Year Ending Dec 2019 2020 2021E 2022E 2023E
Tangible fixed assets (gross) 8,096 9,673 9,723 9,773 10,073
Less: Accumulated depreciation (2,737) (3,111) (3,561) (4,015) (4,499)
Tangible fixed assets (net) 5,359 6,561 6,162 5,758 5,574
Intangible fixed assets (net) 17,575 17,575 17,575 17,575 17,575
Long-term financial assets 10,323 11,970 9,402 9,382 9,423
Invest. in associates & subsidiaries 531 40 44 48 52
Cash & equivalents 2,681 3,794 1,824 3,236 4,006
A/C receivable 921 461 482 609 731
Inventories 12,789 12,626 13,738 13,681 13,756
Other current assets 441 441 521 573 630
Current assets 16,831 17,323 16,564 18,098 19,123
Other assets 31,646 29,153 31,485 34,633 38,097
Total assets 82,264 82,621 81,231 85,494 89,843
Common equity 29,478 28,805 27,477 29,478 31,744
Minorities etc. 3,623 3,362 3,895 4,593 5,410
Total shareholders' equity 33,101 32,167 31,372 34,071 37,153
Long term debt 25,154 29,533 30,123 31,178 31,988
Other long-term liabilities 6,172 6,214 6,090 6,151 6,212
Long-term liabilities 31,326 35,747 36,213 37,328 38,200
A/C payable 3,362 2,577 2,705 2,895 2,895
Short term debt 14,070 11,721 10,522 10,773 11,161
Other current liabilities 405 410 418 426 435
Current liabilities 17,837 14,707 13,645 14,094 14,490
Total liabilities and shareholders' equity 82,264 82,621 81,231 85,494 89,843
Net working capital 10,383 10,542 11,617 11,541 11,788
Invested capital 75,816 75,840 76,284 78,937 82,508
* Includes convertibles and preferred stock which is being treated as debt
Per share (THB)
Book value per share 1.97 1.93 1.84 1.97 2.12
Tangible book value per share 0.80 0.75 0.66 0.80 0.95
Financial strength
Net debt/equity (%) 110.4 116.5 123.7 113.6 105.4
Net debt/total assets (%) 44.4 45.3 47.8 45.3 43.6
Current ratio (x) 0.9 1.2 1.2 1.3 1.3
CF interest cover (x) 4.9 5.2 5.2 6.4 6.0
Valuation 2019 2020 2021E 2022E 2023E
Recurring P/E (x) * 14.9 19.1 17.4 14.4 12.7
Recurring P/E @ target price (x) * 20.4 26.1 23.8 19.7 17.4
Reported P/E (x) 14.9 19.1 17.4 14.4 12.7
Dividend yield (%) 4.1 4.3 3.4 4.2 4.7
Price/book (x) 1.6 1.7 1.8 1.6 1.5
Price/tangible book (x) 4.0 4.3 4.9 4.0 3.4
EV/EBITDA (x) ** 23.4 24.4 22.2 18.7 16.7
EV/EBITDA @ target price (x) ** 28.1 29.2 26.5 22.3 19.9
EV/invested capital (x) 1.2 1.2 1.2 1.2 1.1
* Pre-exceptional, pre-goodwill and fully diluted ** EBITDA includes associate income and recurring non-operating income
Sources: WHA Corp; FSSIA estimates

WHA Corporation WHA TB Karun Intrachai
19 FINANSIA
Corporate Governance report of Thai listed companies 2020
EXCELLENT LEVEL
AAV ADVANC AF AIRA AKP AKR ALT AMA AMATA AMATAV ANAN
AOT AP ARIP ARROW ASP BAFS BANPU BAY BCP BCPG BDMS
BEC BEM BGRIM BIZ BKI BLA BOL BPP BRR BTS BWG
CENTEL CFRESH CHEWA CHO CIMBT CK CKP CM CNT COL COMAN
COTTO CPALL CPF CPI CPN CSS DELTA DEMCO DRT DTAC DTC
DV8 EA EASTW ECF ECL EGCO EPG ETE FNS FPI FPT
FSMART GBX GC GCAP GEL GFPT GGC GPSC GRAMMY GUNKUL HANA
HARN HMPRO ICC ICHI III ILINK INTUCH IRPC IVL JKN JSP
JWD K KBANK KCE KKP KSL KTB KTC LANNA LH LHFG
LIT LPN MAKRO MALEE MBK MBKET MC MCOT METCO MFEC MINT
MONO MOONG MSC MTC NCH NCL NEP NKI NOBLE NSI NVD
NYT OISHI ORI OTO PAP PCSGH PDJ PG PHOL PLANB PLANET
PLAT PORT PPS PR9 PREB PRG PRM PSH PSL PTG PTT
PTTEP PTTGC PYLON Q-CON QH QTC RATCH RS S S & J SAAM
SABINA SAMART SAMTEL SAT SC SCB SCC SCCC SCG SCN SDC
SEAFCO SEAOIL SE-ED SELIC SENA SIRI SIS SITHAI SMK SMPC SNC
SONIC SORKON SPALI SPI SPRC SPVI SSSC SST STA SUSCO SUTHA
SVI SYMC SYNTEC TACC TASCO TCAP TFMAMA THANA THANI THCOM THG
THIP THRE THREL TIP TIPCO TISCO TK TKT TMB TMILL TNDT
TNL TOA TOP TPBI TQM TRC TSC TSR TSTE TSTH TTA
TTCL TTW TU TVD TVI TVO TWPC U UAC UBIS UV
VGI VIH WACOAL WAVE WHA WHAUP WICE WINNER TRUE
VERY GOOD LEVEL
2S ABM ACE ACG ADB AEC AEONTS AGE AH AHC AIT
ALLA AMANAH AMARIN APCO APCS APURE AQUA ASAP ASEFA ASIA ASIAN
ASIMAR ASK ASN ATP30 AUCT AWC AYUD B BA BAM BBL
BFIT BGC BJC BJCHI BROOK BTW CBG CEN CGH CHARAN CHAYO
CHG CHOTI CHOW CI CIG CMC COLOR COM7 CPL CRC CRD
CSC CSP CWT DCC DCON DDD DOD DOHOME EASON EE ERW
ESTAR FE FLOYD FN FORTH FSS FTE FVC GENCO GJS GL
GLAND GLOBAL GLOCON GPI GULF GYT HPT HTC ICN IFS ILM
IMH INET INSURE IRC IRCP IT ITD ITEL J JAS JCK
JCKH JMART JMT KBS KCAR KGI KIAT KOOL KTIS KWC KWM
L&E LALIN LDC LHK LOXLEY LPH LRH LST M MACO MAJOR
MBAX MEGA META MFC MGT MILL MITSIB MK MODERN MTI MVP
NETBAY NEX NINE NTV NWR OCC OGC OSP PATO PB PDG
PDI PICO PIMO PJW PL PM PPP PRIN PRINC PSTC PT
QLT RCL RICHY RML RPC RWI S11 SALEE SAMCO SANKO SAPPE
SAWAD SCI SCP SE SEG SFP SGF SHR SIAM SINGER SKE
SKR SKY SMIT SMT SNP SPA SPC SPCG SR SRICHA SSC
SSF STANLY STI STPI SUC SUN SYNEX T TAE TAKUNI TBSP
TCC TCMC TEAM TEAMG TFG TIGER TITLE TKN TKS TM TMC
TMD TMI TMT TNITY TNP TNR TOG TPA TPAC TPCORP TPOLY
TPS TRITN TRT TRU TSE TVT TWP UEC UMI UOBKH UP
UPF UPOIC UT UTP UWC VL VNT VPO WIIK WP XO
YUASA ZEN ZIGA ZMICO
GOOD LEVEL
7UP A ABICO AJ ALL ALUCON AMC APP ARIN AS AU
B52 BC BCH BEAUTY BGT BH BIG BKD BLAND BM BR
BROCK BSBM BSM BTNC CAZ CCP CGD CITY CMAN CMO CMR
CPT CPW CRANE CSR D EKH EP ESSO FMT GIFT GREEN
GSC GTB HTECH HUMAN IHL INOX INSET IP JTS JUBILE KASET
KCM KKC KUMWEL KUN KWG KYE LEE MATCH MATI M-CHAI MCS
MDX MJD MM MORE NC NDR NER NFC NNCL NPK NUSA
OCEAN PAF PF PK PLE PMTA POST PPM PRAKIT PRECHA PRIME
PROUD PTL RBF RCI RJH ROJNA RP RPH RSP SF SFLEX
SGP SISB SKN SLP SMART SOLAR SPG SQ SSP STARK STC
SUPER SVOA TC TCCC THMUI TIW TNH TOPP TPCH TPIPP TPLAS
TTI TYCN UKEM UMS VCOM VRANDA WIN WORK WPH
Description Score Range
Excellent 90-100
Very Good 80-89
Good 70-79
Disclaimer:
The disclosure of the survey results of the Thai Institute of Directors Association („IOD”) regarding corporate governance is made pursuant to the policy of the Office of the Securities and Exchange Commission. The survey of the IOD is based on the information of a company listed on the Stock Exchange of Thailand and the Market for Alternative Investment disclosed to the public and able to be accessed by a general public investor. The result, therefore, is from the perspective of a third party. It is not an evaluation of operation and is not based on inside information. The survey result is as of the date appearing in the Corporate Governance Report of Thai Listed Companies. As a result, the survey results may be changed after that date. FSS International Investment Advisory Company Limited does not confirm nor certify the accuracy of such survey results. * CGR scoring should be considered with news regarding wrong doing of the company or director or executive of the company such unfair practice on securities trading, fraud, and corruption SEC imposed a civil sanction against insider trading of director and executive; ** delisted Source: Thai Institute of Directors Association (IOD); FSSIA‟s compilation

WHA Corporation WHA TB Karun Intrachai
20 FINANSIA
Anti-corruption Progress Indicator 2020
CERTIFIED
2S ADVANC AI AIE AIRA AKP AMA AMANAH AP AQUA ARROW
ASK ASP AYUD B BAFS BANPU BAY BBL BCH BCP BCPG
BGC BGRIM BJCHI BKI BLA BPP BROOK BRR BSBM BTS BWG
CEN CENTEL CFRESH CGH CHEWA CHOTI CHOW CIG CIMBT CM CMC
COL COM7 CPALL CPF CPI CPN CSC DCC DELTA DEMCO DIMET
DRT DTAC DTC EASTW ECL EGCO FE FNS FPI FPT FSS
FTE GBX GC GCAP GEL GFPT GGC GJS GPSC GSTEEL GUNKUL
HANA HARN HMPRO HTC ICC ICHI IFS INET INSURE INTUCH IRPC
ITEL IVL K KASET KBANK KBS KCAR KCE KGI KKP KSL
KTB KTC KWC L&E LANNA LHFG LHK LPN LRH M MAKRO
MALEE MBAX MBK MBKET MC MCOT MFC MFEC MINT MONO MOONG
MPG MSC MTC MTI NBC NEP NINE NKI NMG NNCL NSI
NWR OCC OCEAN OGC ORI PAP PATO PB PCSGH PDG PDI
PDJ PE PG PHOL PL PLANB PLANET PLAT PM PPP PPPM
PPS PREB PRG PRINC PRM PSH PSL PSTC PT PTG PTT
PTTEP PTTGC PYLON Q-CON QH QLT QTC RATCH RML RWI S & J
SABINA SAT SC SCB SCC SCCC SCG SCN SEAOIL SE-ED SELIC
SENA SGP SIRI SITHAI SMIT SMK SMPC SNC SNP SORKON SPACK
SPC SPI SPRC SRICHA SSF SSSC SST STA SUSCO SVI SYNTEC
TAE TAKUNI TASCO TBSP TCAP TCMC TFG TFI TFMAMA THANI THCOM
THIP THRE THREL TIP TIPCO TISCO TKT TMB TMD TMILL TMT
TNITY TNL TNP TNR TOG TOP TPA TPCORP TPP TRU TSC
TSTH TTCL TU TVD TVI TVO TWPC U UBIS UEC UKEM
UOBKH UWC VGI VIH VNT WACOAL WHA WHAUP WICE WIIK XO
ZEN TRUE
DECLARED
7UP ABICO AF ALT AMARIN AMATA AMATAV ANAN APURE B52 BKD
BM BROCK BUI CHO CI COTTO DDD EA EFORL EP ERW
ESTAR ETE EVER FSMART GPI ILINK IRC J JKN JMART JMT
JSP JTS KWG LDC MAJOR META NCL NOBLE NOK PK PLE
ROJNA SAAM SAPPE SCI SE SHANG SINGER SKR SPALI SSP STANLY
SUPER SYNEX THAI TKS TOPP TRITN TTA UPF UV WIN ZIGA
Level
Certified This level indicates practical participation with thoroughly examination in relation to the recommended procedures from the audit committee or the SEC‟s certified auditor, being a certified member of Thailand's Private Sector Collective Action Coalition Against Corruption programme (Thai CAC) or already passed examination to ensure independence from external parties.
Declared This level indicates determination to participate in the Thailand's Private Sector Collective Action Coalition Against Corruption programme (Thai CAC)
Disclaimer: The disclosure of the Anti-Corruption Progress Indicators of a listed company on the Stock Exchange of Thailand, which is assessed by Thaipat Institute, is made in order to comply with the policy and sustainable development plan for the listed companies of th e Office of the Securities and Exchange Commission. Thaipat Institute made this assessment based on the information received from the listed company, as stipulated in the form for the assessment of Anti-corruption which refers to the Annual Registration Statement (Form 56-1), Annual Report (Form 56-2), or other relevant documents or reports of such listed company . The assessment result is therefore made from the perspective of Thaipat Institute that is a third party. It is not an assessment of operation and is not based on any inside information. Since this assessment is only the assessment result as of the date appearing in the assessment result, it may be changed after that date or when there is any change to the relevant information. Nevertheless, FSS International Investment Advisory Company Limited does not confirm, verify, or certify the accuracy and completeness of the assessment results.
Note: Companies participating in Thailand's Private Sector Collective Action Coalition Against Corruption programme (Thai CAC) under Thai Institute of Directors (as of June 24, 2019) are categorised into: 1) companies that have declared their intention to join CAC, and; 2) companies certified by CAC. Source: The Securities and Exchange Commission, Thailand; * FSSIA‟s compilation

WHA Corporation WHA TB Karun Intrachai
21 FINANSIA
GENERAL DISCLAIMER
ANALYST(S) CERTIFICATION
Karun Intrachai FSS International Investment Advisory Securities Co., Ltd
The individual(s) identified above certify(ies) that (i) all views expressed in this report accurately reflect the personal view of the analyst(s) with regard to
any and all of the subject securities, companies or issuers mentioned in this report; and (ii) no part of the compensation of the analyst(s) was, is, or will
be, directly or indirectly, related to the specific recommendations or views expressed herein.
This report has been prepared by FSS International Investment Advisory Company Limited (FSSIA). The information herein has been obtained from
sources believed to be reliable and accurate; however FSS makes no representation as to the accuracy and completeness of such information.
Information and opinions expressed herein are subject to change without notice. FSS has no intention to solicit investors to buy or sell any security in
this report. In addition, FSS does not guarantee returns nor price of the securities described in the report nor accept any liability for any loss or damage
of any kind arising out of the use of such information or opinions in this report. Investors should study this report carefully in making investment
decisions. All rights are reserved.
This report may not be reproduced, distributed or published by any person in any manner for any purpose without permission of FSSIA. Investment in
securities has risks. Investors are advised to consider carefully before making investment decisions.
History of change in investment rating and/or target price
WHA Utilities & Power (WHAUP TB)
Date Rating Target price Date Rating Target price Date Rating Target price
15-Nov-2018 17-Mar-2020
BUY BUY
6.80 5.20
15-May-2020 02-Apr-2021
BUY HOLD
5.20 4.50
- - -
Suwat Sinsadok started covering this stock from 15-Nov-2018
Price and TP are in local currency
Source: FSSIA estimates
Company Ticker Price Rating Valuation & Risks
WHA Corp WHA TB THB 3.22 BUY Downside risks to our SoTP-derived TP include 1) lower-than-expected IE land sales and transfers in Thailand and Vietnam; and 2) a lower-than-expected utilization rate from the utilities business in Vietnam.
WHA Utilities & Power WHAUP TB THB 4.28 HOLD Downside risks to our SoTP-based TP include 1) lower-than-expected demand for electricity in Thailand; and 2) lower crude prices. Upside risks are the higher than expected sales volumes of water and electricity for industrial users.
Source: FSSIA estimates
Additional Disclosures
Target price history, stock price charts, valuation and risk details, and equity rating histories applicable to each company rated in this report is available
in our most recently published reports. You can contact the analyst named on the front of this note or your representative at Finansia Syrus Securities
Public Company Limited
FSSIA may incorporate the recommendations and target prices of companies currently covered by FSS Research into equity research reports, denoted
by an „FSS‟ before the recommendation. FSS Research is part of Finansia Syrus Securities Public Company Limited, which is the parent company of
FSSIA.
All share prices are as at market close on 28-Jun-2021 unless otherwise stated.
3
4
5
6
7
8
ก.ค.- ก.ย.- พ.ย.- ม.ค.- ม.ีค.- พ.ค.- ก.ค.- ก.ย.- พ.ย.- ม.ค.- มี.ค.- พ.ค.- ก.ค.- ก.ย.- พ.ย.- ม.ค.- ม.ีค.- พ.ค.-
(THB) WHA Utilities & Power Target Price (BNPP/FSSIA) Target Price (FSSIA - from 1 Jul 2020)
Jun-18 Dec-18 Jun-19 Dec-19 Jun-20 Dec-20 Jun-21

WHA Corporation WHA TB Karun Intrachai
22 FINANSIA
RECOMMENDATION STRUCTURE
Stock ratings
Stock ratings are based on absolute upside or downside, which we define as (target price* - current price) / current price.
BUY (B). The upside is 10% or more.
HOLD (H). The upside or downside is less than 10%.
REDUCE (R). The downside is 10% or more.
Unless otherwise specified, these recommendations are set with a 12-month horizon. Thus, it is possible that future price volatility may cause a
temporary mismatch between upside/downside for a stock based on market price and the formal recommendation.
* In most cases, the target price will equal the analyst's assessment of the current fair value of the stock. However, if the analyst doesn't think the market
will reassess the stock over the specified time horizon due to a lack of events or catalysts, then the target price may differ from fair value. In most cases,
therefore, our recommendation is an assessment of the mismatch between current market price and our assessment of current fair value.
Industry Recommendations
Overweight. The analyst expects the fundamental conditions of the sector to be positive over the next 12 months.
Neutral. The analyst expects the fundamental conditions of the sector to be maintained over the next 12 months.
Underweight. The analyst expects the fundamental conditions of the sector to be negative over the next 12 months.
Country (Strategy) Recommendations
Overweight (O). Over the next 12 months, the analyst expects the market to score positively on two or more of the criteria used to determine market
recommendations: index returns relative to the regional benchmark, index sharpe ratio relative to the regional benchmark and index returns relative to
the market cost of equity.
Neutral (N). Over the next 12 months, the analyst expects the market to score positively on one of the criteria used to determine market
recommendations: index returns relative to the regional benchmark, index sharpe ratio relative to the regional benchmark and index returns relative to
the market cost of equity.
Underweight (U). Over the next 12 months, the analyst does not expect the market to score positively on any of the criteria used to determine market
recommendations: index returns relative to the regional benchmark, index sharpe ratio relative to the regional benchmark and index returns relative to
the market cost of equity.