monthly equity monitor - september 2021 - bnc
TRANSCRIPT


Month to
date
Quarter to
date
Year to
date
MSCI ACWI 1.9 7.0 21.3
MSCI World 2.0 7.6 24.0
MSCI USA 1.7 8.8 25.5
MSCI Canada 3.5 9.0 28.1
MSCI Europe 2.7 6.6 23.3
MSCI Pacific ex Jp 0.9 1.5 11.3
MSCI Japan 2.3 1.0 15.9
MSCI EM 1.7 2.6 3.6
MSCI EM EMEA 1.3 3.7 26.9
MSCI EM Latin America 1.9 -1.5 -2.4
MSCI EM Asia 1.8 2.8 0.8
11/12/2021
MSCI composite index: Price Performance (Total return)
NBF Economics and Strategy (data via Refinitiv)
0
100
200
300
400
500
600
700
800
900
1,000
1,100
1,200
1,300
1,400
2020Q1 2020Q2 2020Q3 2020Q4 2021Q1 2021Q2 2021Q3 2021Q4
Canada
Israel
UK
US
Euro Zone
World: Evolution of the pandemicDaily new cases per million population by region, 7-day mov. average
NBF Economics and Strategy (data via Johns Hopkins CSSE)
New cases per million
-280
-240
-200
-160
-120
-80
-40
0
40
80
4,000
5,000
6,000
7,000
8,000
9,000
10,000
11,000
12,000
2020Q1 2020Q2 2020Q3 2020Q4 2021Q1 2021Q2 2021Q3 2021Q4
China: Negative economic surprises put a lid on commodity pricesChina CITI economic surprise index and the price of copper
NBF Economics and Strategy (data via Bloomberg and Refinitiv)
Index (daily) USD/Tonnes
Copper price
(right)
Economic surprise index
(left)
16
18
20
22
24
26
28
30
32
34
36
38
40
42
44
2006 2008 2010 2012 2014 2016 2018 2020 2022
NBF Economics and Strategy (data via Refinitiv)
World: More growth is expected for corporate earningsTrailing earnings for the MSCI ACWI and 12-month-forward expectations
EPS
-2
-1
0
1
2
3
4
5
6
7
8
9
2010 2011 2012 2013 2014 2015 2016 2017 2018 2019 2020 2021 2022
NBF Economics and Strategy (data via Fred)
U.S.: Corporations have pricing power PPI for final demand and headline CPI
% (y/y)
CPI
PPI
88
92
96
100
104
108
112
116
120
2008 2010 2012 2014 2016 2018 2020 2022
OECD: Excess demand persists for retail salesVolume retail sales
2015 = 100
62 months
4 months
NBF Economics and Strategy (data from Refinitiv)
-2
0
2
4
6
8
10
12
1999 2001 2003 2005 2007 2009 2011 2013 2015 2017 2019 2021
NBF Economics and Strategy (data via Refinitiv)
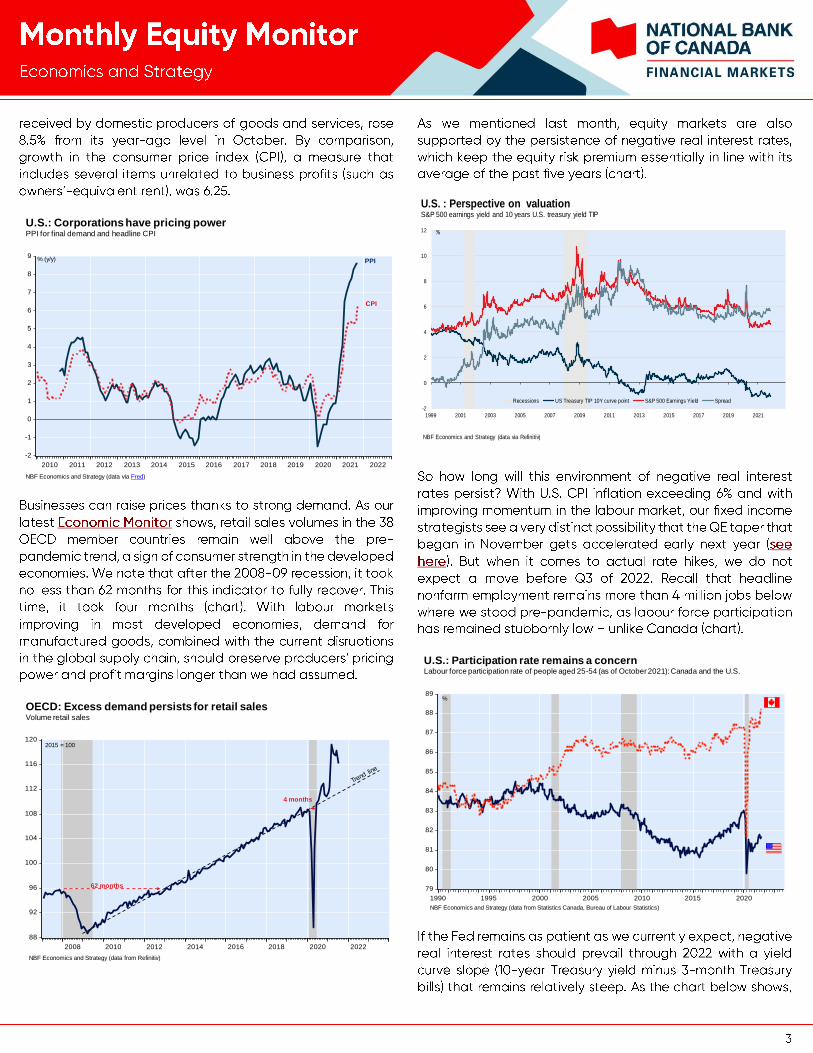
U.S. : Perspective on valuationS&P 500 earnings yield and 10 years U.S. treasury yield TIP
Recessions US Treasury TIP 10Y curve point S&P 500 Earnings Yield Spread
79
80
81
82
83
84
85
86
87
88
89
1990 1995 2000 2005 2010 2015 2020
U.S.: Participation rate remains a concernLabour force participation rate of people aged 25-54 (as of October 2021): Canada and the U.S.
NBF Economics and Strategy (data from Statistics Canada, Bureau of Labour Statistics)
%

Mature phase: Return of equities based on slope of the yield curveSlope of the U.S. yield curve during the mature phase and average 6-month return following
NBF Economics and Strategy (data via Refinitiv)
-15.0
-10.0
-5.0
0.0
5.0
10.0
15.0
<-50 bp >-50 to < 0 > 0 to < 100 >100 bp
S&P 500
S&P/TSX
%
Basis points
Month to
date
Quarter to
date
Year to
date
S&P TSX 3.5 8.7 27.7
HEALTH CARE 10.4 3.7 2.0
IT 8.8 13.3 36.1
MATERIALS 7.5 13.8 6.9
CONS. DISC. 7.2 7.1 17.7
CONS. STAP. 6.5 5.0 19.2
BANKS 3.2 9.1 36.3
FINANCIALS 2.9 8.2 35.0
TELECOM 1.8 1.7 21.1
INDUSTRIALS 1.3 10.2 22.3
REAL ESTATE 0.5 6.9 34.5
UTILITIES 0.3 0.8 6.9
ENERGY -0.5 8.2 52.4
11/12/2021
S&P/TSX composite index: Price Performance (Total return)
NBF Economics and Strategy (data via Refinitiv)
-40
-30
-20
-10
0
10
20
30
40
50
2000 2002 2004 2006 2008 2010 2012 2014 2016 2018 2020 2022
S&P/TSX: Foreigners are attracted to CanadaNet foreign purchases of Canadian equities through the first eight months of every year
$ billions
NBF Economics and Strategy (data via Statistics Canada )
-4
-2
0
2
4
6
8
10
12
14
16
18
20
22
24
26
1990 1995 2000 2005 2010 2015 2020
NBF Economics and Strategy (data via Refinitiv)
S&P/TSX: Valuation remains attractive12-month-forward P/Es for the S&P 500 and the S&P/TSX
P/E ratio
S&P/TSX
S&P 500
Differential
US−CA

600
700
800
900
1,000
1,100
1,200
1,300
1,400
2006 2008 2010 2012 2014 2016 2018 2020 2022
Canada: A bullish outlook12-month forward EPS estimates for the S&P/TSX
EPS
NBF Economics and Strategy (data via Refinitiv)
2,040,000
2,060,000
2,080,000
2,100,000
2,120,000
2,140,000
2,160,000
2,180,000
2,200,000
2,220,000
2,240,000
2,260,000
2016 2017 2018 2019 2020 2021
NBF Economics and Strategy (data via Fred)
U.S.: Global restocking activity has yet to beginReal Manufacturing and Trade inventories
USD (millions)
Benchmark
(%)
NBF
Recommendation (%)
Change (pp)
Equities
Canadian Equities 20 25
U.S. Equities 20 18
Foreign Equities (EAFE) 5 3
Emerging markets 5 5
Fixed Income 45 42
Cash 5 7
Total 100 100
NBF Economics and Strategy
NBF Asset Allocation

Actual Q42022 (Est.) Actual Q42022 (Est.)
Index Level Nov-12-21 Target Index Level Nov-12-21 Target
S&P/TSX 21,769 22,500 S&P 500 4,683 4,750
Assumptions Q42022 (Est.) Assumptions Q42022 (Est.)
Level: Earnings * 1270 1375 Level: Earnings * 197 212
Dividend 533 577 Dividend 60 64
PE Trailing (implied) 17.1 16.4 PE Trailing (implied) 23.7 22.4
Q42022 (Est.) Q42022 (Est.)
10-year Bond Yield 1.68 2.10 10-year Bond Yield 1.58 2.15
* Before extraordinary items, source Thomson * S&P operating earnings, bottom up.
NBF Economics and Strategy
NBF Market Forecast
Canada
NBF Market Forecast
United States

NBF Fundamental Sector Rotation - November 2021
Name (Sector/Industry) Recommendation S&P/TSX weight
Energy Overweight 13.0%
Energy Equipment & Services Overweight 0.0%
Oil, Gas & Consumable Fuels Overweight 13.0%
Materials Overweight 11.8%
Chemicals Market Weight 1.7%
Containers & Packaging Overweight 0.5%
Metals & Mining * Overweight 2.5%
Gold Overweight 6.5%
Paper & Forest Products Market Weight 0.5%
Industrials Market Weight 11.6%
Capital Goods Overweight 2.3%
Commercial & Professional Services Underweight 3.2%
Transportation Market Weight 6.1%
Consumer Discretionary Market Weight 3.6%
Automobiles & Components Underweight 1.1%
Consumer Durables & Apparel Overweight 0.6%
Consumer Services Market Weight 0.7%
Retailing Market Weight 1.1%
Consumer Staples Market Weight 3.6%
Food & Staples Retailing Market Weight 2.9%
Food, Beverage & Tobacco Market Weight 0.6%
Health Care Market Weight 1.0%
Health Care Equipment & Services Market Weight 0.2%
Pharmaceuticals, Biotechnology & Life Sciences Market Weight 0.8%
Financials Market Weight 31.6%
Banks Market Weight 21.2%
Diversified Financials Market Weight 4.7%
Insurance Market Weight 5.7%
Information Technology Underweight 12.0%
Telecommunication Services Market Weight 4.6%
Utilities Underweight 4.3%
Real Estate Underweight 3.0%
* Metals & Mining excluding the Gold Sub-Industry for the recommendation.

.
.
