equity in practice making city programs accessible to underrepresented groups
TRANSCRIPT
EQUITY in PRACTICEMaking City programs accessible to underrepresented groups

Presentation outlinea) History of CWSP
b) ‘Promising Equity Practices’
c) Early work
d) Program equity analysis 2012- 2013 and outcomes
e) Ongoing work and remaining challenges

History of CWSP• 1995 BES/PSU partnership incentive program: awards up to
$5,000/ watershed project (later $10,000) Award $95,000 total
• Early projects focused on stream restoration, education and monitoring. By 1999 began funding urban stormwater projects
• 2003 – 2010 Focus on geographic equity, outreach to under-represented areas and technical assistance.
• Outcomes included more geographic equity but still working with established environmental groups and schools
• In 2008 won Carter award

History of CWSP – 2008-2009 Map

Populations of Color

History of CWSP• 2010 - Encouragement from Commissioner Saltzman’s Office for
more purposeful equity component.
• Added application question about working with underserved groups, added GRA for additional technical assistance, added funds for youth stipends, more outreach to under represented areas, began working with Office of Equity and Human Rights.
• 2012 – 2014 Equity analysis by PSU graduate student Cameron Herrington. Photo credit: Patrick Philpott, Portland Commission of Disability

CWSP grants as of 2013-14 outcomes
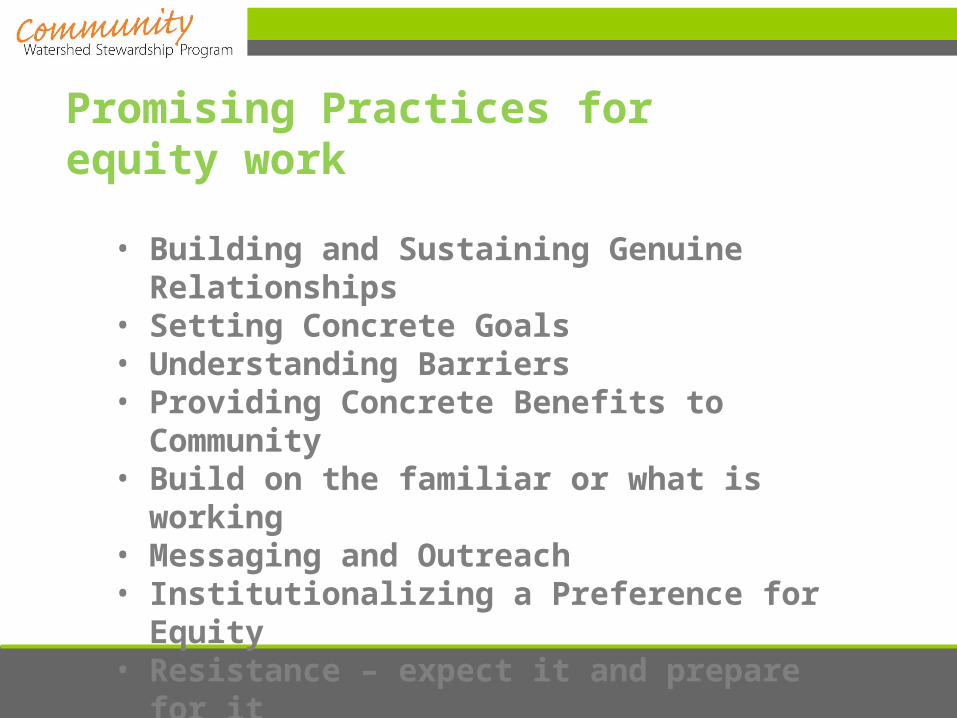
Promising Practices for equity work
• Building and Sustaining Genuine Relationships
• Setting Concrete Goals• Understanding Barriers• Providing Concrete Benefits to Community• Build on the familiar or what is working• Messaging and Outreach• Institutionalizing a Preference for Equity• Resistance – expect it and prepare for it

Promising Equity Practices
Building and Sustaining Genuine Relationships:
Worked through trusted community leader – in our case Polo Catalani from Office of Equity.
Cross trained each other on watershed health needs and community needs.

Promising Equity Practices
Providing Concrete Benefits
One element that was stressed early on, was that the community needed to perceive a real benefit from participating such as teen employment, food gardens, etc.
CWSP responded by increasing grant amount for teen youth stipends and saw early results.

Promising Equity Practices
Setting concrete goals - Assessment 2012 - 2013
VISION
Through grant funding, support leadership by underrepresented groups;
Support those groups’ efforts to address their own self-defined priorities
Promising Equity Practices
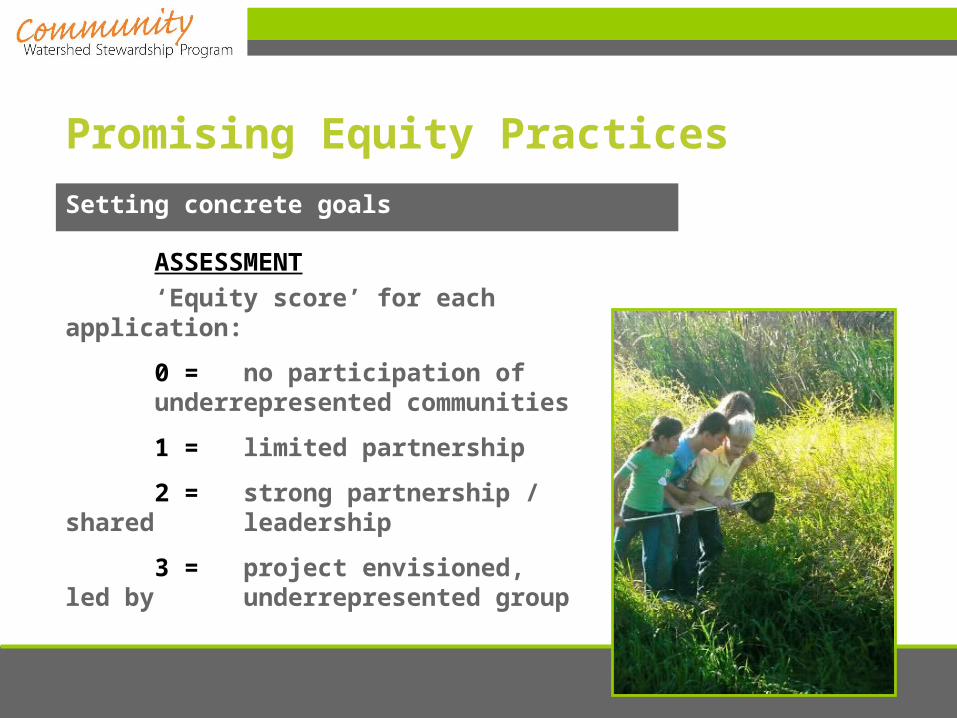
Setting concrete goals
ASSESSMENT
‘Equity score’ for each application:
0 = no participation of underrepresented
communities
1 = limited partnership
2 = strong partnership / shared leadership
3 = project envisioned, led by underrepresented group
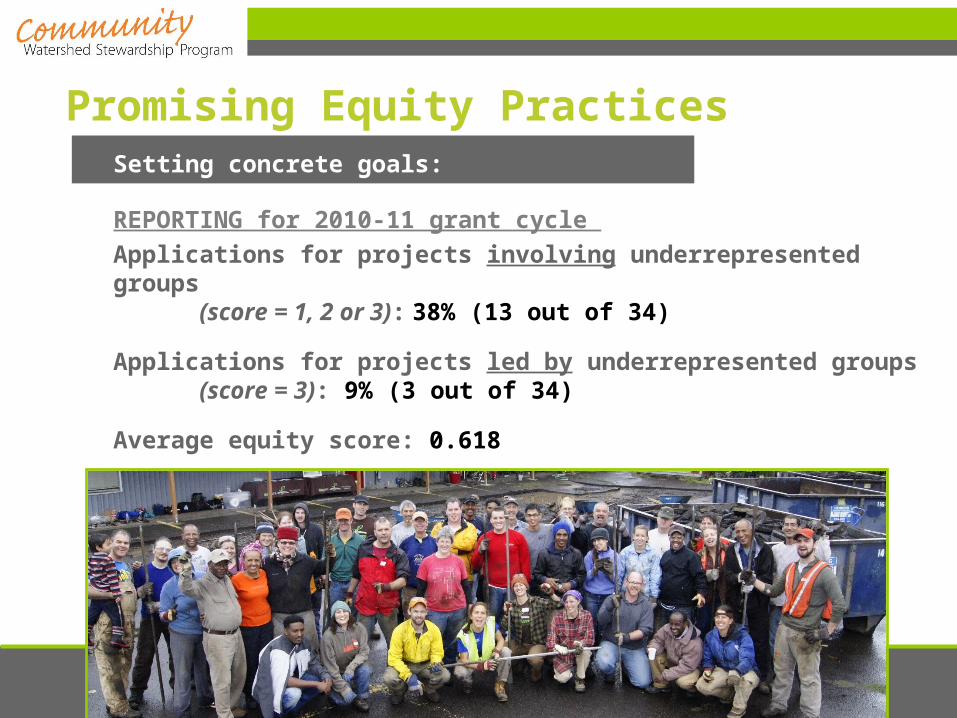
Promising Equity PracticesSetting concrete goals:
REPORTING for 2010-11 grant cycle cycle*
Applications for projects involving underrepresented groups(score = 1, 2 or 3): 38% (13 out of 34)
Applications for projects led by underrepresented groups(score = 3): 9% (3 out of 34)
Average equity score: 0.618

Promising Equity Practices
Understanding barriers to participation
PROCESS
Analysis of past applications
Talked to people!
KEY FINDING
Concept of ‘community benefit’

Promising Equity Practices
Understanding barriers to participation
BARRIERS & STRATEGIES
Restrictions on community gardens

2012-2013 application2013-2014 application

Promising Equity Practices
Understanding barriers to participation
Complexity of application and project admin: •Removed requirements about watershed plan relevance
•Offered more technical assist to first time applicants
•Moved to a 2 step process with short pre-application

Promising Equity Practices
Understanding barriers to participation
BARRIERS & STRATEGIES
Ineffective messaging and outreach
•Changed messaging to include community benefits

Promising Equity Practices
Messaging and outreach
Identified areas of overlap between community-defined priorities and CWSP’s watershed mission
Community priority Watershed project
Food, nutrition, activities for elders Community garden
Leadership and employment for youth Youth summer program
Crime and neighborhood livability Native-plant landscaping, community spaces, art
Immigrant and refugee inclusion Trainings, education
Flooding, standing water Depaving, bioswales

Promising Equity PracticesMessaging and outreach
Revamped messaging
2012-13 grant announcement e-mail
2013-14 grant announcement e-mail
Ecoroofs Neighborhood safety, health, and livability
Stormwater management facilities
Youth leadership and jobs
Naturescaping Community gardens
Stream restoration Improvements to playgrounds

Promising Equity PracticesMessaging and outreach
Revamped messaging2010 2013

Promising Equity PracticesBuild on the Familiar or What is Working
Case Studies show both community outcomes and watershed outcomes.

Promising Equity PracticesBuild on the Familiar or What is Working
Case Studies

Promising Equity PracticesBuild on the Familiar or What is Working
Case Studies

Promising Equity PracticesMessaging and outreach
Building and Sustaining Relationships
Continued to work with trusted intermediaries
Targeted outreach efforts
Photo credit: Patrick Philpott,
Portland Commission of Disability

Promising Equity PracticesSetting Concrete Goals
OUTCOMES
Applications involving underrepresented groups
2010-11: 38% (13 out of 34)
2013-14: 74% (31 out of 42)
Applications led by underrepresented groups
2010-11: 9% (3 out of 34)
2013-14: 33% (14 out of 42)
Average equity score 2010/11 = 0.62
Average equity score 2013/14 = 1.53

Promising Equity Practices
Institutionalizing a preference for equity
THREE SELECTION CRITERIA
1. Watershed health
2. Community involvement
3. Equity; leadership of
underrepresented communities

Promising Equity PracticesInstitutionalizing a preference for equity
OUTCOMES
Awards to projects involving underrepresented groups
2010-11: 33% (vs. 38% of apps)
2013-14: 100% (vs. 74% of apps)
Awards to projects led by underrepresented groups
2010-11: 7% (vs. 9% of apps)
2013-14: 67% (vs. 33% of apps)
Average equity score of awards 2010/11= 0.53
Average equity score of awards 2013/14 = 2.50
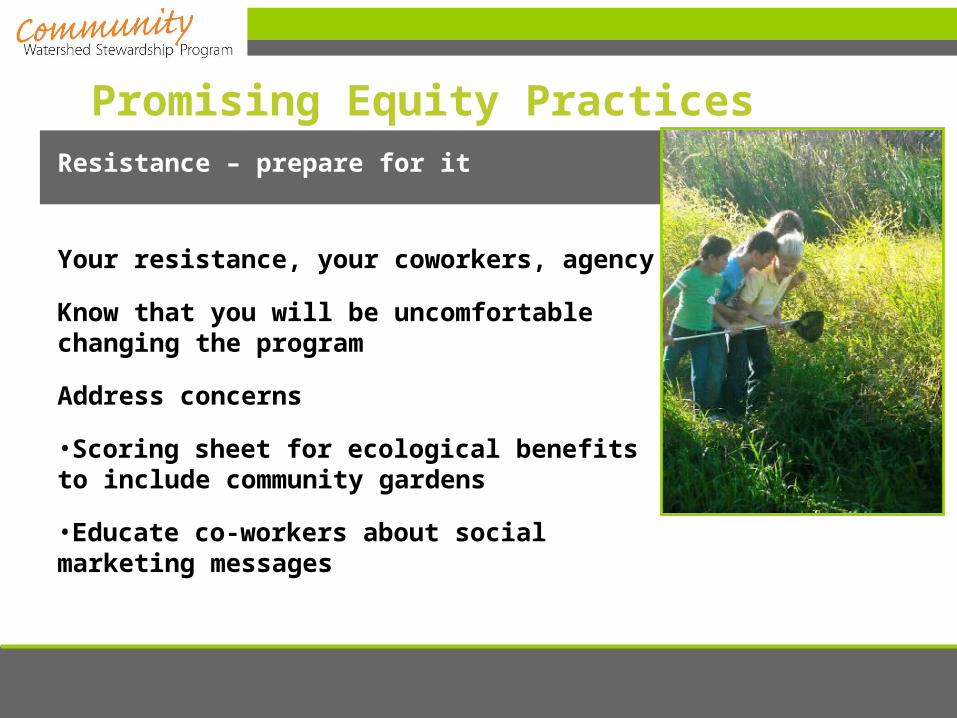
Promising Equity PracticesResistance – prepare for it
Your resistance, your coworkers, agency
Know that you will be uncomfortable changing the program
Address concerns
•Scoring sheet for ecological benefits to include community gardens
•Educate co-workers about social marketing messages

Ongoing Work and Remaining Challenges• Improve equity commitment and capacity of
dominant culture environmental groups
• Make program more accessible for less-established, less-professional groups
• Continue strong focus on equity without a dedicated staff person – institutionalizing equity work
