a profile of new york’s underrepresented minority ... · a profile of new york’s...
TRANSCRIPT
A Profile of New York’s Underrepresented Minority Physicians, 2006
Prepared by Gaetano J. Forte
Sandra L. McGinnis, PhD David P. Armstrong
Jean Moore, MS
with The Center for Health Workforce Studies
School of Public Health, University at Albany 7 University Place
Rensselaer, NY 12144-3458

2
INTRODUCTION
As the population of the United States grows increasingly diverse, there is concern about the
capacity of the health care delivery system to provide high quality health care to minority
populations (AHRQ, 2005; Gromin, et al., 2004; Brach, et al., 2002.) Research clearly
documents persistent gaps in health care and health status outcomes between non-Hispanic
Whites and racial and ethnic minorities. Blacks/African-Americans, American Indians/Alaska
Natives, and Hispanics/Latinos experience a disproportionate share of disease burden and have
poorer health outcomes than non-Hispanic Whites (AHRQ, 2005). A variety of factors are
believed to contribute to these disparities. One of these factors is a general lack of cultural
competence in health care (Collins, et al., 2002; Betancourt et al., 2002; Gromin et al., 2004).
Cultural competence in health care is defined as “the ability of systems to provide care to
patients with diverse values, beliefs and behaviors, including tailoring delivery to meet patients’
social, cultural and linguistic needs” (Betancourt et al., 2002, page v). One commonly cited
barrier to achieving cultural competence in health care is the lack of diversity within most health
professions, including the physician workforce.
A more racially and ethnically diverse physician workforce is believed to improve access to
health care services and increase the quality of care, particularly for underserved populations.
Underrepresented minority (URM) physicians are more likely than non-URM physicians to work
in settings where underserved populations commonly receive care (e.g., hospitals and clinics),
and are more likely to practice in underserved areas than non-URM physicians (Council of
Graduate Medical Education 1990; Fryer et al., 2001; Grumbach et al., 2003; AMA Physician
Masterfile, 2000). They are also more likely than other physicians to serve Medicaid-insured
populations (Cantor et al., 1996; Xu et al., 1997; Brotherton et al., 2000; Moy & Bartman, 1995;
Komaromy et al., 1996; Backus et al., 2001).
This report was prepared by the Center for Health Workforce Studies at the University at Albany
and describes the practice characteristics of New York’s underrepresented minority physicians in
2005. Data for the report were drawn from the New York State Physician Re-registration Survey,
which collects information on the state’s physicians as they renew their medical licenses on a
3
two-year cycle. For this report, data were analyzed for active patient care physicians who were
underrepresented minorities and who graduated from U.S. medical schools.
A key objective of this report is to assist state policy makers, planners, and other stakeholders to
better understand the contribution of URM physicians in meeting the health care needs of New
Yorkers. In addition to enhancing the cultural diversity of New York’s medical workforce, URM
physicians play an essential role in improving access to and quality of care for minority and
underserved populations in the state. In order to better meet the health care needs of all New
Yorkers, it may be important to consider strategies designed to create a more diverse physician
workforce by increasing the number of racial and ethnic minorities in medicine.
MINORITIES UNDERREPRESENTED IN MEDICINE
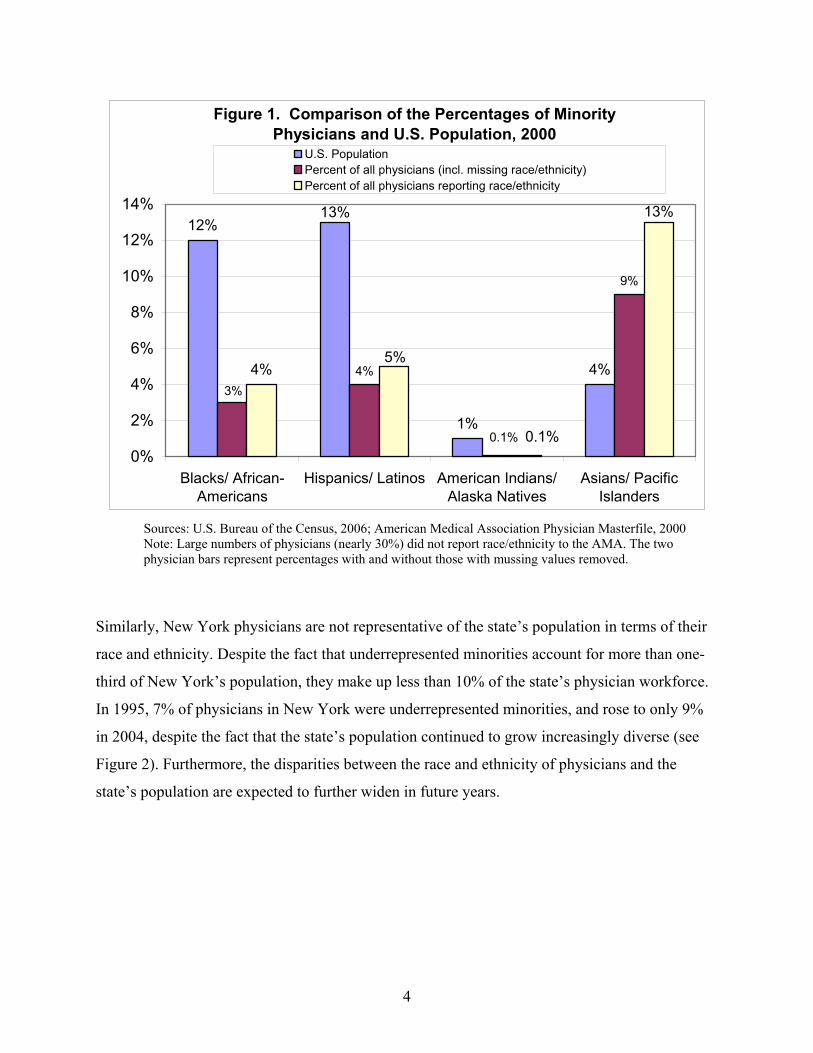
Some racial and ethnic minority groups are substantially underrepresented in the national
physician workforce. The groups that are underrepresented in medicine include Blacks/African-
Americans (3-4% of physicians versus 12% of the population), Hispanics/Latinos (4-5% of
physicians versus 13% of the population), and American Indians/Alaska Natives (0.06-0.09% of
physicians versus 1% of the population) (Figure 1). Asian/Pacific Islanders as a broad category
are not considered underrepresented in medicine (9-13% of physicians versus 4% of the
population). A small percentage of physicians (2-4%) report their race/ethnicity as “other” (2000
AMA Masterfile)1. Furthermore, it is expected that for years to come, the number of minority
physicians will continue to fall well short of “population parity” measured against their
proportion in the U.S. population.
1 Large numbers of physicians (nearly 30%) did not report race/ethnicity to the AMA. If the raw percentages are taken, 17% of physicians report a race/ethnicity other than non-Hispanic White. The percentage of those with valid race/ethnicity data (removing missing values) who report a race/ethnicity other than non-Hispanic White is 25%.
4
Figure 1. Comparison of the Percentages of Minority Physicians and U.S. Population, 2000
12%
1%
4%4%
9%
4%
13%
0.1%
3%
5%
0.1%
13%
0%
2%
4%
6%
8%
10%
12%
14%
Blacks/ African-Americans
Hispanics/ Latinos American Indians/Alaska Natives
Asians/ PacificIslanders
U.S. PopulationPercent of all physicians (incl. missing race/ethnicity)Percent of all physicians reporting race/ethnicity
Sources: U.S. Bureau of the Census, 2006; American Medical Association Physician Masterfile, 2000 Note: Large numbers of physicians (nearly 30%) did not report race/ethnicity to the AMA. The two physician bars represent percentages with and without those with mussing values removed.
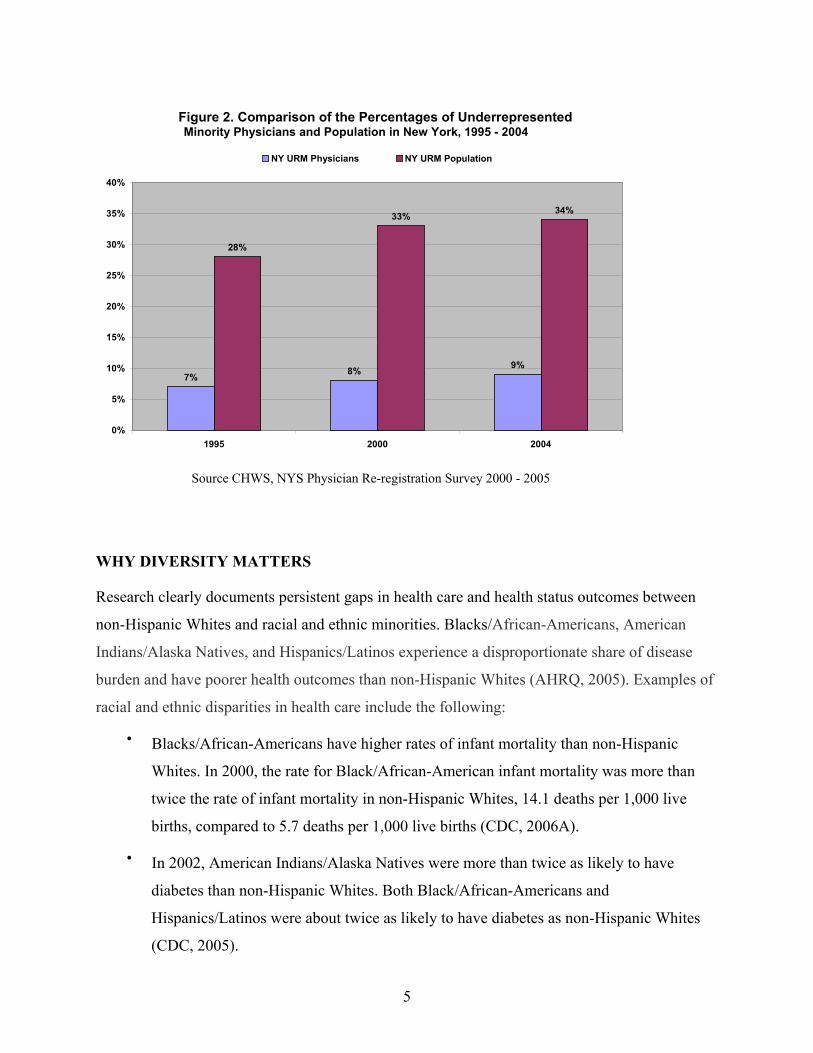
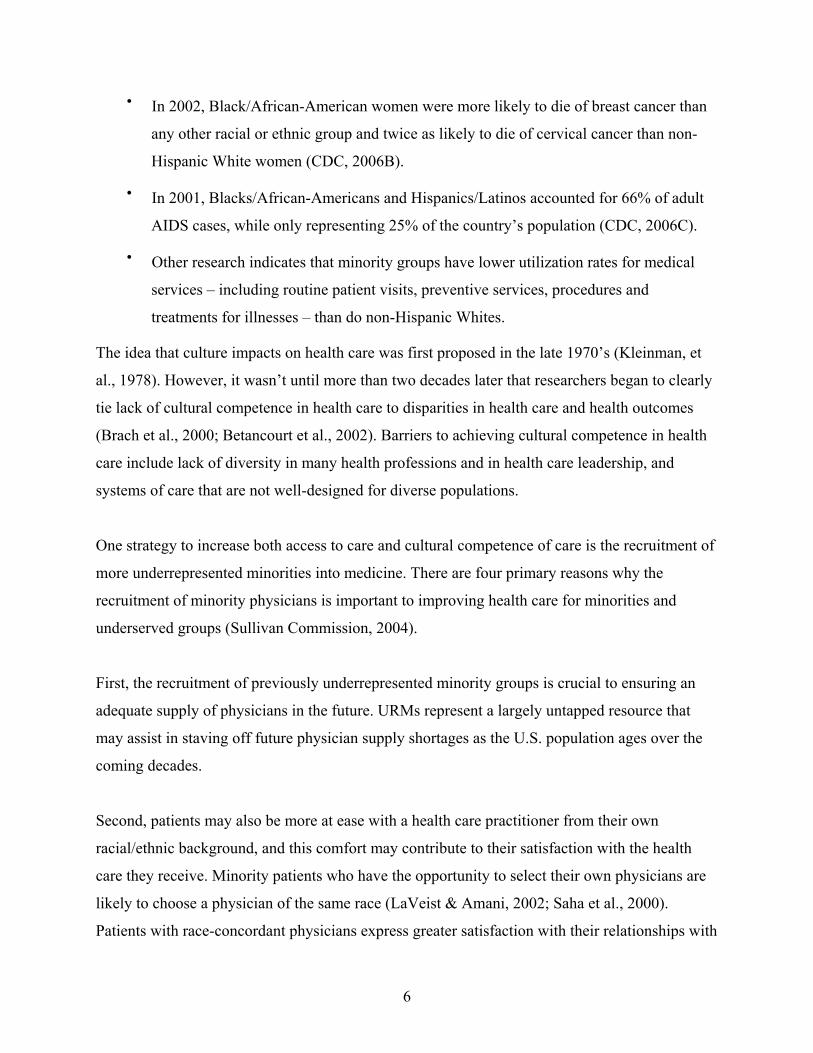
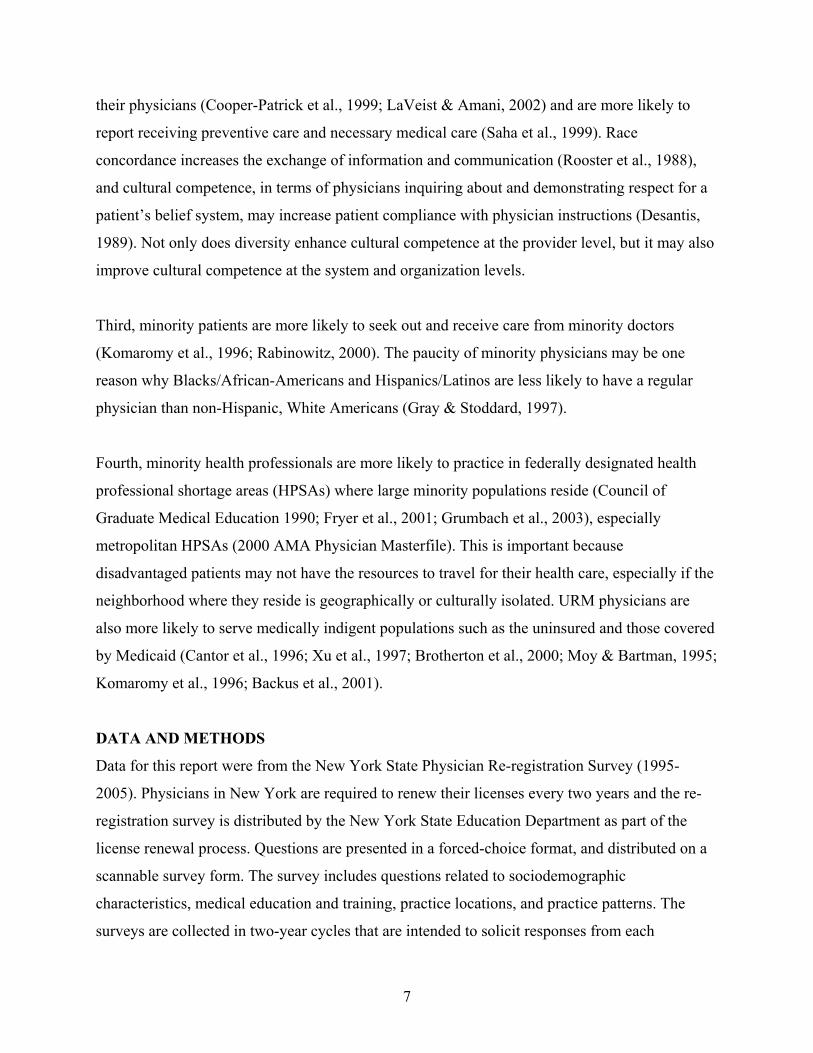
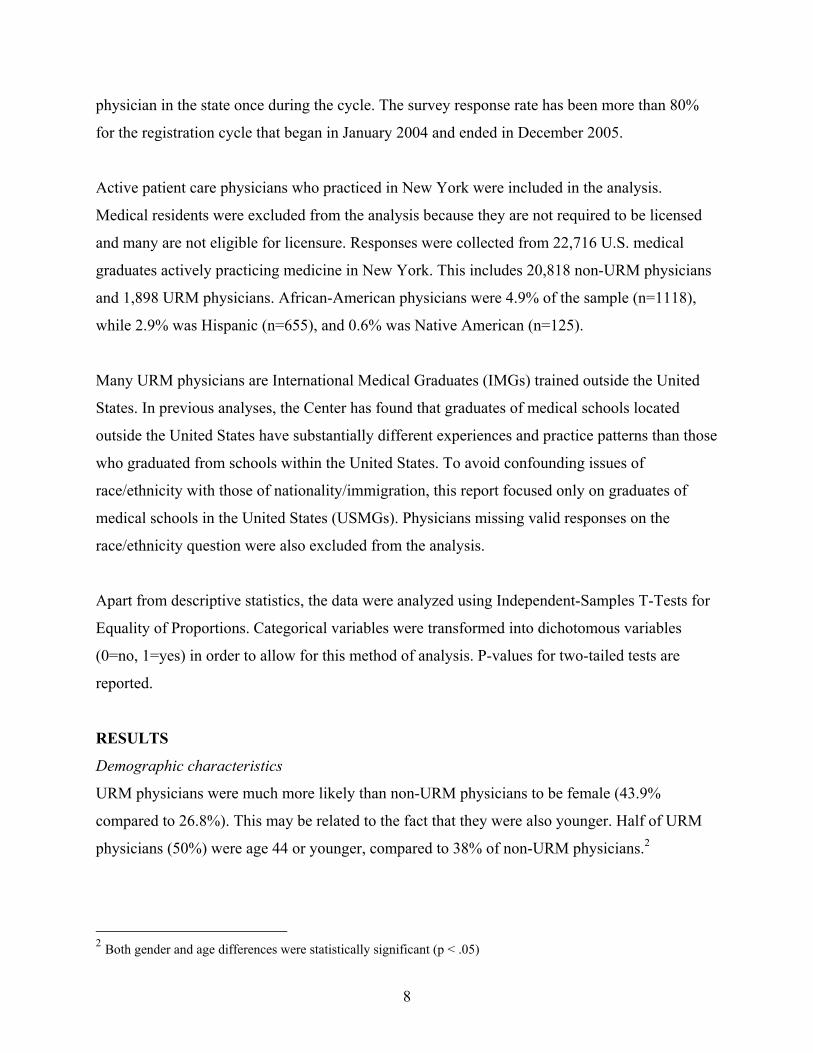
Similarly, New York physicians are not representative of the state’s population in terms of their
race and ethnicity. Despite the fact that underrepresented minorities account for more than one-
third of New York’s population, they make up less than 10% of the state’s physician workforce.
In 1995, 7% of physicians in New York were underrepresented minorities, and rose to only 9%
in 2004, despite the fact that the state’s population continued to grow increasingly diverse (see
Figure 2). Furthermore, the disparities between the race and ethnicity of physicians and the
state’s population are expected to further widen in future years.
5
Source CHWS, NYS Physician Re-registration Survey 2000 - 2005
WHY DIVERSITY MATTERS
Research clearly documents persistent gaps in health care and health status outcomes between
non-Hispanic Whites and racial and ethnic minorities. Blacks/African-Americans, American
Indians/Alaska Natives, and Hispanics/Latinos experience a disproportionate share of disease
burden and have poorer health outcomes than non-Hispanic Whites (AHRQ, 2005). Examples of
racial and ethnic disparities in health care include the following:
• Blacks/African-Americans have higher rates of infant mortality than non-Hispanic
Whites. In 2000, the rate for Black/African-American infant mortality was more than
twice the rate of infant mortality in non-Hispanic Whites, 14.1 deaths per 1,000 live
births, compared to 5.7 deaths per 1,000 live births (CDC, 2006A).
• In 2002, American Indians/Alaska Natives were more than twice as likely to have
diabetes than non-Hispanic Whites. Both Black/African-Americans and
Hispanics/Latinos were about twice as likely to have diabetes as non-Hispanic Whites
(CDC, 2005).
Figure 2. Comparison of the Percentages of UnderrepresentedMinority Physicians and Population in New York, 1995 - 2004
7% 8% 9%
28%
33% 34%
0%
5%
10%
15%
20%
25%
30%
35%
40%
1995 2000 2004
NY URM Physicians NY URM Population
6
• In 2002, Black/African-American women were more likely to die of breast cancer than
any other racial or ethnic group and twice as likely to die of cervical cancer than non-
Hispanic White women (CDC, 2006B).
• In 2001, Blacks/African-Americans and Hispanics/Latinos accounted for 66% of adult
AIDS cases, while only representing 25% of the country’s population (CDC, 2006C).
• Other research indicates that minority groups have lower utilization rates for medical
services – including routine patient visits, preventive services, procedures and
treatments for illnesses – than do non-Hispanic Whites.
The idea that culture impacts on health care was first proposed in the late 1970’s (Kleinman, et
al., 1978). However, it wasn’t until more than two decades later that researchers began to clearly
tie lack of cultural competence in health care to disparities in health care and health outcomes
(Brach et al., 2000; Betancourt et al., 2002). Barriers to achieving cultural competence in health
care include lack of diversity in many health professions and in health care leadership, and
systems of care that are not well-designed for diverse populations.
One strategy to increase both access to care and cultural competence of care is the recruitment of
more underrepresented minorities into medicine. There are four primary reasons why the
recruitment of minority physicians is important to improving health care for minorities and
underserved groups (Sullivan Commission, 2004).
First, the recruitment of previously underrepresented minority groups is crucial to ensuring an
adequate supply of physicians in the future. URMs represent a largely untapped resource that
may assist in staving off future physician supply shortages as the U.S. population ages over the
coming decades.
Second, patients may also be more at ease with a health care practitioner from their own
racial/ethnic background, and this comfort may contribute to their satisfaction with the health
care they receive. Minority patients who have the opportunity to select their own physicians are
likely to choose a physician of the same race (LaVeist & Amani, 2002; Saha et al., 2000).
Patients with race-concordant physicians express greater satisfaction with their relationships with
7
their physicians (Cooper-Patrick et al., 1999; LaVeist & Amani, 2002) and are more likely to
report receiving preventive care and necessary medical care (Saha et al., 1999). Race
concordance increases the exchange of information and communication (Rooster et al., 1988),
and cultural competence, in terms of physicians inquiring about and demonstrating respect for a
patient’s belief system, may increase patient compliance with physician instructions (Desantis,
1989). Not only does diversity enhance cultural competence at the provider level, but it may also
improve cultural competence at the system and organization levels.
Third, minority patients are more likely to seek out and receive care from minority doctors
(Komaromy et al., 1996; Rabinowitz, 2000). The paucity of minority physicians may be one
reason why Blacks/African-Americans and Hispanics/Latinos are less likely to have a regular
physician than non-Hispanic, White Americans (Gray & Stoddard, 1997).
Fourth, minority health professionals are more likely to practice in federally designated health
professional shortage areas (HPSAs) where large minority populations reside (Council of
Graduate Medical Education 1990; Fryer et al., 2001; Grumbach et al., 2003), especially
metropolitan HPSAs (2000 AMA Physician Masterfile). This is important because
disadvantaged patients may not have the resources to travel for their health care, especially if the
neighborhood where they reside is geographically or culturally isolated. URM physicians are
also more likely to serve medically indigent populations such as the uninsured and those covered
by Medicaid (Cantor et al., 1996; Xu et al., 1997; Brotherton et al., 2000; Moy & Bartman, 1995;
Komaromy et al., 1996; Backus et al., 2001).
DATA AND METHODS
Data for this report were from the New York State Physician Re-registration Survey (1995-
2005). Physicians in New York are required to renew their licenses every two years and the re-
registration survey is distributed by the New York State Education Department as part of the
license renewal process. Questions are presented in a forced-choice format, and distributed on a
scannable survey form. The survey includes questions related to sociodemographic
characteristics, medical education and training, practice locations, and practice patterns. The
surveys are collected in two-year cycles that are intended to solicit responses from each
8
physician in the state once during the cycle. The survey response rate has been more than 80%
for the registration cycle that began in January 2004 and ended in December 2005.
Active patient care physicians who practiced in New York were included in the analysis.
Medical residents were excluded from the analysis because they are not required to be licensed
and many are not eligible for licensure. Responses were collected from 22,716 U.S. medical
graduates actively practicing medicine in New York. This includes 20,818 non-URM physicians
and 1,898 URM physicians. African-American physicians were 4.9% of the sample (n=1118),
while 2.9% was Hispanic (n=655), and 0.6% was Native American (n=125).
Many URM physicians are International Medical Graduates (IMGs) trained outside the United
States. In previous analyses, the Center has found that graduates of medical schools located
outside the United States have substantially different experiences and practice patterns than those
who graduated from schools within the United States. To avoid confounding issues of
race/ethnicity with those of nationality/immigration, this report focused only on graduates of
medical schools in the United States (USMGs). Physicians missing valid responses on the
race/ethnicity question were also excluded from the analysis.
Apart from descriptive statistics, the data were analyzed using Independent-Samples T-Tests for
Equality of Proportions. Categorical variables were transformed into dichotomous variables
(0=no, 1=yes) in order to allow for this method of analysis. P-values for two-tailed tests are
reported.
RESULTS
Demographic characteristics
URM physicians were much more likely than non-URM physicians to be female (43.9%
compared to 26.8%). This may be related to the fact that they were also younger. Half of URM
physicians (50%) were age 44 or younger, compared to 38% of non-URM physicians.2
2 Both gender and age differences were statistically significant (p < .05)
9
Practice locations
URM physicians were significantly more likely than non-URM physicians to work in downstate
New York (New York City and the nearby surrounding counties) as opposed to upstate New
York (85% versus 73%). URM physicians were also more likely to work in urban areas of the
state as compared to rural areas (95% versus 90%).3
Practice settings
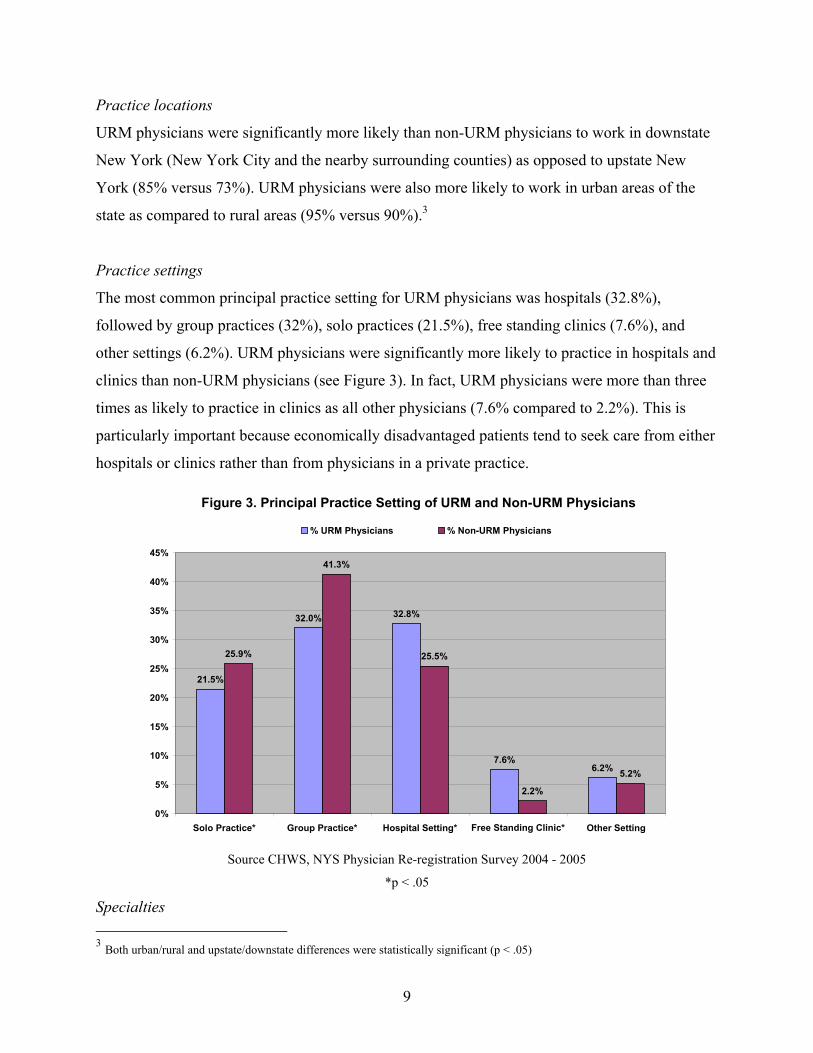
The most common principal practice setting for URM physicians was hospitals (32.8%),
followed by group practices (32%), solo practices (21.5%), free standing clinics (7.6%), and
other settings (6.2%). URM physicians were significantly more likely to practice in hospitals and
clinics than non-URM physicians (see Figure 3). In fact, URM physicians were more than three
times as likely to practice in clinics as all other physicians (7.6% compared to 2.2%). This is
particularly important because economically disadvantaged patients tend to seek care from either
hospitals or clinics rather than from physicians in a private practice.
Source CHWS, NYS Physician Re-registration Survey 2004 - 2005
*p < .05
Specialties 3 Both urban/rural and upstate/downstate differences were statistically significant (p < .05)
Figure 3. Principal Practice Setting of URM and Non-URM Physicians
21.5%
32.0% 32.8%
7.6%6.2%
25.9%
41.3%
25.5%
2.2%
5.2%
0%
5%
10%
15%
20%
25%
30%
35%
40%
45%
Solo Practice* Group Practice* Hospital Setting* Free Standing Clinic* Other Setting
% URM Physicians % Non-URM Physicians
10
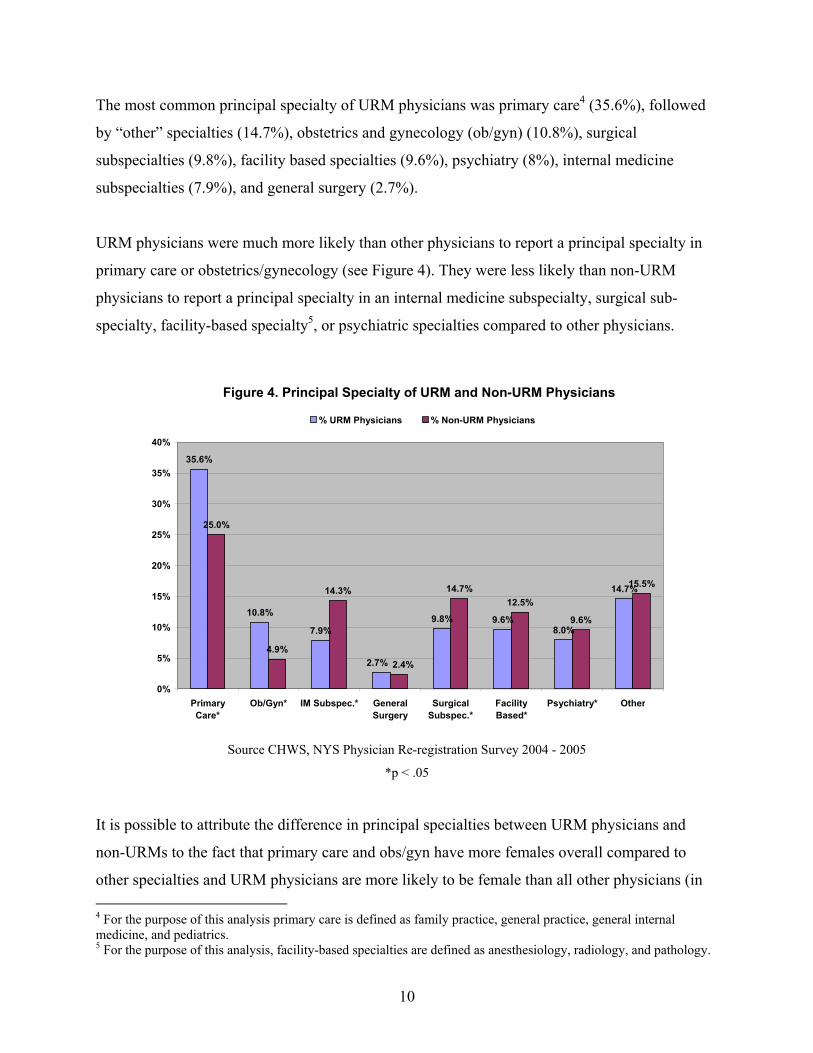
The most common principal specialty of URM physicians was primary care4 (35.6%), followed
by “other” specialties (14.7%), obstetrics and gynecology (ob/gyn) (10.8%), surgical
subspecialties (9.8%), facility based specialties (9.6%), psychiatry (8%), internal medicine
subspecialties (7.9%), and general surgery (2.7%).
URM physicians were much more likely than other physicians to report a principal specialty in
primary care or obstetrics/gynecology (see Figure 4). They were less likely than non-URM
physicians to report a principal specialty in an internal medicine subspecialty, surgical sub-
specialty, facility-based specialty5, or psychiatric specialties compared to other physicians.
Source CHWS, NYS Physician Re-registration Survey 2004 - 2005
*p < .05
It is possible to attribute the difference in principal specialties between URM physicians and
non-URMs to the fact that primary care and obs/gyn have more females overall compared to
other specialties and URM physicians are more likely to be female than all other physicians (in 4 For the purpose of this analysis primary care is defined as family practice, general practice, general internal medicine, and pediatrics. 5 For the purpose of this analysis, facility-based specialties are defined as anesthesiology, radiology, and pathology.
Figure 4. Principal Specialty of URM and Non-URM Physicians
35.6%
10.8%
7.9%9.8% 9.6%
8.0%
14.7%
25.0%
4.9%
14.3% 14.7%12.5%
9.6%
15.5%
2.7% 2.4%
0%
5%
10%
15%
20%
25%
30%
35%
40%
PrimaryCare*
Ob/Gyn* IM Subspec.* GeneralSurgery
SurgicalSubspec.*
FacilityBased*
Psychiatry* Other
% URM Physicians % Non-URM Physicians
11
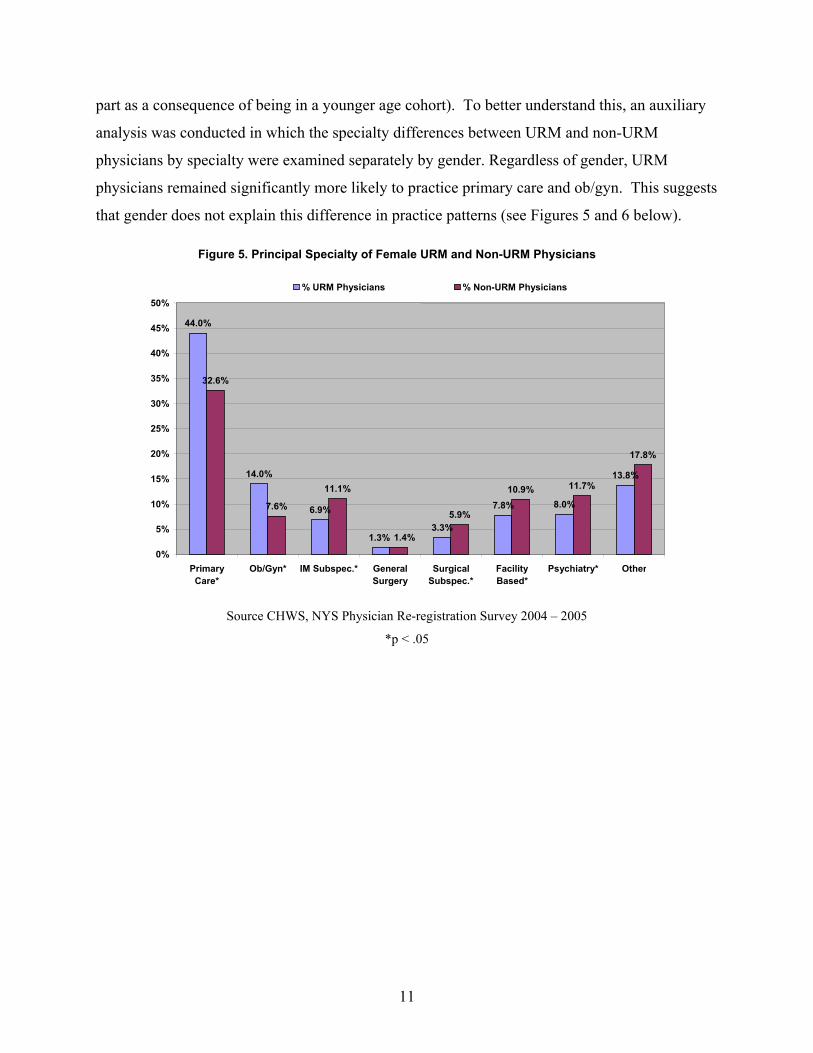
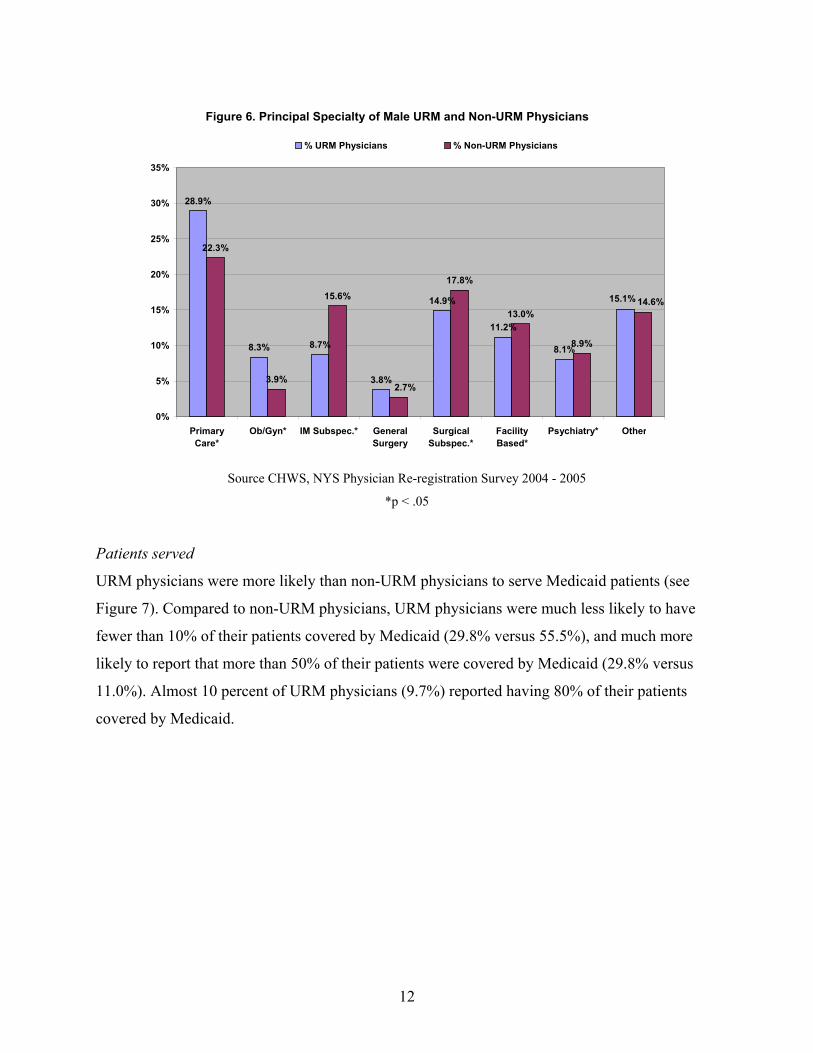
part as a consequence of being in a younger age cohort). To better understand this, an auxiliary
analysis was conducted in which the specialty differences between URM and non-URM
physicians by specialty were examined separately by gender. Regardless of gender, URM
physicians remained significantly more likely to practice primary care and ob/gyn. This suggests
that gender does not explain this difference in practice patterns (see Figures 5 and 6 below).
Source CHWS, NYS Physician Re-registration Survey 2004 – 2005
*p < .05
Figure 5. Principal Specialty of Female URM and Non-URM Physicians
44.0%
14.0%
6.9%
3.3%
7.8% 8.0%
13.8%
32.6%
7.6% 11.1%
5.9%
10.9% 11.7%
17.8%
1.3% 1.4%
0% 5%
10% 15% 20% 25% 30% 35% 40% 45% 50%
PrimaryCare*
Ob/Gyn* IM Subspec.* GeneralSurgery
SurgicalSubspec.*
FacilityBased*
Psychiatry* Other
% URM Physicians % Non-URM Physicians
12
Source CHWS, NYS Physician Re-registration Survey 2004 - 2005
*p < .05
Patients served
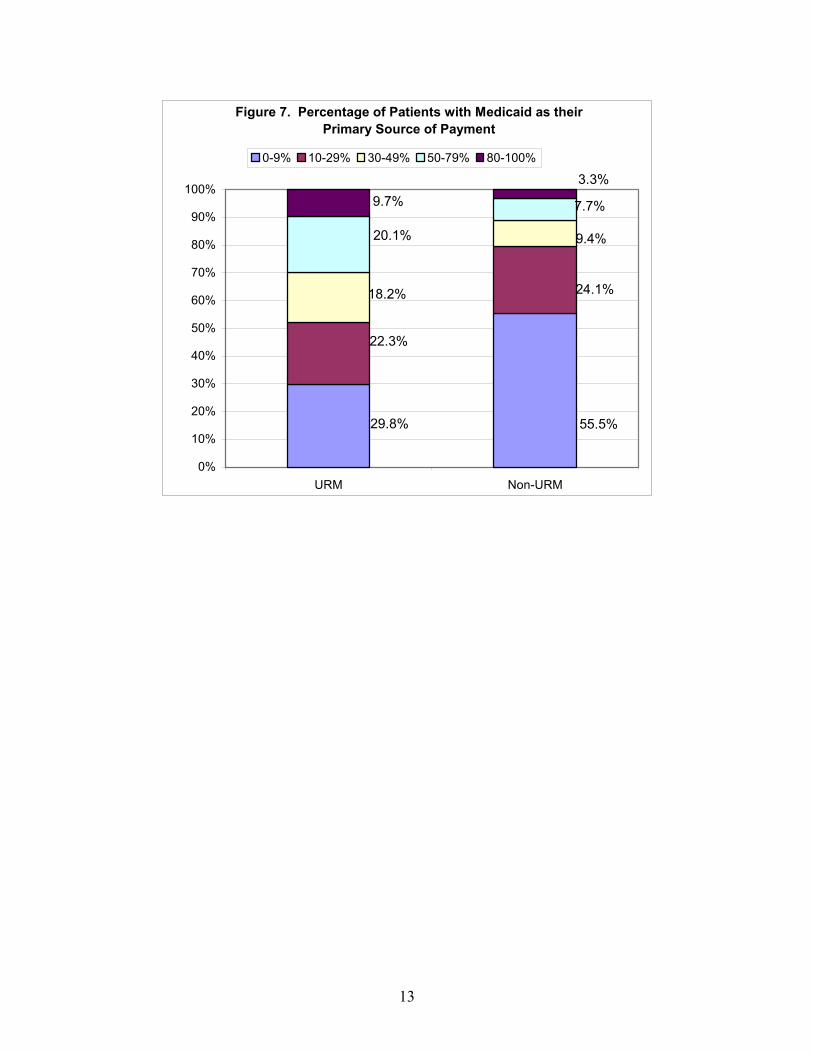
URM physicians were more likely than non-URM physicians to serve Medicaid patients (see
Figure 7). Compared to non-URM physicians, URM physicians were much less likely to have
fewer than 10% of their patients covered by Medicaid (29.8% versus 55.5%), and much more
likely to report that more than 50% of their patients were covered by Medicaid (29.8% versus
11.0%). Almost 10 percent of URM physicians (9.7%) reported having 80% of their patients
covered by Medicaid.
Figure 6. Principal Specialty of Male URM and Non-URM Physicians
28.9%
8.3% 8.7%
3.8%
14.9%
11.2%
8.1%
22.3%
3.9%
15.6%17.8%
13.0%
8.9%
15.1%
2.7%
14.6%
0%
5%
10%
15%
20%
25%
30%
35%
PrimaryCare*
Ob/Gyn* IM Subspec.* GeneralSurgery
SurgicalSubspec.*
FacilityBased*
Psychiatry* Other
% URM Physicians % Non-URM Physicians
13
Figure 7. Percentage of Patients with Medicaid as their Primary Source of Payment
55.5%29.8%
24.1%
22.3%
9.4%
18.2%
7.7%
20.1%
3.3%9.7%
0%
10%
20%
30%
40%
50%
60%
70%
80%
90%
100%
URM Non-URM
0-9% 10-29% 30-49% 50-79% 80-100%
14
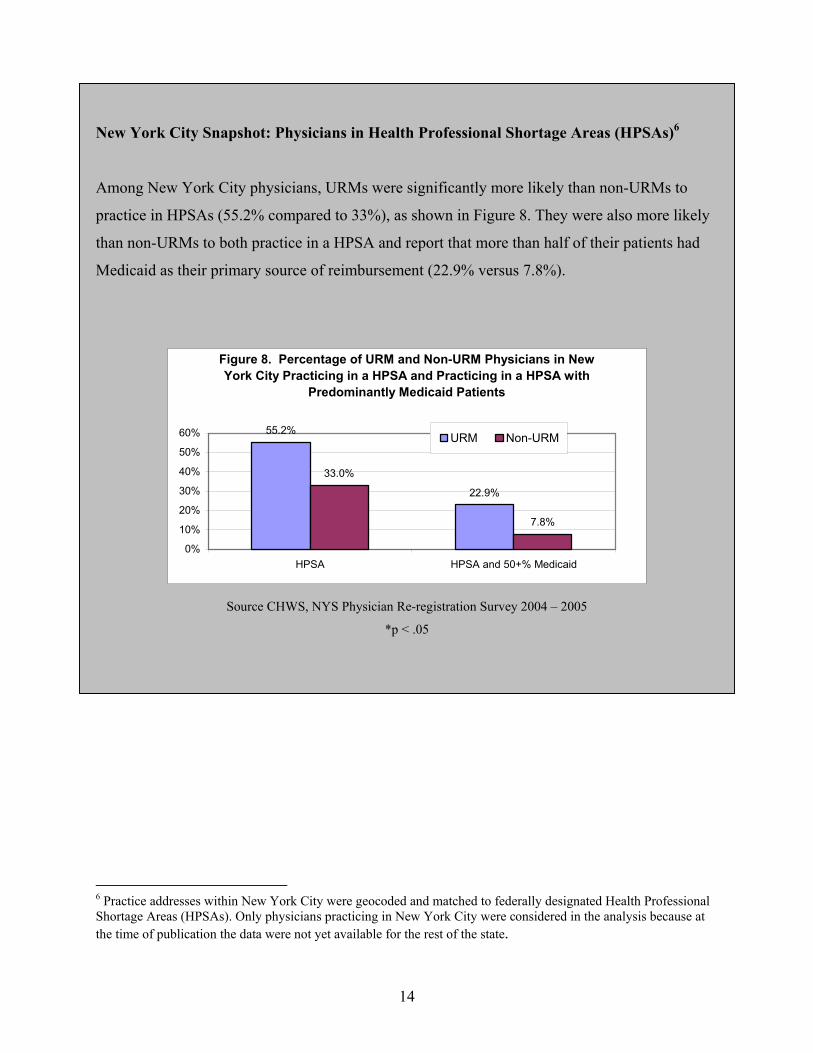
New York City Snapshot: Physicians in Health Professional Shortage Areas (HPSAs)6
Among New York City physicians, URMs were significantly more likely than non-URMs to
practice in HPSAs (55.2% compared to 33%), as shown in Figure 8. They were also more likely
than non-URMs to both practice in a HPSA and report that more than half of their patients had
Medicaid as their primary source of reimbursement (22.9% versus 7.8%).
Figure 8. Percentage of URM and Non-URM Physicians in New York City Practicing in a HPSA and Practicing in a HPSA with
Predominantly Medicaid Patients
55.2%
22.9%
33.0%
7.8%
0%
10%
20%
30%
40%
50%
60%
HPSA HPSA and 50+% Medicaid
URM Non-URM
Source CHWS, NYS Physician Re-registration Survey 2004 – 2005
*p < .05
6 Practice addresses within New York City were geocoded and matched to federally designated Health Professional Shortage Areas (HPSAs). Only physicians practicing in New York City were considered in the analysis because at the time of publication the data were not yet available for the rest of the state.

15
CONCLUSION and FINDINGS
This study was conducted to help inform state policy makers and planners and other stakeholders
about underrepresented minority (URM) physicians and their practice patterns compared to non-
URM physicians in New York. The number of URM physicians has not substantially increased
over the past five years and remains far less than their proportion in the state’s population.
Overall, the practice patterns of URM physicians in New York differed from those of non-URM
physicians in ways that could potentially improve access to care among underserved populations.
URM physicians were more likely than non-URM physicians to practice in hospitals and free
standing clinics, where underserved patients commonly receive care. In fact, URM physicians
were more than three times as likely to practice in clinics than non-URM physicians.
URM physicians were also more likely to practice primary care and obstetrics/gynecology,
regardless of gender. Physicians in these specialties provide the most basic preventive health
care, and are often the first physicians to diagnose chronic conditions.
URM physicians were also much more likely to serve patients covered by Medicaid, the public
insurance program for low-income people. In addition, more than half of URM physicians in
New York City practiced in federally designated Health Professional Shortage Areas (HPSAs)
compared to about one-third of all other physicians in New York City, and nearly one in four
practiced in a HPSA and served patients who are predominantly Medicaid-insured, compared to
fewer than one in ten other physicians.
These findings suggest that URM physicians not only improve the cultural diversity and cultural
competency of the physician workforce, they also potentially increase access to care and quality
of care for underserved and minority populations in New York. Their presence in the physician
workforce may potentially reduce the health disparities between non-Hispanic Whites and
racial/ethnic minorities through both the improvement of cultural competence and the provision
of services to those who need them the most.
16
The findings of this report are comparable to the findings of a similar study, Practice Patterns of
Underrepresented Minority Nurse Practitioners in New York, 2000 [McGinnis, Moore, and
Continelli; 2006]. The similarities suggest that the problems associated with a lack of diversity
among physicians may be part of a greater health care workforce problem in New York, and that
the benefits associated with minority recruitment and retention may span a variety of health care
professions.
17
REFERENCES
Agency for Healthcare Research and Quality. (2005). The 2005 national health care disparities report, Rockville, MD: AHRQ. Retrieved April 1, 2006, from http://www.ahrq.gov/qual/nhdr05/nhdr05.pdf
American Medical Association Masterfile Data. (2000). Association of American Medical Colleges. (2004). Underrepresented in medicine. Washington,
D.C.: AAMC. Retrieved on June 21, 2005 from, http://www.aamc.org/meded/urm/start.htm Bach, P., Hoangmai, P., Schrag, D., Tate, R., & Hargraves, J. L. (2004). Primary care physicians
who treat blacks and whites. New England Journal of Medicine, 351, 575-84. Backus, L., Osmond, D., Grumbach, K., Vranizan, K., Phuong, L., & Bindman, A. B. (2001).
Specialists’ and primary care physicians’ participation in Medicaid managed care. J Gen Intern Med, 16(12), 815-821.
Betancourt, J., Green, A., & Carrillo, E. (2002). Cultural competence in health care: Emerging
frameworks and practical approaches. New York, NY: The Commonwealth Fund. Brach, C. & Fraser, I. (2002). Reducing disparities through culturally competent health care: An
analysis of the business case. Quality Management in Health Care, 10(4), 15-28. Cantor, J. C., Miles, E. L., Baker, L. C., & Barker, D. C. (1996). Physician service to the
underserved: Implications for affirmative action in medical education. Inquiry, 33(2), 167-180
Centers for Disease Control and Prevention. (2005). Diabetes fact sheet: Prevalence of diabetes
by race/ethnicity. Retrieved on April 1, 2006, from http://www.cdc.gov/diabetes/pubs/estimates.htm#prev4
Centers for Disease Control and Prevention. (2006a). Eliminate disparities in infant mortality.
Atlanta, GA: Office of Minority Health. Retrieved on April 12, 2006, from http://www.cdc.gov/omh/AMH/factsheets/infant.htm
Centers for Disease Control and Prevention. (2006b). United States cancer statistics: 2002
incidence and mortality. Retrieved on April 1, 2006, from http://www.cdc.gov/cancer/npcr/uscs/index.htm
Centers for Disease Control and Prevention. (2006c). Eliminate disparities in HIV and AIDS.
Retrieved on April 10, 2006, from http://www.cdc.gov/omh/AMH/factsheets/hiv.htm Collins, K. S., Hall, A., & Neuhaus, C. (1999). U.S. minority health. A chartbook. New York,
NY: The Commonwealth Fund.
18
Collins, K., Hughes, D., Doty, M., Ives, B., Edwards, J., & K. Tenny. (2002). Diverse communities, common concerns: Assessing health care quality for minority Americans. New York, NY: The Commonwealth Fund.
Conway-Welch, C. (1991). Issues surrounding the distribution and utilization of nurse
nonphysician providers in rural America. The Journal of Rural Health, 7, 388-401. Cooper-Patrick, L., Gallo, J., Gonzales, J., Hong Thi Vu, Powe, N., Nelson, C., & Ford, D.
(1999). Race, gender, and partnership in the patient-physician relationship. Journal of the American Medical Association, 282, 583-589.
Council on Graduate Medical Education. (1990). Second report: The financial status of teaching
hospitals and the underrepresentation of minorities in medicine. Rockville, MD: Health Resources and Services Administration, Department of Health and Human Services.
Desantis, L. (1989). Health care orientations of Cuban and Haitian immigrant mothers:
Implication for health care professionals. Medical Anthropology, 12, 69-89. Eliason, M. J., & Raheim, S. (1996). Experiences and comfort with culturally diverse groups in
undergraduate pre-nursing students. Iowa City, IA: The University of Iowa Press. Ferguson, W. J., & Candib, L. M. (2002). Culture, language, and the doctor-patient relationship.
Family Medicine 2002, 34, 353-361. Fryer, G. E., Jr., Green, L. A., Vojir, C. P., Krugman, R. D., Miyoshi, T. J., Stine, C., & Miller,
M. E. (2001). Hispanic versus white, non-Hispanic physician medical practices in Colorado. J Health Care Poor Underserved, 12(3), 342-351.
Gray, B., & Stoddard, J. J. (1997). Patient-physician pairing: Does racial and ethnic congruity
influence the selection of a regular physician? Journal of Community Health,22(4), 247-259. Gromin, R. & Ginsberg, J. (2004). Racial and ethnic disparities in health care: A position paper
of the American College of Physicians. Annals of Internal Medicine, 141(3), 226-232. Grumbach, K., Hart, L. G., Mertz, E., Coffman, J., & Palazzo, L. (2003). Who is caring for the
underserved? A comparison of primary care physicians and nonphysician clinicians. Annals of Family Medicine, 1(2), 97-104.
Hicks, L., Ayanian, J., Orav, E., Soukup, J., McWilliams, M., Choi, S., & Johnson, P. (2005). Is
hospital service associated with racial and ethnic disparities in experiences with hospital care? American Journal of Medicine, 118(5), 529-535.
Keith, S., Bell, R., Swanson, A., & Williams, A. (1985). Effects of affirmative action in medical
schools. NEJM, 313, 1519-1525.
19
Kippenbrock, T., Stacy, A., Tester, K., & Richey, R. (2002). Nurse practitioners providing health care to rural and underserved areas in four Mississippi Delta states. Journal of Professional Nursing, 18(4), 230-237.
Komaromy, M., Grumbach, K., Drake, M., Vranizan, K., Lurie, N., Keane, D., & Bindman, A.
(1996). The role of black and Hispanic physicians in providing health care for underserved populations. NEJM, 334, 1305-1310.
LaVeist, T., & Amani, N. (2002). Is doctor patient race concordance associated with greater
satisfaction with care? Journal of Health and Social Behavior, 43, 296-306. Mayberry, R. M., Mili, F., & Ofili, E. (2000). Racial and ethnic differences in access to medical
care. Medical Care Research and Review, 57, 108-145. Mezibov, D. (1998). Nurse practitioners: The growing solution in health care delivery.
American Association of Colleges of Nursing - Backgrounder. Washington, D.C.: AACN. Moy, E., Bartman, B. A., & Weir, M. R. (1995). Access to hypertensive care: Effects of income,
insurance, and source of care. Archives of Internal Medicine, 155(14), 1497-1502. Mundinger, M., Kane, R., Lenz, E., Totten, A., Tsai, W., Cleary, P., et al. (2000). Primary care
outcomes in patients treated by nurse practitioners or physicians: a randomized trial. JAMA, 283, 59-68.
Rabinowitz, H. (2000). The impact of multiple predictors on the generalist physicians’ care of
underserved populations. American Journal of Public Health, 90(8), 1225-1228. Rooter, D. L., Hall, J. A., & Katz, N. R. (1988). Doctor-patient communication: A descriptive
summary of the literature. Patient Education and Counseling, 12, 99-119. Saha, S., Komaromy, M., Koepsell, R. D. & Bindman, A. (1999). Patient-physician racial
concordance and the perceived quality and use of health care. Archives of Internal Medicine 159, 997-1004.
Saha, S., Taggart, S., Komaromy, M., & Bindman, A. (2000). Do patients choose physicians of
their own race? Health Affairs, 19, 76-83. Somnath, S., Taggart, S., Komaromy, M., & Bindman, A. (2000). Do patients choose physicians
of their own race? Health Affairs, 19, 76-83. Smedley, B., Stith, A., & Nelson, A. (Eds.). (2002). Unequal treatment confronting racial and
ethnic disparities in health care. Washington, D.C.: Institute of Medicine, The National Academy Press
20
Sullivan, L. W. (2004). Missing persons: Minorities in the health professions, a report of the Sullivan Commission on diversity in the health care workforce. Retrieved on June 20, 2005, from http://www.amsa.org/advocacy/Sullivan_Commission.pdf
Van Ryn, M. & Burke, J. (2000). The effect of patient race and socio-economic status on
physicians’ perceptions of patients. Social Science and Medicine, 50, 813-828. U.S. Census Bureau. (2000). Five Percent Public Use Microdata Sample (PUMS) Files.
Retrieved on November 9, 2005, from http://ftp2.census.gov/census_2000/datasets/PUMS/FivePercent
U.S. Census Bureau. (2005). Projected population of the United States, by race and Hispanic
origin: 2000 to 2050. Retrieved June 24, 2004, from http://www.census.gov/ipc/www/usinterimproj/natprojtab01a.pdf
U.S. Department of Health and Human Services. (2004). A comparison of changes in the
professional practice of nurse practitioners, physician assistants, and certified nurse midwives: 1992 and 2000. Rockville, MD: Health Resources and Services Administration.
Xu, G., Hoja, M., Veloski, J. J., & Brose, J. (1996). A national study of factors influencing
primary care career choices among underrepresented-minority, white, and Asian American physicians. Acad Med, 71(10 supplement), S10-2.