equilibrium extraction of
TRANSCRIPT

MITNE -54
EQUILIBRIUM EXTRACTIONOF
CHARACTERISTICS
ALKYL AMINES AND NUCLEARIN
FUELS METALS
NITRATE
PROGRESS
SYSTEMS
REPORT J1
June I - August 31, 1964
BY
PHILIP
EDWARD
J. LLOYD
A. MASON
DEPARTMENT OF NUCLEAR
MASSACHUSETTS INSTITUTE
ENGINEERING
OF TECHNOLOGYMASSACHUSETTSCAMBRIDGE, 02139
MITNE-54
Equilibrium Extraction Characteristics
of
Alcyl Amines and Nuclear Fuels Metals
in
Nitrate Systems
Progress Report for the Period
June 1 - August 31, 1964
Progress Report XIV
by
Philip J. Lloyd
Edward A. Mason
October 24, 1964
Work Performed Under Subcontract No. 1327
Under Contract No. W - 7405 - Eng - 26
with
Union Carbide Nuclear Corporation
Oak Ridge, Tennessee
Massachusetts Institute of Technology
Cambridge, Massachusetts 02139

1.0 Summary
1.1 Multicomponent Metal Extraction
Further tests were carried out on the technique of study-ing the variation of overall distribution ratio as a functionof phase ratio in order to determine the partition coeffi-cients of two species being extracted simultaneously. Se7 5
and Agill tracers were extracted simultaneously from 1, 3,6, 9 and 12M nitric acid solutions by 0.1 and 0.2M amine ni.-trate solutions. Significant results were only odtained atthe highest acid and amine concentrations. This failure wasprobably due partly to the low ratio of the partition coeffi-cients concerned, and partly to the low values of the actualpartition coefficients,
1.2 Nitrosylruthenium Nitrato Complexes
Further studies of the behavior of nitrato complexes ofnitrosylruthenium were carried out using the PARTIFRAC analy-sis of the variation of overall distribution ratio with phaseratio to determine the mole fractions of the extractablespecies. Hydrolysis rates in 3M HNO3 were extended; the lessextractable species showed a rate constant for hydrolysiski; 0.01 per minute, and the more extractable a rate con-stant k2 Z 0.10-0.15 per minute, though there is some evi-dence that the more extractable species are actually two,rather than one species, with different rates of hydrolysis.
Back extraction experiments showed that in the organicphase, the less extractable species 1 was converted to themore extractable species 2, with a rate constant kZ0.075per min. Attempt to observe the rates of nitration by dis-solving "RuNO(NO3)3" failed as it appeared that the prepara-tion was a mixture containing at least 20% of the rutheniumas species 2. Attempts to prepare radioactive nitrosyl-ruthenium nitrato species by solution in nitric acid of ir-radiated RuNO(OH) also failed, as approximately 50% of theactive ruthenium present in the final aqueous solution wasevidently not a nitrosylruthenium complex.
A tentative scheme for the extraction of the nitro-sykruthenium nitratocomplexes is outlined in which the pro-bable structure of the complexes is suggested. The lessextractable species appears to be the trinitrato complex,which is probably extracted with some coordinatively boundwater. This water is then probably displaced during conver-sion of this species on standing in the organic phase. Themore extractable species are probably predominantly tetra-nitrato nitvosylruthenium, with possible traces of the penta-nitrato complex.
-' 0, . I -. 9mm-

2.0 Multicomponent Metal Extraction
2.1 Introduction
It was suggested in the previous progress report (1)that the technique of studying the variation of distributionratio with phase ratio, which had been employed in studyingthe simultaneous distribution of two species of nitrosyl-ruthenium, might be adaptable to the study of the simultaneousdistribution of two different metals. The theory of the methodwas given and its disadvantages discussed. Preliminary testsat that time were inconclusive, and it was decided to testthe method further using selenium and silver radiotracers, asthe behavior of these two metalsindividually was alreadyknown.
2.2 Experimental
Seven-and-one-half day Agill tracer was purchased fromthe Isotopes Division, ORNL, and 120 day Se7 5 was previouslyprepared by irradiatingSe powder in the MITR (2). Solutionsof each of these were made up in 1, 3, 6, 9 an 12M nitricacid, so that the final solutions contained roughly 50,000cpm/ml of each activity.
Thercrganic phase was 0.2 or 0.lN tri-n-dodecylamine(Eastman No. 7727) dissolved in A.R. grade toluene. Beforeuse the amine solution was pre-equilibrated by double contactat 2:1 aqueous to organic phase ratio with nitric acid at therelevant concentrations.
The extractions were carried out at various phase ratiosas described previously (1). 1.0 or 0.5 ml samples of eachphase were taken for counting in thin-walled glass vials.A well-type scintillation counter was used, all counts above0.12 Mev being recorded. The counting efficiencies of theaqueous and organic phases were similar, while the differencebetween the counting efficiency of 0.5 and 1.0 ml samplesamounted to roughly, 3%, and consequently was ignored.
The results are summarized in Table 1.
2.3 Discussion
The results were analyzed by the PARTIFRAC II programdescribed previously (1). On inspection it was obvious thatit would be difficult To analyze the results at the loweracid concentrations and at the higher acid concentrationsfor 0.lN amine, since under these conditions the distributionratios were so low that the statistical error in countingthe organic phase was of the same order of magnitude as thevariation in distribution ratio. Meaningful results could
..... ... .V, .. ....... ' _ .

3
Table 1
Variation of Distribution Ratio With Phase RatioFor Se and Ag Extracted Simultaneously at 2500
e Phase Distribution Ratio (o/A) at Givenn. Ratio Nitric Acid Concentration
iM
.oo49
.0052
.0047
3M
.0035
6M
.0056
9M
.015
12M
.033.0031 .0053 .014 .029
.0032.0048 .0036
.0047
.012
.011
.012
.010
.011
.0054 .014 .029
.0051 .015.0034 .0055
.0080
.0076
.0077
.0077
.0074
.026
.025
.024
.024
.025
.027.013 .029
.048 .090
.047
.047.087.084
.044 .076
.o40 .065
only be obtained for extraction by 0.2M amine from 9 and12M acid solution. The results obtained here are comparedinFTable 2 to those previously determined for the metalsindividually.
Table 2
Comparison of Distribution Ratios of Ag and Se ExtractedIndividually or Simulatneously From 9 and 12M HNO3by 0.2M TLA
HNO3 Distribution Ratio Determined:-
Individually
Ag(1)
0.120.21
Simultaneously
Se(2)
0.0040.006
Ag
0.18
Se
o.oo4o0.0057
In all other cases it appears that the method failedpartly because of the low distribution ratios involved,leading to statistical counting errors in determining theorganic phase activity, and partly because of the limitedrange of phase ratios employed. This is illustrated inTable 3, where the expected distribution ratio is calculatedfrom the distribution ratios of the metals determined
AminConcM
0.1
A/0
42
1
0.40.2
o.2
2
1
0.4
0.2
M
912

4
individually for a particular case. The low activity of theorganic phase makes precise calculation of distribution ratioimpossible, while the effect studied is, in this case, soslight that increasing the phase ratio by a factor of 400only brings about a change of 3% in the distribution ratio,
Table 3Calculation of Overall Distribution Ratio for the SimultaneousExtraction of Ag (D 0.006) and Se (D 0.0015) From 3M HNO3by 0.lM Amine
Initial Activity of Each Metal in Aqueous Phase = 50,000 cpm/ml
Phase Ag Activity Se Activity Total ActivityRatio cpm/ml cpm/ml cpm/ml D
A/0 A 0 A 0 A 0 O/A
20 49985 300 49996 75 99981 375 .0037515 49940 300 49985 75 99925 375 .0037531 49701 298 49925 75 99626 373 .003744
0.2 48543 291 49627 74 98170 365 .003718
0.05 44642 268 48543 73 93185 341 .003659
Similar calculations indicate that the ratio between thetwo distribution coefficients should be greater than 10, toobtain meaningful results. At less than this, the variationin distribution coefficient with phase ratio will be slightover any reasonable range of phase ratios, artic larly inthe lower region of distribution ratios (10- - 1;e). Unsuc-cessful attempts were made to demonstrate this analytically-the expression for D/ T, the partial of the distributionratio with respect to the phase ratio, did not reduce to anyreadily comprehensible form in Pl and P2, the individual dis-tribution ratios of the two species concerned.
In conclusion, the suggested method for the simultaneousdetermination -ofditribton coefficients is capable ofgiving reasonably good results provided certain tlimitationsare fulfilled. It is simple and rapid and as such wouldseem to lend itself to simultaneous determinations in, forinstance, activation analysis. The limitations are as yet notcompletely explored, but numerical calculations of a fewtest cases will show whether the limitations may apply to theparticular case under consideration.

5
3.0 Nitrosylruthenium Complexes
3.1 Introduction
Previous studies (1), (3) attempted to determine therates of hydrolysis of the two extractable nitrosylrutheniumnitrato complexes. It was pointed out (1) that the increasein distribution ratio with contact time was larger than couldbe accounted for on a basis of rates of nitration to extrac-table complexes in the aqueous phase. The experiments on therates of hydrolysis were therefore extended, and attemptswere made to study the effect of increasing contact time onthe apparent mole fractions and to determine rates of nitra-tion in the aqueous and organic phases. It should be stressedthat these experiments were of a scouting nature; neitherexperiments nor analyses were duplicated. However, while toomuch emphasis should not be placed upon quantitative aspectsof the results, the qualitative aspects are probably correct.
3.2 Ruthenium Analysis
In order to speed up the determination of distributionratios, a direct colorimetric method for the determinationof ruthenium in the organic phase suggested by Vaughen (4)was studied. The color of the organic phase containing ruth-enium was measured at 490 m. in 1 cm cells between 1/2 and 1hour after extraction. The ruthenium content of the organicphase was then determined by KOH fusion (1). The resultingcalibration curve is shown in Figure 1. While the curve isnon-linear, the method is apparently of the same order ofprecision as the fusion method.
3.3 Rates of Hydrolysis and the Effect of Contact Time
3.31 Experimental
Aged solutions of RuNO in ll.5M HN0 3 were rapidly dilutedto 3.OM HNO3 and mixed in a centrifuge tube. A known volumeof pre-equilibrated tri-n-dodecyl amine (TLA) in toluene wascarefully introduced above the aqueous layer. At a known time(the "delay" time) after the mid-point of the dilution, theextraction was performed by hand-shaking- 1or a known time(the "mixing" time). The phases were centrifuged and separatedas rapidly as possible, and the color of the organic phasewas determined against an amine nitrate blank 1/2 hour afterthe start of contact. The ruthenium content of the initialaqueous phase was determined by the fusion method, so thatthe content of the equilibrium aqueous phase could be cal-culated assuming a perfect mass balance. Check samples ofvarious equilibrium aqueous phases showed that this assump-tion was essentially valid.
I I - - 1 111 W.WdbWWUim

6
1.6
1.5
1.4
1.3
1.2
1.1
1.0
0.9
0.8-
0.7
0.6-
0.5 -1,
0.4- +x
0.3 -+
0.2 -
0.1
0 .00 2 .004 .006
FIGURE I COLOR OF AMINE SOLUT(AMINE BLANK) IN I CMCONTENT OF SOLUTION
.008 .010 .012 .014 .016RUORG M
IONS OF RuNO AT 490 mpCELLS VS RUTHENIUM
I-zLu0
0j
0
rnm

7
3.32 Results and Discussion
The results are summarized in Table 4. PARTIFRAC analy-ses (1) of these results gave the mole fractions of the twospecies involved, as shown in Figure 2.
Table 4
Variation of Distribution Ratio of RuNO Nitrato Complexes Agedin 11.5M HN03, Rapidly Diluted to 3.OM HNO3 and Extracted into
0.26ff TLA in Toluene at Varying Phiase Ratios, Delay andMixing Times
Mixing DelayTime Time
Secs. Secs.
30 3090.
300600
900
90
180
3090
300600900
90
300600
Distribution Ratio,
.25:098.o68.027.023.021
.115.089.046
.036
.029
.116
.072
.059
.5.146.107.041
.033
.029
.165
.117
.o63
.047
.036
.150.105.085
0/A, at Given Phase Ratio,
1
.215
.146
.057
.045
.036
.230.160.083.065
.045
.209
.120
.098
2
.290
.194
.077
.059
.047
.314
.214
.106
.085.056
.263
.137
.112
4
.380
.252
.105
.077
.059
.410
.275
.134
.105
.o68
.315
.197.140
Study of Figure 2 shows that the apparent mole fraction ofthe more extractable species, X2 , is constant with mixing timefor a given delay time, whereas the apparent mole fraction ofthe less extractable increases markedly.
From previous results, and from the results given insection 3.5 below, the value of X2 in equilibrium in 3.OM HNOis X 0.0095. If it is assumed that the species is hydrolyzeaccording to first order kinetics, then a plot of log (X2 - X )vs t should be linear, and the slope should yield the rateconstant for the hydrolysis reaction. Such a plot is shownin Figure 3. The slope of the best straight line throughthe points is -1.0/900 per sec., which gives a value of
A/0
I

- I I I I I I I I I i1.0
0.10
X2
4 x
4:
180 SECS90 SECS30 SECS30 SECSPREVIOUS
SHAKINGSHAKINGSHAKINGSHAKI NG,
RESULTS (1)
- -I I I _ I I I I I I I I200
DELAY TIME400
(1/2 POINTOF SHAKI
600 800OF ADDITION TONG) SECS -+
FIGURE 2 RAPID DILUTION FROM 11.5 M TO 3MHNO 3 , DELAY FOR THE GIVEN TIME,
AND EXTRACTION FOR THE GIVENTIME BY O.26M TLA
8
oX, @ 180 SEC0--
X
X @ 90 SECx x
X @30 SEC+
*\
X
x
0
x+h
0.01
0.0011000
START
U
................. "I'l""I'll""I'll'll" "I'll""I -,'I'll, "I'll", "I & " '1111111111111"I'll"ll I I",',,',',,"",',, "I'll ."I'll I

9
-0.8
- 1.0
x+-1.2
-1.4 +
0
-1.8
'~o N
-2.0 I0 200 400 600 800 1000
DELAY TIME, SECS--+
FIGURE 3 SEMILOG PLOT OF MOLE FRACTION DIFFERENCEAGAINST TIME, FOR SLOPE ANALYSIS TODETERMINE THE RATE OF HYDROLYSIS

10
k2 = 2.303/900 per sec., or k2 = 0.15 per min. The previousreport (1) gave a preliminary value of 0.20 per min.
However, it was previously (1) pointed out that there isa discrepancy between these resulfs and the results for theoverall hydrolysis of all the anionic species. It will benoted in Figure 3 that a smooth curve may be drawn throughthe points. This was initially ignored, but experiments atlonger delay times (see below, section 3.5 ) confirmed thatthis curvature persisted. Secondly, a few careful experimentson the extraction of RuNO aged in 3.OM HNO showed thestriking temperature dependance of thi dis ribution, as indi-cated in Table 5.
Table 5Dependance of Distribution Ratio on Room Temperature
RuNO Complexes Aged in 3.OM HIN0 3 Extractedby 0.26M TLA Nitrate at 2:1 Phise Ratio for 30 Sec.
Temperature Distribution Ratio
OF O/A
81 0.0161
74 0.0179, 0.018373 0.0181, 0.0183, 0.0184
72 0.0185, 0.0190
71 0.0192
69 0.0192
It is important to consider such an effect, since whenll.5M HNO3 is diluted to 3M HNO3, there is a temperature riseof approximately 300F. ThTs wil be important at shorterdelay times, and may explain some of the observed curvature.
Finally it proved difficult to determine a rate of hy-drolysis for the less extractable species, Xl.
Attempts were made to solve by tri&l and error sets ofequations of the type
(X - X*) = (XO - X*) e-kit + k2 (Xo - Xl)(eklt _ e-k2t)
which governs the first order decay of species 1 when it isbgth gresgnt 8nd formed by the decay of species 2 (1). Xi,X1, X., X2, X2 and k2 could be estimated from experimental

11
results, but in all cases no single value of k2 could befound which would fit the data within reasonable limits.
The increase in the mole fraction of species 1 with con-tact time requires elucidation. It seemed possible that therate of extraction of this species might be low which wouldbe in agreement with the previous suggestion (1) that thespecies might be polynuclear. This seems unliRely, however,as the measured partition coefficient of this species did notincrease markedly with increasing contact time, and sincethe results at, say, 90 seconds' delay time and 180 seconds'mixing time would indicate that over 70% of the rutheniumoriginally present was in an extractable state. What seemsmore likely is that some conversion of the species 1 may takeplace, to "fix" it in the organic phase and thus raise theapparent mole fraction. To test this, back extraction experi-ments were performed.
3.4 Back Extraction Experiments
It was the aim of these experiments to attempt to observeconversion taking place in the organic phase with increasingtime of, or after, extraction. Ruthenium was therefore ex-tracted under standard conditions. Aged solutions of RuNO inll.5M HNO3 were rapidly diluted to 3.OM HNO3 , and after 30secs. delay time extracted for 90 secs. at 0.5 A/0 phase ratioby 0.26M TLA nitrate.
After extraction the separated organic phase was agedfor a known time (the "back delay" time, defined from the mid-point of the forward extraction to the start of the backextraction) and back extracted to 3.0M HN03 at various phaseratios for a given mixing time (the "Sack mixing time").By measuring the ruthenium concentration in the organic phasebefore and after back extraction, the back distribution coef-ficient, A/0, could be determined, and by defining the phaseratio as 0/A, the results could be submitted for PARTIFRACanalysis directly.
The results are shown in Table 6, and the mole fractionsdetermined by analysis of these results are shown in Figure 4.
The data at 30 and 90 seconds.' back mixing time, as analyzedin Figure 4, clearly show that in fact conversion is takingplace. Between 120 and 500 seconds'delay, X10, the mole frac-tion of species 1 in the organic phase, decrease from 0.19to 0.12, while X20 increased from 0.47 to 0.53, i.e., thedecrease in species 1 is balanced by the increase in species2. It is also evident that there is a rate of mass transfereffect-since all the ruthenium is in the organic phase, itmust all be "extractable," and the mole fractions shouldtotal 1.0. In fact, at 30 secs.' mixing time, only 75% of

0
X20x
+X
+1
t0
0
wU)
z
0
z
ww(-cl)
LjL0
(I)
0
C-
w-J0
200 400 600 800 1000
AGE OF ORGANIC PHASE, FROMFORWARD TO START OF BACK
MIDPOINT OFEXTCN. (SECS.)
FIGURE 4 BACK EXTRACTION; RADID DILUTION FROMII TO 3M HNO 3 , 30 SEC DELAY, EXTRACTIONAT 2 A/O PHASE RATIO FOR 90 SEC; DELAYFOR GIVEN TIME 8 BACK EXTRACTION FORGIVEN TIME
1.0
12
0.1
0.01
+ 30 SEC BACK EXTRACTIONx 90 SEC BACK EXTRACTIONo 120 SEC BACK EXTRACTION& CALCULATED FOR ZERO TIME
7 I I I I I I I

13
Table 6Variation of Back Distribution Ratio with Varying Back Delayand Back Mixing Time as a Function of the Back Phase Ratio
Back BackMixing DelayTime Time Back Distribution Ratio (A/0)
Secs. Secs. At Phase Ratio (0/A) .25 .5 1 2 4
30 120 .140 .190 .263 .338 .442
250 .132 .180 .231 .305 .378500 .140 .178 .232 .278 .328
90 250 .209 .282 .382 .522 .647
500 .212 .291 .383 .496 .565120 250 .216 .288 .379 .527 .649
the ruthenium is equilibrated. By90 secs. mixing time, thishas risen to 93A and by 120 secs. to 99%.
3.5 Attempts to Determine the Rate of Nitration
On a basis of the time for spectra of solutions ofnitrosylruthenium hydroxide dissolved in nitric acid, toreach equilibrium, Skavdahl had suggested (3) that the rateof formation of extractable complexes, i.e., the rate ofnitration, is very slow. As pointed -out above (sectionand (1)), this is at variance with the results on the increaseof exTraction with increased mixing time. Part of this in-crease is already explained by the effects of rate-of-extrac-tion and conversion in the organic phase, but it seemed de-sirable to check the rates of nitration.
"Trinitrato nitrosylruthenium," RuNO(NO3 ) was preparedaccording to the method of Fletcher (5) The material wasdissolved in 3M nitric acid, and after aging for a knownperiod, samples of the solution were extracted at variousphase ratios by 0.26M TLA nitrate in toluene. The experi-ments were performed in an air conditioned laboratory toavoid temperature effects as noted above, and the ambienttemperature was constant at 730F + 10. The results are givenin Table 7, and the PARTIFRAC analysis is summarized inFigure 5.
It was somewhat surprising to observe during the courseof the experiments an obvious decrease with time in the amountof ruthenium in the organic phase where an increase due tothe formation of extractable species had been expected. Theanalysis shown in Figure 5 makes it clear that the moreextractable species, species 2, was present in significant

14
1.0
.10
.01
.00I8 16 24 32 40
TIME SINCE DILUTION,
FIGURE 5
48 --- 100HOURS
MOLE FRACTIONS OF EXTRACTABLE SPECIESFOR " RuNO(NO 3 )3 " DISSOLVED IN 3M HNO 3 ANDEXTRACTED BY O.26M AMINE AT 73±11 ATGIVEN TIMES AFTER DILUTION
x X 2
x

15
Table 7Extraction of Freshly Dissolved RuNo(NOg) in 3M HNO3 atIncreasing Time After Solution, by 0.26M LA Nitrate in
Toluene at Varying Phase Ratios and with 30 Sec. Mixing Time
Time AfterSolution Distribution Ratio (o/A) at
hrs. Phase Ratio (A/0) of O,.25 0.5 1 2 40.167 .0246 .0390 .0649 .0957 .13150.534 .0165 .0234 .0319 .0411 .05511.0111 .0146 .0212 .0263 .0369
2 .0097 .0125 .0172 .0222 .029514.3 .0084 .0112 .0161 .0189 .0258
23.5 .0084 .0108 .0140 ,0178 .0241
46.5 .0084 .0111 .0140 .0187 .0237109 .0083 .0111 .0140 .0185 .0245
quantities in the preparation, and that there was probablyalso some of species 1. The starting material was certainlynot, therefore, pure tri-nitrato nitrosylruthenium.
It seemed possible that all the nitric acid had not beenremoved from the preparation, even after standing over KOHpellets for 1 month. Fresh material was therefore preparedin which every attempt was made to remove excess nitric acid.The nitric acid solution of the RuNO complexes was distilledunder vacuum and in a nitrogen atmosphere. Once most of thenitric acid had been removed, a slow stream of distilled waterwas introduced into the distillation flask, which distilledcarrying off, it was hoped, the last traces of nitric acid.After several hours, the pH of the distillate actually dis-tilling over had risen to pH 6.7. Water addition was stopped,and the distillation temperature slowly raised to 430C,when ruthenium complexes suddenly commenced to distill over,as evidence by the appearance of purple-red droplets at thelower end. of the condenser. The distillation was immediatelystopped, and the residue was stored over KOH pellets for twoweeks in a vacuum dessicator. Before use, a sample wasanalyzed for the N0 to Ru ratio; the ratio found was 3.03to 1, and it was assumed that the material produced was indeedthe tri-nitrato nitrosylruthenium. The experiment describedabove was therefore repeated. The results are not given asin all essential respects they are identical with those inTable 7.
It thus appears impossible by this means to study therate of formation of extractable species. However, the decay
..................................... .........................
curves shown in Figure 5 lend themselves to analysis for therates of hydration of the extractable species, though it isnecessary to make assumptions as to the mole fractions presentat zero time. However, by extrapolation X10t 0.01 and X200. 20while k2,z0.15 per minute as shown previously. By trial anderror, kiZ0.01 per minute.
One phenomenon of nite is the apparent curvature of asemi-log plot of (X2 - X2 ) against time, as shown in Figure 6.This is in the same direction as the plot in Figure 3, and doesnot seem likely to be due to temperature effects. It mayindicate the presence of a third extractable species which ishydrolyzed somewhat faster than the second species.
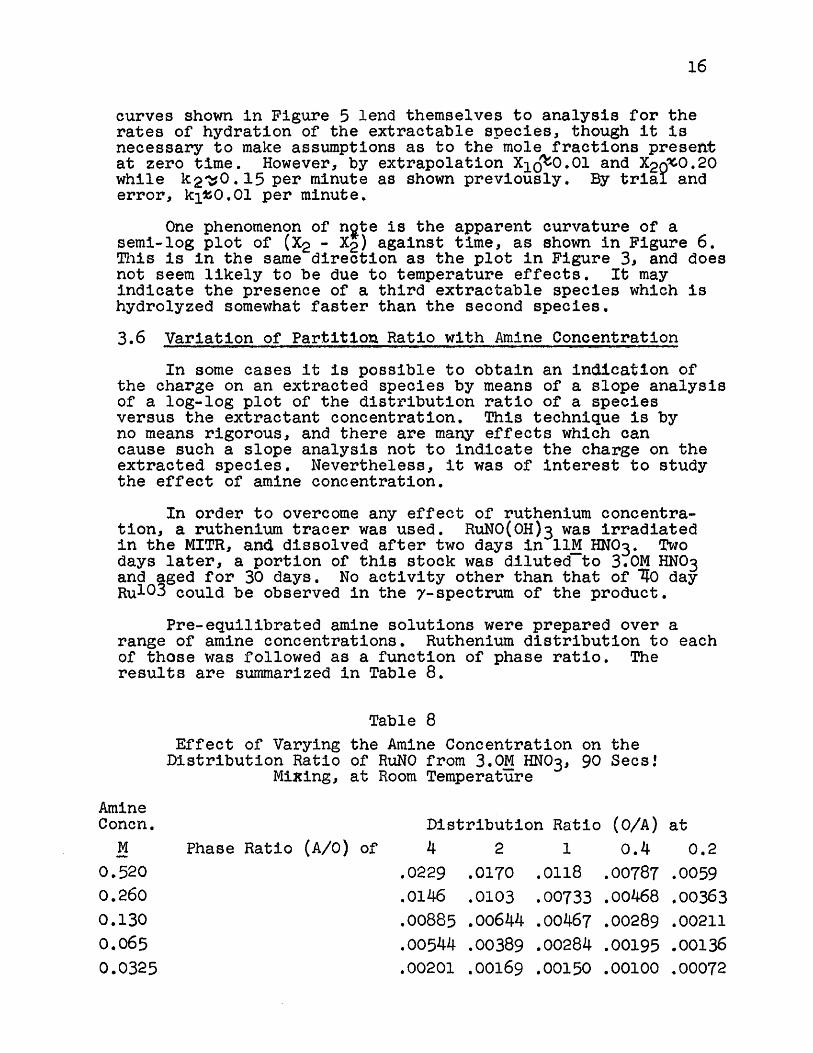
3.6 Variation of Partition Ratio with Amine Concentration
In some cases it is possible to obtain an indication ofthe charge on an extracted species by means of a slope analysisof a log-log plot of the distribution ratio of a speciesversus the extractant concentration. This technique is byno means rigorous, and there are many effects which cancause such a slope analysis not to indicate the charge on theextracted species. Nevertheless, it was of interest to studythe effect of amine concentration.
In order to overcome any effect of ruthenium concentra-tion, a ruthenium tracer was used. RuNO(OH)3 was irradiatedin the MITR, and dissolved after two days in llM HNO3. Twodays later, a portion of this stock was diluted to 3.OM HNO3and aged for 30 days. No activity other than that of 740 dayRul0 3 could be observed in the 7-spectrum of the product.
Pre-equilibrated amine solutions were prepared over arange of amine concentrations. Ruthenium distribution to eachof those was followed as a function of phase ratio. Theresults are summarized in Table 8.
Table 8
Effect of Varying the Amine Concentration on theDistribution Ratio of RuNO from 3.OM HNO3, 90 Secs!
Mixing, at Room Temperature
AmineConen. Distribution Ratio (0/A) at
M Phase Ratio (A/0) of 4 2 1 0.4 0.2
0.520 .0229 .0170 .0118 .00787 .00590.260 .0146 .0103 .00733 .00468 .00363
0.130 .00885 .00644 .00467 .00289 .00211
0.065 .00544 .00389 .00284 .00195 .00136
.00201 .00169 .00150 .00100 .00072
.... ........ .. ........
Ion NO"MMI" M 17' T""t -
0.0325

17
I I I I 1 I I I -
+
0 10 20 30 40 50 60 70 80 90 10011O 120 130TIME, MINUTES -
FIGURE 6 VARIATION OF MOLE FRACTION OF SPECIES2 WITH TIME
1.0
.01x
0zir_
U-
z0
U-
LU
001
1k
I I I I 1 .1 .1 1. 1 1 1 1 1
_ __ _ -"" '' - I., I I I ._1_-_11____- I... -_ _ .......... ....

Comparison of the results for 0.26M amine with theresults of Table 7 for 23.5-109 hours"aging indicates thatthe results here are too low by a factor of roughly 2. Thismay be due to some of the activity in the aqueous phase notbeing present as RuNO complexes, as had been assumed.
It was not therefore surprising, on the submitting theresults to PARTIFRAC analysis, to find that the output didnot make much sense. This is indicated in Table 9, wherethe best values of the partition ratio mole fractions of thevarious species are listed.
Table 9
Partition Ratio and Mole Fractions CalculatedFrom the Data of Table 8
AmineConcn. Partition Ratio Mole Fraction
M P1 P20.52 0.048 4.8 0.113 0.0080,26 0.030 $.2 0.099 0.005
0.13 0.025 3.0 0.058 0.004
0.065 0.010 2.4 0.072 0.003
0.0325 0.006 0.7 0.045 0.003
There is certainly a trend towards decreasing values ofPl and P2 with decreasing amine concentration, but the cal-culated mole fractions should not vary with amine concentra-tion, but should be constant at the equilibrium values for3.OM HNO3 shown in Figure 5. The fact that the mole fractionsare, in all cases, considerably lower than the equilibriumvalues would indicate that assumption that some of the ruthe-nium is not present as nitrosylruthenium complexes is valid.
3.7 Conclusions
The technique of following the variation of distributionratio with changing phase ratio in order to determine the molefractions of extractable species present, has been adoptedfor the study of various phenomena involving nitrosylrutheniumnitrato complexes. An estimate has been made of the ratesof hydrolysis of the extractable species, ki%0.01 per min. andk2to.15 per min., where ki and k2 refer to the less and moreextractable species, respectively.
A resistance to transfer of the less extractable speciesof ruthenium in the reverse direction has been observed.Conversion of this species to the more extractable speciestakes place in the organic phase on standing. In forward
18

19
extraction, increasing the time of shaking increases theapparent amount of less extractable species in the aqueousphase. This is probably due both to conversion in the organicphase and to a rate of mass transfer effect, though the possi-bility of formation of this complex from lower species shouldnot be overlooked. This seems somewhat unlikely, however,in view of the generally relatively slow rates of nitrationof lower to higher species observed by Scargill and others(6), an observation in accord with Skavdahl's previous sug-gestion (3). It is unfortunate that the rate of conversionstudies could not be carried out to equilibrium. However,assuming that at equilibrium at least 90% of the less ex-tractable species 1 is converted to species 2, then the datashown in Figure 4 correspond to a rate constant for thereaction lorg-9 2 org of ki0.075 per min.
It was shown that the supposed "RuNO(NO3)3" was a mix-ture of nitrosylruthenium nitrato complexes. Unsuccessfulattempts were made to produce the pure trinitrato nitrosylru-thenium. This raises the question of the exact nature ofthe complexes. van Raaphorst (7) reports that roughly 10%of the RuNO is in higher complexes than dinitrato in 3M HNO3,and 70% in 11M HNO3 . Fletcher (8) reached essentiallyfsimilarconclusions but mistakenly identified these species as beinghigher than trinitrato. Later work (6) has suggested thatthese higher than dinitrato species may also be split intotwo groups, a trinitrato group, 12% in 3M and 55 in 11M, anda tetranitrato group, 1% in 3M and 35% ii 11. Species~1in this study is 13% in 3M and 45-560% in 1114, while species2 is 0.095% in 3M and 16% in llM HNOq3 . The correspondencebetween these figures and those of Scargill (6) would seem toindicate that species 1 is the trinitrato and species 2 thetetranitrato complexes. However, if species 1 is the tri-nitrato complex, it is most surprising that this particularspecies should build up rapidly in 3M HNO3 on dissolving amaterial purporting to be trinitrato nitrosylruthenium.
This is the main anomaly in the picture of the extractionof nitrosylruthenium nitrato complexes by alkyl amines whichis beginning to emerge. The trinitrato complex (species 1)is probably extracted by
RuNO(NO3 ) 2H2 0 + R3 HNO 3 :: R3NHI. RuNO(N0 3 )4 . H20 + H2 0
The organic phase complex is then converted by reaction withmore amine.
R3NH. RuNO(NO3 )4.H2 0 + R3NHNO03 .-..(R3NH)2 RuNO(NO3 )5 + H20
This reaction takes place slowly in the organic phase.It is suggested that the water released by this reaction iscapable of removing some of the unbound nitric acid present,thus leading to the apparently low values for unbound nitricacid determined conductumetrically (1), and the apparentlyhigh nitrate-to-ruthenium ratio observed (1) for this species.
------------------

20
The tetranitrato species (species 2) is probably extractedby
[RuNO(NO3 )4 H2 0] + 2R3NHN03 ,;::(R3NH)2RuNO(NO3)5 + NO3 + H20
thus giving the same species in the organic phase as theextracted trinitrato complex, after conversion, and explainingwhy after 1/2 hour the spectrum of the organic phase becomesindependant of the species involved.
It is also possible that trace quantities of the penta-nitrato species may be present. The above equations suggestthat the nitrosylruthenium in the organic phase has all fiveavailable coordination sites filled with nitrate ions, andthere seems to be no particular reason why the same may notbe true in the aqueous phase, though as proposed earlier(6, 7) the coordination opposite the nitrosyl group may beweak. There was some evidence (see Figures 3 and 6) that asecond species was present with species 2. In fact the hydroly-sis rate determined in Figure 3 is somewhat higher than thatcorresponding to the data of Figure 6; in Figure 3, hydrolysiaof species present in llM HNO is taking place, and in Figure6, hydrolysis of speciesin 3M HNO is taking place, and moreof the pentanitrato species would 5e expected to be presentin the llM acid solution. The weakness of coordination oppo-site the nEitrosyl group may imply that primary extraction ofthe trinitratoconiex takes place by replacement of the waterin this position by an amine nitrate, and that the water dis-placed in the conversion reaction is that present in planarposition 5.
............................. ..........

21
5.0 References
(1) P. J. Lloyd and E. A. Mason, Progress Report XIII,MITNE-50 (1964).
(2) P. J. Lloyd and E. A. Mason, Progress Report XII,MITNE-43 (1963), J. B. Goodblatt, M.S. Thesis, Depart-ment of Nuclear Engineering, M.I.T., February 1964.
(3) R. E. Skavdahl and E. A. Mason, MITNE-20 (1962).
(4) V. C. A. Vaughen and E. A. Mason, TID-12665 (1960).
(5) J. M. Fletcher, et.al., J. Inorg. Nucl. Chem. 1, 378(1955).
(6) D. Scargill, C. E. Lyon, N. R. Large and J. M. Fletcher,"Nitrato Aquo Complexes of Nitrosylruthenium III,"Personal Communication, June, 1964.
(7) J. G. van Raaphorst and P. A. Deurloo, KR-52 (1963).
(8) J. M. Fletcher, et.al., J. Inorg. Nucl. Chem. 12, 154(1959).